
Abstract
For assessment of existing bridges, load rating is usually performed to assess the capacity against vehicular loading. Codified load rating can be conservative if the rating is not coupled with the field data or if simplifications are incorporated into assessment. Recent changes made to the Australian Bridge assessment code (AS 5100.7) distinguish the difference between design and assessment requirements, and include addition of structural health monitoring for bridge assessment. However, very limited guidelines are provided regarding higher order assessment levels, where more refined approaches are required to optimize the accuracy of the assessment procedure. This article proposes a multi-tier assessment procedure for capacity estimation of existing bridges using a combination of structural health monitoring techniques, advanced nonlinear analysis, and probabilistic approaches to effectively address the safety issues on aging bridges. Assessment of a Box Girder bridge was carried out according to the proposed multi-tier assessment, using data obtained from modal and destructive testing. Results of analysis at different assessment tiers showed that both load-carrying capacity and safety index of the bridge vary significantly if current bridge information is used instead of as-designed bridge information. Findings emerged from this study demonstrated that accuracy of bridge assessment is significantly improved when structural health monitoring techniques along with reliability approaches and nonlinear finite element analysis are incorporated, which will have important implications that are relevant to both practitioners and asset managers.
Keywords
Introduction
Bridges are essential components of a road network that facilitate social connection and economic growth. In Australia, also known as “the Island Continent,” ground transportation is the major means of freight movement across states. More than 80% of the existing bridges are designed as per old design codes, while bridge codes in Australia have undergone major changes over the last three decades. 1 Recent version of the Australian Bridge Code (AS 5100.7) recognizes the disparities between bridge design requirements and assessment philosophy, with two added sections for bridge rehabilitation and timber bridges to address the sustainability concerns. 2
In addition to the traditional vehicular loading test for bridge assessment, a section is added to assess the bridges using structural health monitoring (SHM) techniques such as damage detection and assessment, ambient testing, and performance monitoring. However, the use of probabilistic models or reliability analysis is not addressed. Existing codified assessment procedure is deterministic in nature and only accounts for uncertainty in the assessment procedure by means of safety factors, for example, live load and material factors. On the other hand, probabilistic approaches quantitatively take into account the uncertainties associated with the assessment procedure ranging from field testing to load rating, in which the reliability of the assessment procedure is qualitatively assessed enabling more transparency in the results and improved access to the bridge network.3,4 In most of the international bridge codes, addition of real-life data into probabilistic approaches, for example, SHM data collected over long-term monitoring, enables continuous refinement of the assessment procedure with actual information representing the current condition of the bridge, also known as “as-is” bridge condition.5–7
Considering significant changes made to the Australian bridge code and existing old bridge network with increasing vehicular loadings, it is inevitable to have an accurate and well-defined assessment procedure for aging bridges. Although use of proof load testing and SHM are permitted by the revised code, no specific guidelines and details are provided on higher tiered assessment levels and their implementation. To address this issue, this article proposes a practical framework for holistic assessment of existing bridges by using higher tiered analysis and SHM techniques, and systematically evaluates its effectiveness for bridge capacity assessment. Also, a relationship between load rating and reliability index is developed, and the feasibility of a reliability-oriented assessment, which is not covered by the revised code, is critically investigated. A Box Girder bridge laboratory model is assessed for its ultimate load-carrying capacity (LCC) using the proposed multi-tier assessment procedure for validation and comparison with existing codified assessment methods. What follows are detailed components of the bridge assessment using the proposed multi-tier assessment framework commencing from pre-test preparation to post-test diagnosis, in order to provide a comprehensive procedure for real-life implication.
Multi-tier assessment procedure
The basic premise of load rating is that the minimum strength capacity of the bridge should be greater than the maximum load effects due to external loading. Rating is performed at critical components of the bridge for various capacity checks, for example, flexural capacity—with the lowest rating determined being the load rating factor of the whole bridge for the nominated rating vehicle.
Despite the importance of the probabilistic approaches for bridge assessment that have been adopted by other international bridge codes, no specific provision is available within the recent Australian bridge code as a means of refined analysis.7,8 For target level of safety, reference is made to AS/ISO 13822 9 and AS 5104, 10 which are reproduced as an extended version of the international standard ISO 2394. 11
In the reliability context, a limit state function (LSF) is defined as the boundary between safety and failure region. Considering the resistance of a bridge as R and the external loading as Q, the corresponding LSF is written as g = R – Q; so the probability of failure (Pf) is defined as R < Q, and the corresponding reliability index (β) is calculated as shown in equation (1)

In the above equation, Φ is the inverse of cumulative distribution function for the LSF under consideration. A structure is considered safe when g > 0, else it becomes unsafe. The extent to which reliability is incorporated into analysis is based on the degree of the probability involved, ranging from deterministic to fully probabilistic approaches. 12
First-order and second-order reliability methods are the simplest and most commonly used methods that apply the first two terms of Taylor series expansion to approximate the LSF.3,13 For large structures, LSF might not be linear and obtaining a closed-from solution is very cumbersome, if not impossible. In order to have an accurate procedure with reasonable computational time, Rackwitz–Fiessler procedure 14 and Markov chain Monte Carlo (MCMC) method 15 are adopted for this study. Rackwitz–Fiessler procedure is an iterative procedure that applies to linear and nonlinear LSF taking into account the distribution of random variables. This procedure is ideal for simple LSF as it requires very few iterations to reach convergence. On the other hand, MCMC is suitable for complex LSF involving nonlinear models, in which a closed-form solution can be estimated.
In probabilistic methods, each random variable is represented by its statistical parameters like coefficient of variation (CoV) and bias (i.e. ratio of mean to nominal value). These statistical parameters are representative of deterministic values that reflect the uncertainty inherited in each of the load and resistance parameters. Reliability of statistical parameters mainly depends on the sample size, that is, higher sampling rate covers more uncertainty range and thus results in more realistic statistical data. For all of the probabilistic analysis in this study, minimum of 6000 data samples are considered with 95% confidence interval.
Previous investigation of adopting US data for calibration of Australian code for concrete structures (AS 3600), which is a relatively similar standard to bridge design code (AS 5100.5), showed very identical results between statistical parameters of AS 3600 and ACI 318. 16 The variety of bridges considered in the literature for probabilistic modeling of the bridges was diverse enough to be assumed for other cases.
In this study, due to lack of complete statistical database for Australian bridges, LSF functions are formulated based on the statistical parameters as displayed in Table 1, which are the results of extensive investigations carried out collectively for calibration of American Association of State Highway and Transportation Officials (AASHTO) Load and Resistance Factor Design (LRFD) and American Concrete Institute (ACI). Other random variables developed for this study are applicable to the bridge under investigation. For correlation of the random variables to each other, depending on their relationship in the LSF, correlation coefficients (namely, linearly or nonlinearly correlated) are estimated. Similarly for other LSF such as Serviceability Limit State (SLS) assessment, random parameters and their corresponding statistical data and correlation can be defined.
Statistical parameters of random variables.
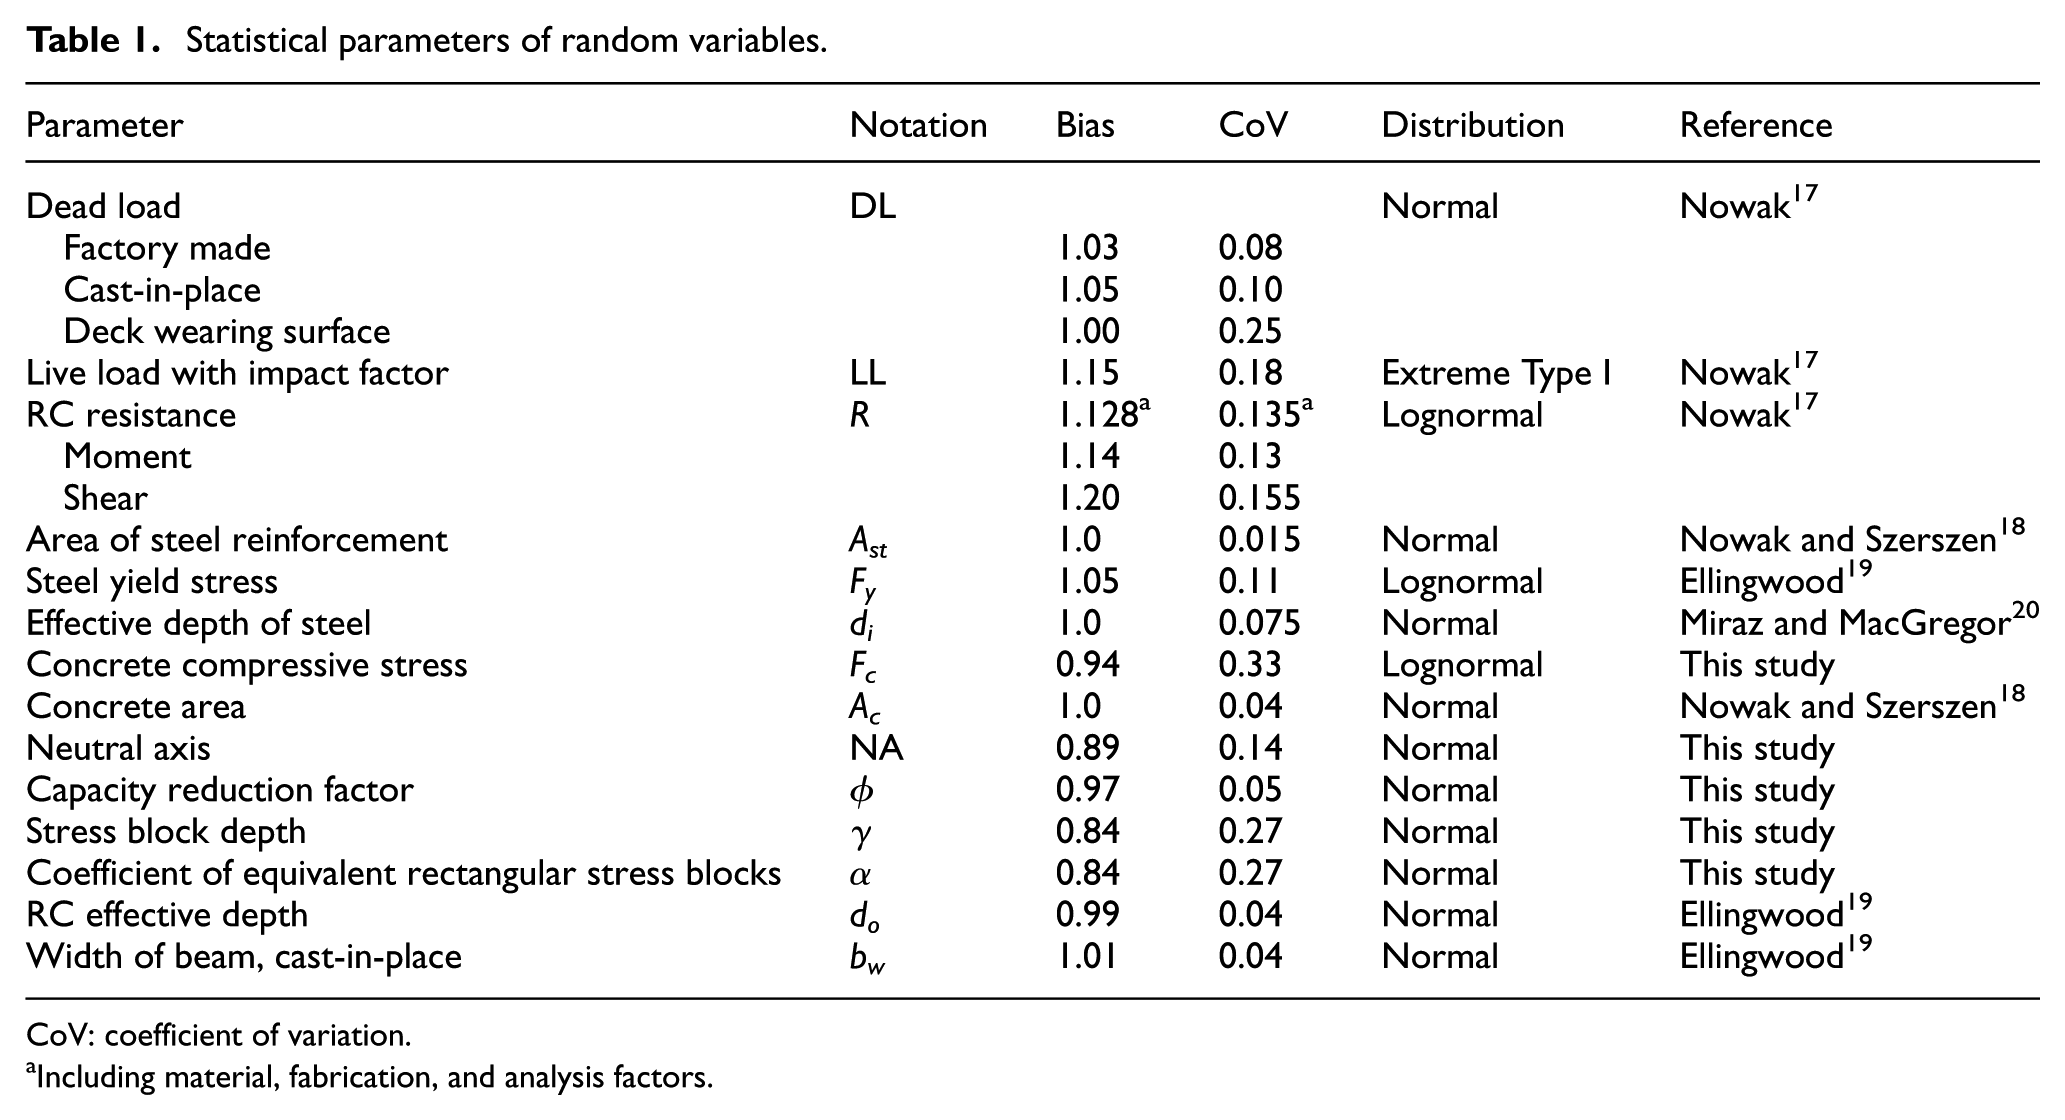
CoV: coefficient of variation.
aIncluding material, fabrication, and analysis factors.
Ultimate limit state (ULS) condition for bridge load rating is defined in equation (2), so the LSF can be stated as the condition when the capacity is lesser than the combination of other load effects.
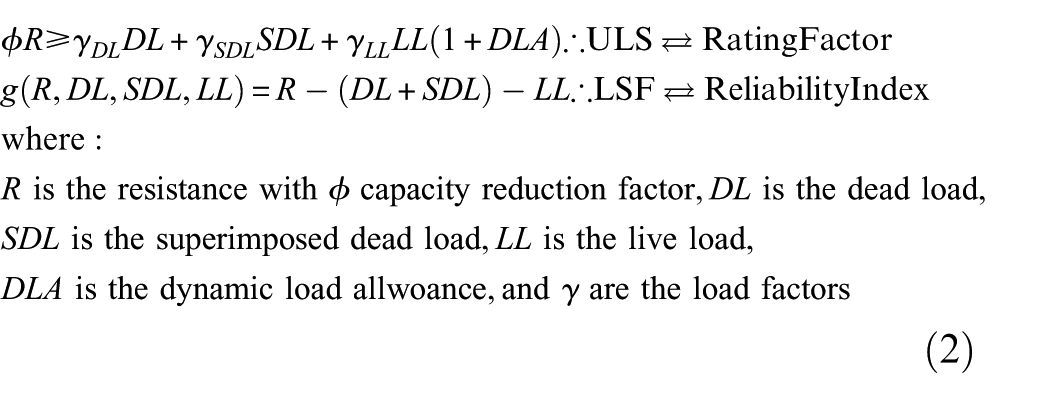
It can be stated from equation (2) that the reliability index can be expressed for various ULS conditions as required for rating factor, denoting that rating factor and reliability index are mutually related.
Visual inspection or proof load testing requires investment in terms of preparing the loading vehicle, personnel, traffic control, time management, and monetary issues. It is basically a trade-off between the quantity of information needed and the potential risk of damaging the bridge components during testing. By using SHM techniques and measuring the response of the bridge in-operation, numerical model of the bridge is updated to match the as-is condition of the bridge.
Therefore, a “virtual load test” can be conducted on the calibrated analytical model to estimate the ultimate LCC and gain more in-depth understanding of the bridge response and failure modes. As shown in Figure 1, structural and modal properties of the bridge are updated using in-service data obtained by SHM techniques, after which nonlinear material properties are defined. Vehicular loading, permit vehicle, or other types of live loadings can be defined as the failure live load, since live loading is considered as the most significant parameter affecting the bridge capacity. 21
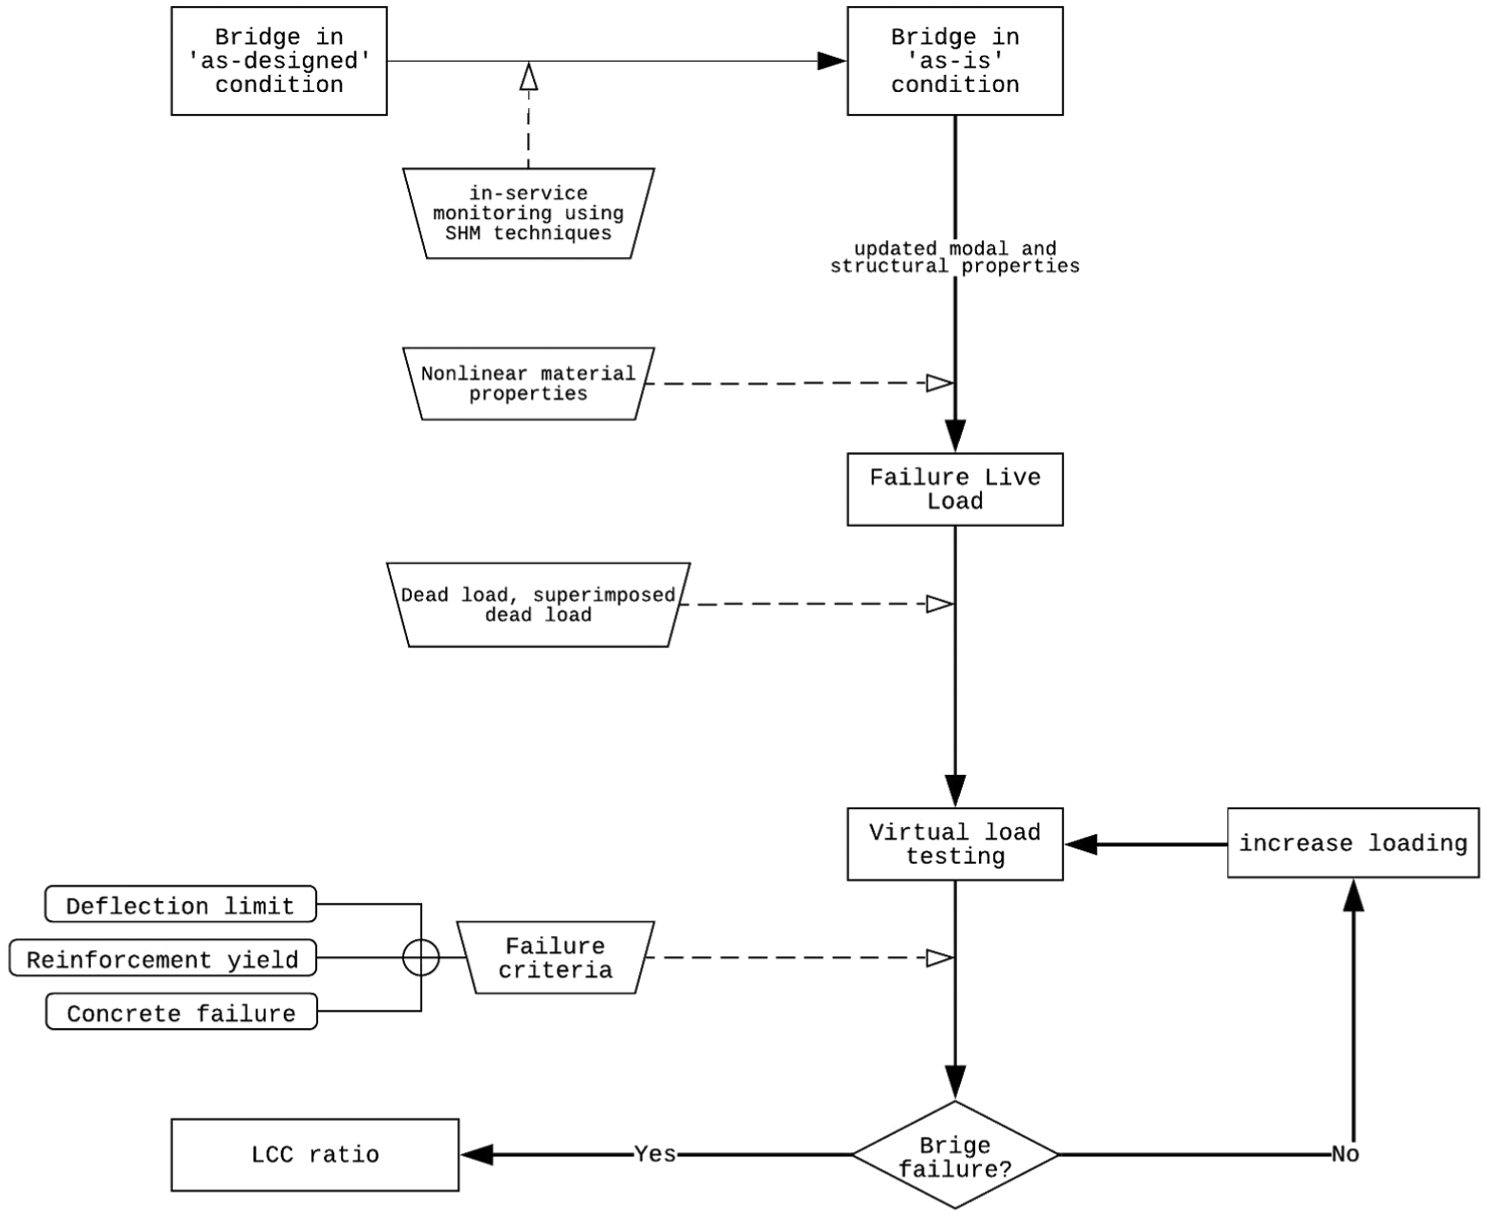
Process of LCC estimation.
The failure load is increased until the bridge fails under the defined failure criteria, such as deflection limit, yield of steel reinforcement, or concrete failure (tension or compression). Then, LCC ratio is determined in terms of ultimate failure load to the bridge permanent loads as shown in equation (3). Permanent bridge loads refer to the bridge mass and superimposed dead loads (if significant). Higher LCC ratio implies that higher loading is needed to reach the failure criteria

Estimated LCC in equation (3) is in fact the true ultimate LCC of a bridge for the specified failure load, using existing bridge condition, whereas rating factor is the LCC of the bridge considering all of the codified load factors, including Dynamic Load Allowance (DLA).
The proposed holistic multi-tier assessment procedure is illustrated in Figure 2. In this assessment procedure, as the accuracy of evaluation increases in higher tiered approaches, so does the cost and the safety of the structure. Safety refers to the degree of accuracy and reliability in the assessment, while cost refers to the fiscal policy, computational time, and workload. This multi-tier assessment procedure considers currently implemented methods for bridge LCC assessment in Australia, and proposes two additional assessment tiers, namely, Tier 3 for in-service assessment using SHM techniques, and Tier 4 for reliability analysis which is not covered by the bridge code.
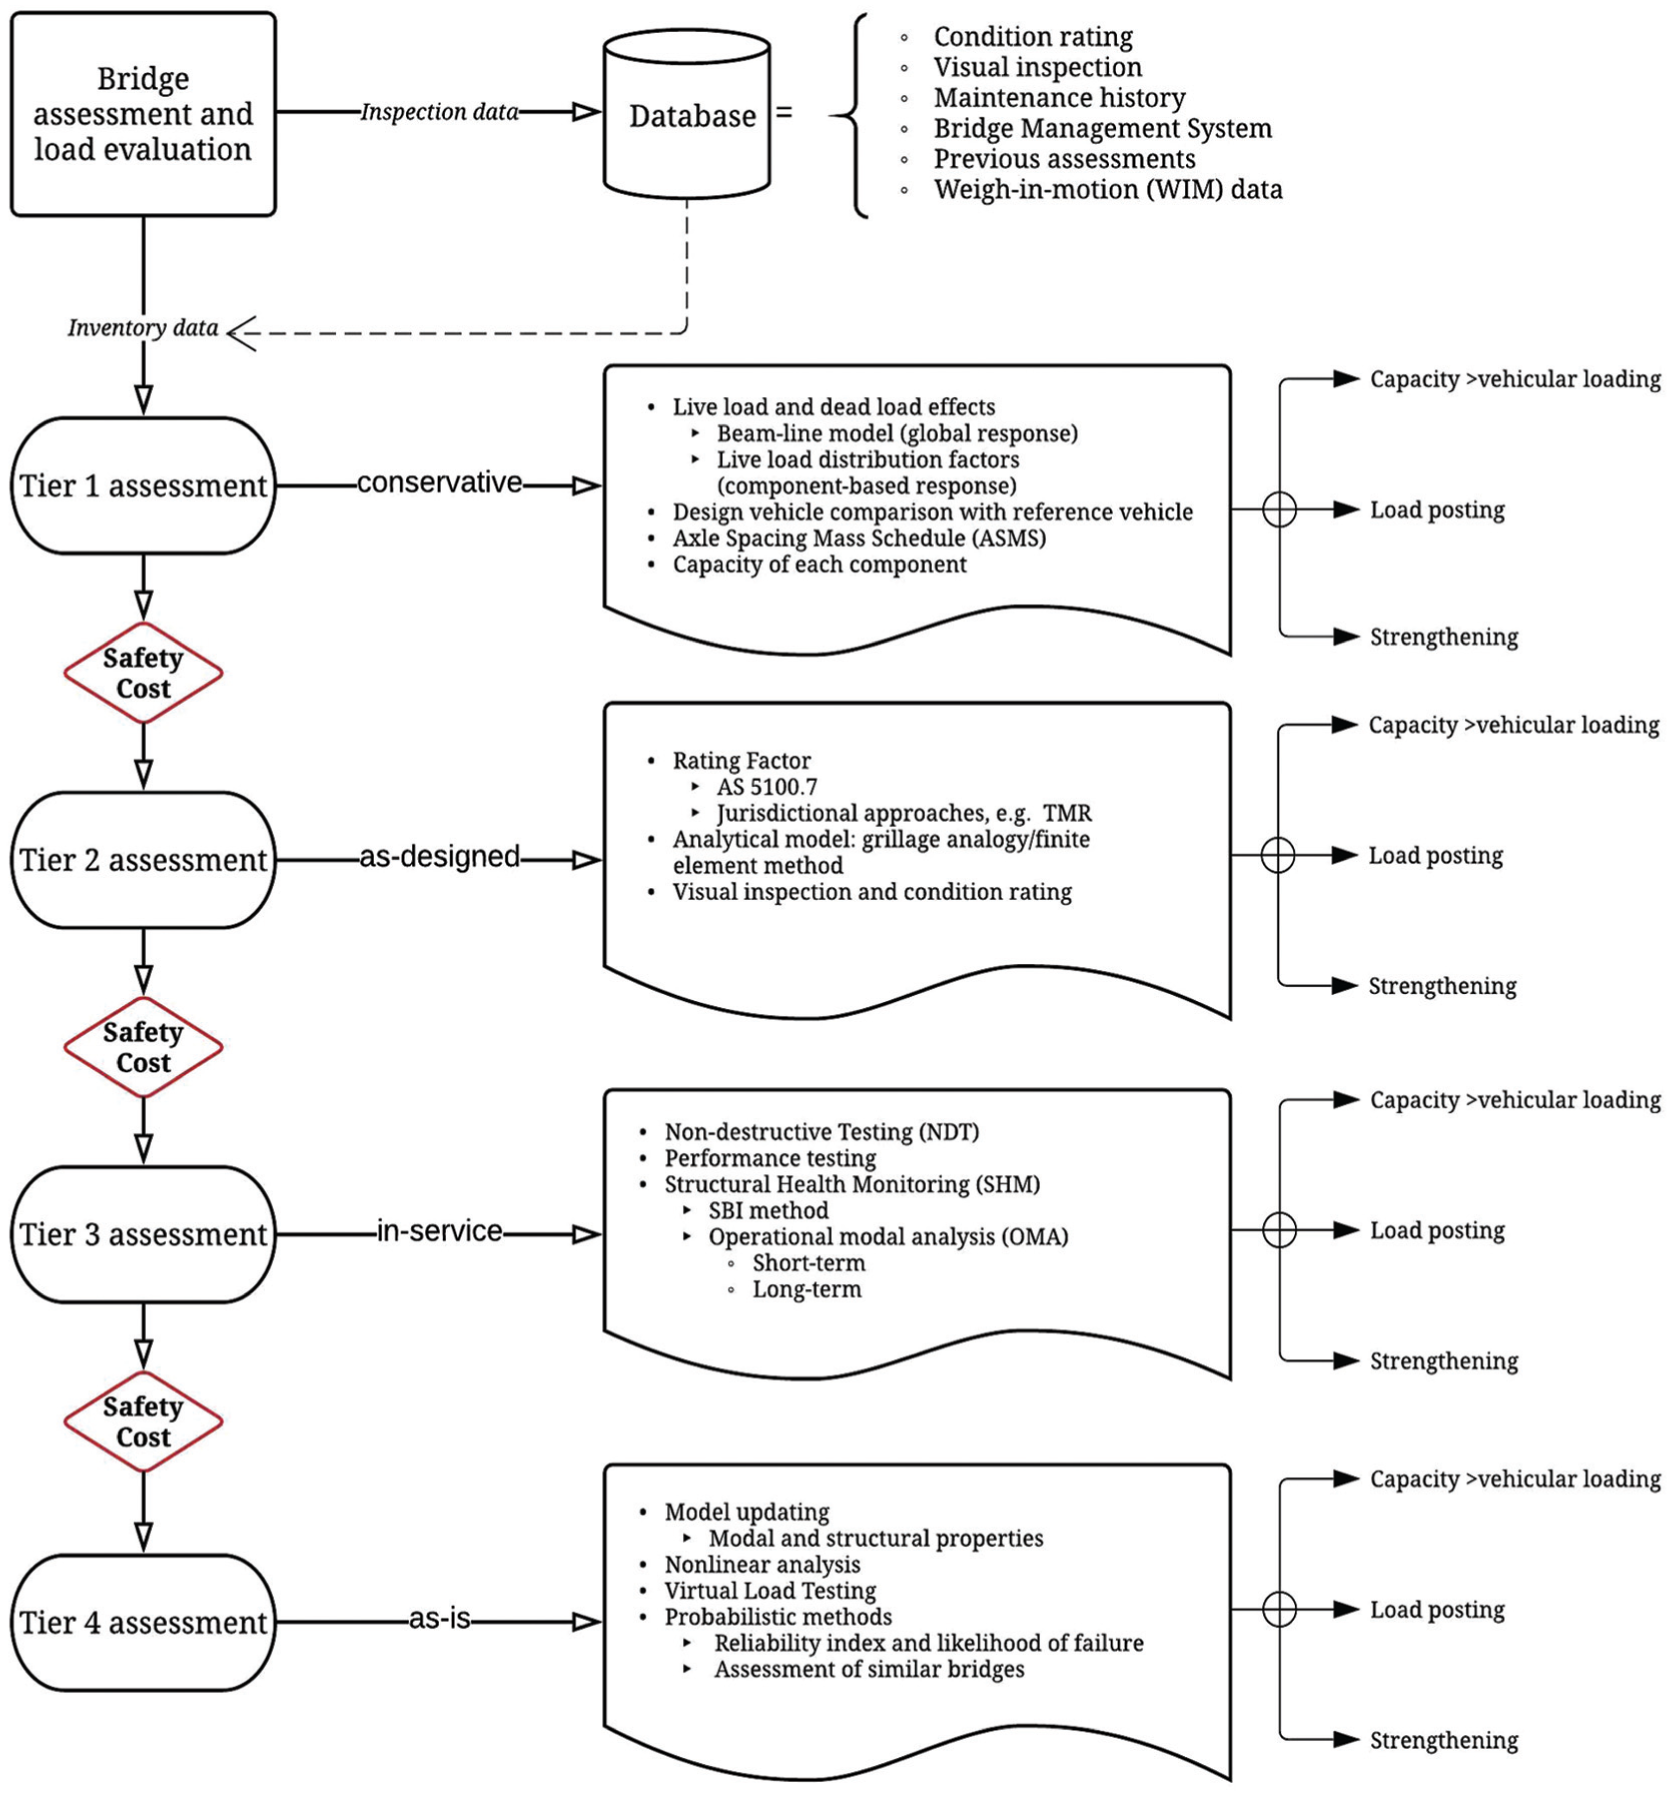
Multi-tier assessment procedure for the evaluation of existing bridges.
Tier 1 assessment is the most basic tier and usually serves as the first-pass check, which includes carrying out Axle Spacing Mass Schedule (ASMS) approach or simple beam-line analysis of the bridge compared against design loading with or without live load distribution factors.5,22 These approaches are considered as “one size fits all,” which means ratings will be very conservative. This tier determines if further assessment is required and whether or not the bridge has sufficient capacity for the nominated vehicular loading.
Tier 2 assessment is basically the codified approach, whereby as-built capacity is checked against existing design code and vehicular loading using linear analysis analytical model, namely, grillage model or finite element (FE) model. Most of the existing bridges in Australia are currently assessed in this tier, including jurisdictional approaches. Ratings are based on theoretical capacity using information from designed condition or previous assessment.
In Tier 3, the existing condition of the bridge is considered by collecting data from non-destructive testing or ambient vibration testing using SHM techniques such as operational modal analysis (OMA), as well as other means of in-service assessment like Substructural Bending Rigidity Identification (SBI) method. for quick on-site estimation of bridge stiffness and capacity.23,24 In-service monitoring could be short or long term, and it includes any data related to the performance of the bridge such as deflection due to traffic. The objective of in-service monitoring is largely dependent on the results of previous tiers, in which the appropriate monitoring plan is arranged to study the specific response of the bridge over time.
In Tier 4 assessment which is using as-is bridge information, structural system identification and numerical model calibration are carried out. Calibrated structural, material, and modal properties of the bridge are used for capacity assessment using virtual load testing for various loading conditions. Estimated capacities are assessed by using reliability analysis, and the uncertainties associated with any stage of assessment are evaluated by using probabilistic methods. Results of Tier 4 assessment are more accurate and reliable compared to conventional approaches (Tiers 1 and 2), since estimated LCC reflects the actual bridge capacity by considering existing bridge condition, and the accuracy of assessment is validated by reliability analysis.
Another merit of the multi-tier assessment procedure is that the response of the bridge can be assessed at component level or at system level. At component level, the response of the individual component is assessed, for example, main longitudinal girder. While at system level, the interaction of all components contributing to the overall capacity is considered, for example, result of virtual load test is a system-level response.
In each assessment tier, appropriate decisions are made regarding the remaining service life of the bridge. Load limitation, strengthening, and permit access are common bridge management plans by asset owners. 25 Such procedure is applicable to bridge superstructure and substructure for various limit state conditions.
Description of the test structure
In order to verify the proposed methodology for LCC assessment, a single-cell prestressed reinforced concrete Box Girder bridge laboratory model was studied. The laboratory model is a scaled-down version of the common cellular bridge decks currently operational in Australia. As shown in Figure 3, the reinforcements are distributed longitudinally and transversely.
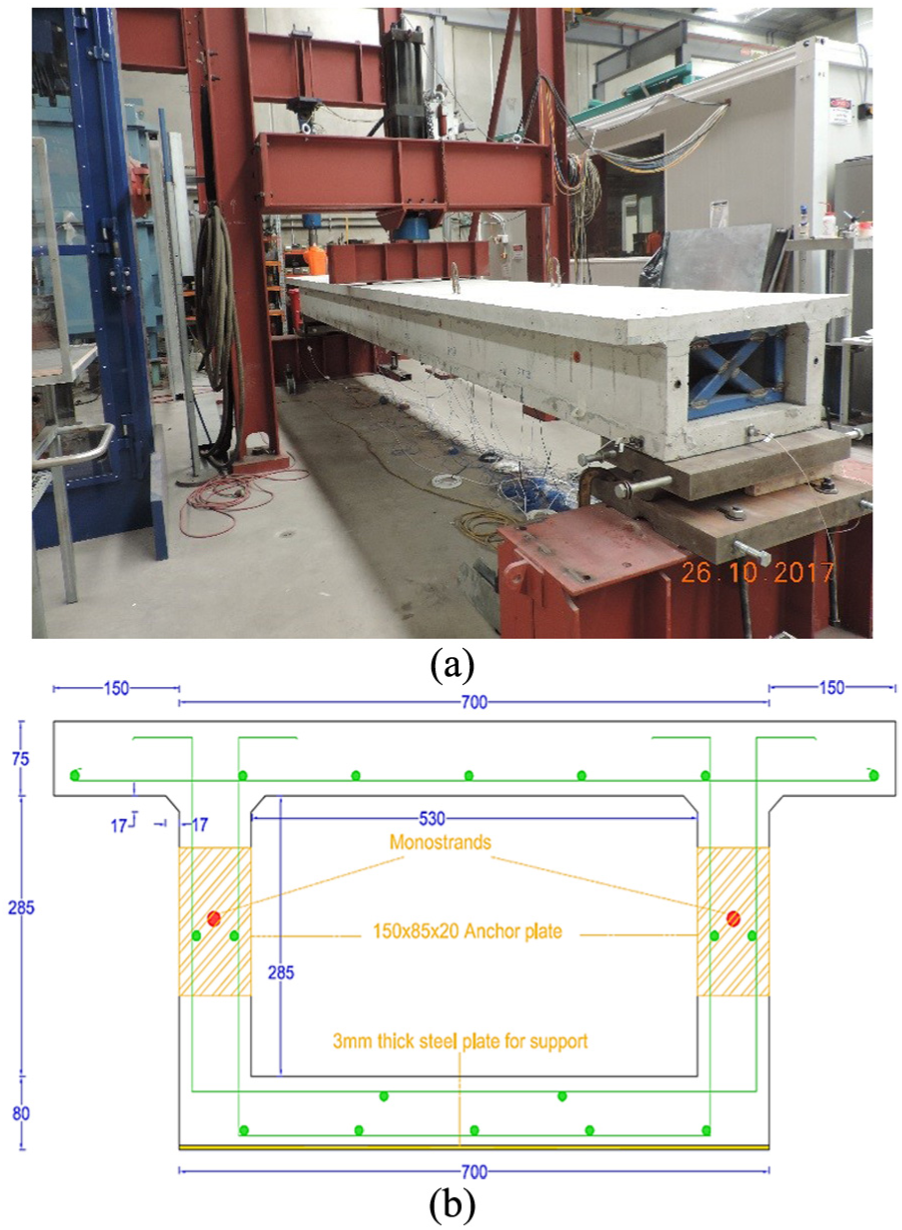
Box girder bridge: (a) in testing condition and (b) dimensions in millimeter.
Initially, the bridge was tested in November 2016 for identification of prestressed force at three different levels of posttensioning located through mid-web. Detailed description of the construction procedure and prestress force identifications are described elsewhere. 26 The tendons were removed from the ducts and after a period of 1 year, the Box Girder was set up again. All these were supposed to cause certain changes in physical, structural, and material properties. Hence, the purpose of testing was to assess the existing condition of the bridge considering all of the changes using the proposed multi-tier assessment procedure.
Development of the modeling technique
In the proposed multi-tier assessment, different modeling techniques are required. In this section, efficient modeling procedure for the purpose of model updating and virtual load testing are described. Three different numerical models of the Box Girder are developed, namely, grillage analogy (GA) model for Tier 1 and Tier 2 assessments, linear FE model for Tier 3, and nonlinear FE (NLFE) model for Tier 4 assessment (see Figure 4). Beam-line model is the simplest and least accurate model of the bridge and is only applicable to Tier 1 assessment. GA model is the simplified model that is easy to interpret the results, while linear FE model is considered as the design level, since such model is used by bridge practitioners for design and assessment. NLFE model incorporates all of the physical details, which are ignored in the previous models, for example, inclusion of reinforcement and concrete–steel interaction. In case of limited information on bridge geometry such as old bridges with incomplete design drawings, on-site measurement can be performed to estimate the geometric measure of bridge components. Process of numerical model creations, with advantages and limitations of each modeling technique, is detailed in the authors’ previous works.22,24,27
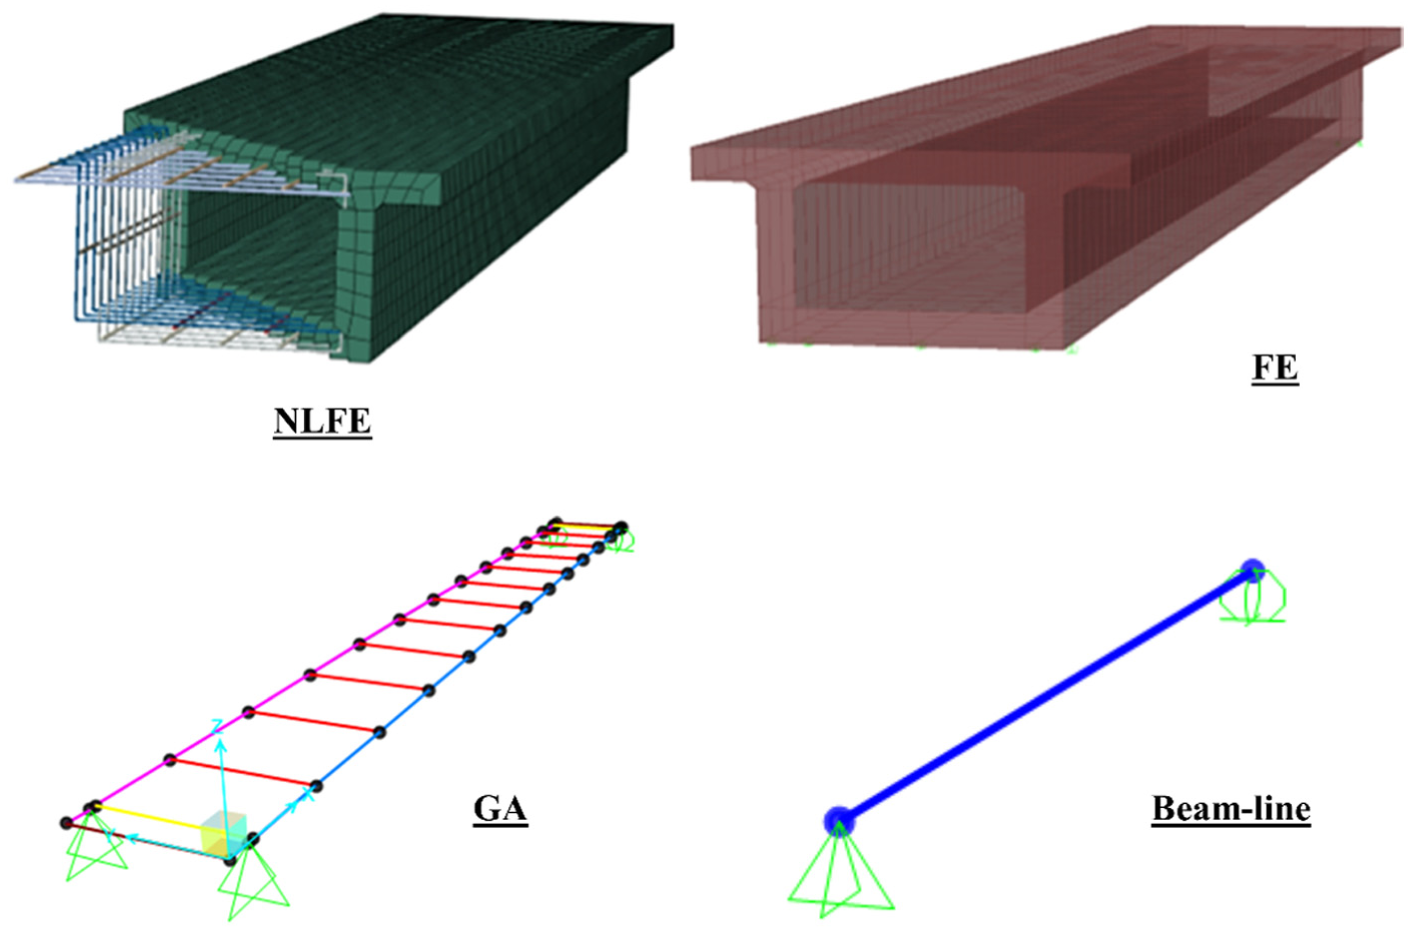
Developed numerical models: FE and GA are modeled in CSiBridge©, and NLFE modeled in Abaqus©.
The hidden reserved capacity of the bridge is masked if the numerical model is not calibrated with existing bridge information. Nonlinear analysis can be carried out on the calibrated numerical model of the bridge using information gained from SHM data.
To capture the nonlinear response of the Box Girder, concrete damage plasticity (CDP) model is used, which accounts for compressive crushing and tensile cracking of the concrete. This model is based on the damage mechanics and flow theory of the plasticity, which has been extensively used to study the nonlinear behavior of the concrete structures.28–30 In CDP model, damage is represented by the post-peak response of the constitutive concrete model in uniaxial compression and uniaxial tension.
There are many concrete models available in the literature, and the main difference among them are the post-yield behavior and the number of inputs required to construct the material model. For compressive behavior, the model proposed by Attard and Setunge 31 is selected due to the fact that only compressive stress is required as the input, and the post-yield response of concrete is well developed with applicability to a broad range of in situ concrete. For nonlinear tensile behavior, the model developed by Gopalaratnam and Shah 32 is adopted, which has smooth convergence in the tension stiffening zone that alleviates the convergence issues. Other concrete models may be used, provided that accurate inputs for constructing the constitutive material curve are available. For steel reinforcement, bilinear model having an elastic perfectly plastic relationship is considered. Other sophisticated steel constitutive models such as trilinear model can be used as well, provided that the exact information regarding reinforcement details and nonlinear parameters is available.
An experimental four-point bending test selected from literature was simulated to validate the material models for reinforced concrete structures. 33 Numerical simulations showed that LCC estimated by virtual load testing is in good agreement with the experimental capacity, in which the deflection at the end of loading was 8.5 mm with steel yielding as the mode of failure in the mid-region, which is in agreement with previous study. 34 This denotes that the defined material models can estimate the nonlinear response of the Box Girder under failure live load.
Modal and destructive testing
During construction of the Box Girder, steel plates were embedded into the concrete surface for easier sensor installation, and these locations were used for sensor positioning. Criteria for choosing proper sensor layout include the objective of the testing, available number/type of sensors, excitation location, and maximum modal displacement points.1,35 Figure 5 shows three examples of sensor positioning layouts that were used for modal testing, in which each arrow corresponds to a single sensor in that direction, which was used for measuring acceleration. An advantage of having more than a single sensor layout is that one can cross-check the quality of collected data across each measurement and ensure that true structural modes are captured. For each modal test, vibration signature of the Box Girder was recorded due to random and impact hammer excitation using data acquisition system. Recorded measurements were post-processed on-site using frequency-domain and time-domain modal estimation techniques, for example, enhanced frequency-domain decomposition and stochastic subspace identification methods. For each set of measurement, signal processing produced similar results, indicating that sensor layouts successfully detected real modal parameters.
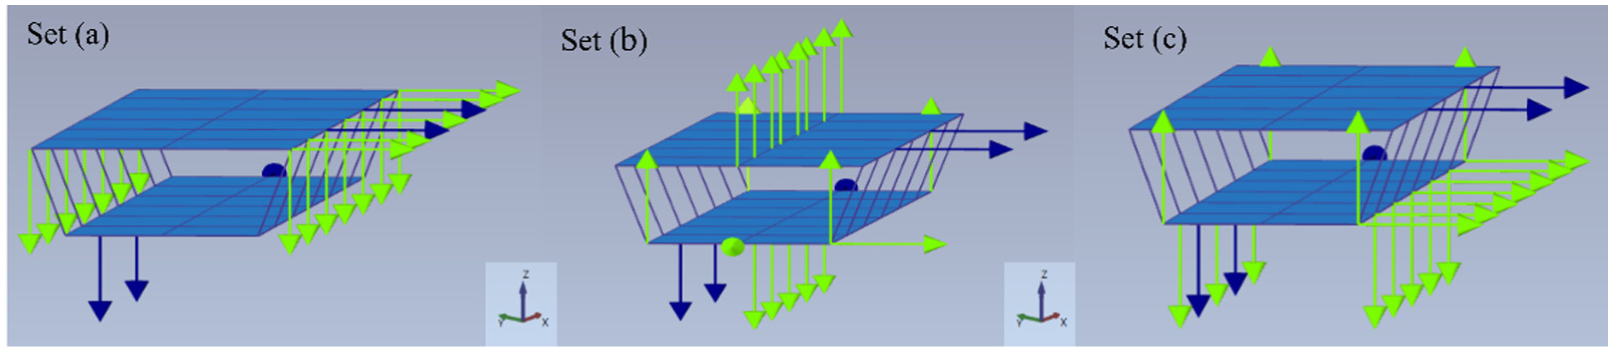
Examples of sensor placement layouts used for OMA.
Destructive testing of Box Girder was performed with twofold objectives: to find out the ultimate LCC and to validate the results of Tier 4 assessment, that is, virtual load testing. As shown in Figure 6, the rigid beam acts as load transfer and is placed on two steel supports seated on top of the webs, while load cell acts as live load. This prevents the punching shear failure through top slab by transferring the load into webs, which has similar configuration to the design axle loading (A160) in AS 5100.2 that acts as failure load for estimation of the ultimate LCC. The boundary conditions represent ideal pin-rollers that were seated on a stiff beam anchored to the ground to prevent any movement. Load rate of 0.01 mm/s was applied to the load cell using displacement-control approach.
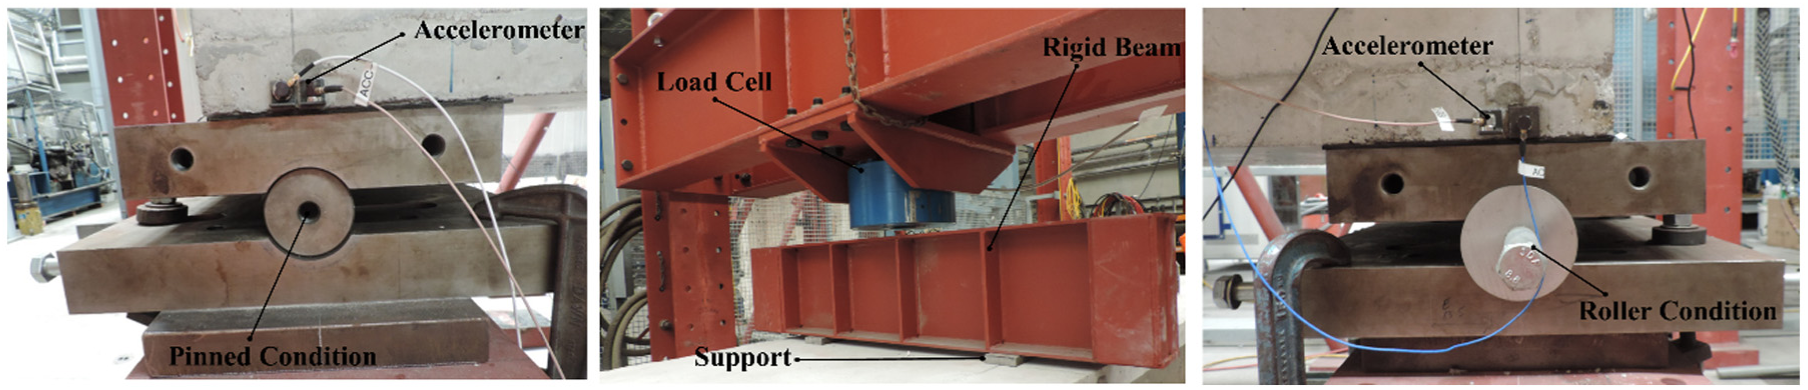
Destructive testing setup.
Numerical model calibration
In this study, model calibration is divided into three stages, namely, correlation analysis, sensitivity analysis, and model updating. 36
In correlation analysis, experimental and numerical degrees of freedom are correlated, which assist in mode shape identification and interpolation of the missing coordinates. The effect of different parameters on modal properties is investigated using sensitivity analysis. Parameters included are stiffness of the boundary conditions, concrete and steel reinforcement material properties. Any other variable that has the potential to be considered in the sensitivity analysis: however, irrelevant parameters may lead to an updated but physically meaningless model.
Due to the fact that construction process of the Box Girder was completed in three separate stages, Box Girder was grouped into three sections which are web, soffit, and top slab. The results of the sensitivity analysis can be compared in Figure 7, in which responses 1 to 4 are the first four natural frequencies of the Box Girder, and parameters 1 to 10 are listed accordingly. Responses and parameters for the model updating were selected based on the preliminary parametric study using reliability-based updating to investigate the effect of change in the updated parameters due to the variation in the responses. 37 Referring to the color code for rate of changes in each response, it is apparent from the rate of fluctuation that each experimental response has a different effect on the corresponding parameter. For example, for first experimental response, Young’s modulus (E) has an increasing trend, while material density (ρ) is decreasing. Effect of stiffness from boundary conditions (KX and KY) is marginal on experimental frequencies, which indicates that it is not a very sensitive parameter for model updating in the case of Box Girder. Main effects in sensitivity analysis are due to concrete and steel material properties, which are considered primarily as parameters for model updating.
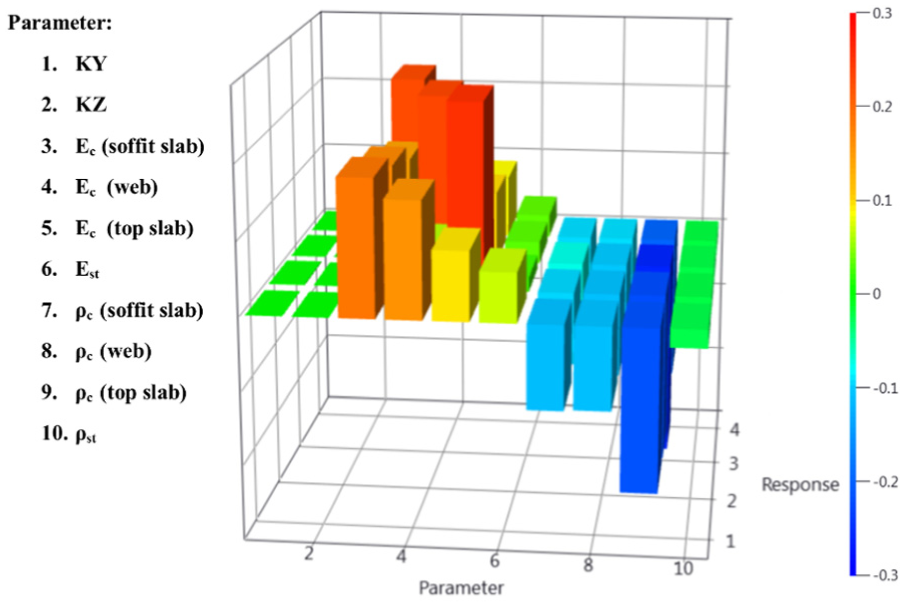
Sensitivity analysis.
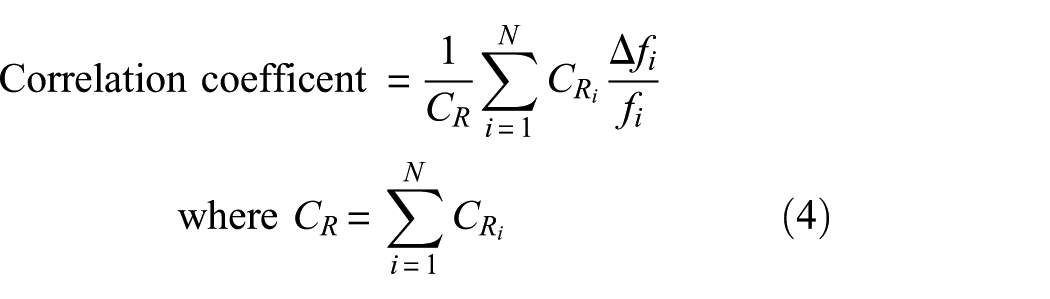
On selection of updating parameters, model updating is conducted using differential methods. CCMEAN is the correlation coefficient of weighted absolute relative differences between updated and experimental frequencies; while CCABS is the absolute relative difference of CCMEAN. 38 These correlation coefficients, as shown in equation (4).
N is the number of selected experimental frequencies, f is the natural frequency, and CR is the response confidence. Perfect correlation indicates no difference between experimental modal parameters and their analytical counterparts, therefore representing the bridge in as-is condition
The graph in Figure 8 shows the convergence process during model updating. For perfect correlation, the correlation coefficients should be all zero, which is the case for the Box Girder. Also, very few number of iterations indicates that model updating is successful with minimal computational time.
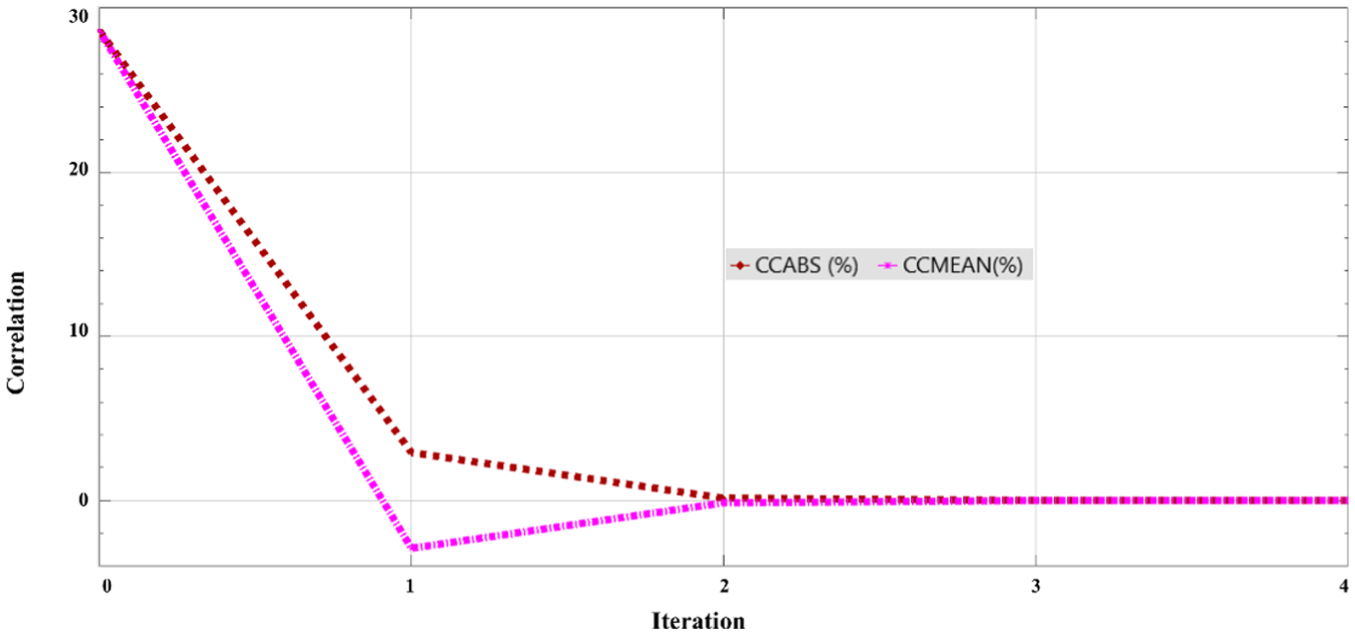
Convergence of the model updating.
The results obtained from model updating are summarized in Table 2, and calibrated mode shapes of Box Girder are presented in Figure 9.
Results of finite element model updating.
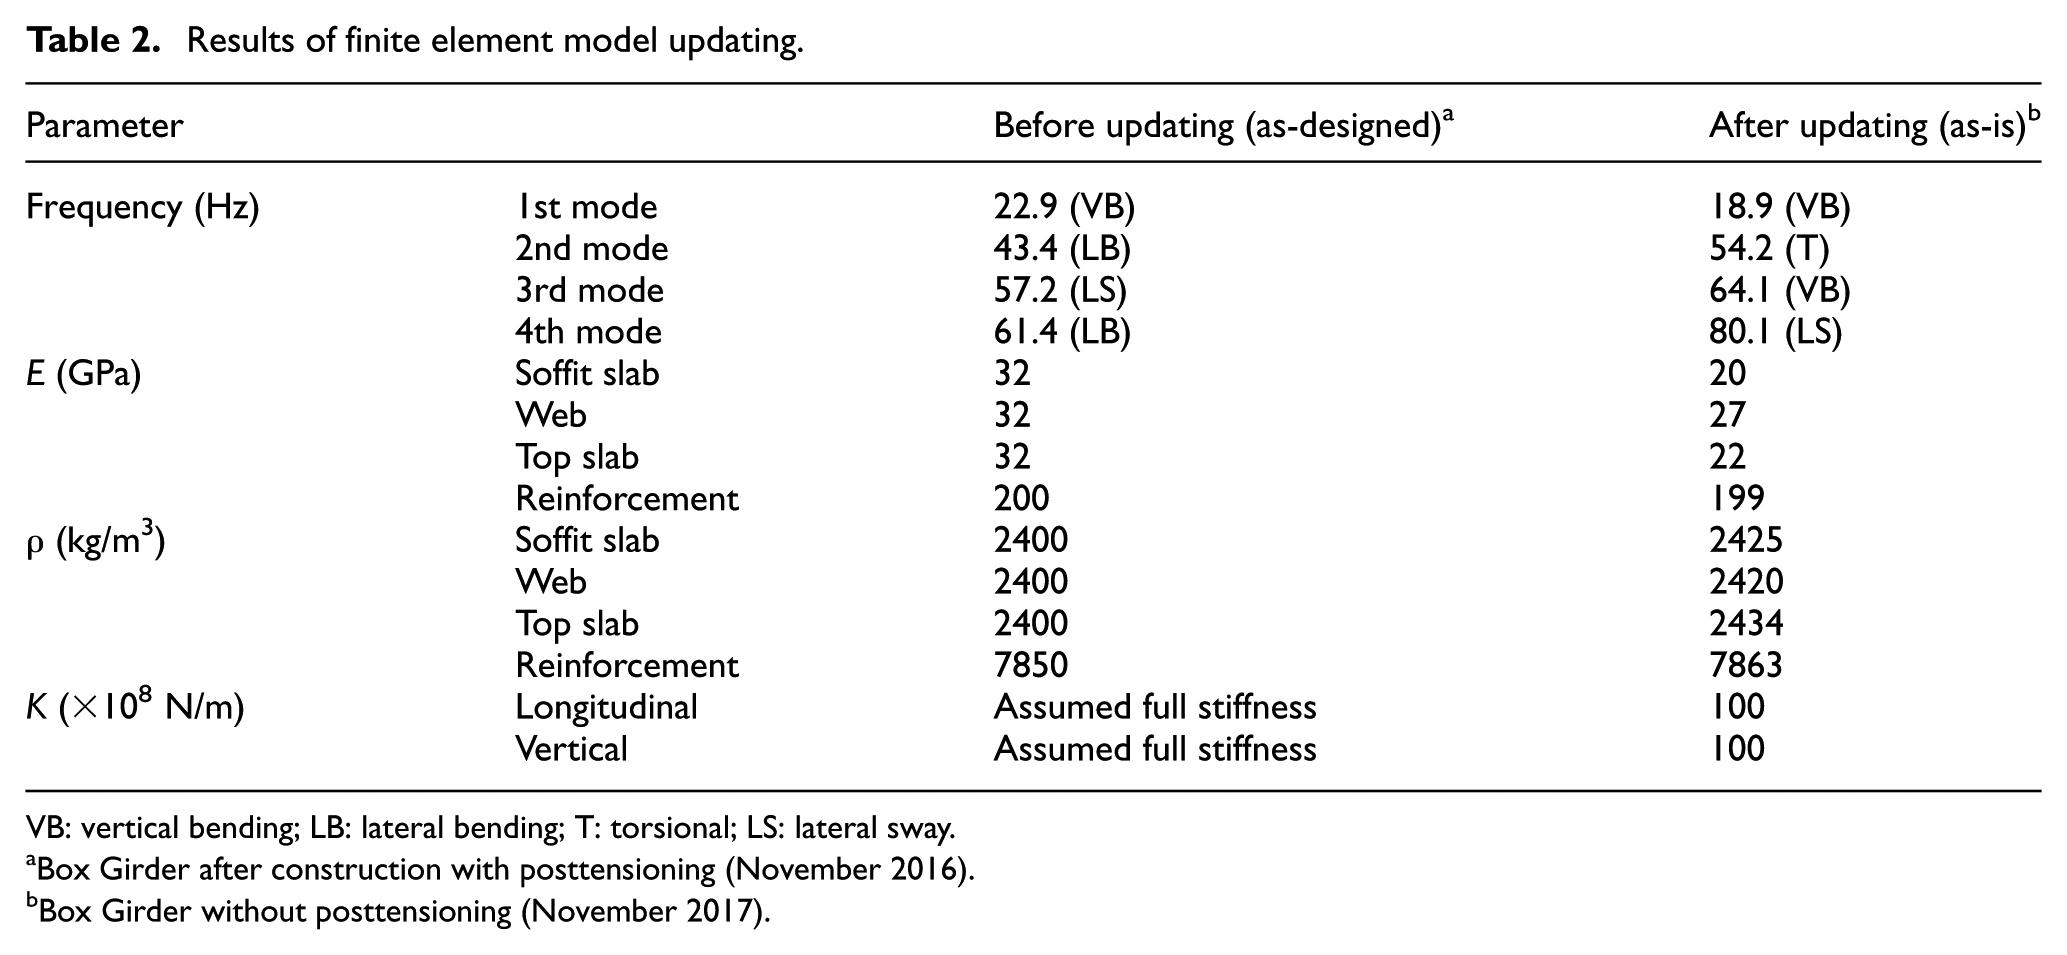
VB: vertical bending; LB: lateral bending; T: torsional; LS: lateral sway.
Box Girder after construction with posttensioning (November 2016).
Box Girder without posttensioning (November 2017).
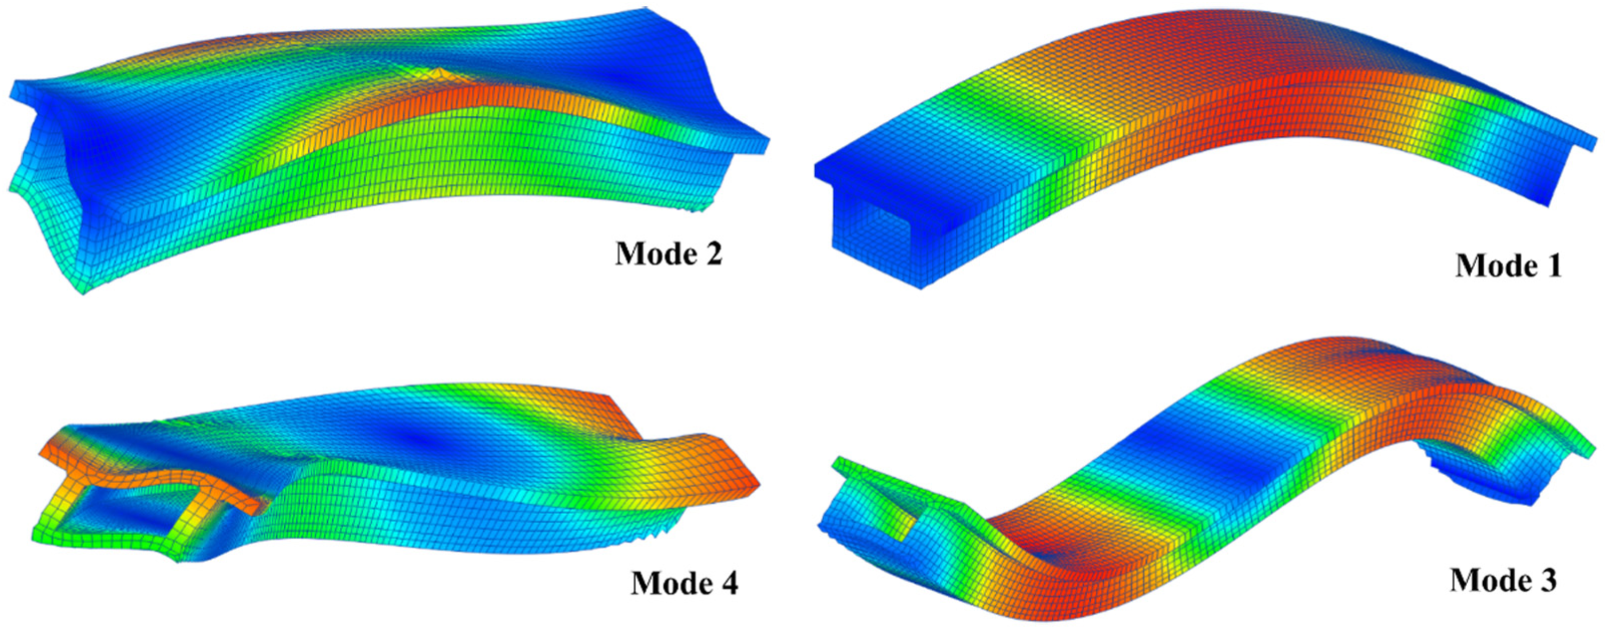
Mode shapes of Box Girder after model updating.
Sound engineering judgment and past experience are two important factors to verify the accuracy of updated parameters, otherwise updating parameters are forcefully changed during updating process to match the experimental responses.
Referring to Table 2, modal and structural properties of the Box Girder are changed notably. Values before updating are as-designed conditions and modal parameters are for posttensioning with different boundary conditions, whereas after updating parameters are as-is condition of the Box Girder. The first four frequencies obtained from modal testing are 18.9, 54.2, 64.1, and 80.1 Hz, respectively. Difference in the modal parameters can be explained by the fact that Box Girder has no posttensioning tendon, and its boundary conditions were changed leading to different new modes, especially higher order modes that are coupled in nature. The observed change in material properties can also be partially attributed to the presence of some cracks, which existed in the Box Girder at the soffit slab. These cracks further propagated during destructive testing, which is explained in the next section.
LCC assessment
For the purpose of comparison, LCC assessment is carried out at different assessment tiers, including rating factors as part of Tier 2 assessment and using proposed virtual load testing (Tier 4). Tier 3 assessment was described in previous sections as part of SHM testing and model updating; while Tier 1 assessment is excluded due to its simplicity.
LCC ratio
Figure 10 illustrates the ultimate LCC of the Box Girder obtained by destructive testing and virtual load testing. For virtual load testing, three curves represent the load deflection for different contact coefficients between the load cell and the surface of the Box Girder during loading phase. Referring to load-deflection curve, virtual load testing on updated FE model produced similar results to that of experimental curve, considering the fact that all material and structural properties were back-calculated using SHM techniques, for example, using Table 2. Parameter dt in Figure 11 illustrates the extent of tensile damage in affected concrete zones; values closer to unity indicate higher tensile failure and in turn more cracks. Propagation of cracks in the virtual load testing follows similar trend to that of actual testing, where cracks are developed throughout the bridge width and stretched up to top slab at mid-span. Other useful information from the results of virtual load testing is to evaluate other failure criteria, such as plastic strain and yield stress. For localized information on damage, existing methods for damage assessment can be applied to the updated model. 39
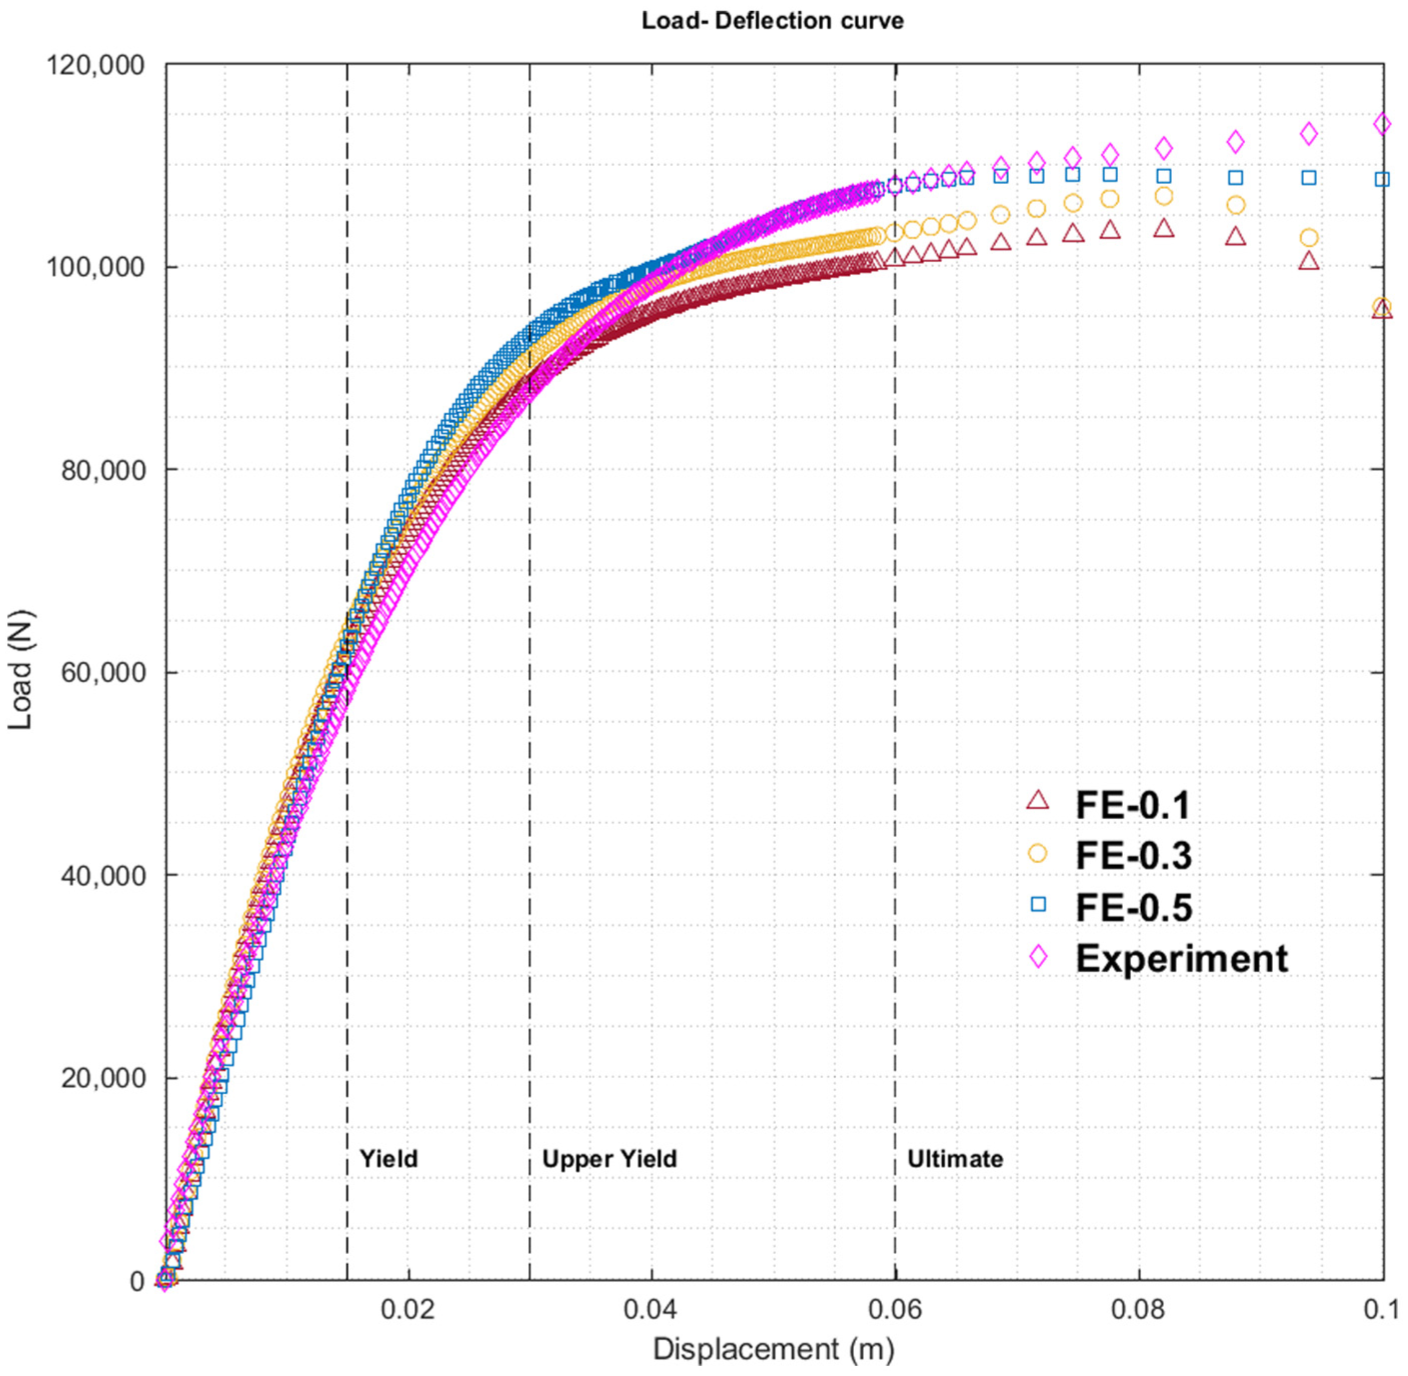
Load-deflection curve of the Box Girder.
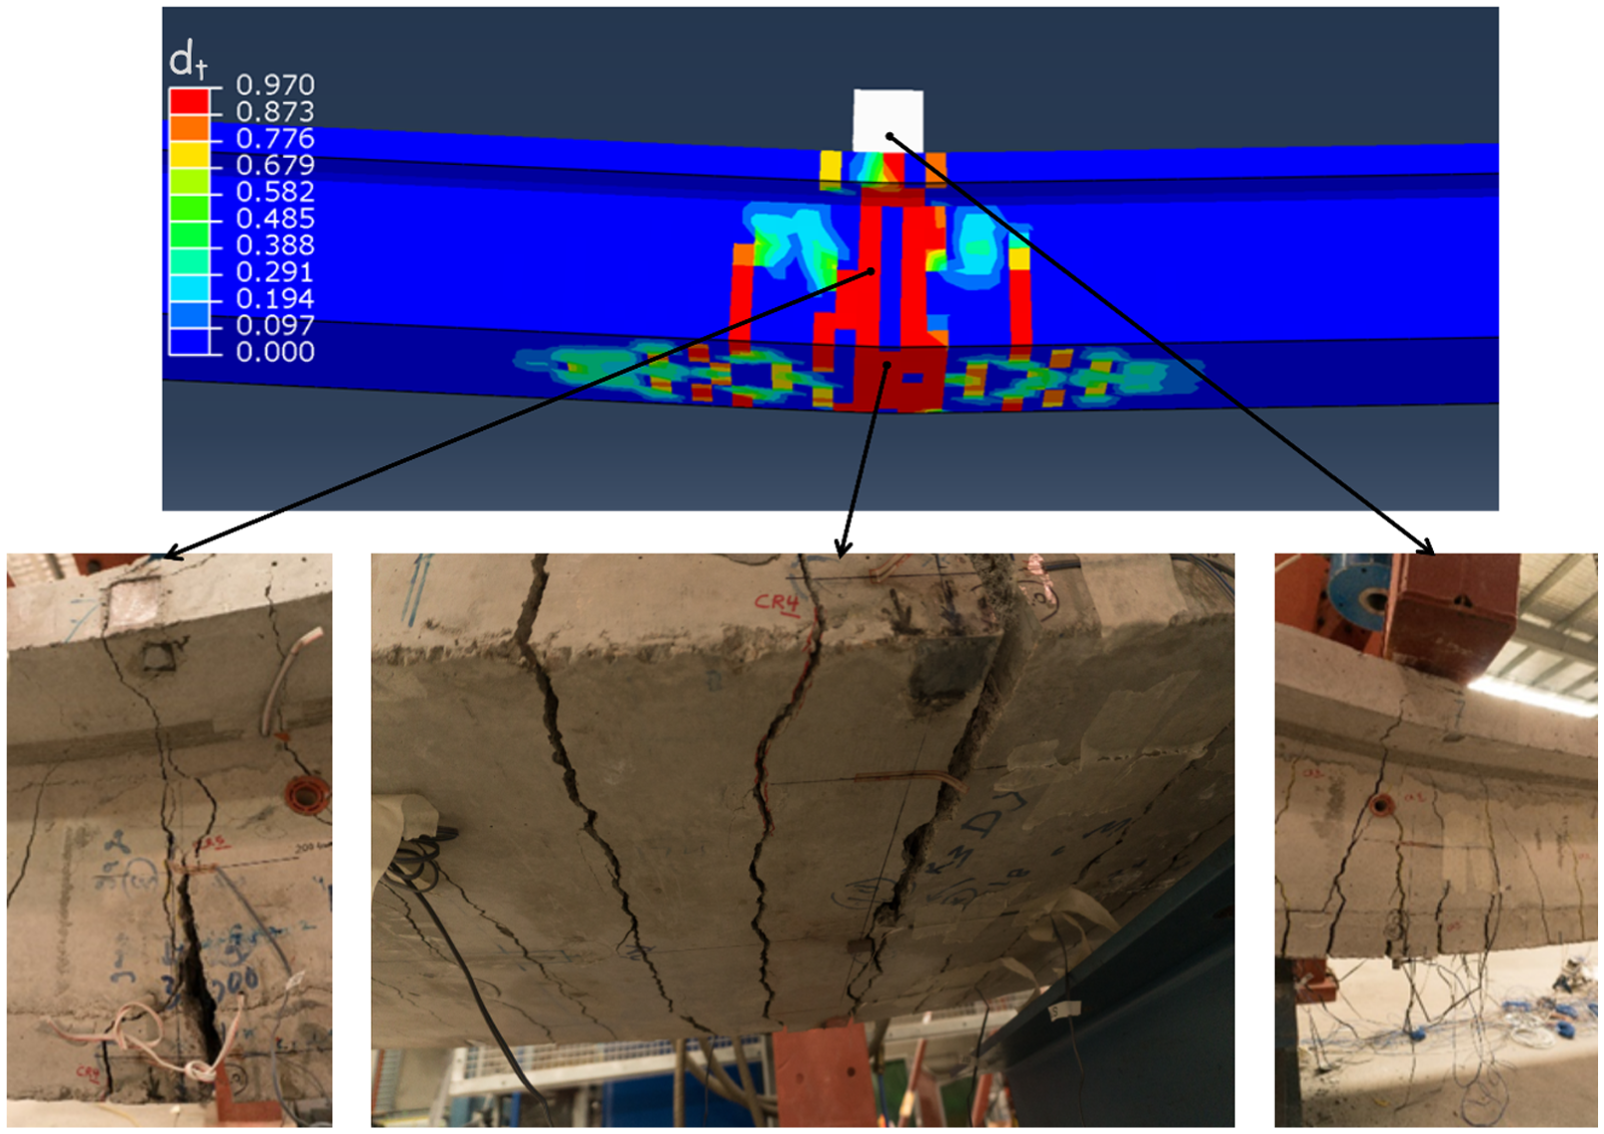
Crack patterns in destructive testing and virtual load testing.
Failure of Box Girder was divided into three stages, namely, yield, upper yield, and ultimate stage. Referring to Figure 10, at yield stage when the failure load is 58 kN, the bridge enters post-elastic range and appearance of hair-line cracks becomes visible with bare eyes, while at upper yield stage, the failure load increases to 87.5 kN, in which cracks propagate further by increasing in dimension and extending to the non-loaded regions. Ultimate stage is defined as the failure of the bridge, which makes it dysfunctional for service. When the failure load reaches 108 kN, the concrete at the bottom of mid-span falls off and yield of steel reinforcement is clearly visible, and hence, the virtual load test discontinued. Because of the symmetry, load distribution by each web is similar and hence substantial load redistribution occurs before ultimate stage is reached. Having verified the validity of virtual load testing against destructive testing, calibrated FE model is used for shear failure. Using equation (4), the LCC ratio of the bridge is as follows: 6.48 for ultimate flexural capacity and 12.3 for ultimate shear capacity, which indicates that Box Girder has higher resistance to shear failure. Since LCC ratio considers the actual condition of the bridge using updated structural and material properties, no load factor is applied to equation (4).
Analytical model for virtual load testing needs to be made once, and it can be reused and updated for preparation of field test, identification of possible failure modes, changes in configuration of as-of-right vehicles, and assessment after extreme events.
Rating factor
Load rating was carried out for bending moment (M) and shear force (V) under two vehicular loadings: A160 as axle load representing the load cell, and T44 representing the previous major design vehicle. 22 These vehicular loadings were scaled down by a factor of 10, in order to be applicable to the Box Girder “carriageway.” As can be seen from Table 3 with reference to relative percentage difference (RPD), ultimate LCC of the Box Girder is changed significantly prior (Tiers 1 and 2) and after considering as-is condition (Tiers 3 and 4). For example, using as-designed condition, flexural capacity is capable of carrying 2.47 tons under A160 loading, while this value drops to 1.84 tons.
Rating factors at ULS.
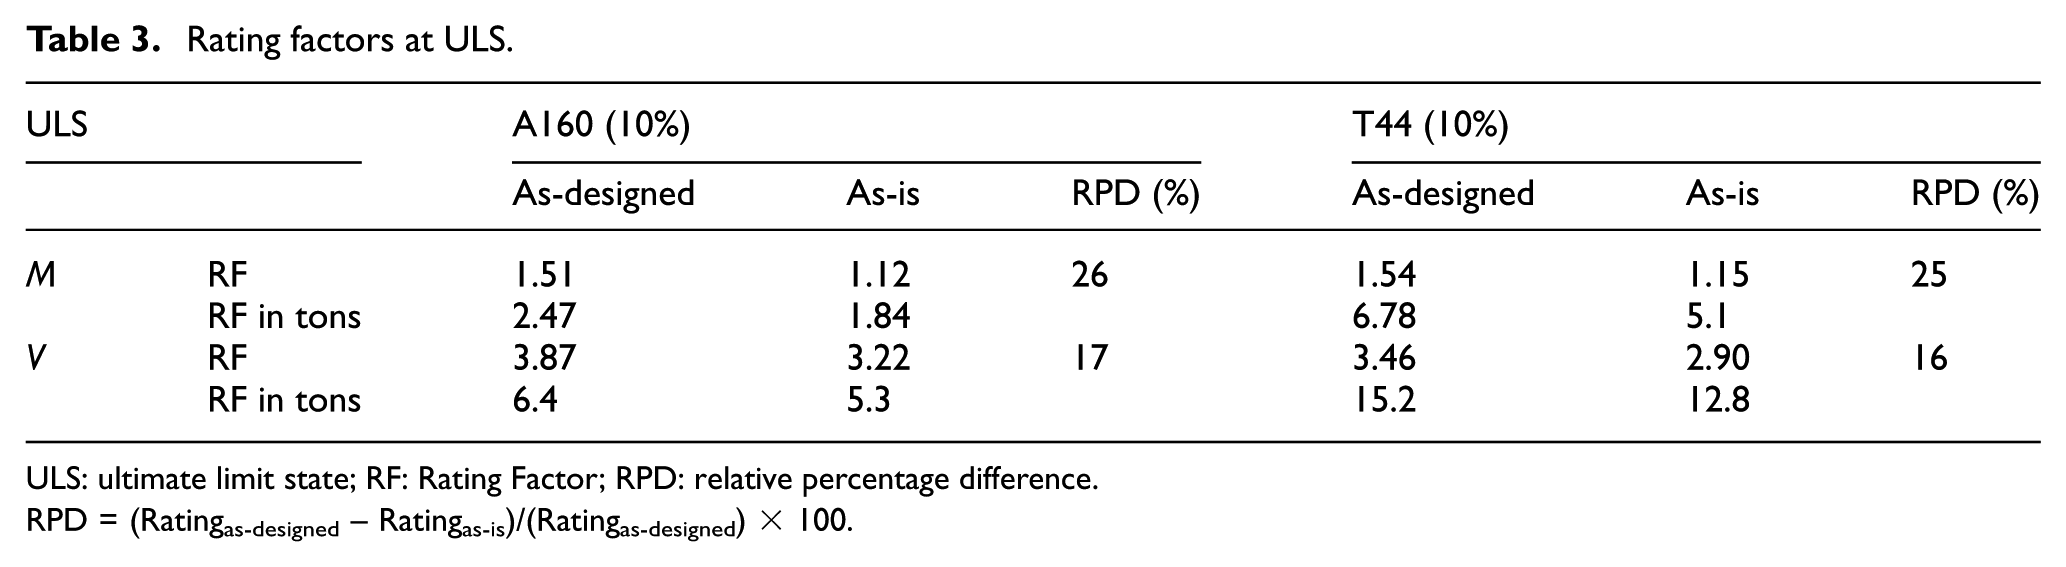
ULS: ultimate limit state; RF: Rating Factor; RPD: relative percentage difference.
RPD = (Ratingas-designed – Ratingas-is)/(Ratingas-designed) × 100.
This can be explained by the fact that Box Girder had higher flexural resistance with prestressing force in the 15.4 mm tendon located in each web, but after removal of tendons, the bearing capacity of the Box Girder relied entirely on concrete strength and steel reinforcement. As a result, neutral axis of the whole Box Girder shifted upward, which made larger portion of Box Girder to be in the tension zone. On the other hand, shear force resistance has better ratings in all cases, which is due to the posttensioning applied at each web. From the principle of stress flow, the maximum shear stress occurs in the mid-height of web, which is the place that high prestress force was induced.
Taken together, these results highlight the positive aspects of using multi-tier assessment procedure that considers as-is condition for bridge load rating.
Probabilistic analysis
All of the previous assessment results are deterministic and do not consider the uncertainty of the parameters, for example, uncertainties in material properties. To account for uncertainty involved, reliability analysis is performed as a part of Tier 4 assessment to further validate the information obtained from previous assessment tiers.
The results shown in Table 4 are obtained by Rackwitz–Fiessler method as semi-probabilistic procedure considering load and resistance parameters as random variables using LSF in equation (3). These results are in agreement with rating factors, in which the likelihood of flexural failure is higher in comparison to shear failure.
Reliability index at ULS.
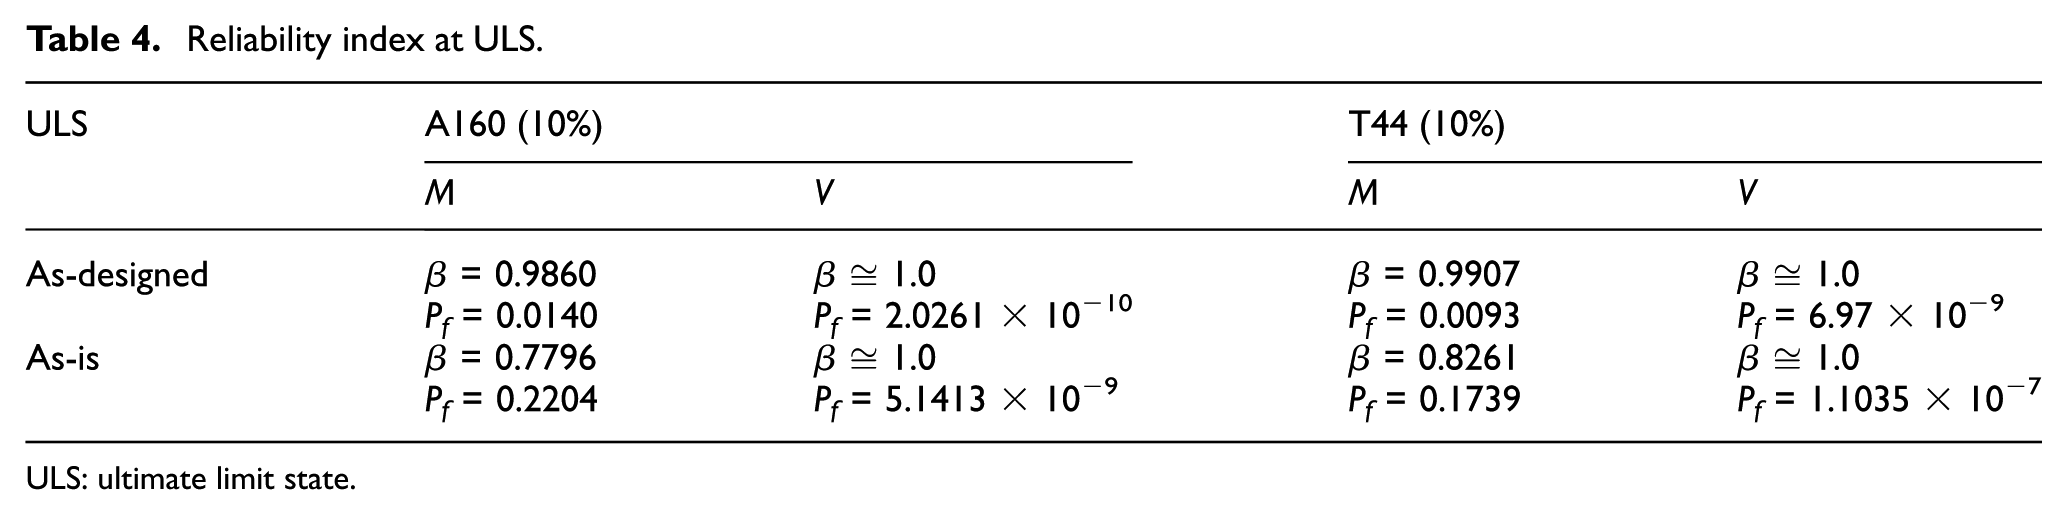
ULS: ultimate limit state.
The values in Table 5 show the relative importance of random variables in the computed LSF for the flexural capacity and shear capacity under A160 (10%) and T44 (10%) loadings. From the comparison of the data in two different states of the Box Girder, it can be seen that proportion of the resistance on overall reliability is increased, while for LL is decreased, with marginal change for DL. Box Girder was mainly affected by load and resistance parameters due to the changes since its construction, whereas for DL and SDL, minimal change is observed due to insignificant variation in the mass of the bridge. In fact, for as-designed assessment, the theoretical capacity of the bridge is obtained by nominal values and it is compared by the nominated vehicular loading, so the basis of the design is the capability to withstand vehicular loading. Therefore, contributing variable that mostly affects the as-designed condition is the LL on bridge. However, for as-is assessment, the existing capacity of bridge is obtained by a range of values and it is compared against the nominated vehicular loading. Due to time-dependent changes in the material properties, and physical and structural conditions, the corresponding change in load and resistance parameters can be studied to identify critical parameters for any LSF and loading condition.
Relative importance of random variables in LSF for different loading conditions.
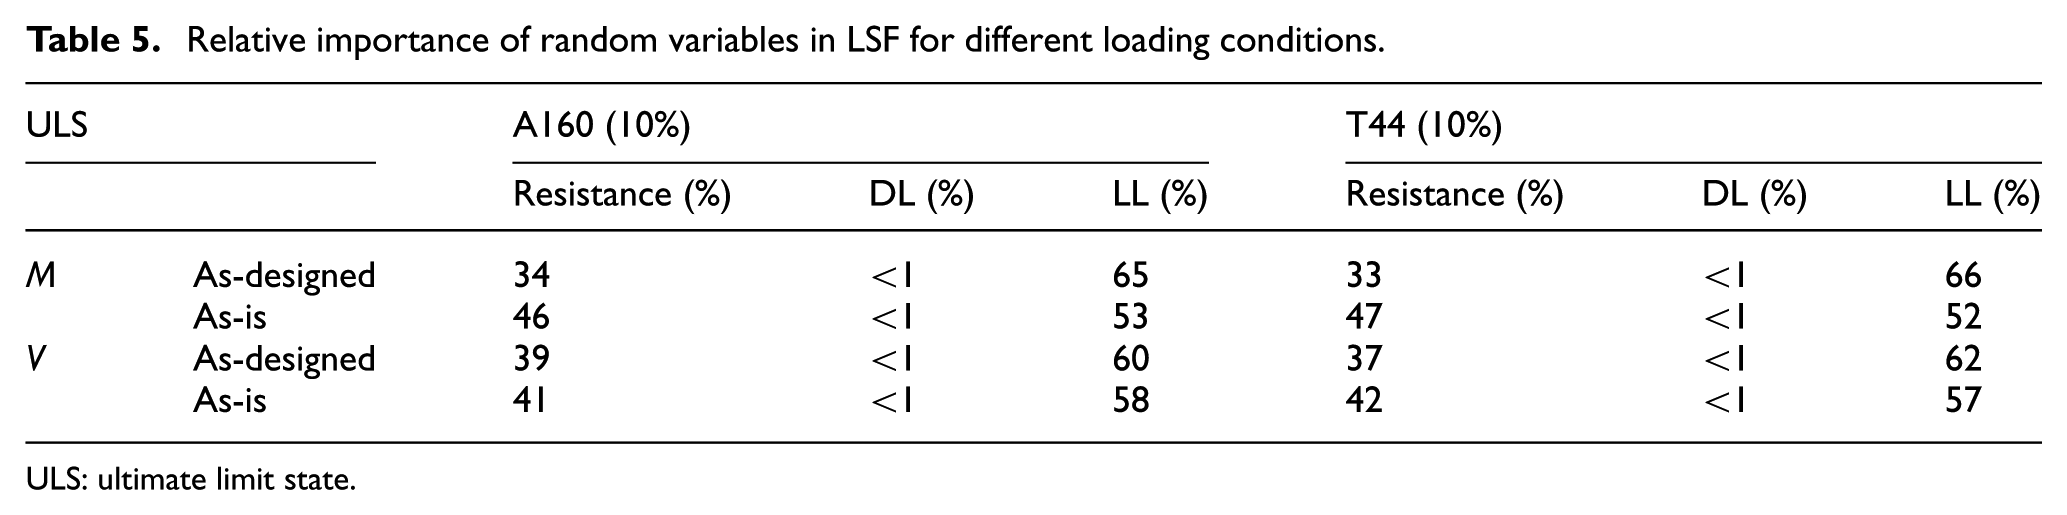
ULS: ultimate limit state.
To allow a deeper insight into the effect of variables on the overall stability by a fully probabilistic approach, all of the parameters contributing to the flexural and shear capacities of Box Girder are considered as random variables using MCMC (refer Table 1). Based on the calculated probability, it is found that the resistance of Box Girder is not following a normal distribution, as assumed in Table 1. For A160 (10%) loading, the probability of failure (Pf = 0.1172) is increased because all of the parameters affecting the flexural capacity are considered as random variables, which enables to investigate any parameter associated with uncertainty, such as uncertainty in nonlinear material properties. The ultimate shear capacity without considering shear reinforcement has Pf = 0.0265, while this value reduces to 1.4 × 10⁻⁵ for ultimate shear capacity limited by web crushing. Comparing the results of semi- and fully probabilistic methods, capacities are changed notably if the uncertainty of all parameters are considered, which can assist in the identification of the influential parameters affecting the ultimate LCC.
Similar procedure is applicable to any combination of random variables for different LSFs under various load effects, such as those presented in Table 4, that enables to determine the most significant parameters affecting the capacity of the bridge. Implication of the reliability analysis in Tier 4 is to fill the plausibility gap between actual and estimated LCC of the bridge. Reliability analysis in Tier 4 takes into account any noticed and unnoticed error at any stage of assessment and qualitatively evaluates the accuracy of the estimated LCC in terms of bridge safety index and likelihood of future failure.
Conclusion and path forward
This study was set out to develop a comprehensive assessment framework for capacity evaluation of existing bridges and to further refine the existing practice for bridge assessment in Australia. Due to the lack of advanced assessment procedures and reliability-focused guidelines in AS 5100.7, a multi-tier assessment procedure was proposed with varying levels of the complexity to advance the existing assessment practice and to provide a framework for higher order analysis, where the results of previous assessments indicate critical ratings. Based on the LCC assessment and reliability analysis on an existing Box Girder bridge, it was observed that by using as-is information of the bridge obtained by SHM techniques, actual response of the bridge to external loading can be evaluated.
All things considered, the findings of this study provided insights into a comprehensive assessment framework that highlighted the significance of using SHM techniques for bridge assessment and strengthened the idea that SHM techniques could be practically implemented for bridge assessment using AS 5100.7.
The future path of this study is to generalize the implication of SHM techniques for practice, not only limited to bridge assessment but also for design and assessment of other infrastructures. To improve the productivity of freight network and Australian bridge stock, proposed multi-tier assessment procedure is very effective in enhancing the accuracy of assessment and maximizing the efficiency of freight community.
Footnotes
Declaration of conflicting interests
The author(s) declared no potential conflicts of interest with respect to the research, authorship, and/or publication of this article.
Funding
The author(s) disclosed receipt of the following financial support for the research, authorship, and/or publication of this article: The research presented in this paper has been funded by Queensland University of Technology and Australian Research Council (ARC DP130104133), which are gratefully acknowledged.