






Abstract
Signal processing is one of the essential components in vibration-based approaches and damage detection for structural health monitoring. Since signals in the real world are often nonlinear and non-stationary, especially in extended and complex structures, such as bridges, the Hilbert–Huang transform is used for damage assessment. In recent years, the empirical mode decomposition technique has been gradually used in structural health monitoring and damage detection. In this article, the application of complete ensemble empirical mode decomposition with adaptive noise technique is investigated to identify the presence, location, and severity of damage on a steel truss bridge model. The target is built at laboratory conditions and experimentally subjected to white noise excitations. By employing complete ensemble empirical mode decomposition with adaptive noise technique, four key features extracted from the intrinsic mode functions, including energy, instantaneous amplitude, unwrapped phase, and instantaneous frequency, are assessed to localization, quantification, and detection of damage both quantitatively and qualitatively. In addition, to further explore the sensitivity of the damage detection approach based on the complete ensemble empirical mode decomposition with adaptive noise technique method, several improved damage indices are proposed based on the combinations of two statistical time-history features, including kurtosis and entropy features with the energy and instantaneous amplitude features of the analyzed signal. The experimental results from the damage indices based on the extracted features demonstrate the robustness, superiority, and more sensitivity of the complete ensemble empirical mode decomposition with adaptive noise technique method in addressing the damage location, classifying the severity, and detecting the damage compared to empirical mode decomposition and ensemble empirical mode decomposition techniques.
Keywords
Introduction
Background
Structural health monitoring (SHM) of strategic and complex civil infrastructure, such as bridges, is vital in the reduction of maintenance costs and preserving the structural integrity against catastrophic events, including natural hazards and man-made disasters. In recent years, global vibration characteristic–based techniques have attracted researchers to investigate SHM. Nowadays, the time–frequency-based methods of signal processing are popularly utilized in SHM of civil infrastructure among the various kinds of vibration-based methods. Consequently, signal processing techniques are very key components for both scientific investigations and engineering applications.
These techniques involve the acquiring of the vibration characteristics of a structure in various situations, then, extracting and interpreting the behavior of the important features of the captured vibrations to reach a conclusive statement. Most of the conventional time–frequency signal processing approaches, such as time and frequency domain analyses, are based on the fact that the signal is linear and stationary. However, signals are often nonlinear and non-stationary in the real world. Also, quite often, the length of real signals is relatively short, which makes the processing procedure a difficult task. Since the time–frequency techniques can supply both the time and frequency details of a signal, they are appropriate to process nonlinear and non-stationary signals.
Literature review of spectral analysis approaches
The most common signal processing techniques that have been previously used in vibration-based studies are fast Fourier transform (FFT),1–5 short-time Fourier transform (STFT),6,7 wavelet transform (WT),8–13 and Hilbert–Huang transform (HHT).14–19
Although the classical fast Fourier spectral analysis method has a higher extraction efficiency than other algorithms, it has been shown that it is deficient in the processing of nonlinear and non-stationary signals. The traditional time–frequency analysis methods, such as STFTs, are basically the windowed Fourier transforms which can be used to analyze non-stationary signals and linear data. However, these methods lack capabilities in multi-resolution analyses. Unlike the STFT, the WT is a powerful tool that includes the incorporating of variable window sizes and capabilities in resolution, thus balancing both time and frequency domains of a signal. Similar to STFT, WT can only be used to process signals in non-stationary and linear conditions.
To overcome the aforementioned drawbacks of the abovementioned methods, the HHTs were developed by Huang and colleagues20,21 which is promising in the processing of nonlinear and non-stationary signals. This approach includes two procedures. In the first part, the signal is decomposed by the empirical mode decomposition (EMD) method into a finite set of intrinsic oscillatory components, called intrinsic mode functions (IMFs), which reflect the scale characteristics embedded in the signal. In the second part, the Hilbert transform (HT) is used to obtain the instantaneous frequency (IF) and amplitude features and yield a time–frequency representation (Hilbert spectrum) for each IMF. So far, this method has been applied in different fields of engineering, such as earthquake engineering, SHM, and damage detection. Vincent et al. 22 utilized EMD and WT methods as the signal processing techniques in damage detection and revealed that EMD is a more efficient method than WT, due to its novel algorithm. Quek et al. 23 utilized the HHT to assess the non-stationary wave propagation fundamentals of different structural members, including aluminum beams, sandwiched aluminum beams, plates, and RC slabs, by considering various damage levels. Yang et al. 24 employed the EMD and HT to determine the damage time instant, the natural frequencies, damping ratios, and damage locations, before and after damage, in which damage scenarios were accomplished by applying sudden changes in the stiffness of an ASCE benchmark structure. In that study, the presence of damage was recognized by observing the damage spikes in the signals using EMD. Xu and Chen 25 conducted an experimental investigation to detect and locate damage using the EMD method by applying abrupt changes in the structural stiffness of a three-story shear building. Pines and Salvino 14 proposed a signal processing method based on the processing of time-series data from a 1D scaled civil building, tested in the cases with and without structural damage. From the results, it was found that this method is capable to address the unique features of the vibratory response of the structure. Liu et al. 15 demonstrated that the HHT method can efficiently detect and locate the possible damage in a scaled four-story structure by comparing the frequency of the first three IMFs extracted before and after damage states.
Yan and Miyamoto 16 evaluated the modal frequencies and damping ratios on a Z24-bridge by comparing HHT and continuous wavelet transform (CWT) methods. Li et al. 26 utilized the combination of EMD and WT methods to predict the location and intensity of the damage. At first, the acquired signal from the vibration of a four-story shear structure was decomposed into a set of IMFs using the EMD method, then, the WT coefficients detected the location and severity of the damage. Cheraghi and Taheri 27 proposed some numerical and experimental monitoring approaches to identify the various damage levels, detect, and locate damage in the pipelines by evaluating the EMD-based energy damage indices for the vibration response captured using piezoelectric sensors. Also, Rezaei and Taheri 28 employed the EMD on the experimental vibration responses of steel pipes to detect damage by defining an energy-based damage index. It was found that the EMD energy-based damage index is a sensitive and effective method for detecting and locating damage. Chen 29 summarized the application of the HHT technique as a powerful tool in SHM. The efficiency of this approach in data processing, identification of structural parameters, and damage detection of tall buildings was evaluated by conducting some experimental and numerical studies.
Bao et al. 30 applied an improved HHT algorithm as a signal processing tool to identify the damage conditions of a scaled concrete–steel composite beam model subjected to impact tests. Tang et al. 19 proposed a damage detection index, named as the ratio of equivalent damping (RED), which was evaluated using HHT and FFT methods, to assess the shaking table test data obtained from the benchmark models. Subsequently, Hsu et al. 31 evaluated the sensitivity of the damage index proposed by Tang et al. 19 for analyzing the initial damage in cantilever beams and a full-scale 3D three-story steel frame structure subjected to earthquakes. Shi et al. 32 used the combination of two efficient techniques, including the random decrement technique (RDT) in the time-domain and the HHT method in the time–frequency domain, to identify the modal frequencies and damping ratios of the Shanghai World Financial Center (SWFC) in China.
Garcia-Perez et al. 33 presented a fusion methodology of wavelet packet transform (WPT) and EMD, combined with artificial neural networks (ANN), to identify and locate the combined damage in a scaled model of a five-bay truss-type structure. Meredith 34 studied the possibility of applying EMD and used a moving average filter on the acceleration response of a beam subject to a moving load, to detect the damage location. To verify this technique, they conducted several scenarios, including a range of bridge lengths, speeds of the moving load, and noise levels.
Simon Carbajo et al. 35 presented a new automated structural change detection algorithm by extraction of damage-sensitive features of IFs and signal energies from HHT that were applied in an experimental single degree of freedom (DOF) system and a wind turbine blade under band-limited base excitation. Dushyanth et al. 36 evaluated the HHT method to pinpoint the location of damage, in both simulation and experimental tests, and used a set of damage indices and a multi-level support vector machine to distinguish the healthy or damaged state of an aluminum plate. The authors concluded that the proposed detection method can be applied to real-time applications due to its high accuracy and the considerable decrease in the computational time. Xun and Yan 37 used a radial basis function (RBF) neural network as a pre-processor to expand the length of the signal for removing the end swings problem and as a post-processor to select the optimal IMFs.
Approaches to overcome some limitations ofEMD-based techniques
Despite the major applications of EMD as a powerful signal processing tool in the literature, it has a significant inherent defect called mode mixing due to the intermittent frequencies in the IMF. To overcome this, Wu and Huang 38 proposed the ensemble empirical mode decomposition (EEMD) which was an improved method through the addition of identically white Gaussian noise, with an appropriate scale and standard deviation. Martinez et al. 39 combined the EEMD with the multiple signal classification approach (MUSIC) and compared it with traditional methods, such as discrete wavelet transform (DWT) and FFT techniques, as a signal processing tool to identify the modal frequencies of structures, and validated the approach by experimental results from a scaled truss bridge. The results demonstrated the efficiency of the proposed methodology. Amiri and Darvishan 40 evaluated the capability of EEMD compared with EMD using a density-based clustering technique. This comparison was implemented by utilizing the frequency and amplitude features extracted from the numerical acceleration response of a steel moment frame.
Unfortunately, the EEMD has two major drawbacks: residual noise in IMF and difficulty in averaging of a probably different number of IMFs caused by adding different Gaussian white noise to the signal. In 2011, Torres et al. 41 proposed the complete ensemble empirical mode decomposition with adaptive noise (CEEMDAN) to solve the EEMDs’ faults. The CEEMDAN procedure has a different approach from EEMD, by adding a particular noise, at each stage, instead of adding white Gaussian noise, which is obtained with a unique residue after each IMF extraction. In addition, it has a proper spectral separation, increasing the level and reducing the time of decomposition. Recently, Mousavi et al. 42 proposed a combination of CEEMDAN-HT with ANN named CEEMDAN-HT-ANN to identify the damage and classify its severity in a laboratory-scale model of a steel truss bridge exposed to white noise excitations using different damage indices based on the extracted features from the IMFs, including energy, instantaneous amplitude (IA), unwrapped phase, and IF. The capability of the proposed damage detection approach was successfully concluded and the energy-based damage index performed more efficiently in detecting the damage compared to those based on the other features. The three aforementioned EMD-based techniques have been widely used in mechanical,43–47 geological, seismic signals, 48 and electrocardiogram (ECG) 41 application.
Motivation
The motivation for using the CEEMDAN in this study is to assess the potential advantages of this procedure in damage detection of a laboratory-scale model of a steel truss bridge using a series of the conventional and improved damage indices in comparison with the performances of the previous generations of EMD-based techniques. The originality and main contribution of this research article are highlighted as follows:
To demonstrate the advantage and application of an improved EMD-based technique called “CEEMDAN” in SHM of a steel truss bridge.
To evaluate the presence, location, and severity of damage using four extracted signal features including energy, IA, unwrapped phase, and IF.
To propose the improved damage indices based on the combinations of two statistical time-history features, including kurtosis and entropy features with the energy and IA features of the analyzed signal that has not been reported in SHM.
To study the performance of three generations of HHT-based techniques (i.e. EMD, EEMD, and CEEMDAN) based on extracted features for the first time in detecting the damage of the truss bridge, comparatively.
From an extensive study on the evaluation of signal features, the motivation of utilizing four conventional signal features, including energy, IA, unwrapped phase, and IF, is the high sensitivity of these features to the change of the structure stiffness (i.e. the occurrence of damage). That is, the change of the structure stiffness extremely affects the output results based on the aforementioned features. Although considerable research has been devoted to employing modal parameters in SHM and damage identification in civil engineering applications, this study evaluates the signal features extracted from EMD-based techniques in both time and frequency domains all at once.
To this end, CEEMDAN is applied to time-history records of the acceleration response of a steel truss bridge model experimentally established in a laboratory setting and subjected to a band-limited white noise excitation. Section “Theoretical background” of the article provides a brief overview of the relevant mathematical background of the specific signal processing approaches utilized in this study to analyze the experimental measurements. Section “Applications” of this article describes the experimental setup of the truss steel bridge as a case study and the application methodology of CEEMDAN in the damage detection process. Then, in section “Comparative study,” the IMFs from CEEMDAN, EEMD, and EMD techniques are compared to verify the advantages of CEEMDAN. Subsequently, CEEMDAN is utilized to decompose the captured signals and generate the proper IMFs, to extract the vital features of the signal, including the energy, IA, unwrapped phase, and IF before and after damage states. Section “Results and discussion” provides a discussion of the test results and an assessment of the sensitivity of different approaches in damage detection and quantification. The damage indices based on the extracted parameters are defined to evaluate the capability of CEEMDAN in damage detection. In addition, the damage indices based on IA, energy, and unwrapped phase calculated by CEEMDAN are compared with those from EMD and EEMD techniques. In addition, to further explore the sensitivity of the damage detection approach based on the CEEMDAN method, several improved damage indices are proposed based on the combinations of two statistical time-history features, including kurtosis and entropy features with the energy and IA features of the analyzed signal. It should be noted that the purpose of this article is not to demonstrate the disability of EMD and EEMD techniques that their performances in damage assessment have been proved in the literature. Furthermore, the HHT spectrum is utilized to visually detect, locate, and classify the severity of the damage in the truss in a time–frequency energy domain and the summary and conclusions are provided in section “Summary and Conclusion.”
Owing to the difficulties of analyzing nonlinear systems, most of the previous research works considered the linear damage detection scenarios. Despite assuming linear damage scenarios in most of SHM studies of different civil engineering structures for many years, it has been proven that the dynamic behavior of the structure will differ from that of the undamaged model when the damage occurs and progresses in a structure. 49
The vast majority of previous studies that assumed the structure as a linear system before and after damage used the traditional modal techniques that are usually based on classical linear theory. However, these traditional techniques are not promising for SHM of complex structures since they are not efficiently sensitive to localized damage boundary conditions, sensor locations, and other environmental effects due to their linearity assumptions.
To overcome these fundamental limitations of the modal methods, such as FFT with linearity assumptions, many research works in recent years have used HHT and EMD-based techniques50–57 as signal processing methods that do not have limitations of stationary and linearity. Indeed, the EMD incorporated the Hilbert spectrum method has been proposed to identify the dynamic characteristics of linear structures.
In this study, to perform non-destructive damage tests as a means of condition assessment, the damage scenarios are considered in linear processes. However, it should be noted that the vibration responses of the truss bridge in both healthy and damaged states under random white noise excitations that can represent vehicle-induced excitations are inherently dynamic nonlinear due to inherent material nonlinearity, clearance between structural parts, nonlinear damping due to screwed connections.
There exist many research works in the literature that adopted HHT, EMD-based, and WT-based18,50, 51 techniques for damage detection and localization of both linear and nonlinear vibration systems (particularly bridges) in which damage scenarios were designed by stiffness loss of truss bridge components or joints. Because, the EMD-based and HHT techniques are adaptive and these techniques have been used for both linear and nonlinear vibration systems for many years.58–61 Hence, the main reason for the use of EMD-based and HHT techniques in this study is that these techniques not only are adaptive with both linear and nonlinear vibration systems 58 but they also can localize any dynamic changes on the time and the frequency axis based on the calculated features of the IMFs, such as IAs and IFs.
Theoretical background
EMD technique is able to decompose any vibration signal into a set of simple intrinsic mode functions called “IMF.” Each of IMF has two conditions. The first one considers the number of extrema and zero-crossing either equal or differs only by one. In the second condition, the mean of the envelope of local minimum and the local maximum is zero (symmetrically) and it is locally symmetric. The theoretical basics of the EMD can be found in Huang et al. 20
Despite the major applications of EMD, it has a significant defect called mode mixing. To overcome this, Wu and Huang 38 proposed the ensemble empirical mode decomposition which was an improved method by adding an identically white Gaussian noise with appropriate scale and standard deviation. EEMD can diminish the mode mixing problem, by adding Gaussian white noise to the input signal. However, there exist some shortcomings, such as independence of the decomposition process of a sampled signal. This can be caused by the residual noise in IMF and deficiencies in the decomposition procedure. Also, there is a difficulty in averaging of a different number of IMFs caused by adding different white Gaussian noise to the signal. To overcome these drawbacks, CEEMDAN was proposed as described in the following section.
The EEMD has two major drawbacks: (1) residual noise in IMF and (2) difficulty in averaging of a different number of IMFs caused by adding different white Gaussian noise to the signal. Torres et al. 41 solved these faults by proposing the CEEMDAN. The CEEMDAN has a different trend from EEMD in adding a particular noise at each step of the decomposition process instead of adding the white Gaussian noise which is obtained with a unique residue after each IMF’s extraction. The procedure of the CEEMDAN algorithm has been described in detail in the previous work. 42 Since the EMD is an empirical method, it needs a trial and error procedure to obtain a good decomposition of the signal. Hence, CEEMDAN, EEMD, and EMD methods converge based on noise standard deviation (Nstd), the number of realizations (NR), and the maximum number of sifting iterations (MaxIter).
The procedure of the HHT developed by Huang et al. 20 includes two procedures. In the first procedure, the EMD decomposes a signal into a finite set of intrinsic components called IMF. Then, the HT is applied to each IMF to obtain IF and IA features.
Damage indices
In this article, a series of damage indices based on three signal features, including the energy, IA, and unwrapped phase extracted by EMD, EEMD, and CEEMDAN techniques, are used to detect, locate, and classify the severity of the damage in a laboratory-scaled model of a steel truss bridge. These damage indices compare the differences between the characteristics of the healthy and damaged states.
The damage index based on the energy feature has been widely used in the literature.62,63 Cheraghi and colleagues64,65 introduced a damage index based on the energy of the first IMF of the vibration signals. To obtain the energy of each IMF, the vibration of the structure in its healthy and damaged states is captured and decomposed by CEEMDAN. Then, the energy of the respected IMF for each sensor is calculated according to equation (1)
where the value of parameter E is a scalar. Finally, the energy damage index is defined as
The high scalar value of DI represents the existence, location, and severity of damage in the structure based on identified scenarios in the following sections. The same procedure is repeated for the IA parameter. However, this feature is extracted by applying the HT to each IMF and calculating the average of the desired IMF
where
According to Huang et al., 20 the calculation procedure of the unwrapped phase parameter (P) is based on the averaging of the IMFs’ phases produced by applying a HT to each IMF given as follows
where
In addition, two advanced statistical-based features, including kurtosis (Ku) and entropy (e) features that are calculated from the probability density function (PDF) of the vibration signal, are considered in this study. PDF is a statistical expression that describes a probability distribution of each member of a discrete set of values of a variable or range of outcomes. According to Caesarendra and Tjahjowidodo, 66 it is obvious that the occurrence of any changes in vibration signals and stiffness of the structure causes the change of PDF. Consequently, the kurtosis and entropy features would also be affected and used to establish an efficient statistical test in identifying abrupt changes in the response of structures. In particular, kurtosis and entropy calculate the peak value and the histogram of the PDF from the vibration signal, respectively. As such, since the kurtosis is obtained from the peak of the PDF of the vibration signal, 67 its value increases with any changes occurred in the PDF of vibration responses due to the appearance of damage. Therefore, to extract more sensitive indices and improve the performance of the aforementioned damage indices based on the energy and IA features, the combinations of two statistical damage indices, including kurtosis and entropy with the energy (E) and IA features extracted using CEEMDAN techniques, are proposed. To do this, instead of applying these statistical features to the original vibration signal, both of the kurtosis and entropy features are applied to the energy and IA time-histories extracted from the IMFs of the analyzed signal using CEEMDAN.
The kurtosis (Ku) feature which is more effective in analyzing the non-stationary signals can be calculated from the peak values of the PDF of a signal given as follows
where m and σ denote the mean and standard deviation of the sampled vibration signal. Therefore, the damage indices based on the combinations of the kurtosis with energy (DI(Ku (E)), and with IA (DI(Ku (IA))) features can be defined as given in equations (8) and (9), respectively
In addition, various damage detection and SHM based studies demonstrated the increment of entropy value with increasing the complexity of the vibration response of structures that indicate the existence of damage.68–70 The entropy (e) is known as another statistical feature that is dependent on the PDF of a vibration signal. This feature is calculated based on the histogram of the PDF and represents the uncertainty and the degree of randomness degree of a sampled signal given as follows
where p (xi) denotes the normalized histogram of the sampled signal xi. The damage indices based on the combinations of the entropy with energy (DI(e (E)) and with IA (DI(e (IA))) features can be defined as given in equations (11) and (12), respectively
Applications
Experimental setup
A 14-bay steel truss bridge with a span length of 5.6 m, as shown in Figure 1, which was experimentally established in the Qingdao University of Technology, is considered as a case study, according to the design specifications presented by the Smart Structures Technology Laboratory (SSTL) of the University of Illinois at Urbana-Champaign.
71
The length of all the horizontal and vertical members is 0.4 m on each side but the length of all diagonal members is 0.4
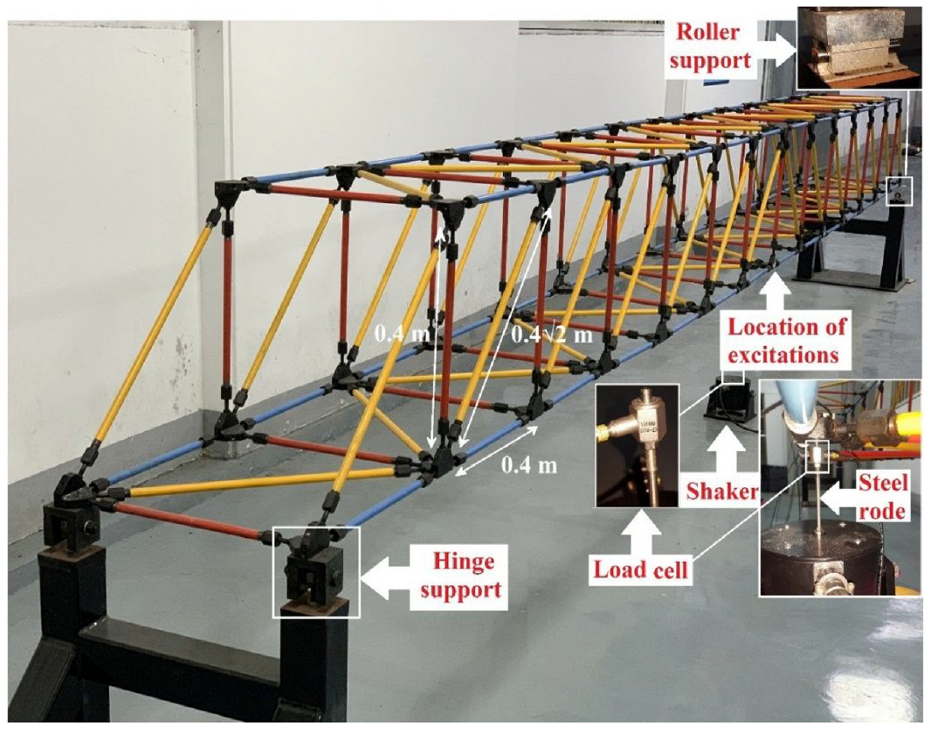
A perspective view of the truss in the laboratory.

Locations of the sensors and the damaged element on the truss bridge.
Procedure of the CEEMDAN damage detection method
An efficient damage detection approach is introduced based on vibration signal processing methods. To evaluate the performance of the CEEMDAN-based damage detection approach, at first, the vibrations at the identified accelerometer sensors of the steel truss bridge model subjected to a band-limited white noise are acquired in the healthy and damaged states. Afterward, the vibrations are decomposed using the CEEMDAN technique to generate the set of IMFs. Then, the HT is applied to the first IMF to extract four features, including energy, unwrapped phase, IA, and IF. Then, three different damage indices are defined based on the obtained vibration features from the healthy and damaged states, including IA, energy, and unwrapped phase. In addition, four improved damaged indices based on the combinations of kurtosis and entropy features with each of the energy and IA features are proposed. Finally, the defined damage indices and HHT spectrums are adopted to identify the presence, location, and severity of the damage in the truss. The flowchart diagram of the proposed methodology is shown in Figure 3. Each step of this flowchart will be described in detail in the “Result and discussion” section.

The framework of the proposed damage detection approach.
Comparative study
In recent years, the HHT has been successfully used as a signal processing tool in SHM and damage investigation. The EMD and EEMD methods were proposed many times in previous studies as efficient tools for the purpose of damage identification. To investigate the capability of the CEEMDAN method as a successful technique in damage detection, in comparison to the EMD and EEMD, these three methods are utilized to analyze the measured structural response before and after the damage. Before applying this step, some advantages of CEEMDAN are explored and compared to the EMD and EEMD. Figure 4(a)–(c) show the comparison of the power spectral density (PSD) of the acceleration response of Sensor 10 and IMFs 1–3, resulted from the three methods. The reasons for the use of PSD in this study are (1) to show at which frequency ranges, the variations of amplitude are strong, (2) to indicate the predominant frequencies and neglecting the noisy spectrum lines generated by FFT. Since the PSD of each IMFs was not observed in the same frequency range, the logarithmic scale with base 2 is applied to the frequency range to properly present the comparison on a large scale. In Figure 4(c), it can be observed that the frequency spectra of each mode obtained by CEEMDAN are less overlapped and obviously separated than those captured from EMD and EEMD in Figure 4(a) and (b), respectively. This means that the CEEMDAN can solve the mode mixing problem of EMD and EEMD. In addition, the number of sifting iterations by CEEMDAN is about half of those from EEMD and EMD. Hence, CEEMDAN reduces computational time.

Spectra of IMFs 1–3 captured by (a) EMD, (b) EEMD, and (c) CEEMDAN.
Figure 5 shows the 6 s of the acceleration response of Sensor 12 before the damage. The first three natural frequencies of the bridge are 19.53, 40.16, and 60.55 Hz, and the corresponding natural period times T1, T2, and T3 are 0.051, 0.025, and 0.016 s, respectively. Hence, considering 1.0 s of the acceleration response of the bridge (≈ 20 T1) is reasonable to analyze in this study, as shown in Figure 6. In addition, the first three IMFs from an example acceleration response of Sensor 12, decomposed by the three methods of EMD, EEMD, and CEEMDAN, are compared in Figure 6. It is observed that CEEMDAN detects the spikes due to varying frequencies during the decomposition process more clearly compared to those from EMD and EEMD. Indeed, EMD and EEMD are not able to accurately reproduce the acceleration response of the truss. That is, the IMFs produced by CEEMDAN preserve the main characteristics and behaviors of the original signal, such as the spikes and intensity of signal better than those obtained by EMD and EEMD. Note that CEEMDAN is the least affected by the mode mixing problem in decomposition. The following sections assess the application and performance of CEEMDAN compared to EEMD and EMD techniques in damage detection of the truss bridge.

Acceleration response of Sensor 12 in a healthy state of the bridge.
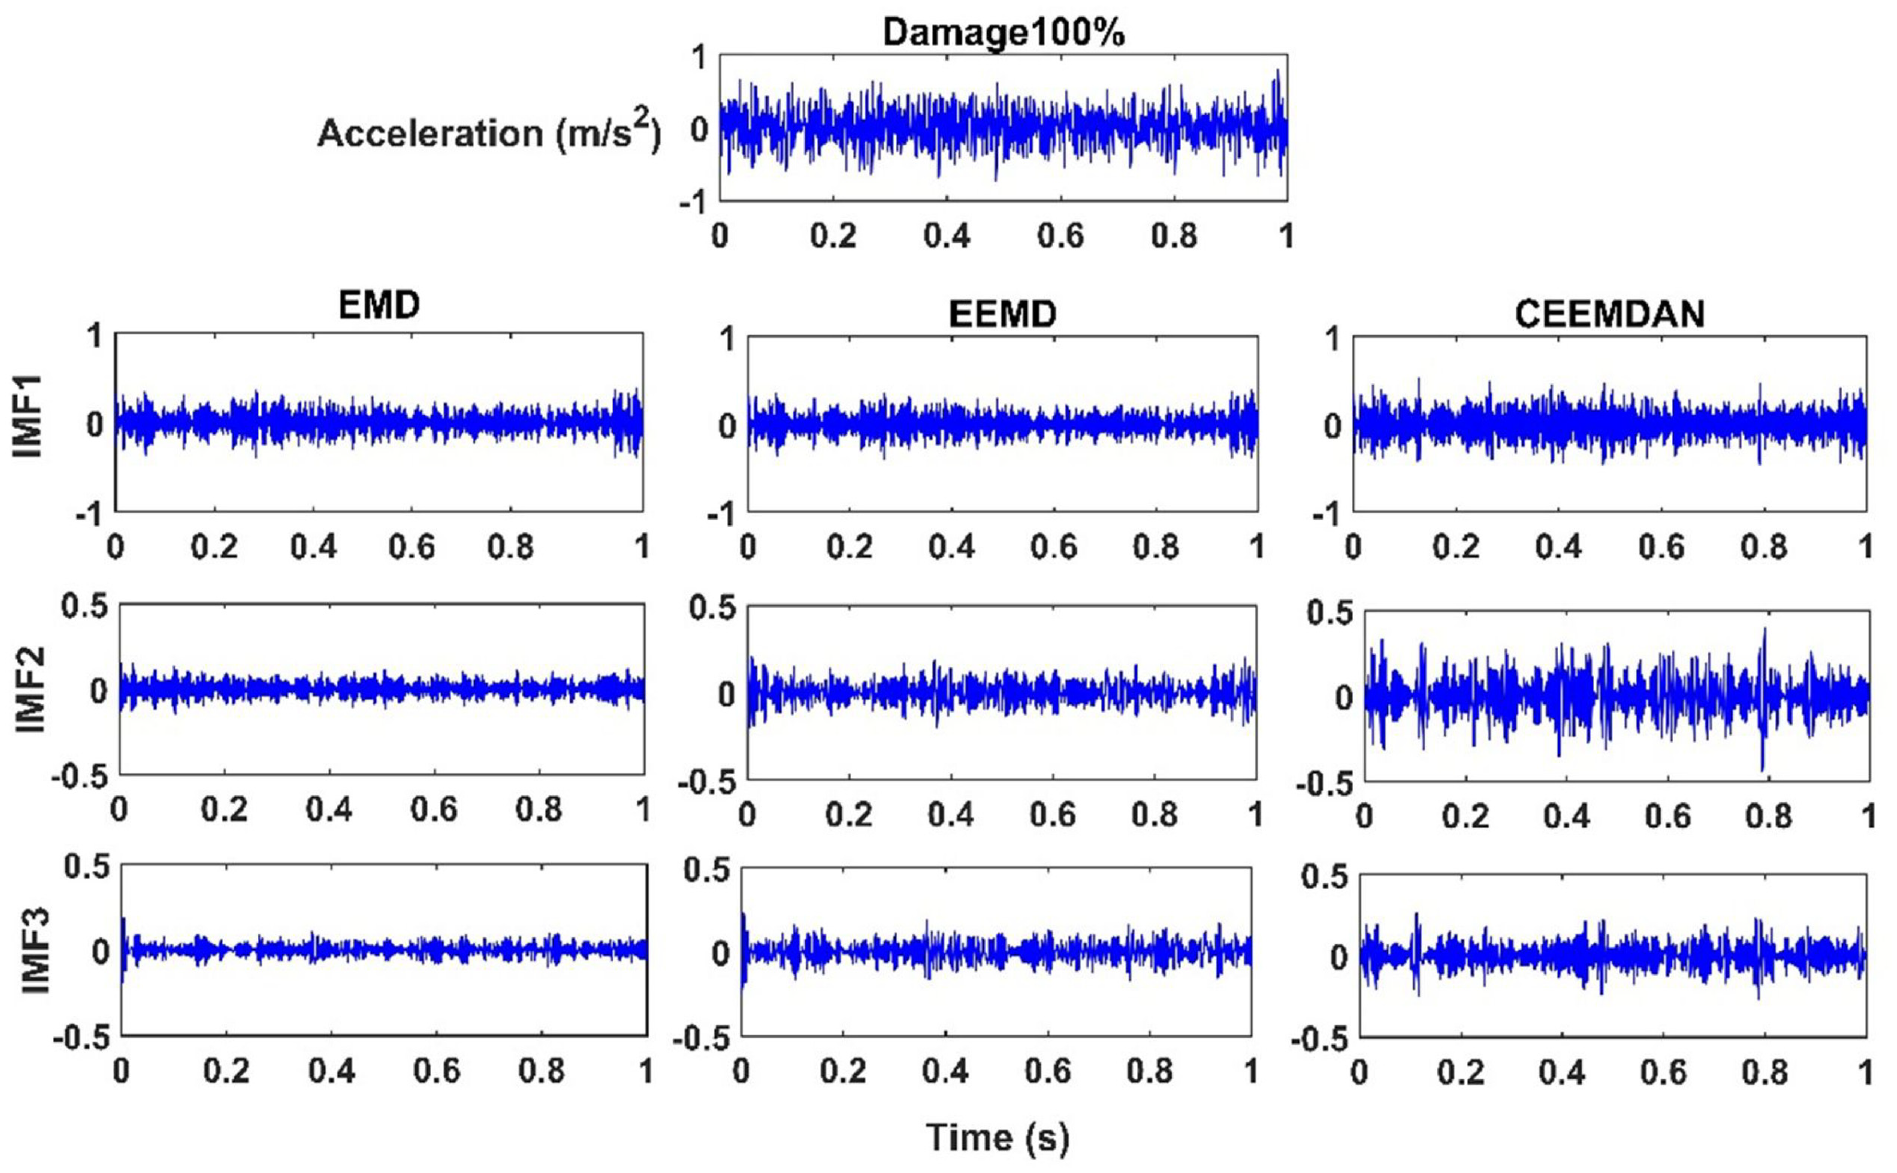
Comparison of IMFs from EMD, EEMD, and CEEMDAN for Sensor 12.
In addition to the aforementioned advantages of CEEMDAN in solving the mode mixing problem, CEEMDAN also can preserve the original information of the analyzed signal. That is, the CEEMDAN presents a complete decomposition approach with an exact reconstruction of the original signal by summing the generated mode components as given in Torres et al. 41 Due to this decomposition completeness of the CEEMDAN, this method can preserve the original information of the analyzed signal, such as the intensity of the IMFs and existing sensitive spikes in the behaviors of the amplitude and energy features of the IMFs. In addition, the lower energy from the EMD and EEMD methods is also because of the effects of averaging overall realizations during the production of modes (that are independently produced from other realizations) while a large variation can exist in the number of modes. Accordingly, the CEEMDAN is significantly able to recover some information on the EMD properties lost by EEMD, such as completeness and fully data-driven number of modes. Therefore, it is expected that the results from the CEEMDAN have more intensity than those from EMD and EEMD methods.
To confirm this completeness and reconstruction effects of the CEEMDAN, Figure 7(a) shows the reconstruction errors computed as the difference between the acceleration signal recorded by Sensor 12 (Figure 6) and the sum of the modes using CEEMDAN in comparison with those from EEMD and EMD. It is seen that the maximum amplitude of the reconstruction error computed using CEEMDAN is very marginal compared to those from EMD and EEMD methods. Hence, the CEEMDAN represents a more sensitive approach compared to the previous generations of EMD technique. In addition, by comparing the reconstruction errors computed for the first three IMFs as the difference between the acceleration signal and each IMF in Figure 7(b), it is obtained that the first IMF can more significantly reserve and reconstruct the information of the original signal compared to IMFs 2 and 3. Therefore, the intensity of the IMF1 and the corresponding features are larger than those derived from EMD and EEMD.

Reconstruction errors for (a) CEEMDAN compared to those of EMD and EEMD, (b) IMF1 compared to those of IMFs 2 and 3 decomposed using CEEMDAN.
Results and discussion
Detection of the presence and severity of damage
In this section, first, the existence and severity of the damage are studied by investigating the results from different damaged states (damage scenarios) of the bridge. To do this, three different damage levels are considered by reducing the cross-section stiffness (i.e. the moment of inertia). In this study, the damage states of the truss are implemented by reducing cross-section stiffness of the diagonal element identified in Figure 2 (dashed line) and replacing with three different damaged elements. The reductions of the cross-sectional moment of inertia of these damaged elements in percentage terms are (1) 35% in which the outer and inner diameters are 16 and 10 mm, respectively, as shown in Figure 8(a), (2) 60% in which the outer and inner diameters are 14 and 8 mm, respectively, as shown in Figure 8(b), and (3) 83% in which the diameter of the bar element is 11 mm, as shown in Figure 8(c). In addition, the axial stiffness reductions of these damaged elements are 14%, 27%, and 33%, respectively.
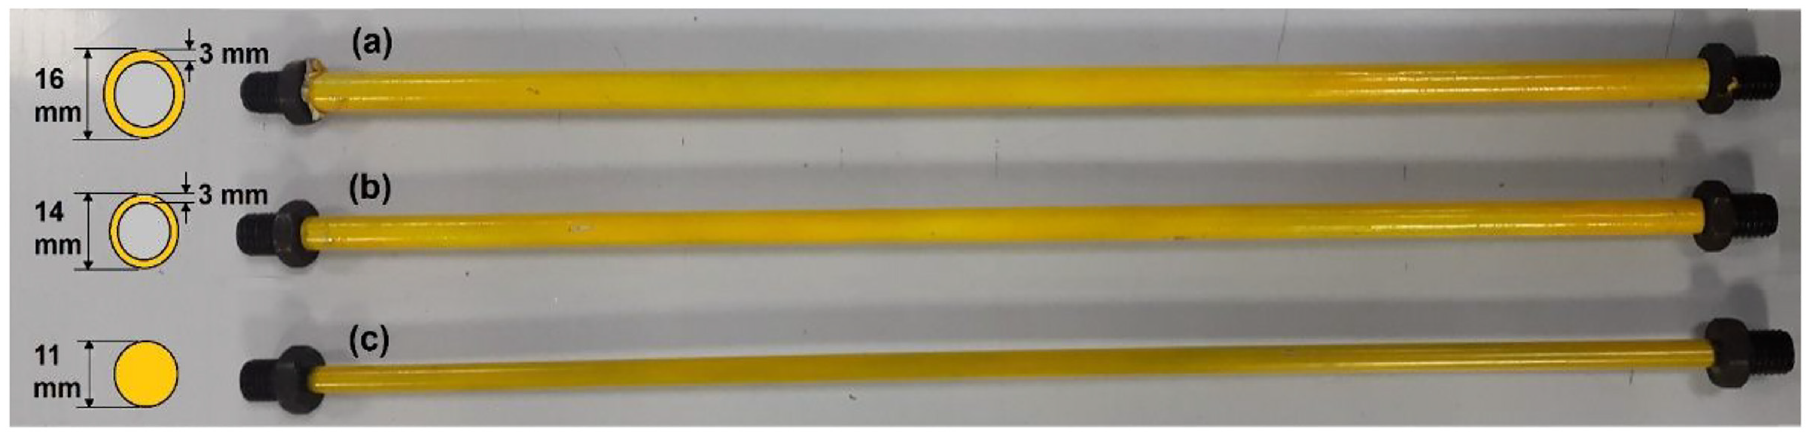
Details of the damaged elements with (a) 35%, (b) 60% and (c) 83% cross-sectional (i.e. the moment of inertia) stiffness reductions.
It is noteworthy that other structural parameters and loading conditions are kept constant for all the scenarios studied in this article. In addition, the end conditions of the elements are not changed by replacing the elements with different cross-sections. In this case, the elements are adjusted using identical screws and hinges (with identical sizes) that have been fixed to the joints. Therefore, replacing different elements does not cause the variations of the end conditions and consequently has no significant effects on the structural responses. To detect the presence and severity of the damage in the truss, Sensor 10 is selected as an example checkpoint located nearby the damaged element. Under these conditions, the first IMF extracted by the CEEMDAN, EEMD, and EMD techniques from the acceleration response of Sensor 10 is presented before (i.e. healthy) and after damage states of the structure with levels of 35%, 60%, 83%, and 100%.
In Figure 9, the damage spikes are significantly seen in the time-history behavior of IMFs for the damaged cases of the structure. By comparing the results of the first IMF extracted by CEEMDAN, EEMD, and EMD techniques, it is observed that the difference between the intensity of spikes of the IMFs becomes more pronounced with increasing the damage level especially in the result from CEEMDAN. Furthermore, the values of the RMS, which represent the total behavior of the IMFs, increase with increasing the damage level. Although these observations can show the superiority of CEEMDAN compared to EEMD and EMD techniques in the detection of the damage, more accurate calculations based on the main features of the signal are required. Consequently, the HT is applied to the captured IMFs from the sensors, before and after damage, to extract four significant features, including the energy, IA, unwrapped phase, and IF. Figure 10 shows the energy of the first IMF extracted from CEEMDAN, EEMD, and EMD techniques calculated by equation (1) for the acceleration response of Sensor 10, for healthy and different damaged states of the structure.
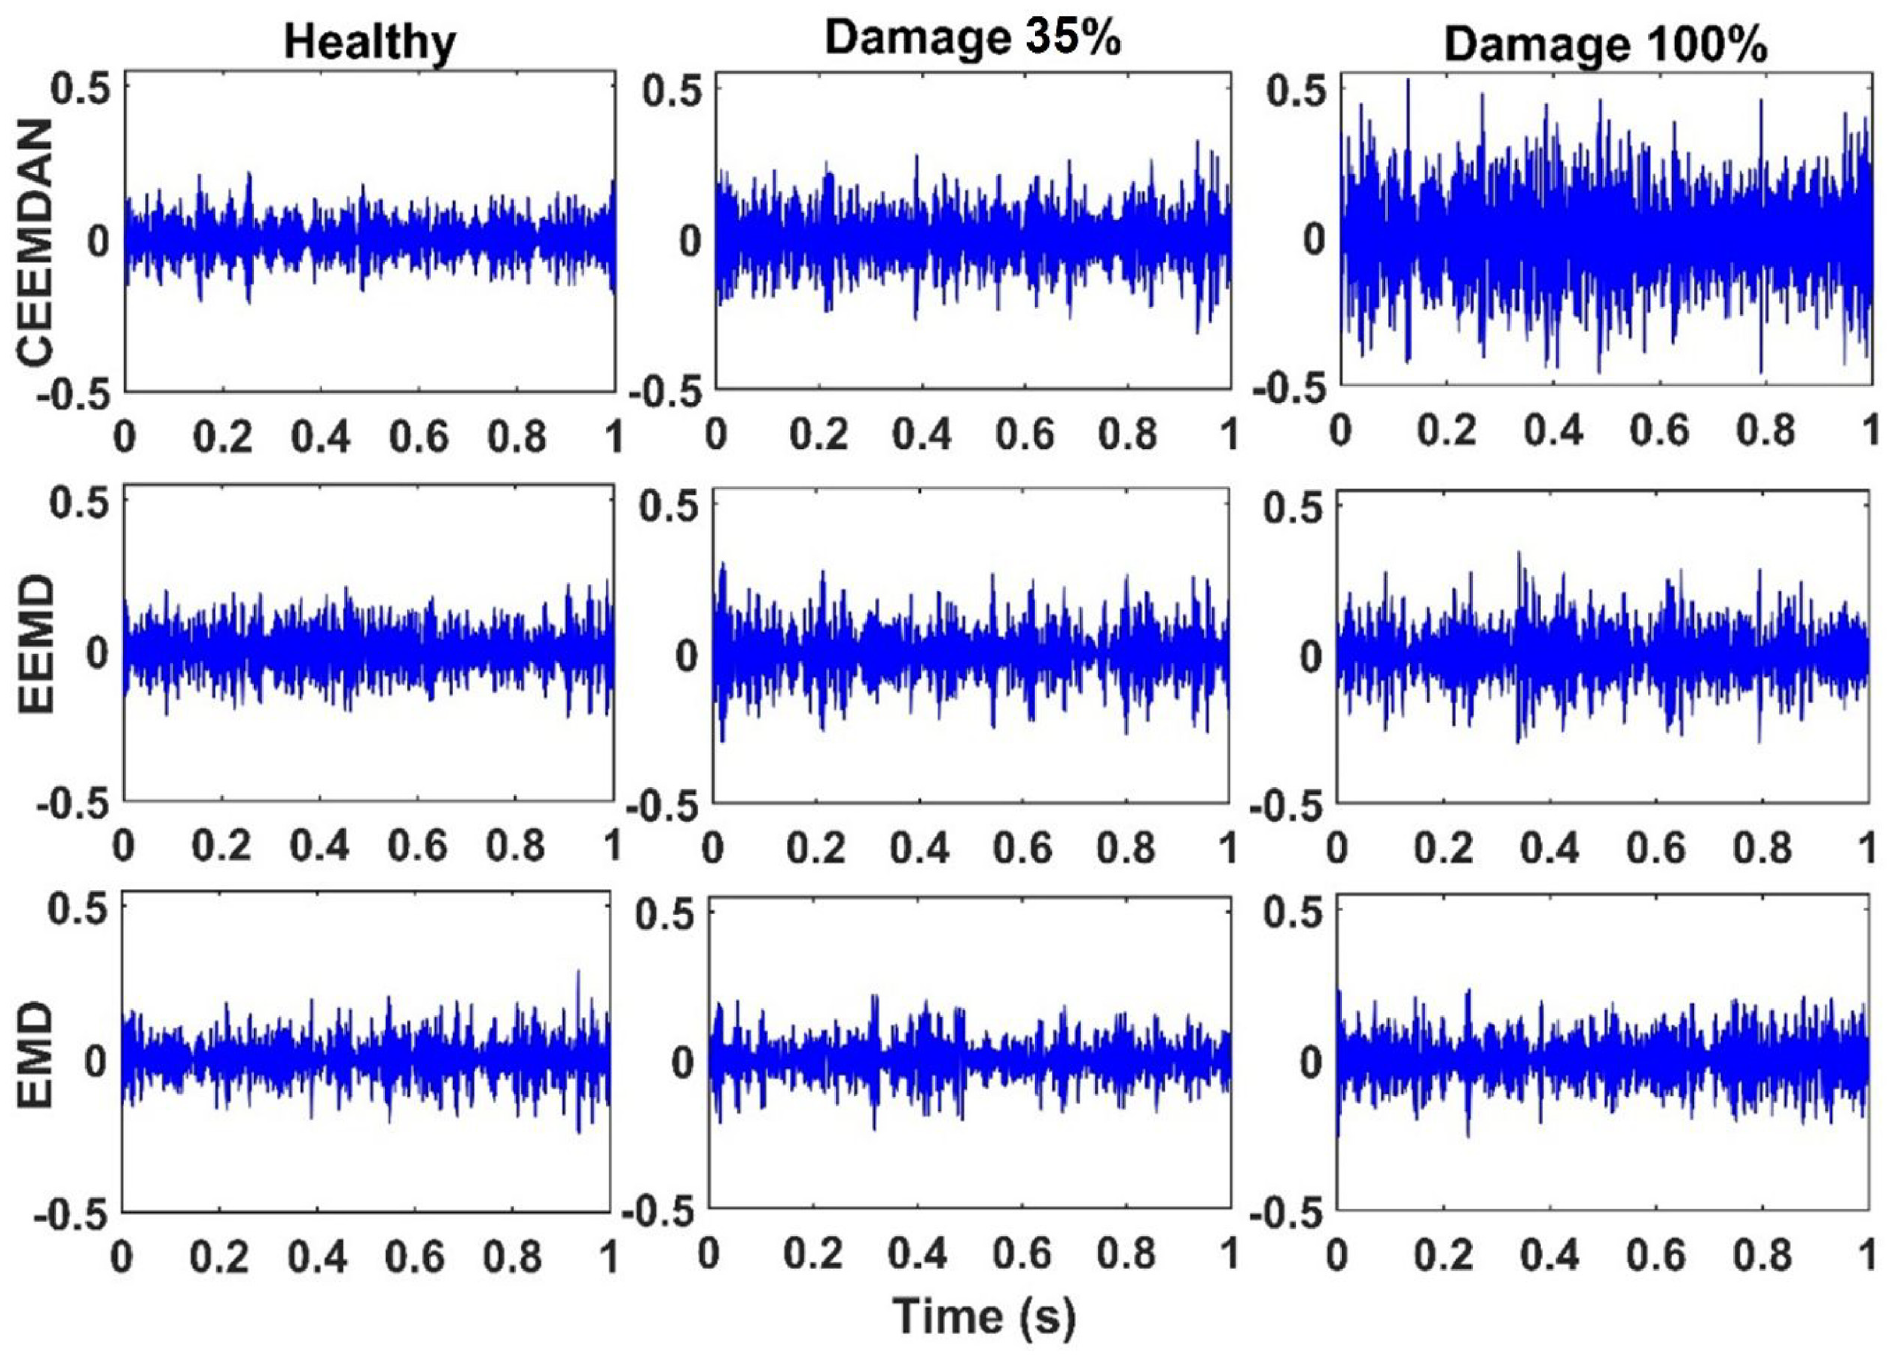
The first IMF results extracted by CEEMDAN, EEMD, and EMD techniques for Sensor 10 for healthy and different damaged states of the structure.
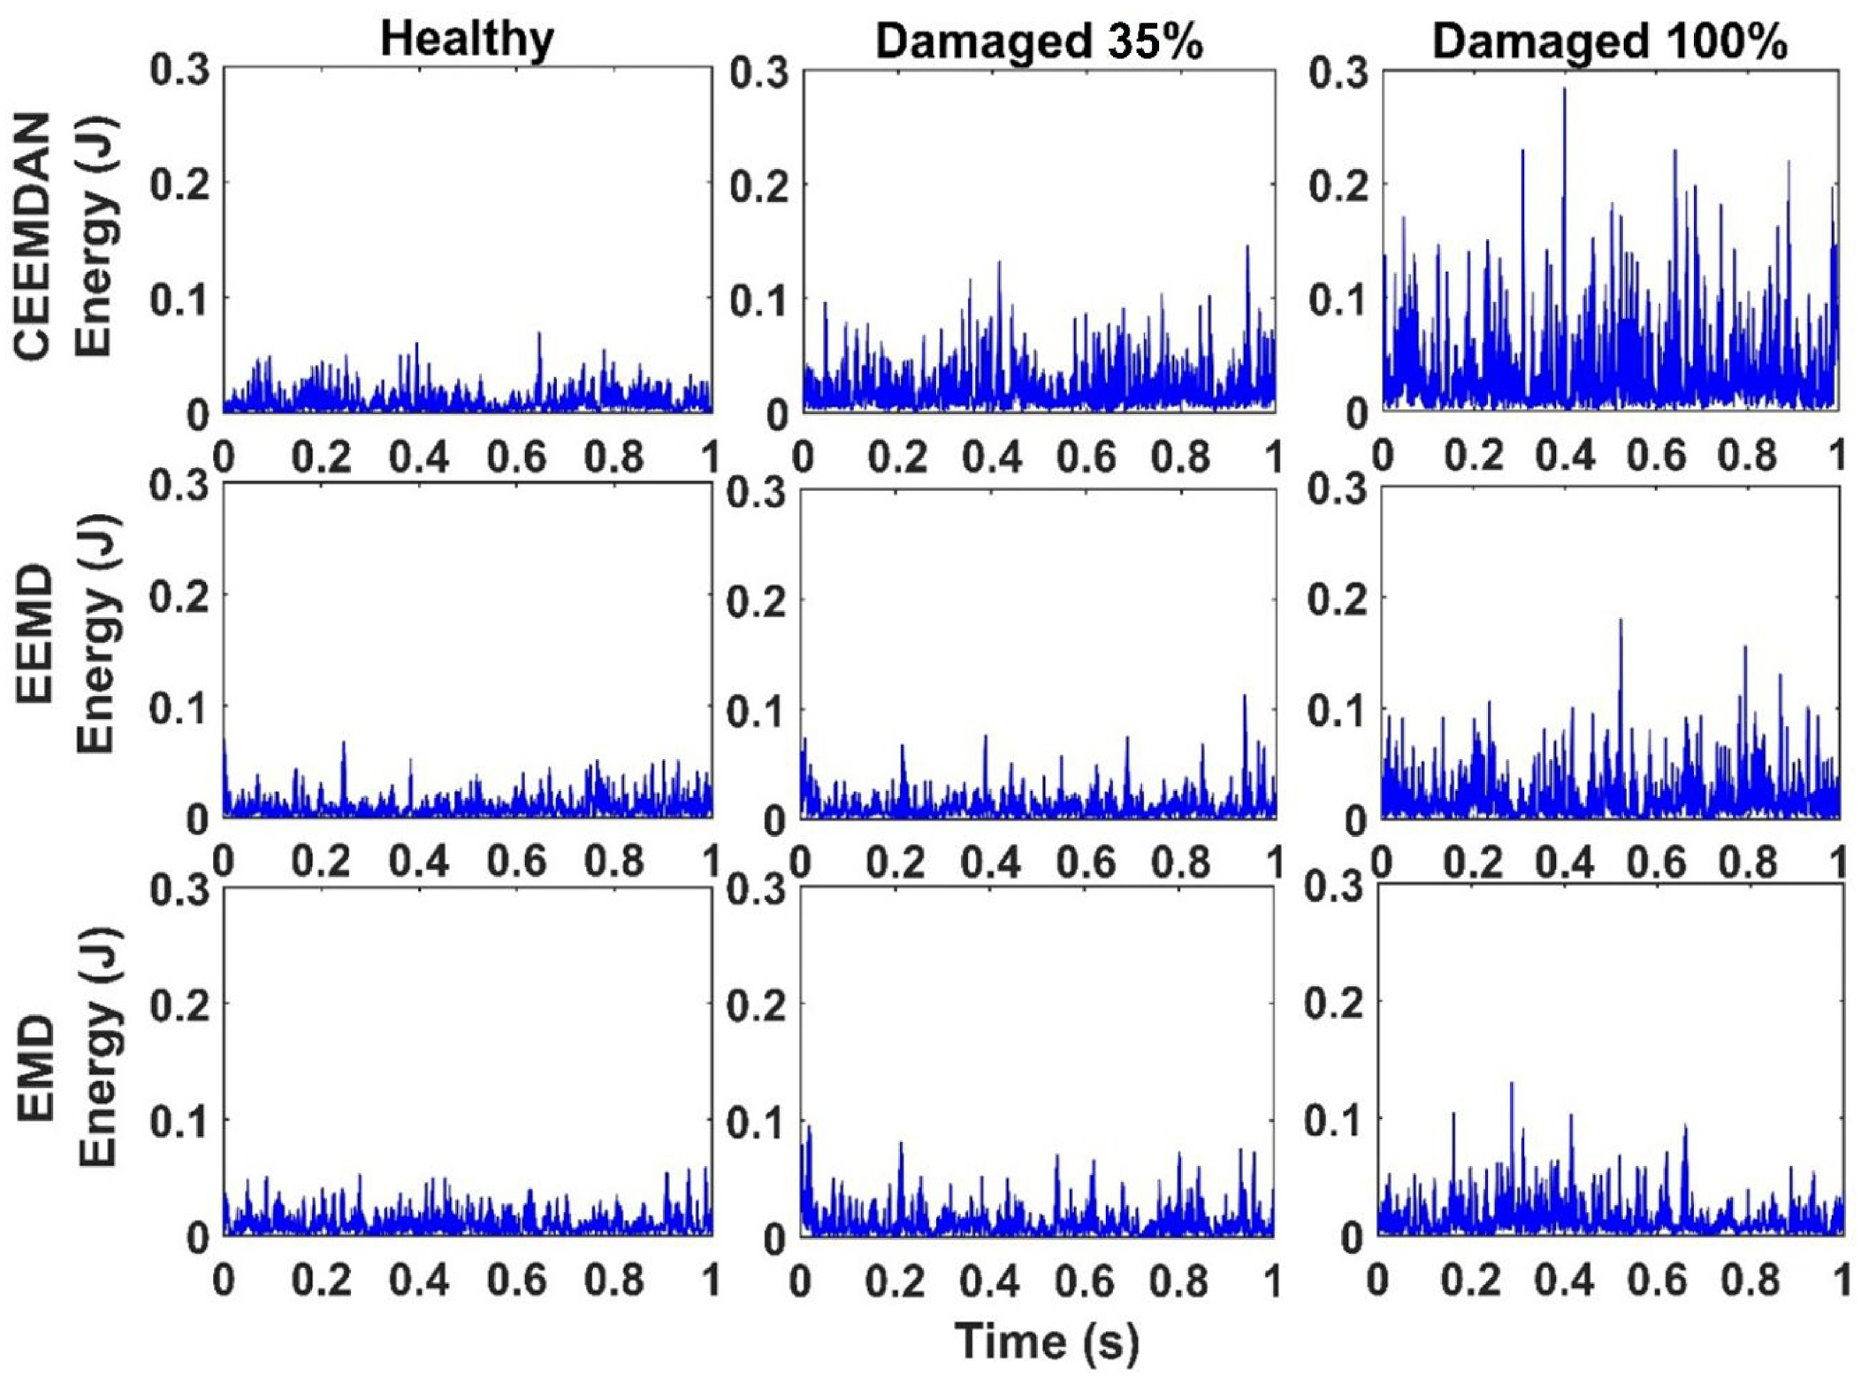
The first IMF’s energy of Sensor 10 extracted by three techniques for healthy and different damaged states of the structure.
The increase in the energy is observed in proportion to the increase in the damage level. Moreover, it is obviously seen that the energy output extracted by CEEMDAN is more sensitive to the increase in the damage level compared to those of EMD and EEMD. Figure 11(a) illustrates the damage index results based on the energy feature of the first IMF computed using equation (2) by three EMD-based techniques for the acceleration responses recorded by all the sensors. It is seen that the energy-based damage index values calculated for all the damaged levels using CEEMDAN are about two times greater than those from EMD and EEMD techniques. Therefore, more sensitivity of the CEEMDAN technique in detecting the presence of the damage in the vicinity of Sensor 10 is concluded compared to other techniques.

Comparing the damage index results computed based on the (a) the energy of the first IMF (DI(E)), (b) the kurtosis of the energy feature of the first IMF (DI(Ku (E))), and (c) the entropy of the energy feature of the first IMF (DI(e (E))), using three techniques for the vibration responses of the bridge in different damaged states.
In addition, the damage index results computed using equations (8) and (11) based on the combinations of the kurtosis and entropy features with the energy feature of the first IMF of the acceleration responses recorded by all the sensors are illustrated in Figure 11(b) and (c), respectively. It is seen that the trend of the curves of the improved damage indices (i.e. those computed from the statistical information of the energy of the first IMF) is more concentrated around the damage location (i.e. Sensor 11) compared to those directly computed from the energy feature of the first IMF. Therefore, it is obtained that the CEEMDAN results not only capture higher damage index values compared to other techniques but also the proposed damage indices are able to result in more sensitive trends in detecting the presence and location of the damage.
Moreover, the IA feature is also assessed as another signal feature of the first IMF extracted by CEEMDAN, EEMD, and EMD techniques. In Figure 12, it is seen that the intensity of IA resulted from all three techniques increases with the increase in the damage level. However, the enhancement of IA resulted from CEEMDAN is more obvious compared to EEMD and EMD. To quantitatively investigate the sensitivity of the CEEMDAN to the presence and location of the damage in the truss in a more effective manner, the damage indices based on the IA feature of the first IMF of all the sensors from three techniques are computed using equation (4) and the results are illustrated in Figure 13(a). It is seen that the damage index values from CEEMDAN are significantly higher (about two times) than those of EMD and EEMD.

The IA of the first IMF of Sensor 10 extracted by three techniques for healthy state and different levels of the damage.
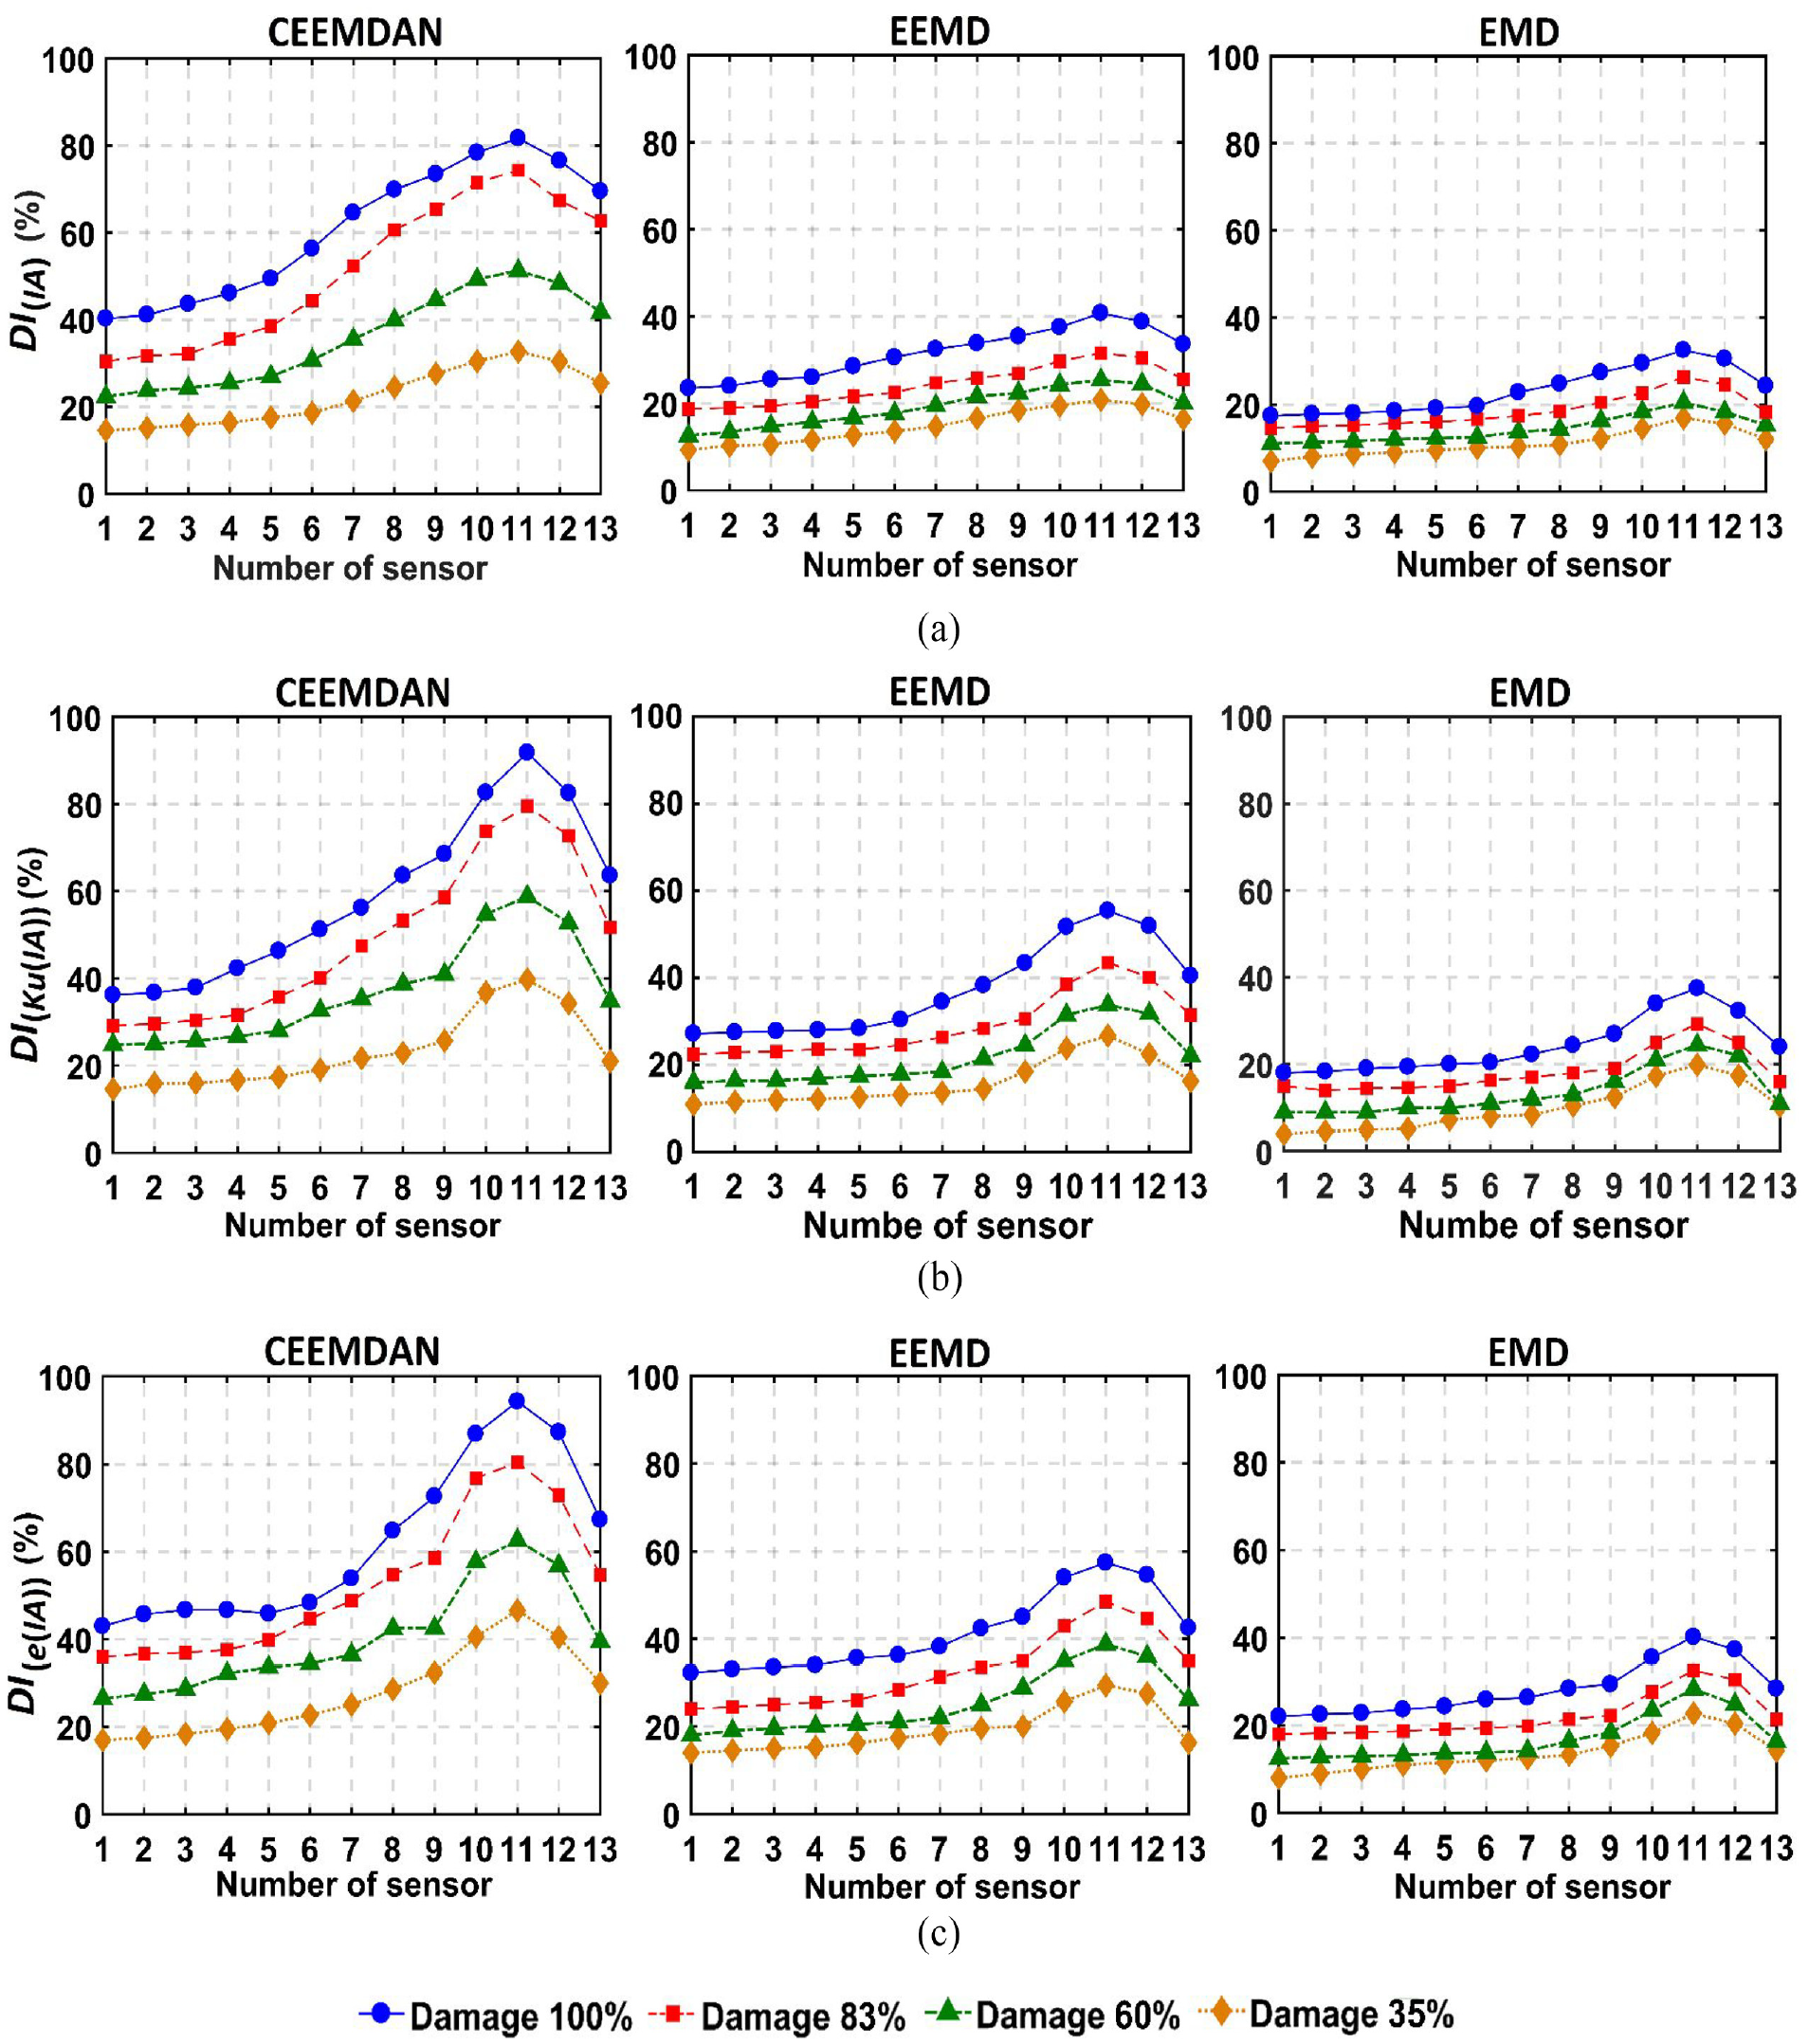
Comparing the damage index results computed based on (a) the IA of the first IMF (DI(IA)), (b) the kurtosis of the IA of the first IMF (DI(Ku (IA))), and (c) the entropy of the IA of the first IMF (DI(e (IA))), using three techniques for the vibration responses of the bridge in different damaged states.
In Figure 13(b) and (c), the damage index results based on the kurtosis and entropy of the IA of the first IMF of all the sensors computed using equations (9) and (12), respectively, are illustrated. It is seen that the damage index curves have a similar trend to those observed in Figure 11(b) and (c). This means that the CEEMDAN technique is not only more sensitive to the presence and location of the damage compared to EMD and EEMD but also its sensitivity becomes more pronounced when utilizing the improved damage indices based on the statistical information of the IA feature. The reason for the higher sensitivity of the proposed hybrid damage indices compared to those based on pure energy and IA features is related to the use of PDF expression by kurtosis and entropy features. This option causes the increase in the sensitivity of the indicator to any changes (even slight changes) in the analyzed vibration signal due to the stiffness change of the structure. Besides, as mentioned in section “Introduction” and proven in section “Comparative study,” the major advantages of the CEEMDAN are its completeness and reconstruction effects in the processing of a vibration signal that consequently preserves the dynamic information of the original signal, such as peak values and sudden spikes. Hence, applying these statistical-based features to the energy and IA features extracted by CEEMDAN results in more sensitive damage index values compared to those of EMD and EEMD.
In addition, the effectiveness of adopting the CEEMDAN compared to EEMD and EMD in classifying the severity of damage using the unwrapped phase feature is assessed in Figure 14. It is obvious that the unwrapped phase of the first IMF decreased and their deviation relative to the healthy unwrapped phase increased as the level of damage increases. Moreover, by comparing the results illustrated in Figure 14(a)–(c), it is found that the CEEMDAN has substantially positive influences on detecting and classifying the damage severity compared to those from EEMD and EMD. Accordingly, a damage index based on the deviation of damage states (35%, 60%, 83%, and 100%) relative to the healthy unwrapped phase is defined as given in equation (6). The results from the damage index based on the unwrapped phase of the first IMF of all sensors analyzed using three techniques are illustrated in Figure 15 for different damage states of the bridge. The results demonstrate the enhancement in the value of the damage indices with increasing the damage level using the CEEMDAN technique. However, it is obtained that EMD and EEMD are not accurately able to classify the levels of damage. Besides, although the EEMD succeeds to classify the damage level, EMD fails in this assessment and cannot present an efficient performance in classifying the damage severities compared to the CEEMDAN.

Comparison of the first IMF’s unwrapped phase of Sensor 10 by (a) EMD, (b) EEMD, and (c) CEEMDAN technique under four damage severity and healthy state of the bridge.

Comparing the damage index results among three techniques computed based on the unwrapped phase (DI(P)) of the first IMF of all sensors for different damaged states of the bridge.
The IF is considered as another feature to detect the severity of damage through the HHT spectrum. This approach presents the IF of IMFs in a time–frequency domain with a sampling frequency of 500 Hz. The reason for adopting the HHT spectrum in this study is to demonstrate both IA and IF features of the analyzed data in a time–frequency energy domain with high resolution. There exist many research works in the literature utilizing HT spectrums to detect the damage in linear systems. 49 The use of IF by HT spectrums has several key advantages including (1) the recognition of frequency variations within one period, (2) the identification of both inter-wave and intra-wave frequency modulations in a wave train which cannot be obtained using Fourier spectral analysis (i.e. Fourier spectral analysis can only capture the inter-wave frequency modulation), and (3) the ability to simulate the nonlinear and non-stationary data
According to the literature,18,49,53,72 it has been proven that the energy of HHT spectrums and the vibration magnitude increase at lower frequency ranges with the increase in damage level due to the stiffness loss of the structure. In other words, the damaged structure exhibits different degrees of frequency lowering which represents the presence of structural nonlinearity in the system caused by stiffness loss. This frequency reduction behavior is due to the decrease in the square root of the stiffness of structure in the presence of the damage. 53
Figure 16(a)–(c) illustrates the energy spectrum of the IMFs in the time–frequency domains for the bridge in healthy and different damaged states. It is seen that the energy density of IMFs increases in the spectra in approximately the range of 0–20 Hz, with increasing damage level. In other words, the frequency has a high power between the ranges 25 and 30 Hz for the healthy state of the truss (see Figure 16(a)), as the level of damage increases, the energy density of normalized frequency increases in lower ranges (between the ranges 5 and 15 Hz) especially for 100% damage level as observed in Figure 16(c). In addition, the 3D spectrograms of the IMFs are presented in Figure 17(a)–(c) to show the HHT spectrums with high resolution in which the amplitude of the signal is given in a time–frequency domain with a sampling frequency of 500 Hz and the overlapping windows are 100 samples in length. In Figure 17(b) and (c), it is seen that the intensity (power) of IF increases in the low-frequency range when the level of damage increases.
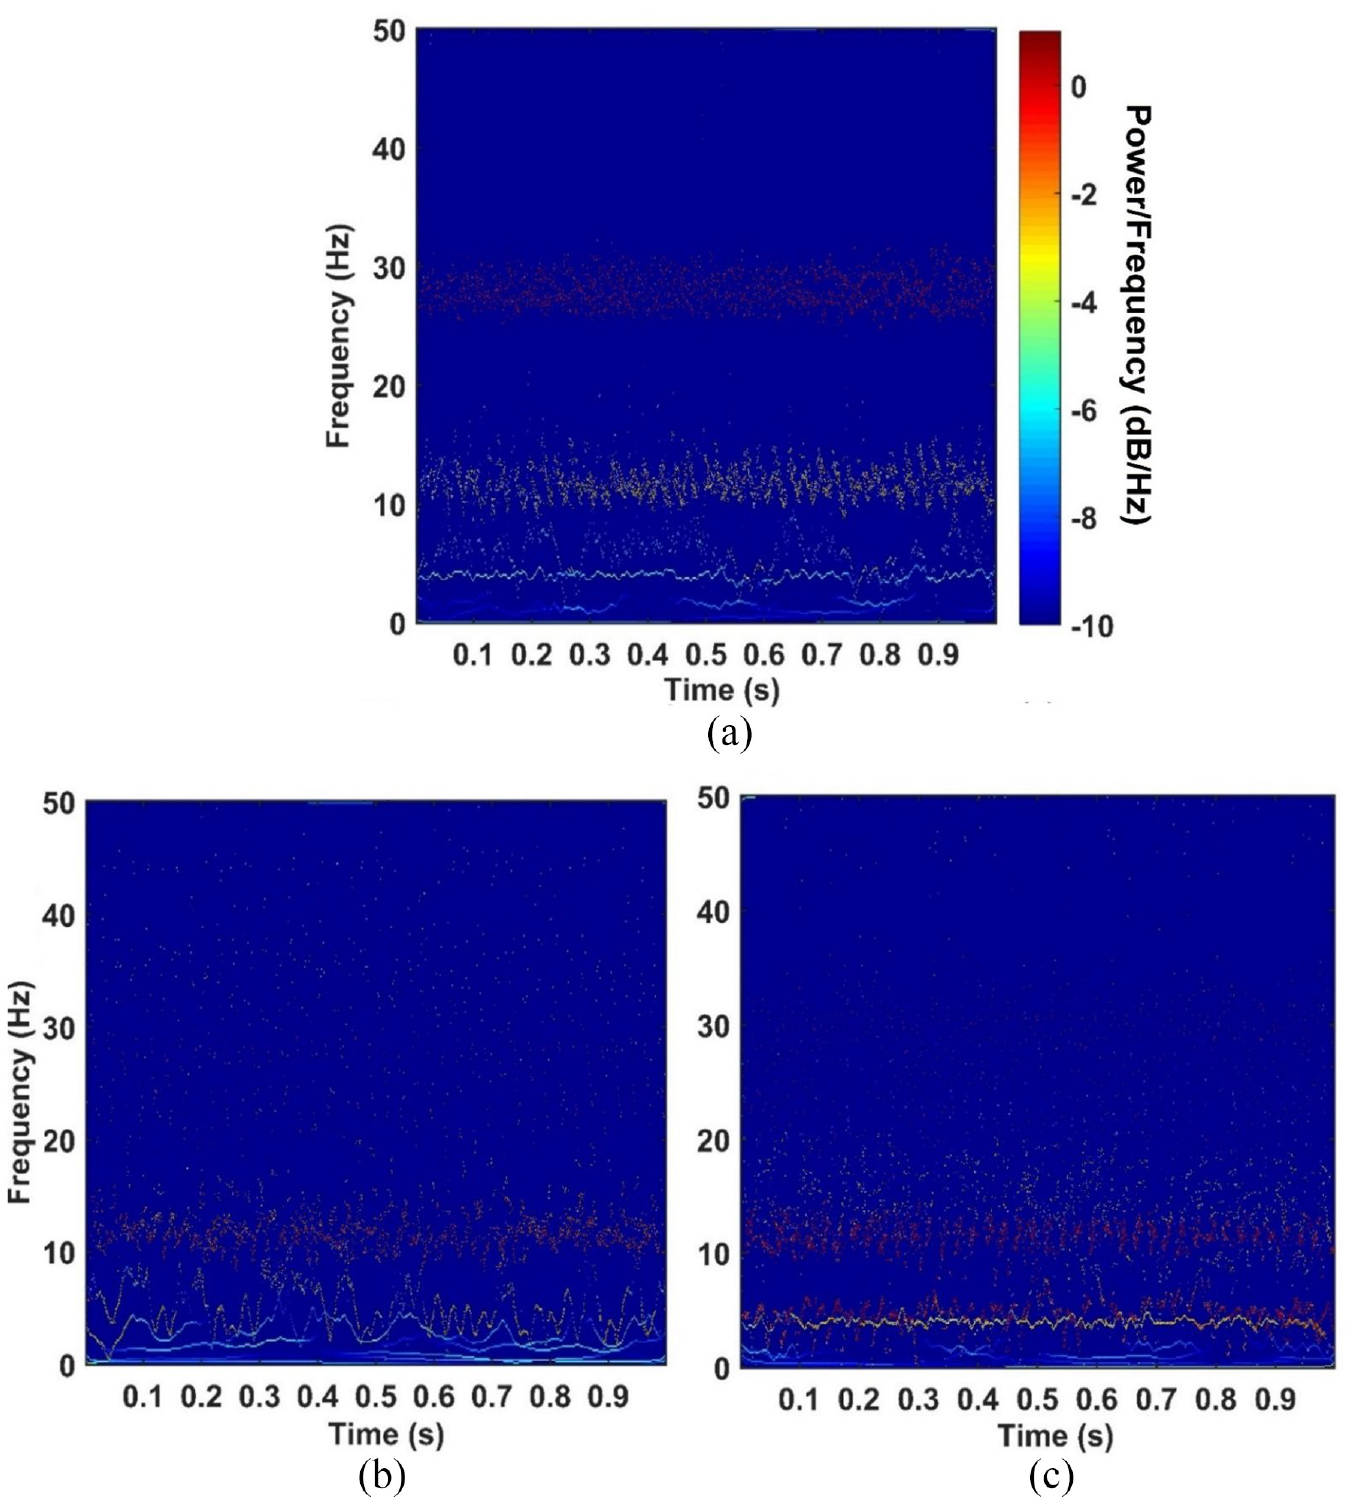
HHT spectrum of the Sensor 10 by CEEMDAN for different states of the truss including (a) healthy, (b) 35% damage, and (c) 100% damage.

Spectrograms of the IMFs of Sensor 10 for three states of the bridge including (a) healthy, (b) 35% damage, and (c) 100% damage.
Detection of damage location
In this section, the merit of the CEEMDAN-based damage detection approach in identifying the location of damage in the truss is assessed. To do this, the vibration responses of the structure in the healthy and damaged states acquired from different four sensors of 11, 9, 4, and 1 which are the nearest, the second near, far and the farthest sensors relative to the damaged element (as shown in Figure 2), respectively, are analyzed. It is noteworthy that only a damage scenario with a 100% damage scenario is considered in this section by removing a diagonal element from the truss as identified in Figure 2. Thereafter, the collected vibrations from the aforementioned sensors are decomposed by CEEMDAN, EEMD, and EMD techniques, as shown in Figure 18.
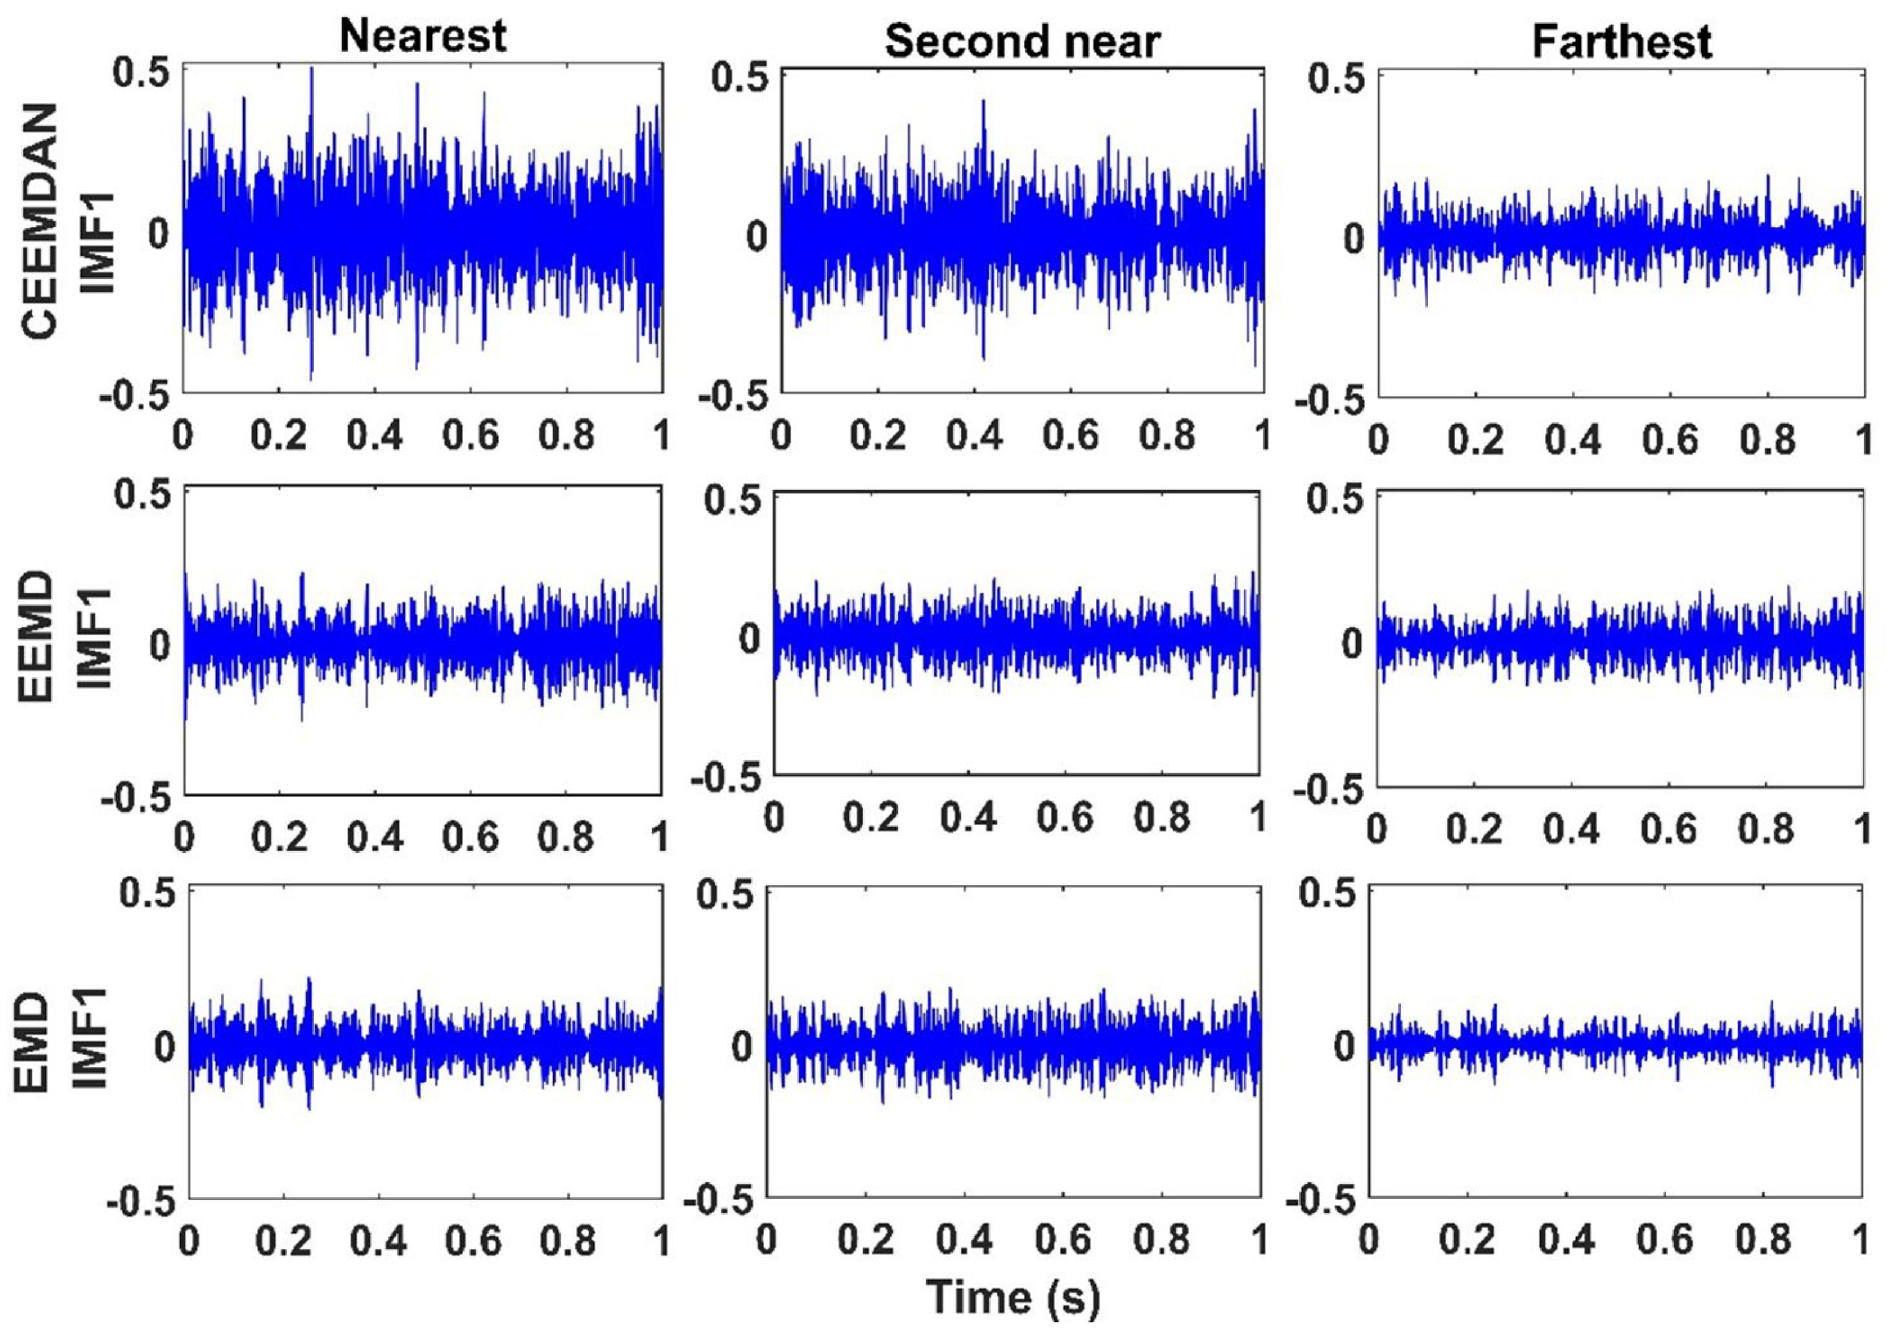
The first IMF results extracted by CEEMDAN, EEMD, and EMD techniques for different sensor locations.
In this study, it is noteworthy that the responses of the truss are acquired from the sensors attached to the joints of the lower chord of the bridge with a uniform distribution, not directly from the elements. Due to the existing limitations for the arrangement of the sensors on the elements of the laboratory-scaled truss bridge (because of lower-dimensional elements), a uniform distribution was selected in this study. Although the joints are also common locations for the attachment of sensors, an exact determination is more convenient and possible for full-scale bridge structures by attaching the sensors on the elements with higher dimensions.
By comparing the first IMF from the three techniques in Figure 18, it is observed that the intensity of spikes and the RMS value of the first IMF for closer sensors to the damaged element are greater than those of sensors located at farther distances. Furthermore, the energy of IMFs increases with decreasing the distance of the sensors from the location of the damaged element as shown in Figure 19. These higher spikes in the behaviors of the first IMF and its energy around the location of the damage (at Sensor 11) lead to larger damage index values (about two times) compared to those from other techniques according to equation (2) that can be clearly seen as shown in Figure 11. The theoretical reasons for observing these notable spikes and enhancement trends in the behaviors of the first IMF and its energy feature for closer sensors to the damage location resulted from CEEMDAN are due to the completeness of this technique in decomposing the original vibration signal with an exact reconstruction compared to EMD and EEMD. As discussed in section “Comparative study,” the CEEMDAN is able to preserve the key information of the original signal, such as the peak values of IMFs and existing sensitive spikes in the behaviors of the amplitude and energy features of the IMFs occurred owing to the stiffness changes of the structure. However, lower values of the RMS and energy feature resulted from the EMD and EEMD methods are related to the averaging operation adopted by these techniques overall realizations during their decomposition processes to produce the signal components that lead to a large variation in the number of modes. More explanations on the theoretical advantages of the CEEMDAN compared to EMD and EEMD can be found in section “Comparative study.”
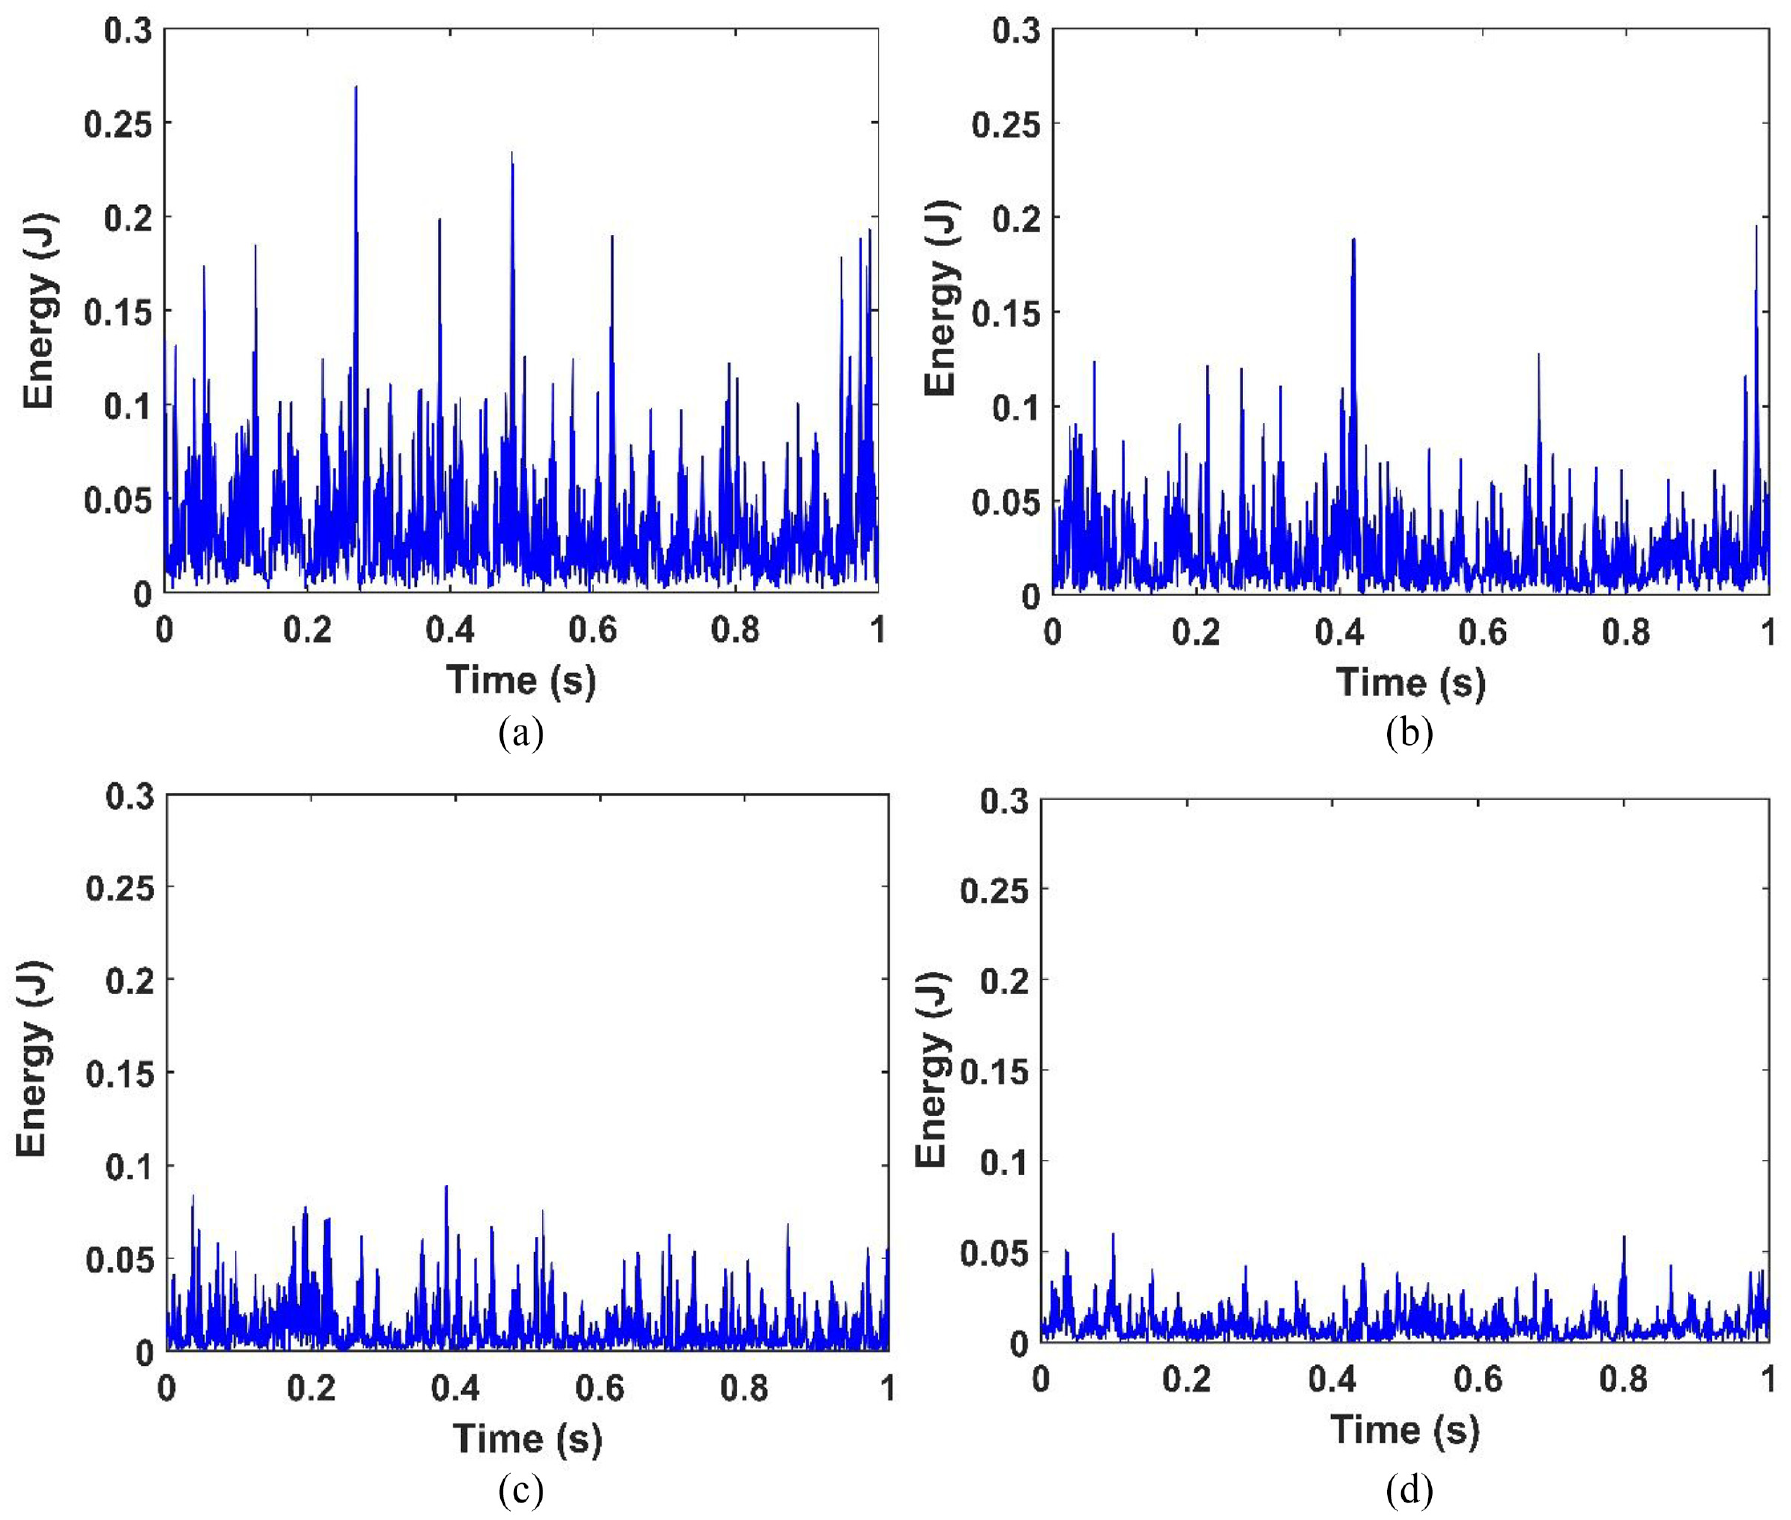
The first IMF’s energy for different locations of (a) the nearest, (b) second-near, (c) far, and (d) the farthest sensors from the damaged element by CEEMDAN technique.
Similar to the enhancement trend observed in the behavior of energy feature, the number and intensity of damage spikes in the behavior of IA feature extracted by CEEMDAN extremely increase with decreasing the distance of sensors relative to the damage element as shown in Figure 20. Although these enhancements in the IA results from EMD and EEMD techniques are not as much as that of CEEMDAN, the increase in their magnitudes is slightly noticeable for the closer sensors. Accordingly, the magnitudes of the mean of IA and the corresponding damage index as given by equations (3) and (4) significantly increase for the sensors located at near distances (i.e. Sensors 11 and 9) relative to the damaged element compared to those of sensors located at farther distances (i.e. Sensors 4 and 1) as shown in Figure 13.
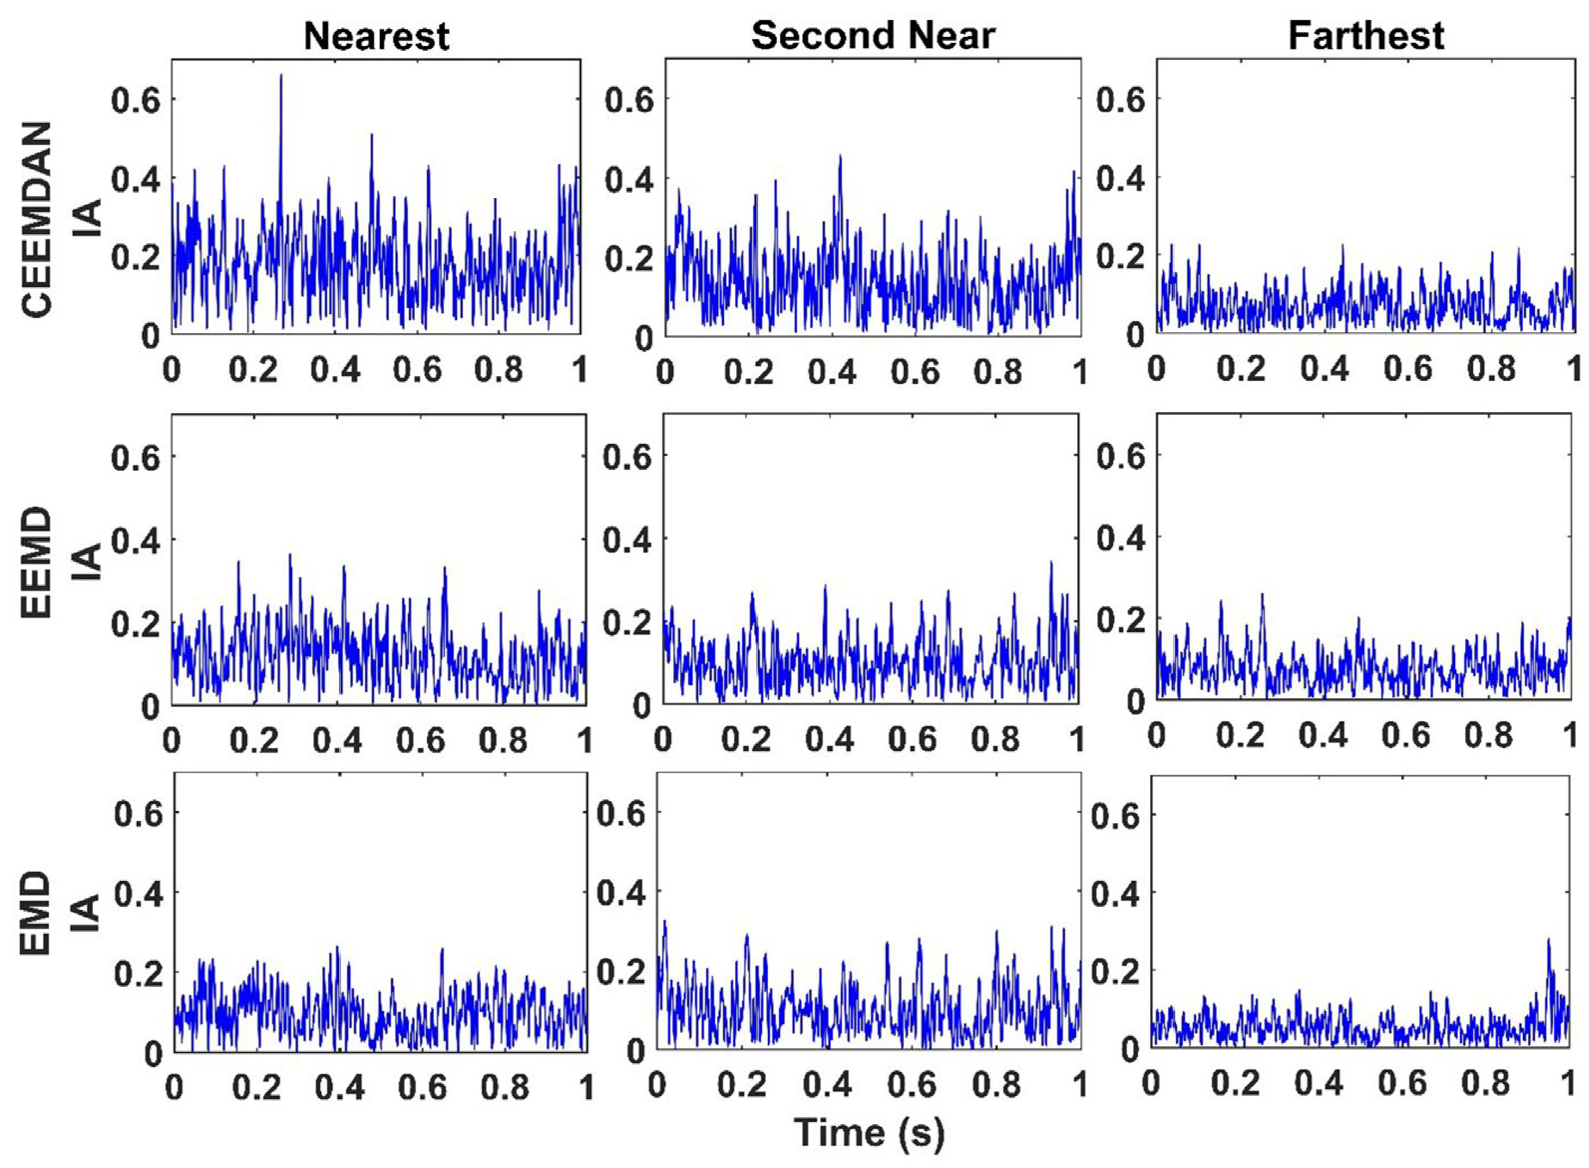
The IA of the first IMF results extracted by CEEMDAN, EEMD, and EMD for different sensor locations relative to the damaged element.
The damage index results defined based on the energy and IA compared to their combinations with kurtosis and entropy features are presented in Figures 11(a)–(c) and 13(a)–(c). In these figures, the sensitivities of these damage indices are illustrated not only to the damage severity (illustrated using different legends) but also to the damage location (around Sensor 11) by showing the results from all 13 sensors. It is obviously seen that the damage index curves have more concentrated curvature around the damage location at Sensor 11. Therefore, the results of these figures demonstrate the merit of the proposed approach based on CEEMDAN in identifying the presence, location, and severity of the damage.
Besides, the unwrapped phase extracted from HHT based on CEEMDAN, EEMD, and EMD is also assessed as the indicator of the damage location. In Figure 21, it is observed that the deviations between damaged and healthy states increased by reducing the distance between the specified sensors and the damaged element. Therefore, increasing the angle of the unwrapped phase with the decrease in the distance of the sensors relative to the damage location results in the increase in the damage index magnitude as defined in equation (6). The performance of the unwrapped phase in identifying the damage location can be also clearly seen in Figure 15 in which the damage index results calculated based on the unwrapped phase extracted by CEEMDAN, EEMD, and EMD techniques are plotted for all 13 sensors. As shown in Figure 21, the unwrapped phase extracted by CEEMDAN is significantly more sensitive to the damage location than those of EMD and EEMD methods. Accordingly, the damage index results based on CEEMDAN show higher values and more curvature around the damage location than those of EMD and EEMD as presented in Figure 15. As such, the qualitative and quantitative results show the considerable deviations and damage index values, respectively, from the CEEMDAN for the sensors around to the damaged element (especially for the nearest, second near sensors) compared to those from far and farthest sensors which demonstrate the advantage of using the CEEMDAN in locating the damage compared to EEMD and EMD.

The unwrapped phase of the first IMF results extracted by CEEMDAN, EEMD, and EMD for different sensor locations relative to the damaged element.
Detecting the location of the damage using the IF and the corresponding HHT spectrum is considered as another approach in this study. This approach presents the IF of IMFs in a time–frequency domain. In Figure 22(a)–(c), it is seen that the intensities of the IMFs increase between the frequencies of 0 and 20 Hz with the decrease in the distance of sensors from the damaged element. On careful observation of these figures, all four sensors show the energy density in the low-frequency spectra but it is seen that there is a decrease in the power of the frequency as the sensor location is moved farther with respect to the damage location. Generally, all four extracted features evaluated in this section were successfully able to locate the damage and demonstrate which technique has more efficient performance in classifying the damage severity and locating the damage. Consequently, the experimental results showed the capability and robustness of the CEEMDAN compared to EEMD and EMD.
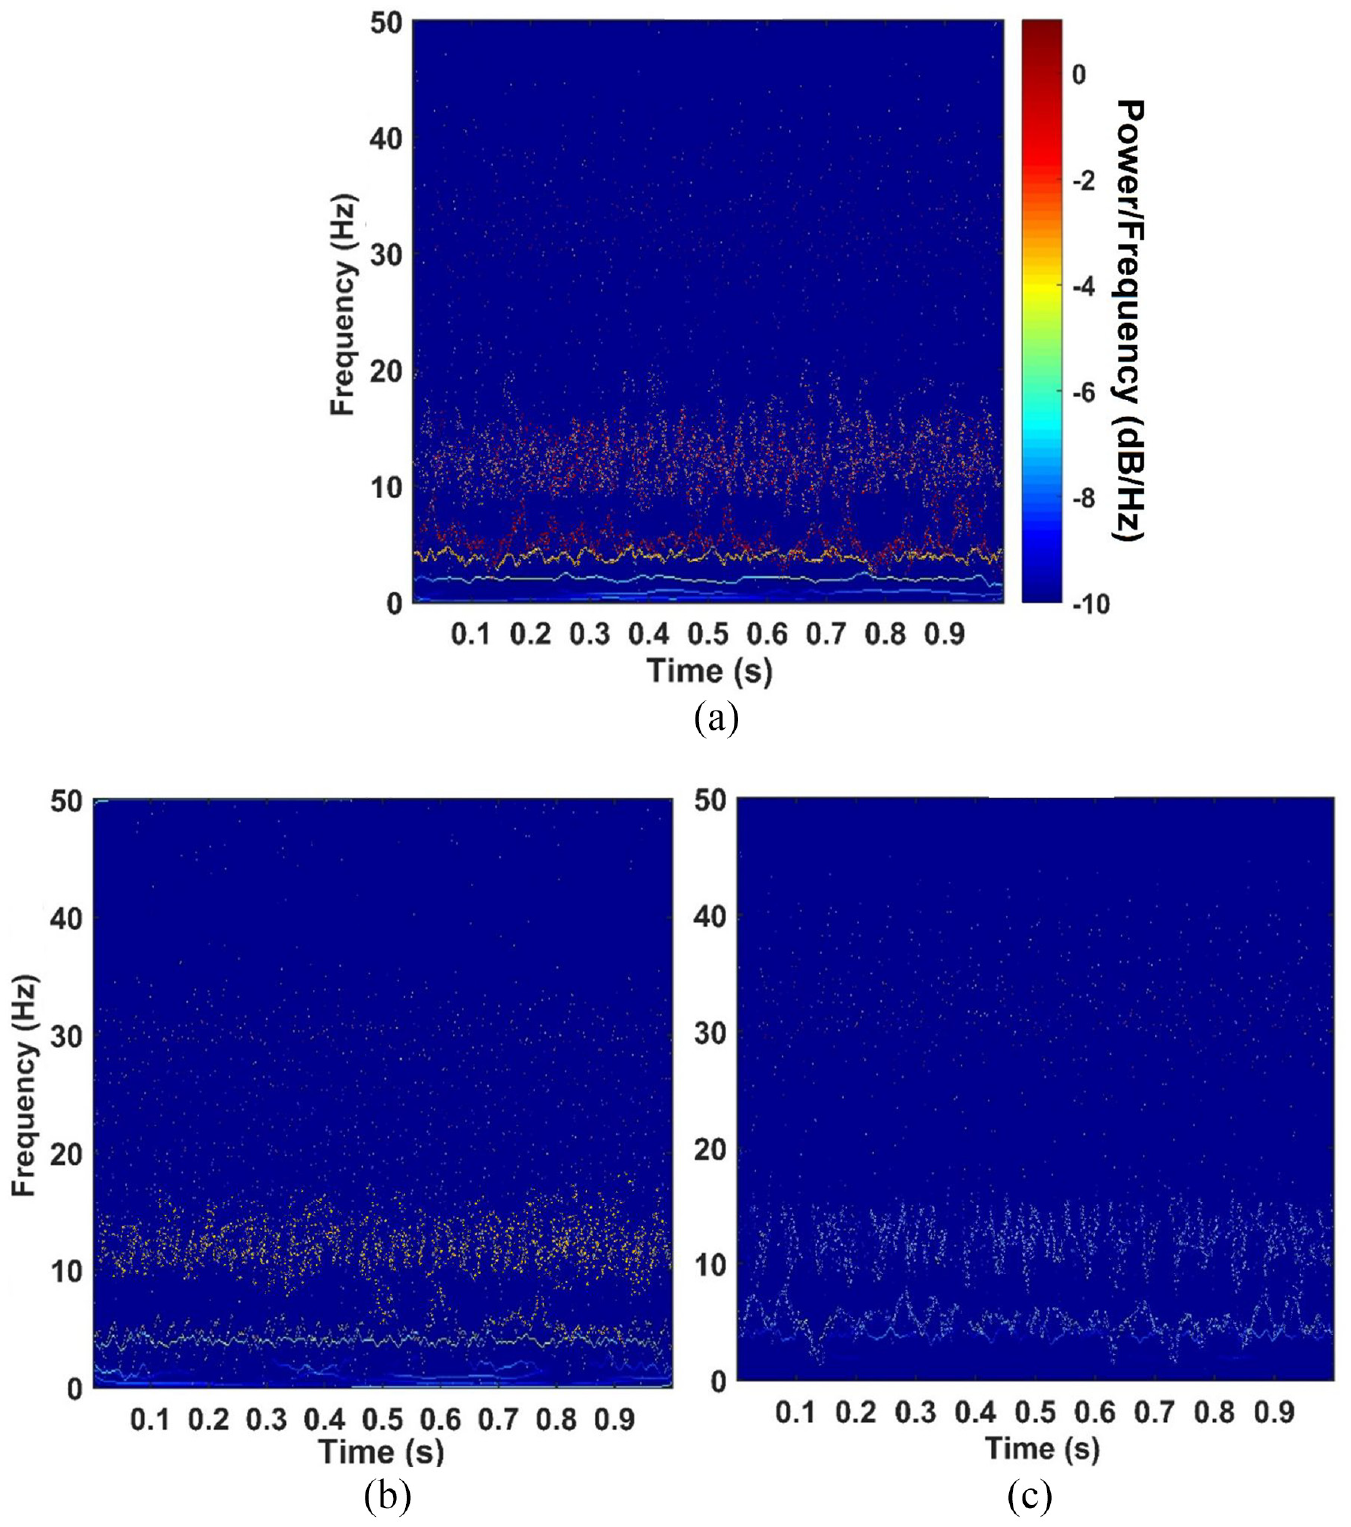
HHT spectrum for different locations of (a) the nearest, (b) second-near, and (c) the farthest sensors from the damaged element (herein, 100% damage).
Summary and conclusion
In this article, the performance of the EMD-based signal processing technique referred to as CEEMDAN was experimentally assessed in identifying the presence, location, and severity of the damage for a steel truss bridge model. Based on the evaluations using three signal processing techniques, including EMD, EEMD, and CEEMDAN, the first IMF extracted by the CEEMDAN was selected as the evaluation criterion in detecting the structural damage. In addition, four key parameters of the signal, including the energy, IA, unwrapped phase, and IF extracted through applying HT to the IMFs, are considered to investigate the existence, severity, and location of the damage in the model. Furthermore, the sensitivity of CEEMDAN compared to the previous generations of the EMD-based techniques is investigated by proposing several improved damage indices from the combinations of two statistical signal features, including kurtosis and entropy with the energy and IA features of the analyzed signal.
The main findings of this article from the analysis of the experimental acceleration response of the truss can be summarized as follows:
The CEEMDAN approach is a novel extension of EMD which accurately reproduces a proceed signal and mitigates the mode mixing problem.
The intensity of spikes of the first IMF decomposed by CEEMDAN increased more significantly compared to those from EEMD and EMD techniques, which demonstrate the completeness of CEEMDAN in decomposing the acceleration response of the structure. Therefore, the CEEMDAN presented a more sensitive damage detection approach compared to EMD and EEMD.
Increasing the energy and IA values and decreasing the unwrapped phase values of the first IMF were observed with the appearance of the damage, with increasing the level of damage and with decreasing the distance of the desired sensor from the damage location.
Although EMD and EEMD were able to detect the damage, a significant improvement of CEEMDAN compared to the other techniques in detecting the existence, severity, and location of the damage using the damage indices based on energy, IA, and unwrapped phase parameters was concluded.
By assessing the IF of IMFs in the time–frequency–energy domain, an increase in the power of the frequency in the low ranges is observed when the damage appears. Furthermore, this technique can provide an indication of the general damage region and being a sensitive indicator of damage.
By comparing the value of the damage indices based on energy, IA, and unwrapped phase features, it was found that the energy feature represents a better approach in detecting, locating, and classifying the severity of the damage.
It was concluded that the proposed damage indices based on the combinations of the kurtosis and entropy features with the energy and IA features resulted in more sensitive indices in identifying the presence, intensity, and location of the damage compared to those based on the direct utilizing of the energy and IA features. In addition, more sensitive indices were obtained when combining the entropy feature with the energy and IA compared to those in which the kurtosis feature was utilized.
Footnotes
Abbreviations
Declaration of conflicting interests
The author(s) declared no potential conflicts of interest with respect to the research, authorship, and/or publication of this article.
Funding
The author(s) disclosed receipt of the following financial support for the research, authorship, and/or publication of this article: This research is financially supported by the Ministry of Science and Technology of China (Grant Nos. 2019YFE0112400; 2017YFC0703603), National Science Foundation of China (Grant No. 51678322), the Taishan Scholar Priority Discipline Talent Group program funded by the Shan Dong Province, and the first-class discipline project funded by the Education Department of Shandong Province.
