






Abstract
This study proposes a long-term health monitoring method for tunnel structure transformation using a 3D light detection and ranging (LiDAR) equipped in a mobile robot. The proposed method comprised two phases: 3D point cloud maps (PCMs) generation and health indicators (HIs) extraction at the same location for the long-term structure transformation inspection. First, the 3D point cloud data (PCD) and six-degree-of-freedom acceleration and gyration of a mobile robot were measured during periodic inspection of tunnel structures using the 3D LiDAR and an inertial measurement unit. This information was combined to generate a 3D PCM by utilizing tightly coupled LiDAR inertial odometry. This procedure could be repeated to inspect tunnel structure transformation at patrol inspection in a long term. 3D PCMs measured during period inspection were then registered to extract a 3D PCD at the location of the first measurement. Hence, an iterative closest point method with edge features was executed to register periodic PCD measurements. Second, 3D PCD in predefined locations were extracted at every measurement. These PCD were used to extract features that are highly correlated to the inner wall and ground of the tunnel structure to obtain five HIs representing their health conditions. These HIs were then employed to evaluate the structural health of the tunnel. Field experiments were conducted to demonstrate the effectiveness of the proposed method in buildings and tunnels. The proposed method outperformed other 3D PCM methods, especially in structures with few features such as tunnels and corridors. A systematic analysis of the experimental results also revealed that the proposed method ensures the accuracy and robustness of HIs extraction at the same location, confirming the feasibility of long-term inspection. The proposed inspection method for tunnel structures and embedded mobile robot system provides a cost-effective and autonomous solution for infrastructure health monitoring.
Introduction
Tunnel structures formed by excavating the ground under mountains, rivers, or seas are critical for applications such as roads, railroads, oil pipelines, mines, and transportation for industrial and military purposes. Tunnels have also been used to deploy power transmission and optical cables in urban areas to improve townscapes. 1 The importance of tunnel structures implies that their reliability and safety should be ensured during their long-term operation and maintenance, which should be performed to mitigate concerns related to accidents and natural disasters. However, the health monitoring of tunnel structures is limited because tunnels are scattered like spiderwebs. For example, by the end of 2022, Korea had 3645 tunnels with an operating mileage of 2451.709 km. 2 The health states of tunnels also depend significantly on the surrounding circumstances, making proactive and proper maintenance challenging.
In recent years, intensive studies have been conducted to address contact and non-contact inspection methods for structural health monitoring of tunnels. Contact inspection methods employ fiber-optic sensors and convergence meters, whereas non-contact inspection methods generally use laser scanners and optical cameras.3–13 Specifically, contact-type sensors can measure several deformations located in the same cross-section, implying that the cross-sections of tunnels could be effectively monitored to detect local yet macroscopic deformations. Long-term measurements with these sensors also provide valuable information related to the evolution of tunnels and their differences from their original construction. However, such approaches require numerous sensors, sensor lines, and data acquisition systems, making them economically infeasible because of the high initial cost.3–7 Terrestrial laser scanners, which are non-contact laser sensors, have been widely studied owing to their efficiency and accuracy in inspection.8–13 However, terrestrial laser scanners are also economically infeasible and require considerable computational effort to analyze point cloud data (PCD) in tunnel structures. Specifically, this equipment measures 1,250,000 points per second, requiring an enormous amount of PCD to be processed for the health assessment of tunnel structures.8–9 The feasibility of using optical cameras to inspect tunnel structures has been actively studied by considering several image-processing methods because this type of sensor is more economical than other sensors.14–17 An optical camera that detects macrocracks on the surfaces of tunnels can only evaluate the macroscopic deformations of local structures, implying that this sensor is limited to inspecting the entire structural deterioration of tunnels. 17 Moreover, a light must be turned on and optimally placed in the tunnel structure during the inspection. The other limitation of this approach is that the optical camera should closely approach the tunnel surface at an accurate angle because the inspection accuracy depends considerably on the distance and angle between the tunnel structure and the optical camera. This limitation implies that inspection accuracy is not ensured when an optical camera is deployed for mobility without additional accessories, such as manipulators or cranes.
In recent years, 3D light detection and ranging (LiDAR), which has been widely used for environmental cognition around autonomous vehicles,18–20 has piqued attention in structural health monitoring.11,21–23 LiDAR sensors are more economically feasible than terrestrial laser scanners, and the PCD measurement density (300,000 points per second) is reasonable considering the capability of a microcomputer. These characteristics indicate that 3D LiDAR could provide an alternative solution for the structural health monitoring of tunnels because the 3D PCD from 3D LiDAR provides sufficient density to inspect these structures. Moreover, a 3D LiDAR is more compact and lighter than a terrestrial laser scanner, indicating that such sensors can easily be deployed on small mobile robots for patrol inspections and special missions, including the inspection of underground tunnels for power transmission lines. Note that the size of the inspection equipment is essential for the health monitoring of tunnel structures because tunnels have limited dimensions depending on their purposes. Thus, a novel economical and accurate non-contact sensor will increase the appeal of mobility-based inspection for tunnel structures.
Many advantages of mobility-based inspection methods, including cost-effectiveness, high payloads, and proactive maintenance with novel sensors, have resulted in significant studies in many applications.20,24–29 These advantages also have drawn attention to tunnel inspection because mobility-based inspection could provide alternative structure monitoring modalities with novel sensors, including terrestrial laser scanners, optical cameras, and ultrasonic sensors.30–32 For instance, a mobile tunnel monitoring system using a 3D laser scanner while driving on a railroad has been proposed. 31 This method accurately measures the diameter of the tunnel structure to evaluate its cross-sectional deformation. A robotic arm and an automated crane have also been mounted on a mobile vehicle to closely inspect the inner wall of a tunnel structure. 32 These inspection systems monitor deformations and the presence of cracks using optical cameras and ultrasonic sensors. However, reflective beacon systems, which provide highly accurate localization and navigation, must be placed inside the tunnel every 15 m to specify the inspection locations, suggesting that the proposed system is economically infeasible, similar to other previous studies, because it incurs high installation costs. Moreover, most recent studies have only focused on local structure health monitoring or crack detection based on a measurement condition with non-contact sensors, even though the entire structure’s deterioration over time should be periodically inspected to ensure the reliability of the tunnel structures because long-term deformation of tunnels can be caused by several environmental conditions and external loads.
Several studies have been conducted to inspect long-term tunnel structure transformations with novel sensors.33–35 Anomaly detection was proposed with measurements of tunnel deformation over the long term using a combination of statistical analysis and machine learning techniques. 33 The proposed method was evaluated with measurements from the Waasland tunnel in Antwerp and demonstrates the capability to identify minor damages in a tunnel, which could be used in an early warning system. However, the approach requires long-term training measurements to distinguish normal responses from anomalies in tunnel response. 34 Moreover, most methods in the literature addressed contact types of sensors, such as strain gauges and thermocouples, to monitor long-term tunnel deformations. Note again that installing bundles of these sensors is economically infeasible to monitor entire tunnels for field applications, implying that more novel and economic approaches should be studied for real-world applications.
To overcome these limitations and satisfy requirements for real-world applications, this study proposes a cost-effective long-term health monitoring method for tunnel structure deterioration using a 3D LiDAR deployed on a mobile robot. The proposed method and its embedded system are economically feasible because 3D LiDAR is more competitively priced than other laser scanners. Moreover, the proposed method with this non-contact type of the novel sensor can autonomously evaluate tunnel structure deformations because a highly accurate localization and mapping method is employed to determine the location of the mobile robot. Detailed novel aspects and key contributions of this study are highlighted as follows:
A non-contact inspection system titled tunnel structure health monitoring (T-SHM) was developed by deploying a 3D LiDAR and inertial measurement unit (IMU). The proposed system can be equipped on any mobile robot, including four-wheeled, four-legged, and mecanum-wheeled robots.
The proposed framework utilized tightly coupled LiDAR inertial odometry (LIO) to generate a 3D point cloud map (PCM) by combining the 3D PCD and six-degree-of-freedom (DOF) acceleration and gyration, providing the mobile robot location accurately and thus enabling health indicator (HI) extraction from specific predefined locations. Hence, the 3D PCD can be hierarchically extracted at a predefined interval during the periodic inspection in the long term.
3D PCD can be extracted at the same location to monitor long-term structural deterioration. 3D PCMs measured during patrol inspection were registered specifically by conducting an edge feature extraction and an iterative closest point (ICP) method. The proposed method quantitatively evaluates the long-term degradation of the tunnel by comparing previous and current inspection measurements.
Novel signal processing and coordinate transformation methods were introduced to ensure the accuracy and robustness of the proposed method. The 3D PCD was used to extract features that were highly correlated to the inner wall and ground, and coordinate transformation was used to project all PCD from 3D coordinates to 2D cross-sectional coordinates. Moreover, the geographic effect was corrected for enhanced accuracy; thus, HIs correlated to tunnel structural transformation can be executed effectively.
Systematic experiments were conducted using three types of mobile robots and a customized gimbal deploying 3D LiDAR to demonstrate the feasibility of the proposed method for real-world applications. These experiments not only confirmed the capability of the proposed T-SHM system, but also demonstrated the effectiveness of the proposed method in terms of both accuracy and robustness in field applications.
The remainder of this paper is organized as follows. Section “Hardware configuration” discusses the hardware configuration of the mobile robot deploying the 3D LiDAR. Section “Methods” introduces the 3D PCM generation and HIs extraction methods. Section “Field experiments” describes the field experiments conducted to demonstrate the effectiveness of the proposed method. Section “Results and discussion” presents the results of the field experiments and future research directions. Final section summarizes the conclusions.
Hardware configuration
The proposed T-SHM system was designed to be mounted on a variety of robots, including four-legged (Unitree A1, CHN), four-wheeled (Rover Robotics Rover Zero 2, USA), and mecanum-wheeled mobile robots. The compatibility of the proposed T-SHM system with several types of mobile robots is important to achieve monitoring in various tunnel structure environments. Specifically, four-legged mobile robots could be effective under harsh environmental conditions, including tunnel structures with irregular road surfaces or obstacles; however, this type of robot transmits relatively large vibrations to the T-SHM system because a four-legged mobile robot stamps its own feet on the ground when walking inside a tunnel. The short operational time of 30 min should also be considered from an economic perspective. Four-wheeled mobile robots are preferable under moderate road conditions because they transmit relatively small vibrations and ensure a long operational time of 180 min. However, this type of mobile robots experiences difficulty when obstacles exist on roads and requires a large radius of rotation, limiting its ability to access tunnels for inspection. Mecanum-wheeled mobile robots can move in omnidirectional paths and rotate arbitrarily around their centers simultaneously because they contain rolls arranged at 45° around the wheel axis. 36 However, mecanum-wheeled mobile robots also experience difficulty due to obstacles on the ground and operation limitations under tough road conditions originating from slipping, resulting in an operational time of 60 min, which is between those of four-legged and four-wheeled mobile robots. In other words, all mobile robots have advantages and disadvantages; therefore, an appropriate robot should be used considering tunnel conditions, indicating that the compatibility of the T-SHM system is important for real-world applications.
The overall hardware configuration of the proposed T-SHM system is illustrated in Figure 1. A 3D LiDAR (Velodyne VLP-16, USA) is deployed on a customized gimbal printed with a composite carbon fiber plate (black part of the T-SHM system in Figure 1) and polylactic acid support (white and gray parts of the T-SHM system in Figure 1) using a 3D printer (Ultimaker S5, Netherlands).
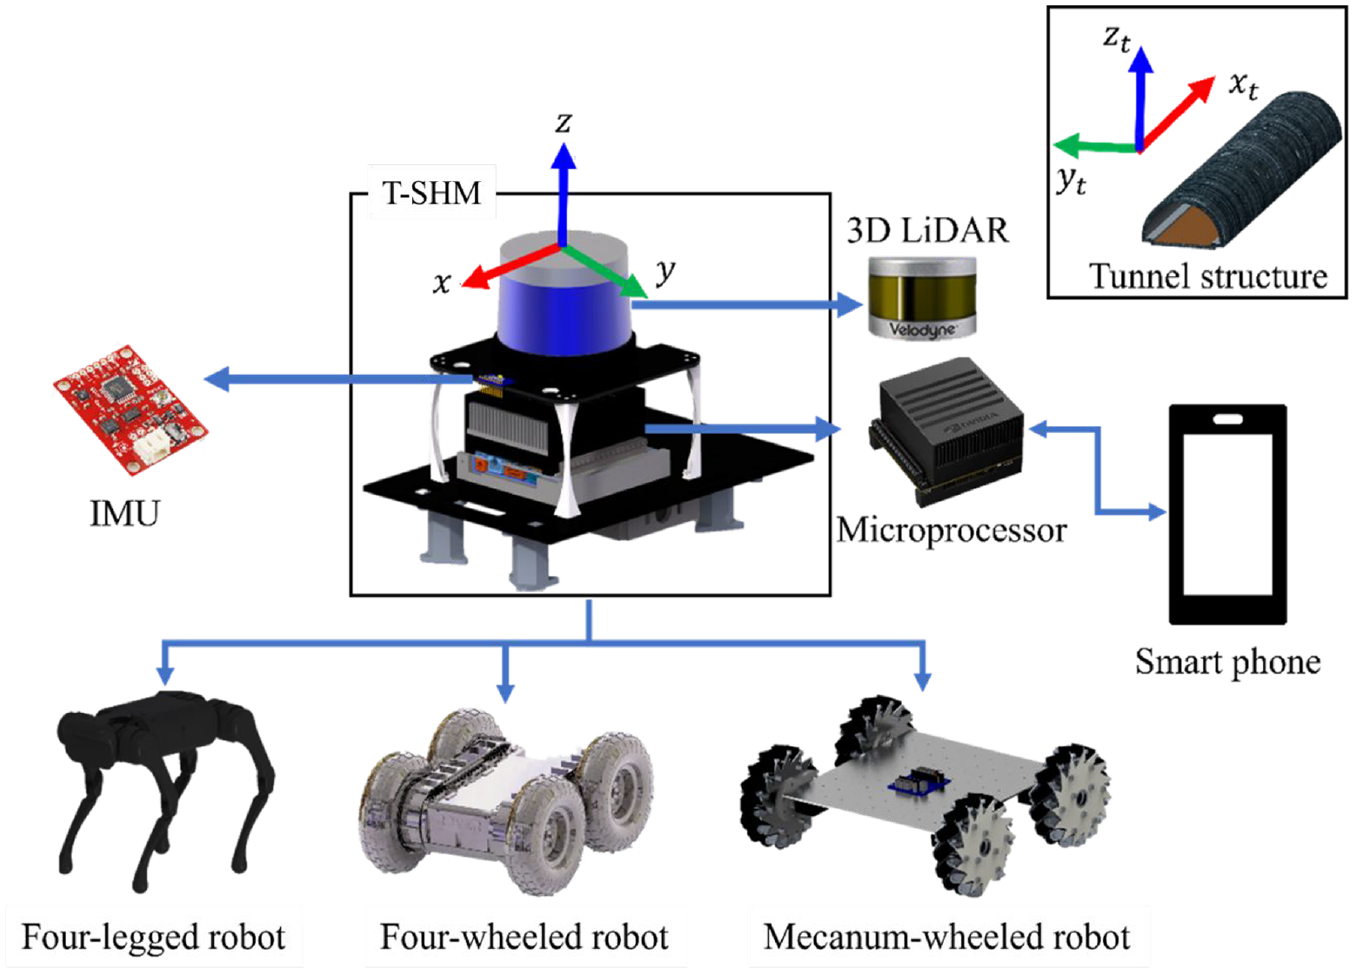
T-SHM system deployed on mobile robots equipped with a 3D LiDAR, IMUs, and microprocessors.
The 3D LiDAR measures the 3D PCD with 16 channels. The measurement range and accuracy can reach 100 m and 3 cm, respectively, and the measurement angles are 360° and 30° in the horizontal and vertical directions, respectively. The scan frequency of the 3D LiDAR is 10 Hz, and the horizontal and vertical angular resolutions are 0.2° and 2°, respectively. Note that the 3D LiDAR is mounted on the T-SHM system, thereby the 3D LiDAR measures the relative location of the PCD within a measurement range in the
An IMU (InvenSense MPU-6050, USA) is deployed on the T-SHM system in front of the 3D LiDAR. The IMU sensor consists of a three-axis accelerometer and gyroscope (i.e., yields six-DOF data), measuring the six-DOF acceleration and rotational acceleration of the T-SHM system with 50 Hz sampling frequencies. Note that IMU measurements are indispensable to ensure high accuracy and robustness of the 3D PCM generated to specify the inspection location. However, IMU measurements usually have inaccuracies due to biases, inaccurate scaling, non-orthogonality of sensor coordinates, and misalignment between the sensor frame and robot frame. 37 Therefore, calibration was performed in a preliminary experiment to minimize the measurement errors of the IMU. 38 The detailed procedure of IMU calibration is not described herein for brevity because this procedure is widely known. 38 A microprocessor (Nvidia Jetson Xavier AGX, USA) is also mounted in the T-SHM system to acquire multi-sensor data, including the 3D PCD and IMU, and to drive the mobile robot manually with a remote controller. The inspection state and reliability of sensor data measurement can also be monitored from this microprocessor using a wireless network in real time. A personal smartphone is utilized as a router to connect the operating machine, such as a notebook or tablet, to the microprocessor because wireless networks are not available in most tunnel structures.
The weight of the custom-designed gimbal is only 1.7 kg, and the total weight of the T-SHM system is 4.08 kg, including all deployed sensors and cables. Customized gimbals are effective for weight minimization, ensuring a long operational time of patrol inspection. The weight of the inspection system is important because the operational time of a mobile robot is inversely proportional to the weight of the inspection system. The hardware optimization is not described in detail because it is beyond the scope of this study.
Methods
The proposed method comprises two phases with 3D PCD and IMU measurements (Figure 2). In the first phase, 3D PCD and IMU are employed to generate a 3D tunnel map. The first measurement is defined as a reference measurement, whereas other periodic measurements are defined as target measurements to inspect the same location during periodic patrol inspection. Hence, the target and reference 3D tunnel maps, which are generated by the target and reference measurements, respectively, are matched with the calculated rotation and translation matrixes using the proposed ICP method. Subsequently, the raw PCD inside a tunnel were hierarchically extracted from the reference and target measurements at the same location in a tunnel. In the second phase, featured planes and lines are extracted from the PCD, and coordinate transformation is executed, yielding PCD in the 2D cross-sectional coordinates of the tunnel structure to assess the HIs of the tunnel structure. Hence, HIs from the target and reference measurements can be compared to inspect long-term structural transformation. The details of each phase are described in the following subsections.

Flow chart of the proposed method for tunnel structure health assessment.
Three-dimensional tunnel map generation
This phase comprises four steps, as shown in Figure 2, that aims to obtain hierarchical PCD effectively at predefined intervals in the tunnel: (1) a 3D PCM inside a tunnel is generated. (2) key features from a reference and target 3D tunnel maps are extracted when a new measurement is fed. (3) a target 3D tunnel map is registered to the reference 3D tunnel map when a periodic measurement is fed during patrol inspection. (4) hierarchical 3D PCD for reference and target data are extracted at the same location inside a tunnel. Hence, steps (1) and (4) are only executed at the first measurement to generate the reference PCD map, whereas all steps should be executed during patrol inspection to generate a target map to be registered to the reference map and to extract the PCD from the target data at the same location.
In step (1), the FAST-LIO2 method is used to generate a 3D tunnel map. 39 This method provides real-time accurate state estimation with a high update speed by fusing 3D PCD and IMU measurements. The FAST-LIO2 method utilizes tightly coupled LiDAR-IMU odometry and rotation-constrained refinement. The tightly coupled LiDAR-IMU odometry optimizes all the states within the local 3D PCD, whereas the rotation-constrained refinement aligns the local 3D PCD with the global PCM using information about the optimized poses. Moreover, FAST-LIO2 utilizes an iterative Kalman filter to optimize the MAP calculation, which solves a nonlinear state equation using a linearization method to reduce the computational load. Note that the computational load of the 3D mapping method is closely correlated with the robustness of 3D PCM generation because a massive computational load would result in mapping failure in the optimization process. The detailed calculations and formula for the FAST-LIO2 method used in this study can be found in Xu et al., 39 Shan et al. 40 as well as in supplemental material.
In step (2), key features from a target 3D tunnel map are extracted to register a target map to the reference map. 41 Specifically, this method extracts edges in the 3D tunnel map by evaluating the distance of the query point to the center point of k-nearest neighbor points. The edge detection method involves the following five steps. First, the query point in the 3D tunnel map is selected. Second, the nearest points from the query point are organized using the k-nearest neighbor method. 42 Third, the distance from the query point to the center point of k-nearest neighbor points is calculated. Fourth, the calculated distance is used as an evaluated value if the query point describes an edge. Note that the query point is decided as the edge point if the distance of the query point to the center point of k-nearest neighbors is higher than a predefined threshold; this is because k-nearest points from the query point should be organized far from the query point. Finally, the procedures are repeated for the entire points in both 3D tunnel maps.
In step (3), an ICP method is introduced to register the target 3D edge tunnel map to the reference 3D edge tunnel map, resulting in the rotation and translation matrices.
43
The ICP method involves the following three steps. First, the closest point in the reference PCD is matched to a point in the target PCD. Second, the rotation and translation matrices are estimated by minimizing the cost function, which is the root mean square distance between the reference and target PCD. Finally, the target PCD is transformed using an estimated transformation matrix. The ICP method iterates these three steps until the difference between the previous and current cost functions is less than the predefined threshold
In step (4),
Feature and HI extraction
This phase comprises seven steps, steps (5)–(11) in Figure 2, to effectively project hierarchically extracted 3D PCD in 3D coordinates (
In steps (5) and (6), the extracted PCD inside the tunnel at each interval are stretched in a straight line on the
In step (7), a cylinder representing the wall of a tunnel structure is extracted from the PCD using RANSAC, which is an iterative method of estimating parameters with a predefined reference model from a set of measurements.
44
This method is effective in avoiding distortion during parameter estimation when outliers are included in the measurements and has the objective of defining several vectors of a cylinder representing the wall of a tunnel structure for coordinate transformation from 3D coordinates into 2D cross-sectional coordinates. The detailed procedure of the featured cylinder extraction with RANSAC is shown in Figure 3. Note that

Entire flowchart of random sample consensus (RANSAC).

Detailed locations of HIs for tunnel structure monitoring.
In step (8), a ground line (blue line in Figure 4) representing the ground in a tunnel structure is estimated to refine the coordinate transformation. The overall procedure for estimating the ground line is the same as that in the third step, but this step utilizes a different reference model of
In step (9), the cross-sectional coordinates of the PCD in a tunnel structure are optimized to enhance the accuracy of HI extraction. Note that a small distortion of the tunnel PCD in cross-section coordinates still exists after completing step (7) because large PCD are used to estimate a reference cylinder model. Therefore, this optimization process ensures the exact alignment of the 3D PCD in the
In step (10), the wall of the tunnel structure is re-searched with a circle model
In step (11), the HIs are calculated from the extracted geometric parameters in the cross-sectional coordinates from steps (6) to (10). HIs can be estimated using various metrics. Five HIs were defined in this study to monitor the health inside a tunnel structure: the diameter
where
Field experiments
Two types of field experiments were conducted to demonstrate the effectiveness of the proposed method (see Table 1). First, field experiments were performed at Chung-Ang University, Seoul, Republic of Korea in buildings CAU-207 on the third floor and CAU-310 under the fifth basement level, with the objective of verifying the accuracy and robustness of the proposed method. The T-SHM system was deployed on a mecanum-wheeled mobile robot. Second, field experiments were conducted with four-legged and four-wheeled mobile robots in tunnels BY and SS to validate the robustness of the 3D map generation and effectiveness of the proposed method. BY is located in Cheongju, Republic of Korea, whereas SS is located in Seoul, Republic of Korea. Both tunnels are operated by KEPCO. Detailed information on the locations of the two tunnels is confidential because the locations of power transmission lines are directly correlated with energy security in Korea. Furthermore, three different mobile robots were used at different sites not only to demonstrate the compatibility of the T-SHM system, but also to validate robustness of the proposed method.
Field experiment sites.

The four-wheeled mecanum mobile robot operated inside CAU-207 and CAU-310, and the four-legged and four-wheeled mobile robots operated inside BY and SS. CAU-207 and CAU-310 could be utilized to estimate the accuracy of the 3D PCM generated by the proposed mapping method because blueprints of the insides of the buildings are available. Specifically, the 3D structures inside these buildings were generated from the provided blueprint using the commercial 3D computer-aided design (CAD) software, and these 3D CAD maps were converted into 3D PCMs using stereolithography (STL) format. 46 STL format describes only the surface geometry of a 3D object without any representations of color, texture, or other common CAD models. Note that the accuracy of the 3D PCMs generated in these experiments could not be estimated with blueprints for tunnels BY and SS because no blueprints of these tunnels are available (due to confidentiality). However, the robustness of 3D PCM generation was validated experimentally in these tunnels. Experiments for the tunnel SS demonstrated the robustness of 3D map generation and applicability of the proposed method in a long-term. Specifically, full and limited scan angle conditions were applied to validate the robustness of 3D map generation, in which the horizontal scan angle was set to 360° and 200° (±100°) in front of the T-SHM system, respectively. Moreover, three PCD sets were measured on different dates to analyze the applicability of the proposed long-term inspection method by defining three PCD sets as the Reference, Target1, and Target2 when measured at November 24, 2021, March 15, 2022, and March 24, 2022, respectively (see Table 1). In all field experiments, the T-SHM system measured 3D PCD and IMU data during manual driving through an operator using a remote controller.
Results and discussion
This section presents a systematic analysis and discussion of the accuracy and robustness of the proposed method with field experiments. First, the entire procedure of the proposed method is presented with figures of each phase. Second, the application of the proposed method is demonstrated by several PCD measurements from the tunnel SS. Third, the superiority of the 3D PCM generation method is validated by comparing it with other PCM generation methods using the measured 3D PCD for CAU-207 and CAU-310. Fourth, the accuracy and robustness of the proposed method are discussed based on the PCD from field experiments performed in the tunnels BY and SS. Finally, future applications of the proposed method are discussed. All processes were executed on a desktop computer with an Intel® Core™ i9-10900 CPU @ 2.80 GHz and 32 GB memory.
Overall procedure used to extract HIs in the proposed method
The T-SHM system deployed on mobile robots measured the time series of the 3D PCD and IMU data inside several tunnel structures in the field experiments. Figure 5 depicts the execution of each procedure with PCD measured from the tunnel BY. The results of each phase provide appropriate data for HI extraction, indicating that the proposed method is effective for assessing the structural health of tunnels. Note that the results of each procedure for the tunnel SS were similar and are therefore not shown herein for brevity.

Results of steps (1)–(10) of the proposed method in BY.
The entire procedure of the proposed method is as follows. In step (1), the 3D PCM is generated using the proposed LIO method (red PCM in (1) in Figure 5). In step (2), edge features are extracted using the proposed feature extraction method to register the target PCM measured during patrol inspection to the reference PCM, which would be measured for the first time (yellow PCM in (2) in Figure 5). In step (3), the ICP method is conducted with extracted edge features from step (2) to assess long-term structure transformation by matching from the target PCM (yellow PCM in (3) in Figure 5) to the reference PCM (red PCM in (3) in Figure 5). Hence, execution of steps (2) and (3) makes the target PCM to extract HIs at the same location, which would be defined at the reference PCM. In step (4), a set of hierarchical 3D PCD is extracted with the same interval to monitor structure transformation at specific locations of interest ((4) in Figure 5). Note that steps (1) and (4) are executed at the first measurement to generate the reference PCD (red dashed arrow in Figure 5). The steps (2) and (3) are additionally executed with measured PCD during patrol inspection to generate the target map. The extracted 3D PCD are aligned to
Application of the long-term assessment
The applicability of the proposed inspection method during long-term patrol inspection was demonstrated using three measurements, which are defined as the Reference, Target1, and Target2 for the tunnel SS. The 3D tunnel PCM and HIs of the Reference were quantitatively compared to those of the Target1 and Target2. First, the accuracy of ICP with edge features was evaluated with two other methods; ICP method without feature extraction and with an intrinsic shape signature (ISS) feature extraction. Note that the ISS method is widely used because this method effectively extracts a saliency point in PCD based on the eigenvalue decomposition. 47 The ISS feature extraction method is defined as follows: (1) local reference frames are computed using the eigenvalue decomposition within the predefined radius around each point; (2) the ISS saliency for each point is defined using the smallest eigenvalue; (3) ISS feature point is extracted from the point with maximum ISS saliency within the predefined radius around each point. Second, HIs extracted from the Target1 and Target2 PCD after ICP registration are compared with HIs from the Reference at the same location to evaluate the performance of the proposed method.
The root mean square differences (RMSDs) of the three ICP methods are listed in Table 2. The simple ICP method results in the largest RMSDs of 0.3094 and 0.3322 in x- and y-axes, respectively, which are twice larger than those from the other two ICP methods, indicating that feature extraction plays an important role to accurately assess long-term structural health at the same location. Moreover, the ICP method with edge detection method results in the smallest RMSDs of 0.1392 and 0.1367 in x- and y-axes, respectively, implying that the edge points in the tunnel structure are more important than the salience point from the ISS feature extraction method. In other words, edges would be the most effective features to adjust the PCD of the tunnel structures in generating 3D tunnel PCM, indicating that the ICP method with edge detection is the most appropriate method.
RMSD comparison of the three ICP methods between the reference and two target data.

The smallest RMSD are shown in bold font.
ICP: iterative closest point; ISS: intrinsic shape signature; RMSD: root mean square difference.
The estimated HIs from the Reference, Target1, and Target2 are illustrated in Figure 6. Specifically, HIs were extracted for a total distance of 500 m by applying the proposed method, and 500 raw 3D PCD were extracted with 1-m interval, where

HIs extracted from the (a) Reference, (b) Target1, and (c) Target2 at the tunnel SS; (d) statistical analysis of extracted HIs from Target1 and Target2 with respect to the Reference.
Superiority of the proposed 3D tunnel map generation
The superiority of the proposed 3D mapping method was validated with the PCD of CAU-207 and CAU-310 by comparing the results executed using the proposed method with those acquired using other LiDAR odometry (LO) and LIO methods, including LiDAR odometry and mapping (LOAM), 48 lightweight and ground-optimized LOAM (LeGO-LOAM), 49 scan context LeGO-LOAM (SC-LeGO-LOAM), 50 and tightly coupled LIO via smoothing and mapping (LIO-SAM). 40 The main difference between LO and LIO is the use of fused information from the IMU to the PCD for 3D map generation because LO only uses PCD for PCM generation. The accuracy was calculated using the ICP method, which minimizes the difference between the reference and target PCD. The reference and target PCD correspond to the PCMs from the blueprint and mapping methods, respectively. Note that the results of the last calculated cost function were employed to calculate the root mean square error (RMSE), which was used to represent the total accuracy of the mapping methods in this study.
Table 3 presents the accuracy comparison for 3D maps generated using five different methods. The three LO methods exhibit worse accuracy than the two LIO methods, implying that fusing PCD and IMU data provides sufficient information for 3D PCM generation. Among the three LO methods, SC-LeGO-LOAM has the highest accuracy because the scan-context-based loop closure corrects the distortion caused by optimization errors. Specifically, this method exhibits accuracy similar to those of the LIO methods at CAU-207, whereas the accuracy is worse than those of the LIO methods at CAU-310. This observation can be explained by the fact that CAU-207 has more features such as edges and corners than CAU-310, and these features facilitate map generation using only PCD. By contrast, the monotonous shape of CAU-310 has fewer distinct features, implying that IMU information enhances the accuracy and robustness of 3D map generation in CAU-310. Interestingly, the accuracies of the two LIO methods along the z-axis exhibit large differences between sites, even though the mean RMSE is 0.34 and 0.35 in total for LIO-SAM and FAST-LIO2. This observation can be explained by the fact that the 3D PCM accuracy along the z-axis is inversely proportional to the number of corners. Specifically, CAU-207 and CAU-310 have 12 and 7 corner sections, resulting in large distortion of the 3D PCM at the corners because the rotating motion of the mobile robot causes the PCD distortion and optimization errors. Few corner sections exist in tunnel structures, indicating that the proposed method is more accurate than LIO-SAM in our application. The mapping results from the two LIO methods for the two sites overlap in Figure 7. The 3D PCMs generated by the two LIO methods correspond well to the PCMs from the blueprints, indicating that the proposed method achieves high accuracy. These two field experiments demonstrate that the two LIO methods are appropriate in terms of both accuracy and robustness. However, FAST-LIO2 is appropriate because tunnel structures are monotonous shapes with few features.
Accuracy comparison of five 3D mapping methods in terms of RMSE at CAU-207 and CAU-310.

LIO: LiDAR inertial odometry; RMSE: root mean square error.

Overlapped results in sky view of the 3D PCM inside (a) CAU-207 with LIO-SAM, (b) CAU-310 with LIO-SAM,(c) CAU-207 with FAST-LIO2, and (d) CAU-310 with FAST-LIO2.
To validate this hypothesis, the robustness of the two LIO methods was compared with that of the 3D PCD measured for the first 150 m of the tunnel SS (Figure 8). The same PCD measured from the tunnel SS were used as inputs to generate 3D PCMs. Remarkably, FAST-LIO2 successfully generated a 3D PCM for the entire inspection duration, whereas LIO-SAM failed to generate a 3D PCM after 70 s because the computational load of FAST-LIO2 is much lower than that of LIO-SAM (see the supplemental video near a recording time of 1:00 min, which shows the 3D map generation by FAST-LIO2 and LIO-SAM in real time). These results clearly indicate that FAST-LIO2 outperforms LIO-SAM from a robustness perspective at a site with few featured structures; therefore, FAST-LIO2 is appropriate for the health monitoring of tunnel structures with 3D PCD. The three LO methods yielded results similar to those of LIO-SAM, confirming that the proposed method outperforms the other methods, but these results are not shown herein for brevity.

Obtained 3D PCMs and translations with respect to time at SS: (a) mapping results obtained using FAST-LIO2,(b) mapping results obtained using LIO-SAM, and (c) translation results acquired using FAST-LIO2 and LIO-SAM.
Analysis of accuracy and robustness of tunnel structure health assessment
This subsection provides analyses of the accuracy and robustness of the proposed method. First, the effectiveness of the PCD calibration in step (6) is discussed for curved regions. Second, the contribution of the ground jittering method to the accuracy enhancement in HI estimation is analyzed. Third, the robustness of the proposed method is discussed by comparing the HIs between the PCD obtained using the full and limited scan angles.
Figure 9 illustrates the trends of the estimated HIs during tunnel inspection. Specifically, HIs were extracted at the tunnel BY for a total distance of 300 m and 300 raw 3D PCD were extracted in 1-m intervals; meanwhile, HIs were extracted for a total distance of 500 m in the same intervals for the SS site. The lengths of inspection were determined by considering the battery capacities of the mobile robots. The general trends for HIs should be straight lines because neither site exhibited any degradation phenomenon during regular precise inspection. In other words, only healthy tunnel structure data were obtained because abnormal data indicating that a tunnel faces serious risks, such as the risks of damage and collapse, would have been difficult to obtain. However, small variations were observed from the 3D map generation process and irregular surfaces of the tunnel structures. Note also that the surface of the tunnel structure at the tunnel SS decreases approximately 25 m from the starting point of inspection ((d)–(f) and (h) in Figure 9) because the tunnel diameter changes (rectangular red box in (g) in Figure 9), resulting in changes in the HIs near 25 m. Therefore, a separate analysis was performed for this region at the tunnel SS for a fair comparison. Note that the PCM in Figure 9(g) was generated from the PCD of a round trip, indirectly confirming the accuracy of the FAST-LIO2 again because no blurring effect is observed in a region of changing tunnel diameter.

HIs estimated (a) excluding the curve fitting method, (b) excluding the ground jittering method, and (c) with the proposed method at the tunnel BY; HIs estimated (d) excluding the curve fitting method, (e) excluding the ground jittering method, and (f) with the proposed method at the tunnel SS; (g) 3D PCM around 25 m from the starting point of the experiment at the tunnel SS and (h) HIs at the tunnel SS with limited scanning conditions.
The mean, standard deviation, and robustness of the five HIs are listed in Table 4 for the tunnels BY and SS. The results, excluding those of the curve fitting and ground jittering methods, are also listed to demonstrate the contribution of each method to HI estimation. Interestingly, the curve fitting and ground jittering methods may not affect the mean values. Note that the mean value of HIs does not significantly change in the proposed method because the tunnel PCD was measured and evaluated at a healthy tunnel structure. In other words, the standard deviation would be the only metric to evaluate the accuracy of the proposed method in a healthy condition because there is no defect in the healthy tunnel structure. Specifically, the curve fitting method did not significantly affect the mean value of the HIs because the cylinder fitting method already estimated the tunnel wall PCD effectively. Note also that the curvature of the tunnel of measurement data is not significant enough to affect the mean value of a tunnel structure in the curved section. Moreover, the ground jittering method does not affect the mean value of the HIs but enhances the accuracy of the HIs because the proposed method eliminates noise from the distorted aligned transformation. The maximum difference of the mean value is 4 cm from the HI of the L in both tunnels BY and SS between the proposed method and that excluding the curve fitting and ground jittering methods. However, the standard deviations of the five HIs are significantly different. The mean of the standard deviations of the five HIs is 4.3 mm for the proposed method, but 10.6 mm and 9.8 mm for the proposed method excluding the curve fitting and ground jittering methods for the BY site, respectively. In the same manner, the mean of the standard deviations of the five His is 5.23 mm for the proposed method, but 25.86 mm and 12.83 mm for the proposed method excluding the curve fitting and ground jittering methods, respectively. These results clearly indicate that both methods contribute to decreasing the estimation error by more than four times for the tunnel SS. Specifically, the curve fitting method enhances the estimation accuracy for all the HIs because the estimation of the diameter D, which is directly correlated to the curve fitting method, significantly affects the estimations of the other HIs. Note that the standard deviation of the HIs may increase when the curve fitting method is not applied to the 3D PCD obtained from the curved region of tunnel structures. This is because the cylinder model estimation method is unable to accurately estimate the features of the tunnel shape when the PCD exhibits curvature measured from a curved region in the tunnel. Therefore, the scattered PCD in the transformed PCD from the 3D to the 2D cross-sectional plane enhances the performance of the standard deviation of the HIs. Moreover, the ground jittering method was also implemented to improve the estimation error performance of the coordinate transformation process from the 3D PCD to the 2D PCD on the cross-sectional plane. The ground jittering method effectively aligns the dislocated 2D PCD, leading to an improvement in the robustness of circle detection by more than two times. This enhancement is originated from the alignment of distorted PCD, which reduces the impact of noise on the detection process. In conclusion, the proposed curve fitting and ground jittering methods enhance both accuracy and robustness by effectively executing the coordinate transformation process. Specifically, the ground jittering method enhances the estimation accuracies of
Accuracy and robustness comparison of five HIs at BY and SS.

The smallest standard deviations are shown in bold font.
HIs: health indicators; RMSD: root mean square difference.
The RMSD between the full scan angle and limited scan angle was used as a matrix for robustness validation. The last row of Table 4 indicates the RMSDs of the five HIs between the experiments at the tunnel SS. The RMSDs are less than 0.6 cm for five HIs at the SS, confirming the robustness of the proposed tunnel structure monitoring method. The difference between the two methods was analyzed quantitatively because the ground truth was not available. This finding also implies that monitoring tunnel structures is feasible, even though some angles behind the 3D LiDAR are covered by other equipment. Therefore, extra inspection equipment, including infrared and optical cameras, could be mounted on a mobile robot together with the 3D LiDAR.
Discussion of field applications
This study proposes a long-term health monitoring method with five HIs from 3D PCD measurements. The proposed method can be employed in real-world applications as follows.
First, the detection of outliers in the 3D PCD correlated with HIs would be an effective method of identifying local damage and its location because the 3D LiDAR can measure the shapes of tunnel surfaces, such as exfoliations and deep sinks. These phenomena could be classified as abnormal PCD, indicating that incorporating anomaly detection on local surfaces into the proposed method could be an interesting research topic.
Second, the crack size can be estimated using 3D PCD by fusing the information from the optical images. Cracks can be recognized using several semantic segmentation methods involving deep neural networks, 51 but the crack size is difficult to determine from only a crack image because the crack size in pixels is correlated with the distance and angle from the optical camera to the crack. In contrast, the 3D LiDAR could measure the lengths between points regardless of the distance and angle between the crack and the 3D LiDAR, indicating that the crack size could be quantified by combining PCD from the 3D LiDAR and optical camera images. Long-term observation of this information will reveal crack propagation trends that are very important for assessing the structural health of tunnels and other building structures because cracks are the first indicators of other types of damage, including water leaks and efflorescence. 52
Eventually, all real-world applications could be included in 3D global tunnel damage maps by employing digital twin technology because the proposed method provides 3D PCMs of tunnel structures. Specific damage information from novel inspection sensors can be merged with global tunnel damage maps, enabling proactive operation and maintenance of infrastructures.
Conclusions
This study presented a long-term cost-effective and autonomous health monitoring method to inspect tunnel structural transformation using 3D LiDAR and a mobile robot. The proposed method includes a 3D mapping phase with a tightly coupled LIO and HIs extraction phase employing novel signal processing and coordinate transformation methods. FAST-LIO2 provides 3D PCMs and robot location information with high accuracy and robustness, facilitating the extraction of the raw 3D PCD at a specific location of interest. Moreover, the ICP method with edge features accurately registers periodic PCD measurements to the reference PCD in tunnels because edges are effective features in tunnel structures. HIs can be accurately calculated by employing the RANSAC and coordinate transformation from 3D to 2D cross-sectional coordinates for efficient HI extraction. Field experiments demonstrated the effectiveness of the proposed method and its embedded system. Specifically, tightly coupled LIO outperformed the other 3D PCM methods. Moreover, the novel signal processing and coordinate transformation methods ensure accurate and robust structure health state assessment. These advantages of the proposed method and embedded system will facilitate patrol inspection of tunnel structures to ensure the reliability and safety of infrastructure.
Supplemental Material
sj-docx-1-shm-10.1177_14759217231157237 – Supplemental material for Long-term monitoring method for tunnel structure transformation using a 3D light detection and ranging equipped in a mobile robot
Supplemental material, sj-docx-1-shm-10.1177_14759217231157237 for Long-term monitoring method for tunnel structure transformation using a 3D light detection and ranging equipped in a mobile robot by Siheon Jeong, Min Gwan Kim, Joon-Young Park and Ki-Yong Oh in Structural Health Monitoring
Footnotes
Declaration of conflicting interests
The author(s) declared no potential conflicts of interest with respect to the research, authorship, and/or publication of this article.
Funding
The author(s) disclosed receipt of the following financial support for the research, authorship, and/or publication of this article: This research was supported by the Korea Electric Power Corporation through the KEPCO Research Institute (Grant number: R20XO02-5) and a National Research Foundation of Korea (NRF) grant funded by the Korean government (MSIT) (No. 2020R1C1C1003829).

Supplemental material
Supplemental material for this article is available online.
References
Supplementary Material
Please find the following supplemental material available below.
For Open Access articles published under a Creative Commons License, all supplemental material carries the same license as the article it is associated with.
For non-Open Access articles published, all supplemental material carries a non-exclusive license, and permission requests for re-use of supplemental material or any part of supplemental material shall be sent directly to the copyright owner as specified in the copyright notice associated with the article.
