
Abstract
This study presents the development of a paint condition evaluation (PCE) system that integrates a wall-crawling drone with a laser thermography module for the remote and rapid inspection of steel bridge paint conditions. A wall-crawling drone was employed to access hard-to-reach areas for inspection. The drone crawled along the inspection surface when it arrived at the target inspection area. Simultaneously, the laser thermography module heats the target surface using a laser beam, and the resulting heat responses are recorded using an infrared (IR) camera. The recorded heat responses were analyzed using the PCE algorithm developed in this study, enabling visualization and quantification of the paint thickness distribution and hidden delamination. The key contributions of this study include (1) the integration of laser thermography with a drone for rapid and remote PCE, (2) inspection of inaccessible areas within a bridge structure using a drone with motorized wheels, and (3) automated quantification and visualization of invisible paint thickness distribution and hidden delamination. The performance of the PCE system was validated through lab-scale and field-bridge tests, demonstrating the successful visualization of the paint thickness and delamination area. The quantification error was less than 10 μm for paint thickness and 1 cm2 for delamination area.
Keywords
Introduction
Paints play a crucial role in ensuring the structural durability of steel bridges. Key considerations for paint condition evaluation (PCE) include the inspection of abnormal paint thickness and delamination. Steel bridges are susceptible to accelerated degradation without properly managing paint conditions, which may compromise their design lifespan.1–3 Over time, paint thickness tends to decrease due to weathering, UV exposure, mechanical abrasion, and delamination caused by mismatches in thermal expansion between the coating and the steel substrate. According to the bridge management standards in South Korea and the United States, the paint thickness should stay within ±5% of the design standards, and paint delamination is not allowed.4,5 As the number of aging infrastructures increases, evaluating paint conditions becomes essential for extending the lifespan of steel bridges. 6 Eddy-current sensors are often used for paint thickness measurements because of their high accuracy, low weight, and affordable price.7–9 However, as eddy-current sensors are contact-type devices, they only provide single-point measurements and require a long time to inspect large areas. Furthermore, their thickness measurement values often fluctuate depending on the inspector’s experience, making them susceptible to human error. 2
Another major challenge in bridge inspection is that the areas that require the most inspection, such as beneath bridge decks and high-rise pylons susceptible to corrosion, are difficult and dangerous for inspectors to access. 10 Currently, special vehicles are employed to inspect these hard-to-access areas. However, these vehicles often require traffic control and put inspectors in danger. To overcome this accessibility issue, drones with vision or infrared (IR) cameras have been utilized for bridge inspection,10–15 enabling the inspection of hard-to-reach areas. Nevertheless, no attempt has been made to quantify and visualize invisible paint thickness and hidden delamination using these drones.
Recently, vision cameras have been used to inspect visible surface paint delaminations on bridges. 16 Alternatively, Ellenberg et al. used passive thermography to visualize subsurface delamination in a bridge deck by tracing uneven temperature distributions. 14 However, its application is limited to bridge areas that are unevenly exposed to sunlight, and this technique is vulnerable to false alarms due to surrounding ambient heat sources. Also, its applicability remains limited in shaded areas where sunlight cannot reach—such as the underside of steel box-girder bridges—making it unsuitable for comprehensive bridge assessments.
Active thermography has been proposed for visualizing invisible paint abnormalities.17–20 This technique utilizes an external heat source to heat the target inspection area. It records the temperature responses induced by the heat source using an IR camera. Tang et al. and Mezghani et al. employed active thermography with a halogen lamp to visualize the relative variations in paint thickness across an inspection area.21,22 Lim et al. used a halogen lamp to visualize hidden paint delamination. 20 However, the performance deteriorates because of the uneven surface heating produced by the halogen lamp. Furthermore, the large equipment size and high-power requirements of halogen lamp-based active thermography pose challenges for drone integration. 19
This study proposes a PCE system integrating a wall-crawling drone with a laser thermography module. The PCE system enables instantaneous visualization and quantification of paint thickness distribution and hidden paint delamination. At the same time, the drone crawls through hard-to-access areas. The novelty of this study can be summarized as follows: (1) instantaneous and remote evaluation of steel bridge paint conditions; (2) automated quantification and visualization of invisible paint thickness distribution and hidden delamination; and (3) integration of a wall-crawling drone with laser thermography to inspect hard-to-access areas within large-scale steel bridges. The performance of the PCE system was validated through lab-scale and actual field-bridge tests, demonstrating successful quantification of paint thickness distribution with a resolution of 10 μm and delamination size of 1 cm2. Note that, due to the current design characteristics related to crawling speed and inspection width, the PCE system is optimized for precision-focused inspections of localized areas rather than broad area scanning.
The remainder of this paper is organized as follows. Section “Development of paint condition evaluation hardware system” presents the hardware configuration and working principles of the proposed PCE system. Section “Development of a paint condition evaluation algorithm” describes the proposed PCE algorithm. Sections “Laboratory tests” and “Field tests” focus on validating the performance of the proposed hardware and algorithms through laboratory-scale and field tests on real steel bridges. Finally, the section “Conclusion” concludes the paper with a summary and discussion.
Development of PCE hardware system
Overview of proposed steel bridge PCE
This study introduced a PCE system designed to assess the paint conditions of steel bridges. Figure 1 illustrates the operational procedure of the PCE system. First, the PCE system flies and attaches itself to the target inspection area. As the PCE system crawls over the inspection area, the line laser beam heats the inspection area, and the active IR camera captures the heat responses, instantaneously visualizing the paint thickness and delamination area. Once the inspection was complete, the PCE returned to the base station. The PCE system consisted of a laser thermography module and a wall-crawling drone. The development of the PCE system focuses on two key aspects: (1) instantaneous and automated PCE using a laser thermography module and (2) precise flight control and unmanned operation of a wall-crawling drone.
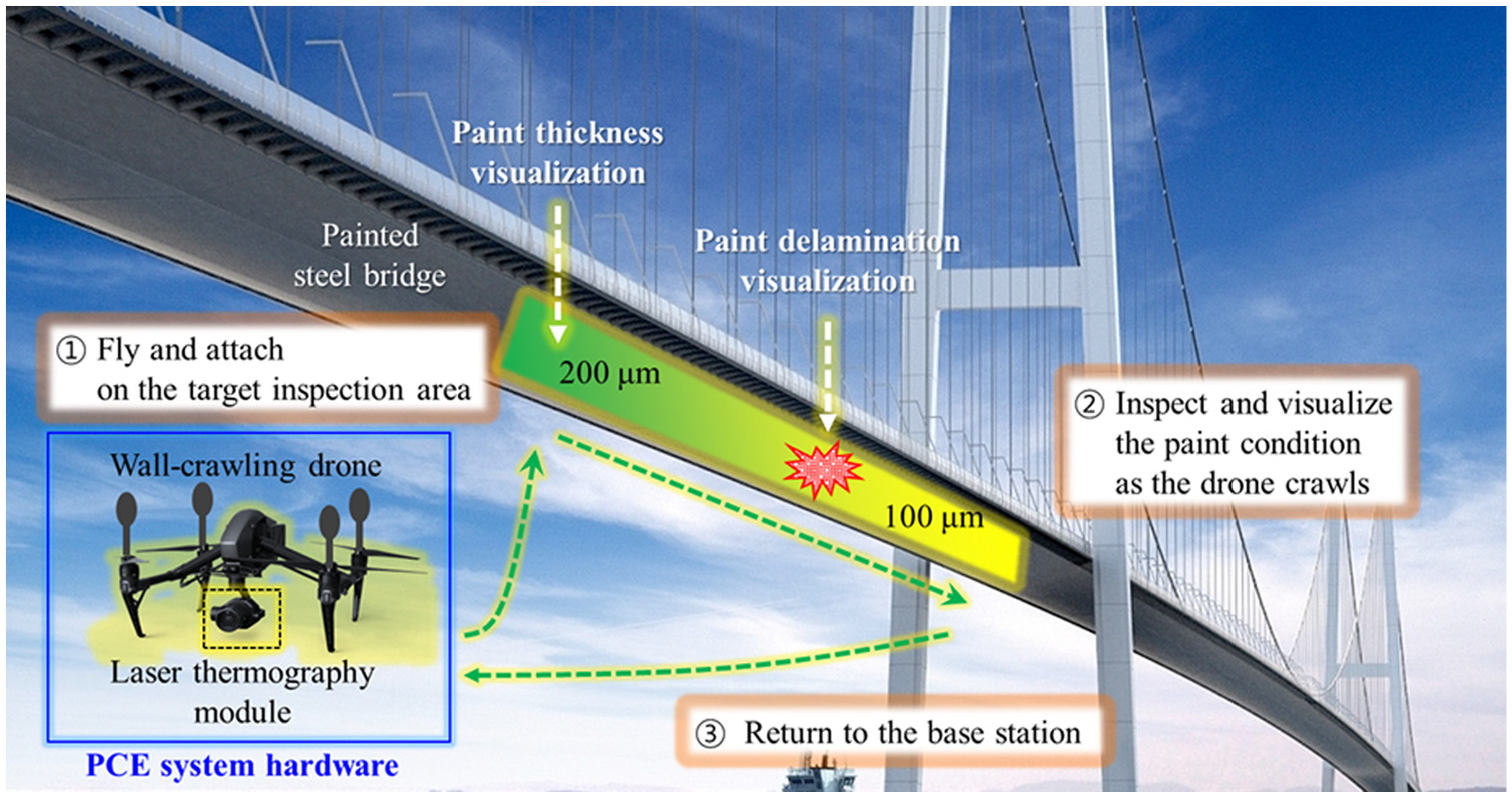
Overview of steel bridge PCE using the proposed PCE system.
Heat responses to bridge paint and inspection condition
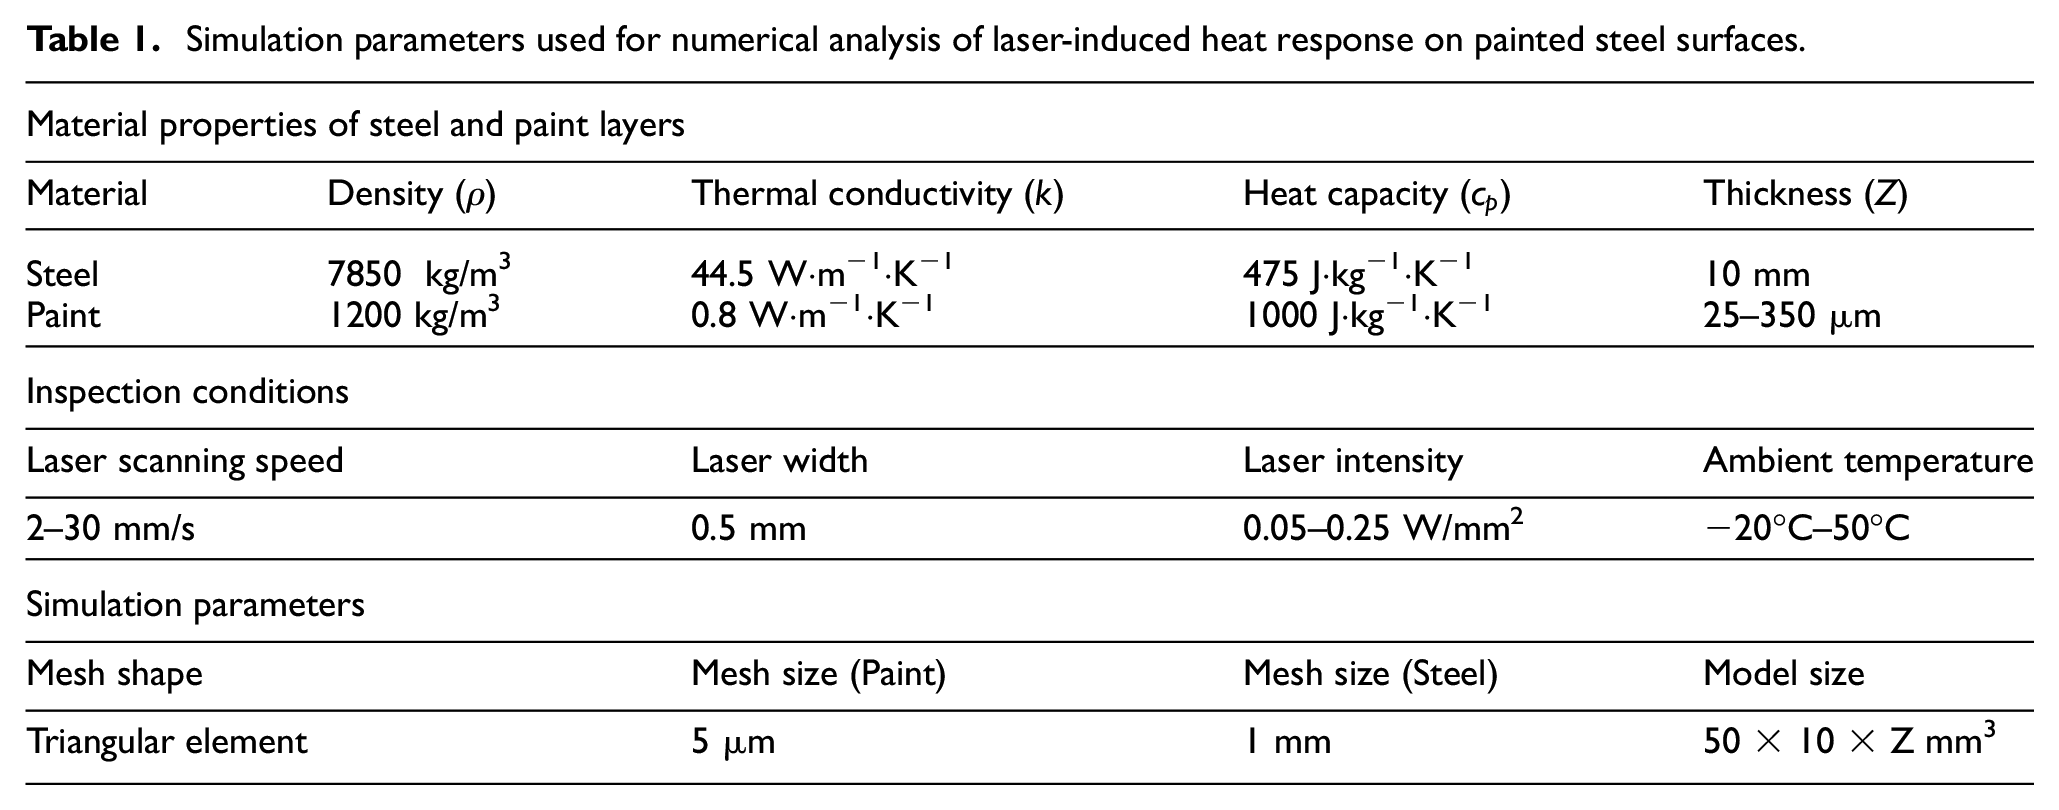
Once the laser scans the bridge surface, the resulting surface temperature variation pattern depends on the thickness and adhesion state of the paint layer. In general, a thicker paint layer exhibits a greater surface temperature increase upon laser excitation compared to a thinner layer. This occurs because thicker paints retain the heat generated by the laser for a longer duration, which can be attributed to the low thermal conductivity of paint relative to the steel substrate. In addition, when the paint is not properly adhered to the steel substrate, the heat energy generated on the paint surface remains trapped within the paint instead of transferring to the steel substrate. As a result, delaminated regions exhibit a higher temperature increase than areas where the paint is firmly bonded. This phenomenon has been validated through heat transfer simulations conducted using COMSOL Multiphysics, as shown in Figure 2. The simulation conditions are summarized in Table 1.
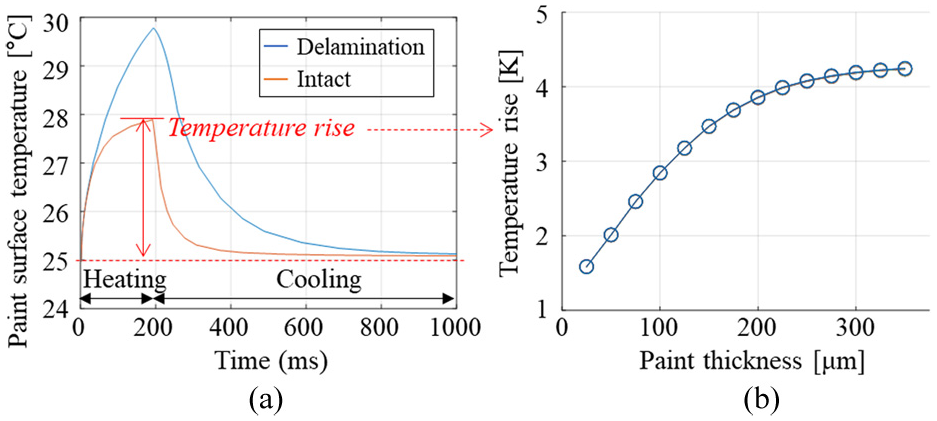
Numerical simulation results of laser-induced heat response on the paint surface under different conditions: (a) effect of delamination and (b) effect of paint thickness.
Simulation parameters used for numerical analysis of laser-induced heat response on painted steel surfaces.
On the other hand, since bridge paint condition assessment via laser scanning relies on surface temperature analysis, external factors such as laser output, scanning speed, and ambient temperature can influence inspection reliability. To evaluate these effects, additional heat transfer simulations were conducted using COMSOL Multiphysics, and the results are presented in Figure 3. Figure 3(a) presents the surface temperature increase corresponding to different laser output levels, indicating a linear relationship between laser output and paint temperature rise. In addition, Figure 3(b) depicts the surface temperature increase as a function of scanning speed, demonstrating that while higher scanning speeds lead to greater temperature increases, the relationship is nonlinear. Note that the changes in ambient temperature have minimal influence on the amount of the temperature rise after laser scanning on the paint surface, as shown in Figure 3(c). Therefore, to ensure inspection reliability using the PCE system, it is crucial to maintain stable laser output and scanning speed during operation. The hardware design strategies implemented to achieve this stability will be discussed in the following section.
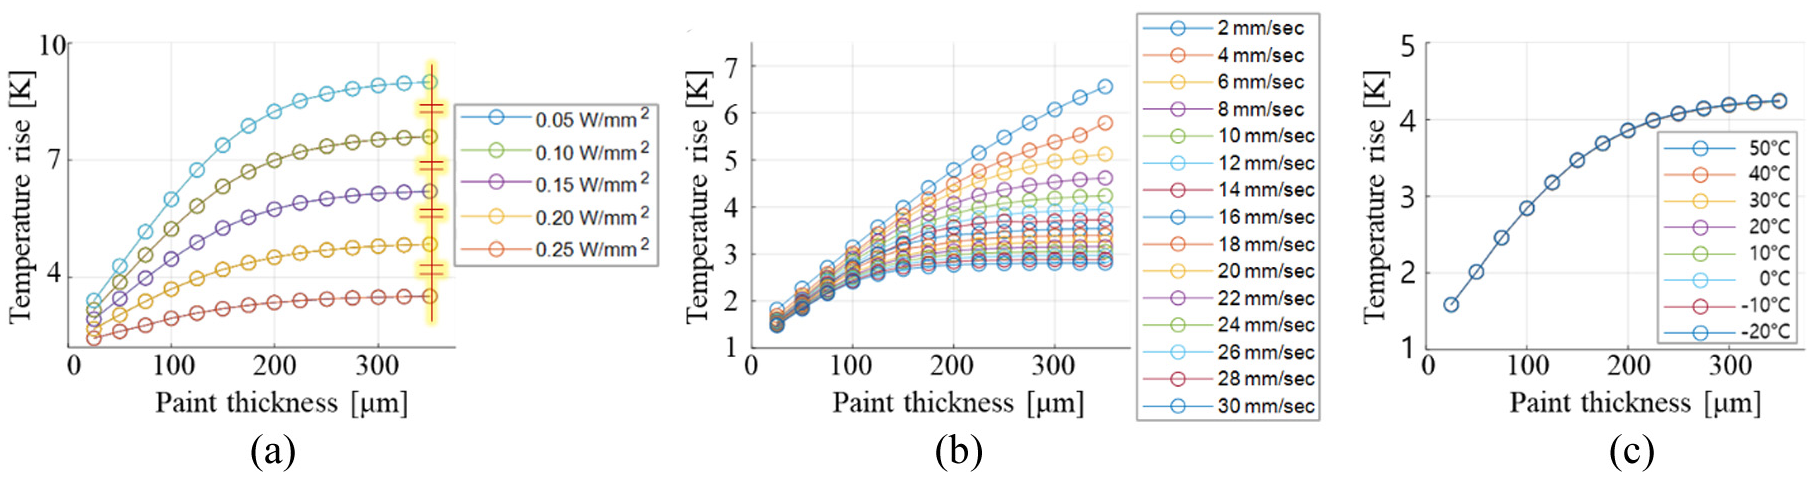
Numerical simulation results of laser-induced heat response on the paint surface under different external conditions: (a) effect of laser power, (b) effect of laser scanning speed, and (c) effect of ambient temperature.
Development of a laser thermography module
As shown in Figure 4, the laser thermography module consists of three units: heating, measurement, and control. The heating unit comprises a continuous-wave (CW) laser, a line beam generator, and a focusing lens, all connected by a laser fiber. The heating unit generated heat energy on the paint surface, and the measurement unit recorded the heat responses using an IR camera and a focusing lens. In addition, the measurement unit included a vision camera and a proximity sensor to facilitate the automated and unmanned operation of the drone. Specifically, the proximity sensor checks whether the distance between the module and the inspection surface meets the predefined criteria. The vision camera aids in estimating the scanning speed of the module by analyzing the patterns on the target inspection surface. The control unit consisted of a microcomputer and a laser controller, synchronizing all the units on the laser thermography module and processing the data acquired from the measurement unit for PCE.
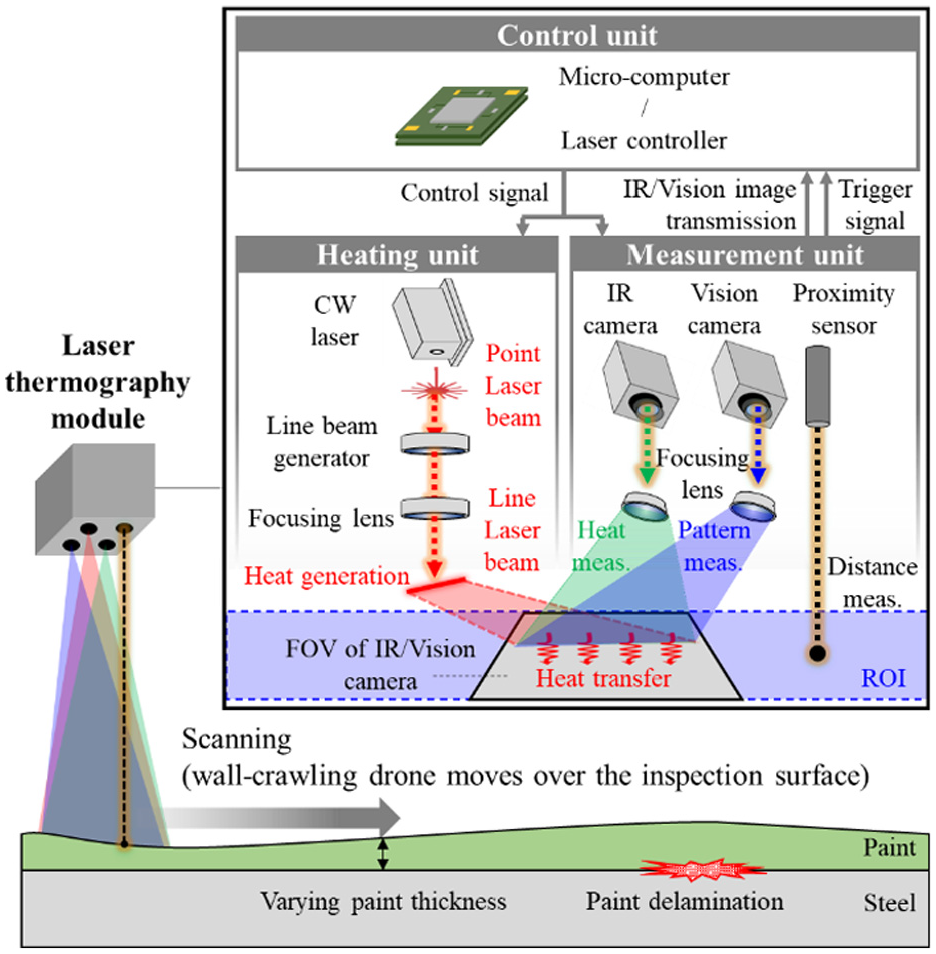
Overview of proposed laser thermography module operation, mounted on wall-crawling drone.
The laser thermography module must be mounted on a wall-crawling drone and operated during flight. Therefore, the hardware was specially designed to be lightweight. Figure 5 shows the hardware of the laser thermography module, which has a total weight of 3.7 kg, including the 0.9 kg battery for 25 min of operation. A commercial long-wave IR camera (A65SC; United States; FLIR) was used with a measurable wavelength range of 7.5–13 µm, a temperature resolution of 50 mK, and a pixel resolution of 640 × 512 pixels. The measurable angle of the IR camera was 60°, and the spatial resolution of the measured IR videos was 450 µm at a 250 mm standoff distance.
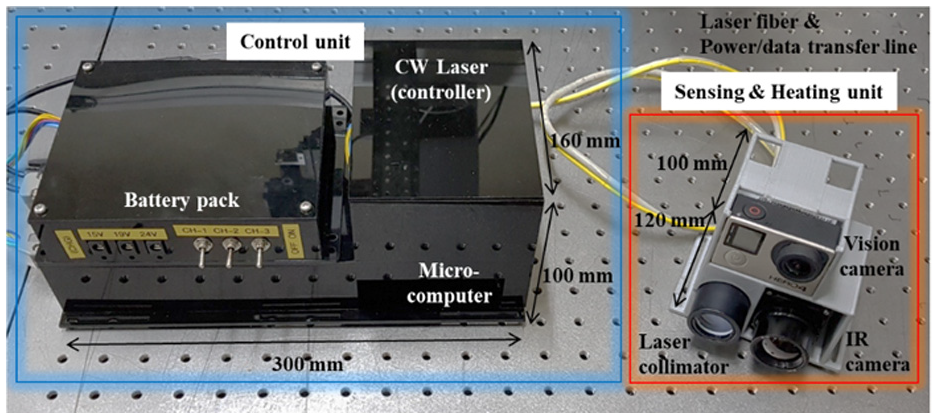
Hardware configuration of the laser thermography module.
Because commercial CW lasers are heavy and bulky, a custom-designed CW laser (Republic of Korea; Rhysics Photronics Co., Ltd.) was used. Standard CW lasers typically have heavy cooling components for the diodes and controller. However, when mounted on a drone, effective heat convection during flight permits the use of less robust cooling components, reducing weight and power consumption by over 60%. The maximum CW laser power was 10 W, and the point-laser beam was guided to the target structural surface using an optical fiber. A cylindrical lens and a focusing lens were mounted on the tip of the optical fiber to transform the point laser into a 15 cm long and 1 mm wide line laser beam. The line laser beam was focused at a working distance of 250 mm. The CW laser used in this study operates at a wavelength of 1064 nm, ranging in the short-wavelength IR. Longer-wavelength IR lasers are generally more effective at generating heat in polymers and organic paints due to their higher absorption. However, such wavelengths overlap with the detection range of the IR camera used in this study, potentially reducing the reliability of surface temperature measurements. To avoid this spectral overlap and to ensure compatibility with lightweight diode lasers suitable for drone-based applications, the 1064 nm wavelength was selected as a practical compromise.
Moreover, a commercial mini-computer (NUC7I7; United States; Intel Co.) equipped with 32 GB memory and a 4.0 GHz quad-core CPU was used to minimize the volume and weight after removing the exterior case and heat sink. The laser thermography module was remotely controlled by integrating a microcontroller with an Long Term Evolution (LTE) receiver, and the measured IR videos were monitored in real time. Finally, lithium-ion batteries were fabricated considering the voltage and power consumption of each device in the laser thermography module.
Unlike standard laser thermography equipment that requires a constant power source, this module is uniquely designed to operate on a battery, considering the flight time of the drone and the voltage requirements of each component. The laser thermography module is fully automatic based on the following principles: When the standoff distance between the laser thermography module and the target inspection surface reaches the preset inspection distance. The proximity sensor triggers the control unit. The CW laser emitted a point-laser beam guided through a laser fiber. The line beam generator transforms the point-laser beam into a line laser beam, increasing the instantaneous heating area. The focusing lens then directs the line laser beam onto the paint surface to generate heat. Simultaneously, the microcontroller triggered the IR camera, and the resulting heat responses on the paint surface were recorded as a stream of IR videos. The laser thermography module scans the target inspection area as the drone crawls over the paint surface. The scanning speed was precisely calculated using the paint surface pattern recorded using a vision camera. Finally, the recorded IR video was transmitted to the microcontroller for PCE.
Development of a wall-crawling drone
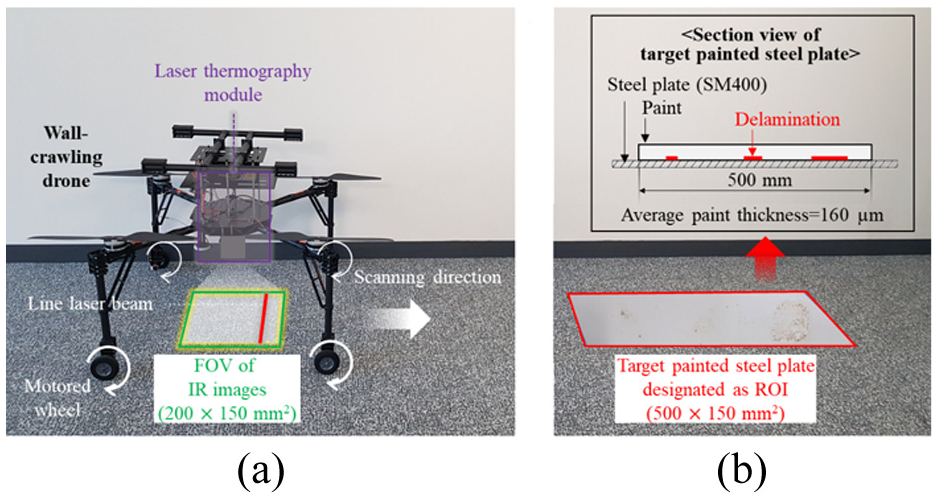
The PCE system utilizes a wall-crawling drone to scan the laser thermography module during PCE precisely. Figure 6(a) and (b) and Table 2 present the hardware configuration and specifications of the wall-crawling drone, respectively. The wall-crawling drone equipped with a laser thermography module could fly for 25 min and hover at a wind speed of 8 m/s. The drone was equipped with four motorized propellers and wheels, an inertial measurement unit, a global positioning system, an electronic speed controller, and a battery. The laser thermography module and four propellers were positioned in the middle of the drone, considering the center of gravity of the system. All the components, including the drone and laser thermography module, were integrated and fixed using lightweight carbon-fiber-reinforced polymer frames.
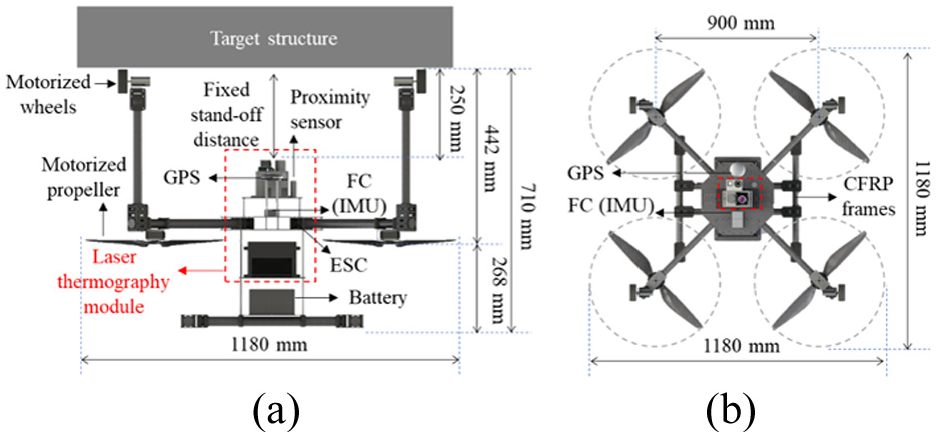
Hardware configuration of the wall-crawling drone: (a) side-view and (b) top-view.
Specification of wall-crawling drone.
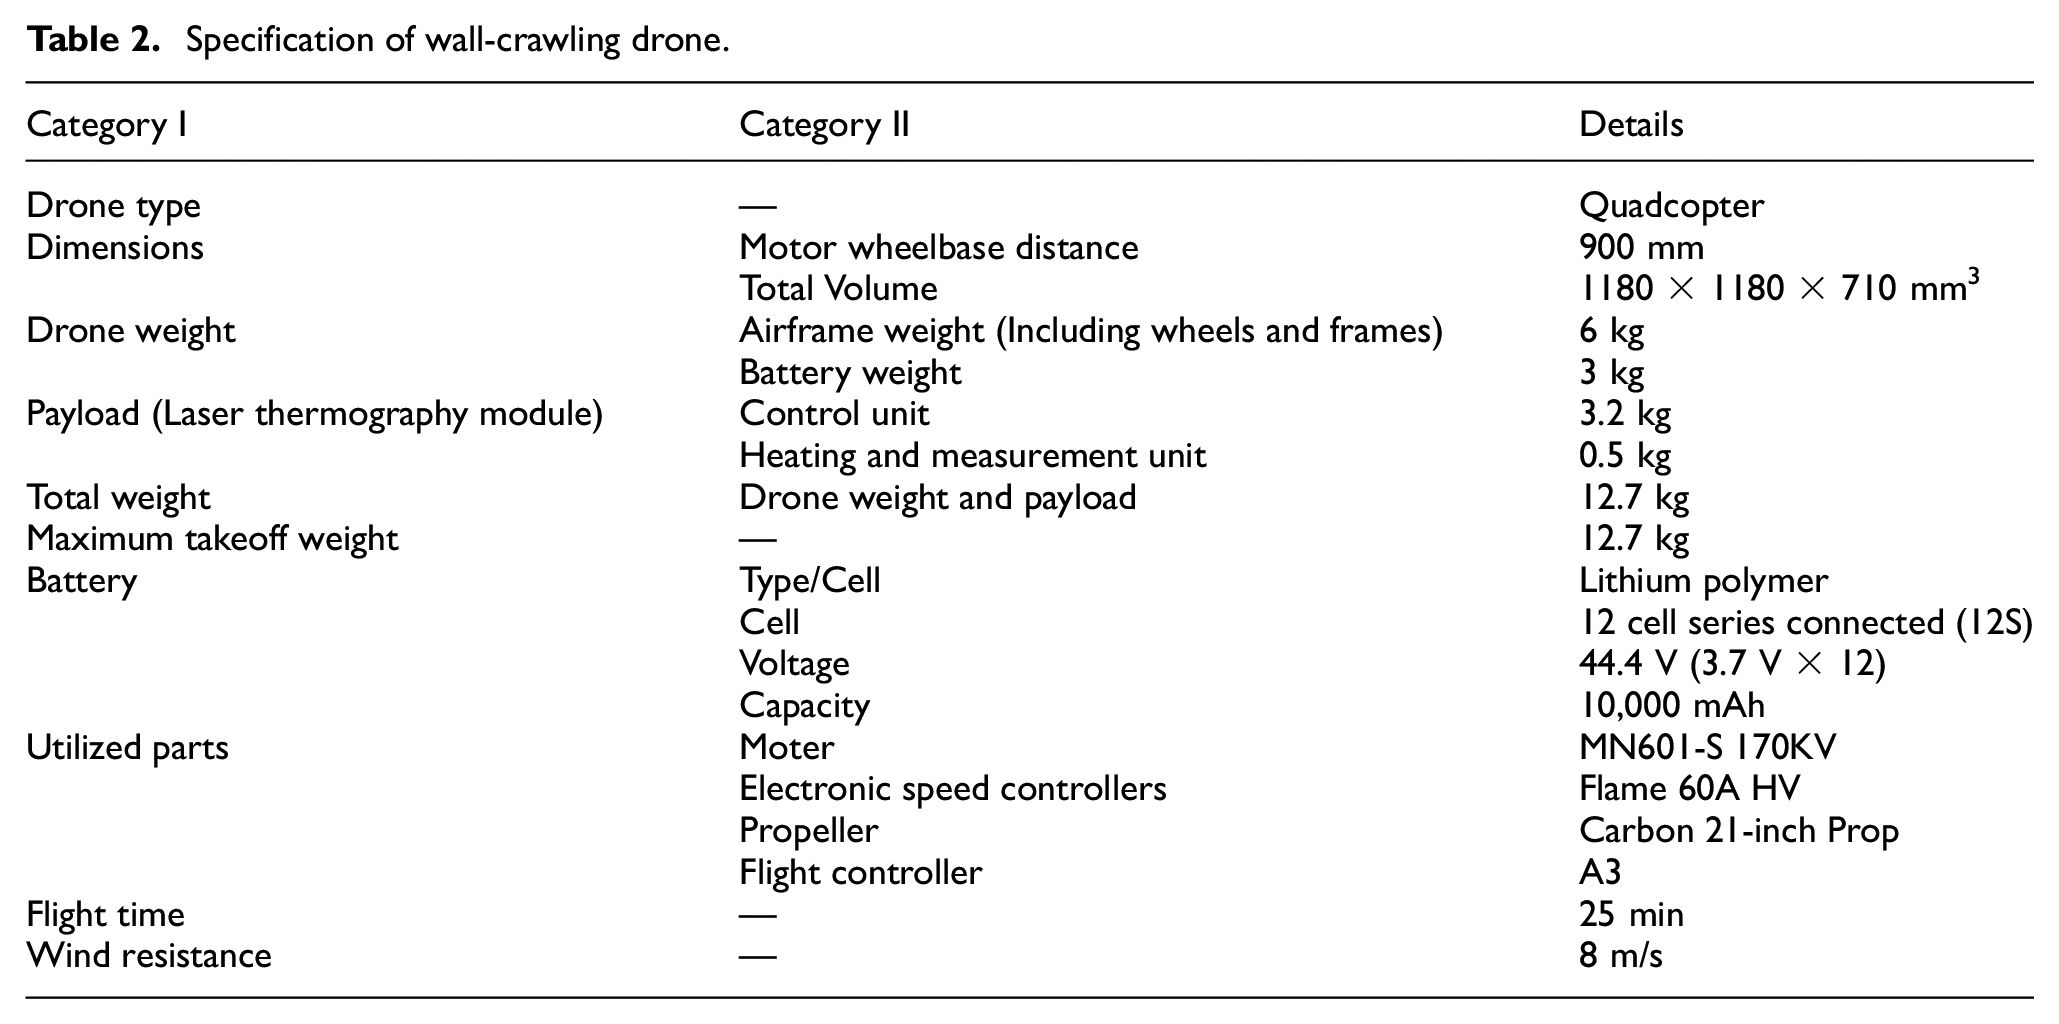
When designing a wall-crawling drone equipped with a laser thermography module, it is crucial to consider the relationship between the overall drone weight and the payload. Typically, to ensure a safe flight, the weight of the mission equipment should not exceed 30% of the total drone weight. Given that the laser thermography module weighs 3.7 kg, the total weight of the drone, widely known as the maximum takeoff weight (MTOW), should be at least 12.33 kg.
After establishing the MTOW, the motor thrust must be calculated. Development tools such as PX4 and ArduPilot recommend designing a motor throttle to maintain a reserve between 30% and 70%. For this wall-crawling drone, a throttle reserve of 35% was chosen, and motors (MN601-170 KV) and propellers (21-inch Carbon Propeller) provide a total thrust of 26.42 kg. According to the motor manufacturer’s thrust test results, at 62% throttle (a 38% reserve), each motor generates a thrust of 12.66 kg (±2% error rate).
Furthermore, the separation distance between the wheels and propellers must be carefully calculated to secure the necessary attachment force for wall-crawling. Stability during drone wall-crawling requires the center of gravity of the drone to be close to the target surface. However, the proximity can weaken the attachment force owing to the formation of vortices in the opposite direction. Therefore, the propeller length was set between 50% and 100% for the attachment-force tests. Experimental validation confirmed that stable attachment was achieved at 80%–85% propeller length, setting the distance between the propeller and the surface at approximately 442 mm.
Finally, DC motors were selected for horizontal movement while the drone was attached using full propeller thrust. The attachment force was calculated based on the flight safety margin of the drone, leading to the determination of the required DC motor torque. With a total thrust of 26.42 kg at 100% throttle and a 38% safety margin, the required thrust is 7.93 kg. A DC motor with a stall torque greater than 7.93 kg·cm was necessary, and considering safety margins, a motor with 12 kgcm stall torque (FIT0493) was used. This comprehensive approach ensures operational stability and mobility for drone tasks.
Using a wall-crawling drone, the distance between the laser thermography system and the paint surface was consistently maintained, as illustrated in Figure 6(a). This allowed the capture of well-focused video images and precisely controlled laser beam shapes and output while the drone was crawling. In addition, because the movement of the wall-crawling drone was implemented using wheels equipped with DC motors, data scanning at a constant speed and linear movement were possible. The propellers of the wall-crawling drone rotated continuously during the scanning process to maintain constant contact between the PCE system and the paint surface.
Development of a PCE algorithm
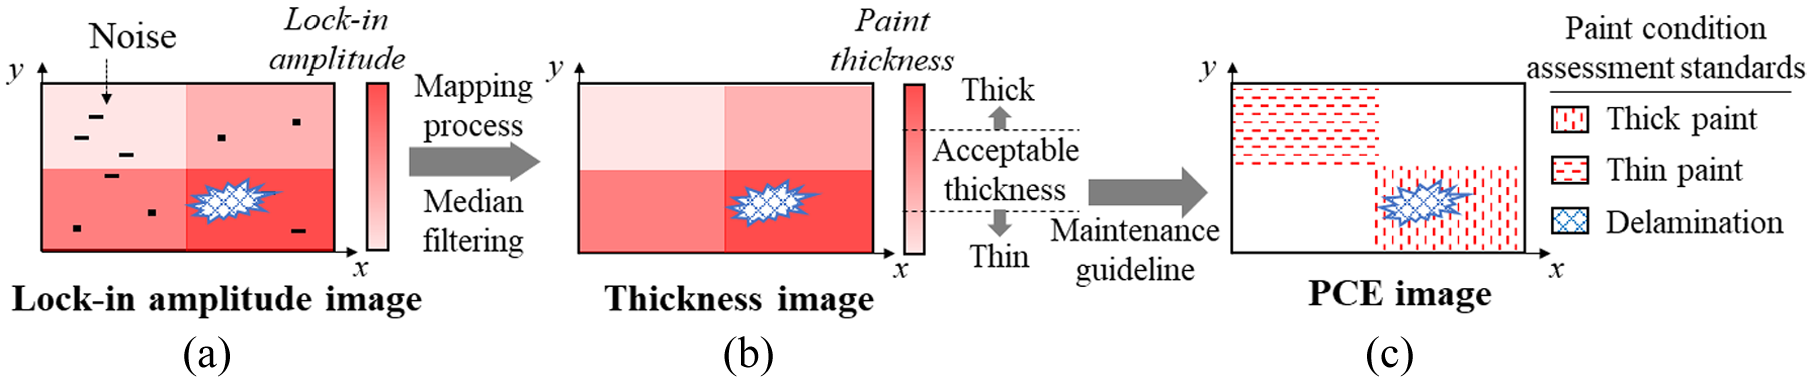
This section proposes a PCE algorithm based on heat transfer theory and statistical analysis. The algorithm is designed to analyze paint conditions using simple image processing and thermal analysis techniques, ensuring real-time inspection results while minimizing computational errors caused by drone motion noise and environmental variations. It automatically visualizes hidden paint delamination areas and invisible paint thickness distributions for PCE. Figure 7 provides an overview of the PCE algorithm, which consists of four steps: Step 1: IR video reconstruction, Step 2: paint delamination detection, Step 3: paint thickness quantification, and Step 4: PCE. The procedure is described in detail in the following sections.
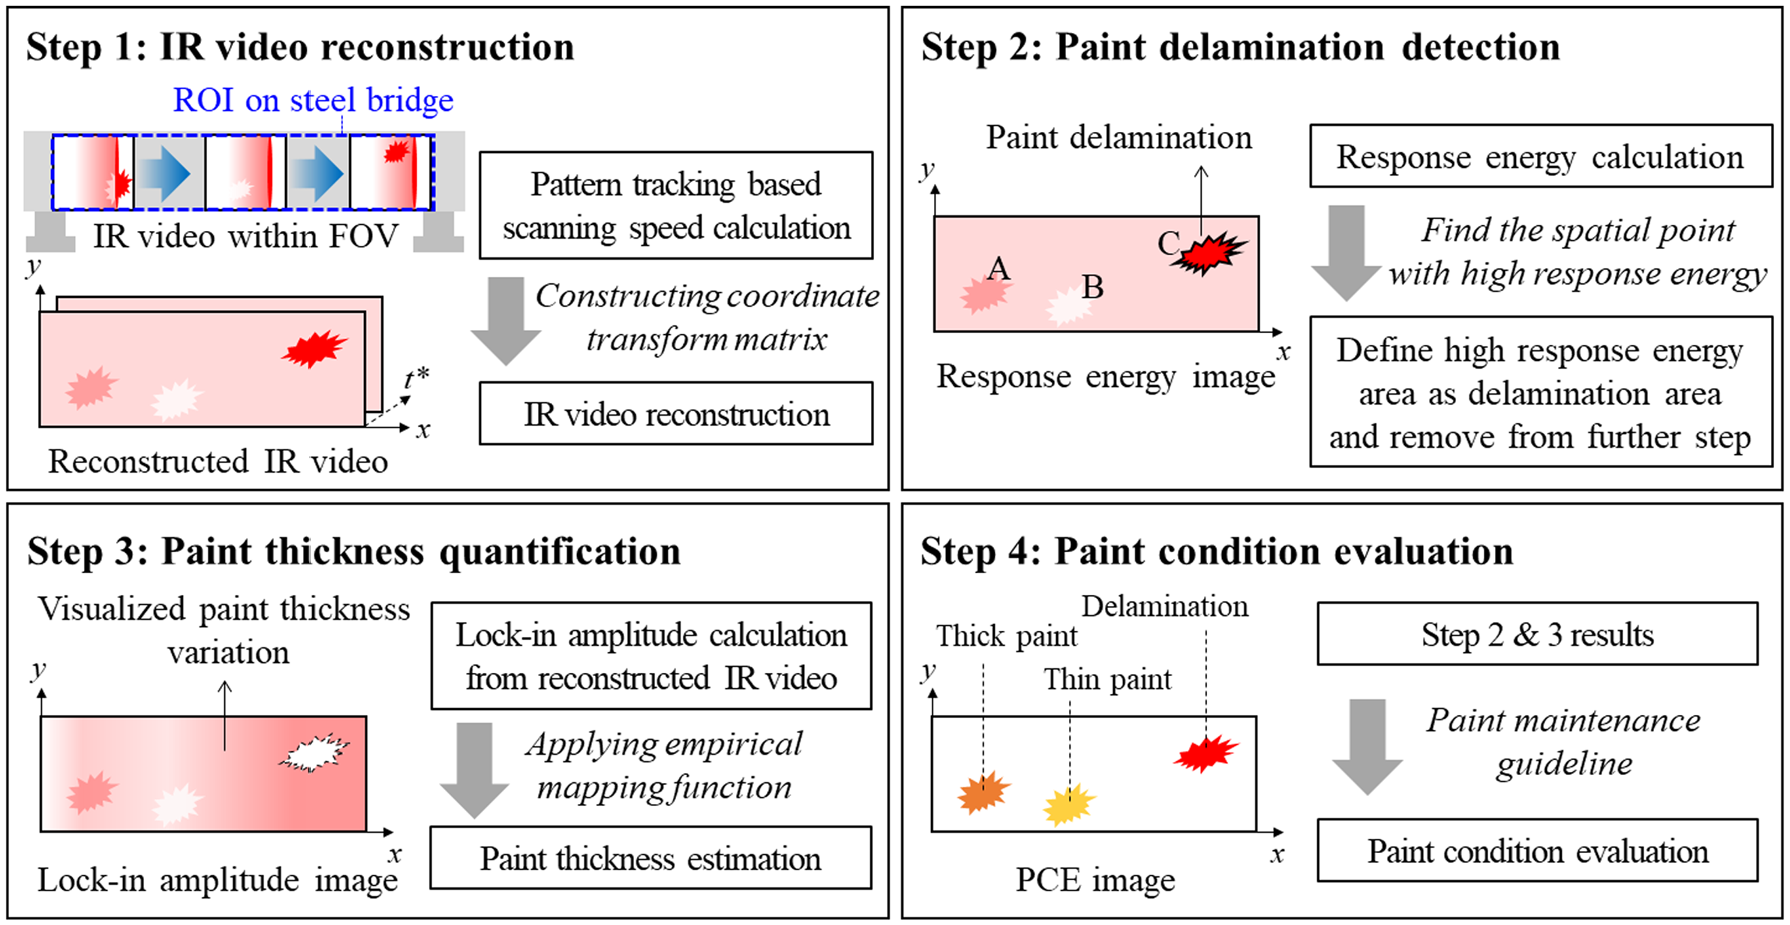
Overview of the paint condition evaluation algorithm.
Step 1: IR video reconstruction
Once the PCE system was attached to the paint surface, it started scanning along the target inspection area while emitting a line laser beam to generate heat on the paint surface. Ideally, the PCE system should constantly crawl on the paint surface to inject uniform heat energy. However, because external wind blows can vary the scanning speed, the vision camera traces the scanning speed. It disregards IR image frames acquired under abnormal scanning speeds, defined as exceeding ±10% from the target nominal speed. Thus, the PCE system avoids the performance degradation that could arise from variations in the drone’s movement speed. In general, the scanning speed and amount of energy injected into the inspection surface through the CW laser are proportional, and the increase in the temperature of the inspection surface is proportional to the amount of energy injected. However, when using a drone, changes in the scanning speed due to wind gusts result in discontinuities in the scanning data. Consequently, this study did not incorporate data correction based on the scanning speed.
Figure 8 illustrates the pattern recognition algorithm applied to the vision video to estimate the scanning speed of the PCE system in the local coordinate system (
Here,
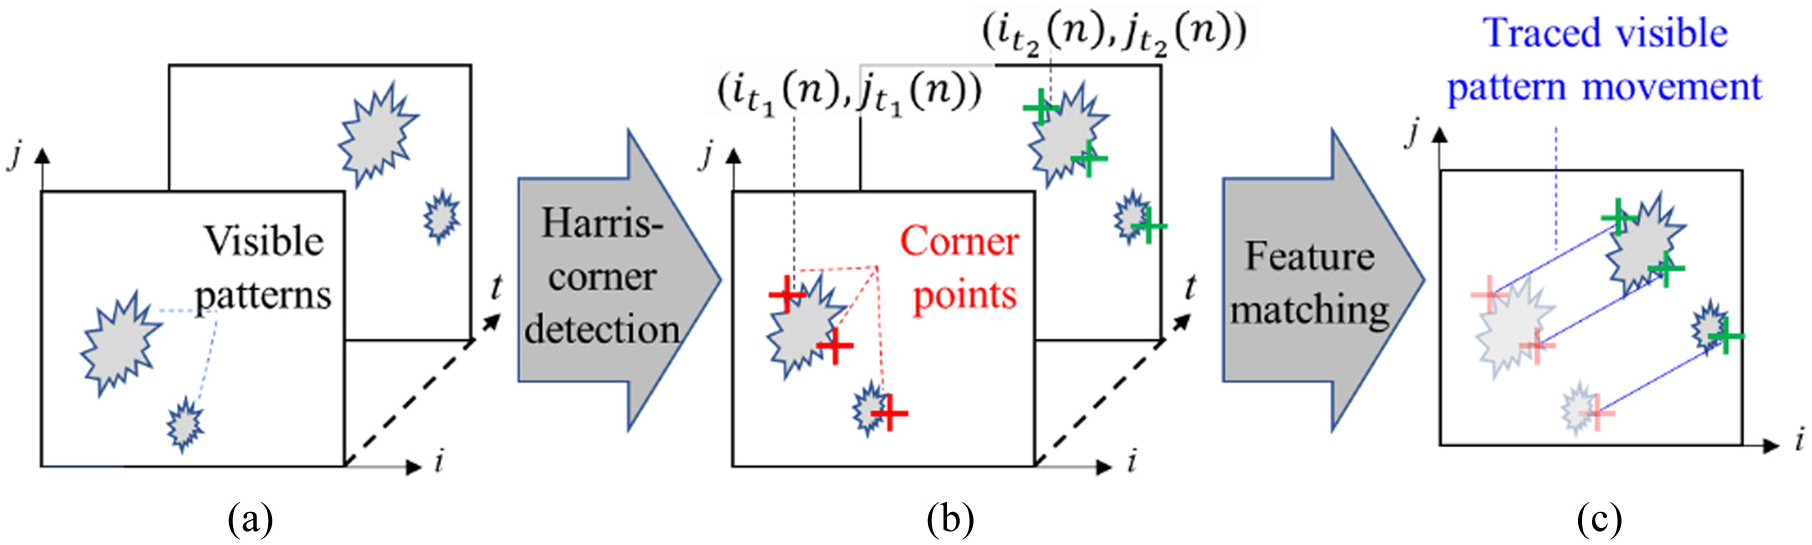
Tracing visible pattern movements from the vision video: (a) Vision images captured at times “
After calculating the scanning speed, the spatially and temporally varying heat responses displayed in the IR video within the limited field of view (FOV) were transformed into a temporally varying IR video within the entire region of interest (ROI), called the reconstructed IR video. This transformation was achieved using the following coordinate transform equation 23 :
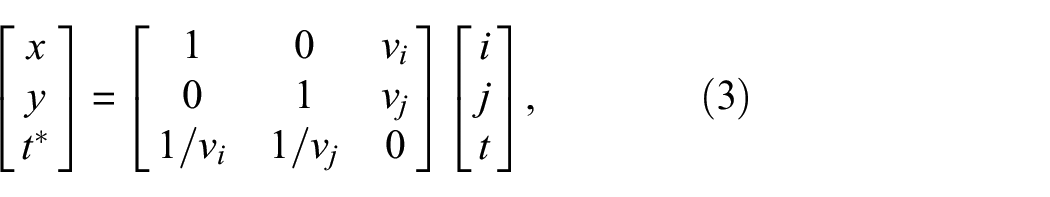
where
Step 2: Paint delamination detection
Delamination creates a gap between the paint layer and the steel member. Since the thermal conductivity of air (0.0261 W/(m·K)) is much smaller than that of steel (44.5 W/(m·K)), most of the heat energy generated on the paint surface stays on the paint layer rather than being transmitted to the steel member. Consequently, the paint delamination area exhibited a higher surface temperature after line laser beam irradiation than the surrounding intact areas. Based on this observation, paint delamination visualization processes were proposed, as shown in Figure 9.
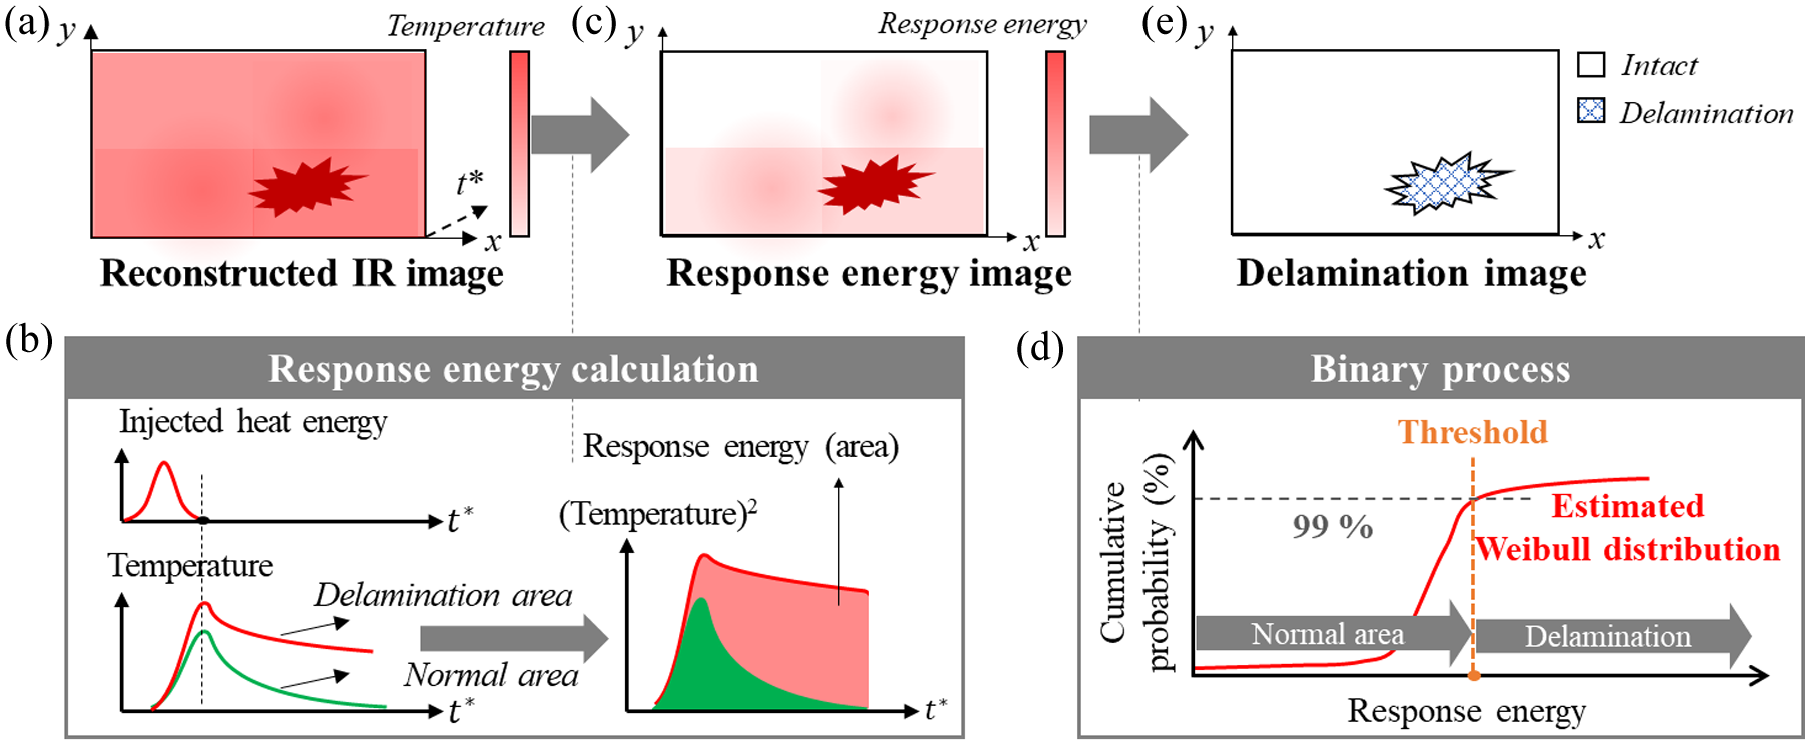
Paint delamination visualization processes: (a) Infrared video reconstruction, (b) response energy calculation, (c) response energy imaging, (d) binary process by fitting Weibull distribution, and (e) delamination visualization.
The response energy is the paint surface energy (heat) after line laser beam irradiation. Figure 9(a) and (b) illustrate the quantification process. The response energy image (E) in Figure 9 (c), which shows the response energy at each pixel point, is defined as follows. 24
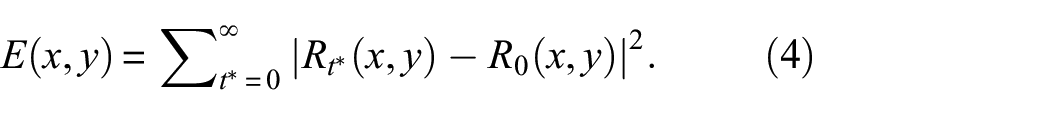
Here, R represents the reconstructed IR video, and the subscript
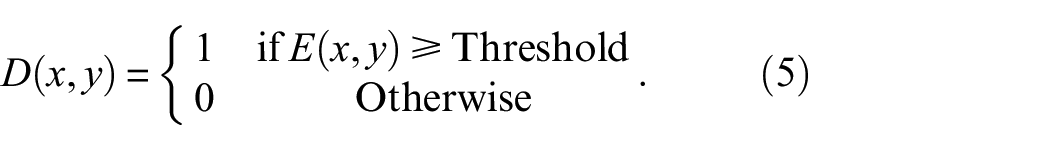
A binary process was applied to the response energy image to automatically identify the paint delamination area, as shown in Figure 9(d). First, a Weibull extreme value distribution was fitted to all pixel values in the response energy image. As the paint delamination area exhibited significantly higher response energy than the normal area, a threshold value corresponding to a one-sided 99% confidence interval in the upper tail was established for delamination identification. Finally, a delamination image (D) was generated from the response energy image, as shown in Figure 9(e). Since delamination is detected using a statistical outlier analysis approach, it can be reliably identified across various types of common construction paints without the need for material-specific parameter tuning.
Step 3: Paint thickness quantification
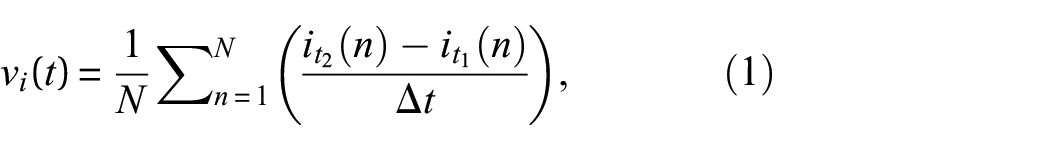
Once the paint delamination area is identified, the paint thickness on the remaining paint surface can be quantified. Because the thermal conductivity of steel (44.5 W/(m·K)) is 200 times higher than that of paint (0.2–1.0 W/(m·K)), the paint surface temperature decreases more quickly as the paint layer becomes thinner. To quantify the variation in the paint surface temperature following line laser beam scanning, a lock-in amplitude image (A) was calculated as follows:
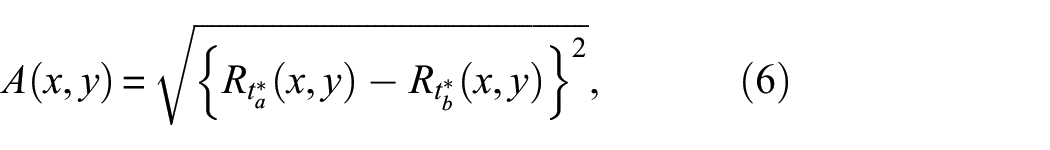
where

where A′ denotes the modified lock-in amplitude image and a and b represent the horizontal and vertical mask sizes of the median filter, respectively.
PCE processes: (a) lock-in amplitude image, (b) paint thickness image, and (c) PCE image.
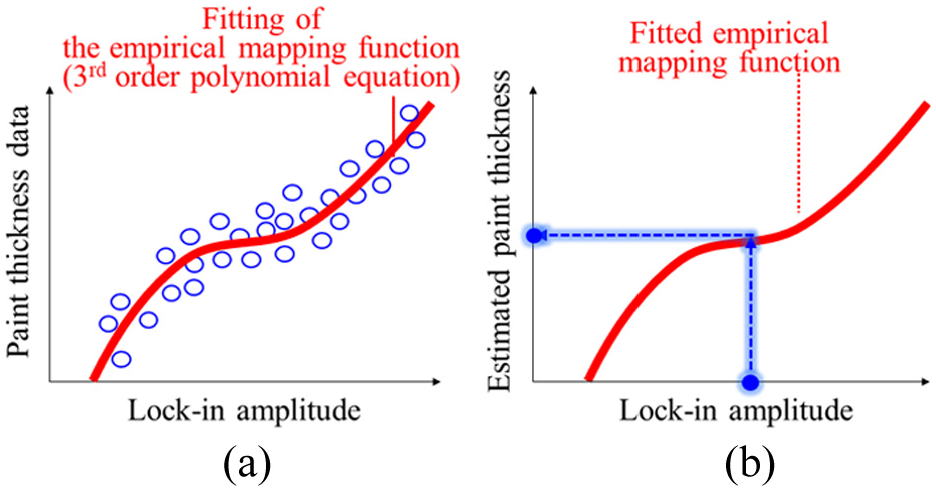
Once the modified lock-in amplitude image was calculated, the paint thickness was quantified using an empirical mapping function that related the modified lock-in amplitude to the paint thickness. Figure 11(a) illustrates the fitting of the empirical mapping function to the lock-in amplitude and paint thickness training dataset. A commercial contact-type paint thickness gauge measured the reference (ground-truth) paint thickness. It should be noted that this mapping function needs to be separately established depending on the type of paint used. A third-order polynomial regression was used to approximate the mapping function. After fitting the mapping function, the paint thickness at a specific pixel point is estimated from the corresponding lock-in amplitude, as shown in Figure 11(b). This process was repeated for the entire ROI to visualize paint thickness, resulting in constructing a paint thickness image, as shown in Figure 10(b).
Paint thickness quantification processes: (a) construction of the empirical mapping function and (b) paint thickness estimation using the fitted empirical mapping function.
Step 4: PCE and visualization
The PCE and visualization were performed based on facility management standards published by the Korea Authority of Land and Infrastructure Safety (KALIS). The facility management standard published by KALIS quantitatively describes the safety-grade judgment criteria for each structural member and material for the objective maintenance of facilities. According to the standard, if the average paint thickness deviations are 5%, 30%, 70%, and 99% of the nominal paint thickness of the target bridge span, the paint condition of the inspected area is ranked as grades A, B, C, or D, respectively. In addition, if paint delamination was present, the paint condition was evaluated as grade E, the lowest grade. Based on this standard, a PCE image was constructed, as shown in Figure 10(c). The identified delamination and quantified paint thickness are visualized in the PCE image. Two types of defects are considered: paint delamination and abnormal paint thickness. The delamination area was traced using Step 2. In contrast, the abnormal paint thickness was identified by locating areas where the paint thickness value for each pixel did not meet the acceptable thickness criteria. The area of each paint defect was calculated by counting the number of pixels that did not meet the threshold and other criteria. The areas of abnormal paint thickness can be further classified as thick or thin.
Laboratory tests
Laboratory test procedures
Figure 12(a) presents an overview of the developed PCE system hardware and the corresponding laboratory tests. As shown in Figure 12(a), the PCE system hardware consisted of a wall-crawling drone equipped with a laser thermography module. The laboratory test was conducted without an actual flight using the drone’s four wheels and DC motors for scanning purposes. The laser thermography module attached to the floor automatically initiates operation upon receiving the trigger signal from the proximity sensor. The DC motors are configured to achieve a scan speed of 10 mm/s. During the scanning process, a line laser beam irradiated the test surface, and the resulting temperature changes were captured using an IR video. Simultaneously, a video was captured to estimate the scanning speed of the proposed PCE system.
Overview data acquisition sequence of laboratory test: (a) developed PCE hardware system and (b) target painted steel specimen.
Laboratory test specimen and results
Figure 12(b) shows the painted steel plate specimens used in the laboratory tests. The plate exhibited two types of paint defects: paint delamination and abnormal paint thickness. The paint layer was made of a gray-colored epoxy material (Korepox EH2350; Reupblic of Korea; KCC Corporation), and the base material was 3 mm thick SM400 structural steel. The target specimen had an average paint thickness of 160 μm, covering a 500 × 150 mm2 area, and the paint thickness was varied during the paintbrush application process. Paint delamination occurs when the steel plate beneath the paint layer rusts, creating air pockets between the paint layers.
As shown in Figure 13, the surface patterns, including the micro curvature of the paint surface, surface dust, and scratches on the painted steel specimen, were successfully extracted from the video. The scanning speed of the PCE system was estimated from these patterns. Based on the estimated scanning speed data, an IR video measured only at the targeted scanning speed was selected for further PCE. This approach ensured that the data used for analysis corresponded to the desired scanning speed and improved the reliability of the PCE process.
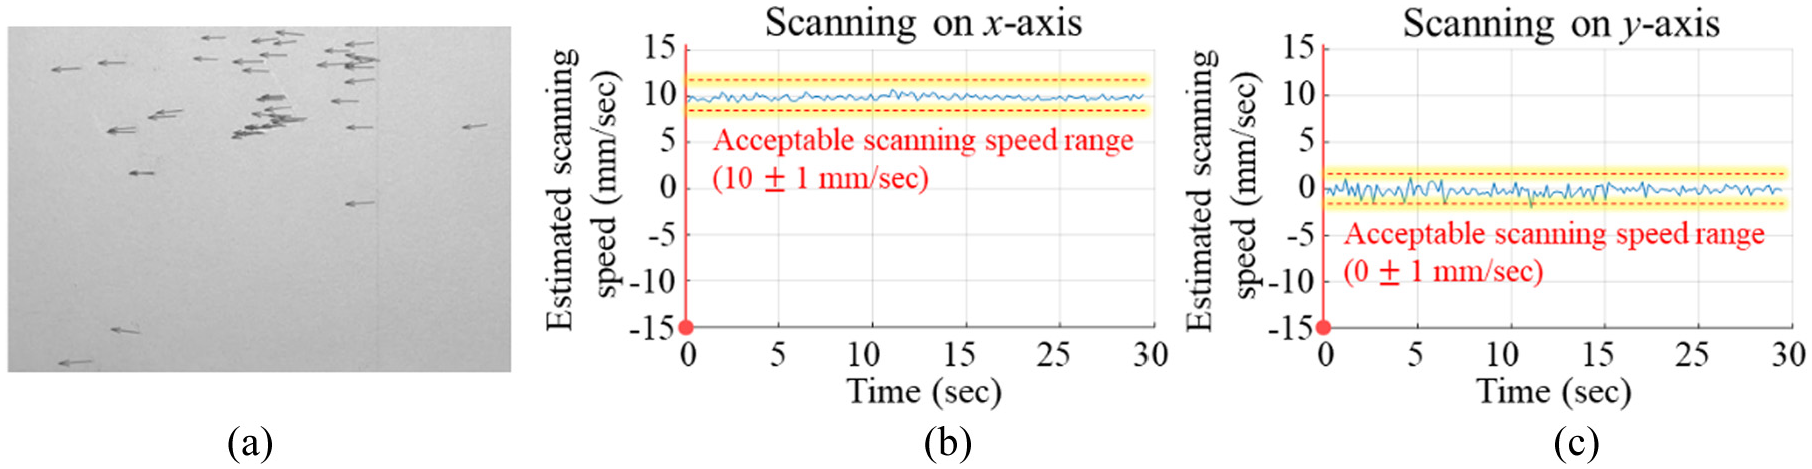
Scanning speed estimation from vision videos: (a) vision video with extracted motion vector arrows and scanning speed estimation along the (b) x and (c) y directions.
During line laser beam scanning of the paint surface, the corresponding heat responses within the FOV were measured using the IR video, as shown in Figure 14(a)–(c). As the line laser beam scanned over the paint delamination area, the surface temperature increased significantly (Figure 14(b) and (c)) compared with the normal area (Figure 14(a)), as discussed in Step 2 of the section “Development of a paint condition evaluation algorithm.” Then, the reconstructed IR video was created by applying a coordinate transform to the IR video, showing the heat responses as if the heat energy was simultaneously applied over the entire specimen surface, as shown in Figure 14(d) and (e). Note that, as explained in Section “Development of a paint condition evaluation algorithm,” Step 1, the horizontal axis data order of the IR video was replaced by the reconstructed time axis data order of the reconstructed image. Figure 14(d) and (e) show the surface temperature distributions to be inspected before and after laser heating, respectively, as reconstructed images.
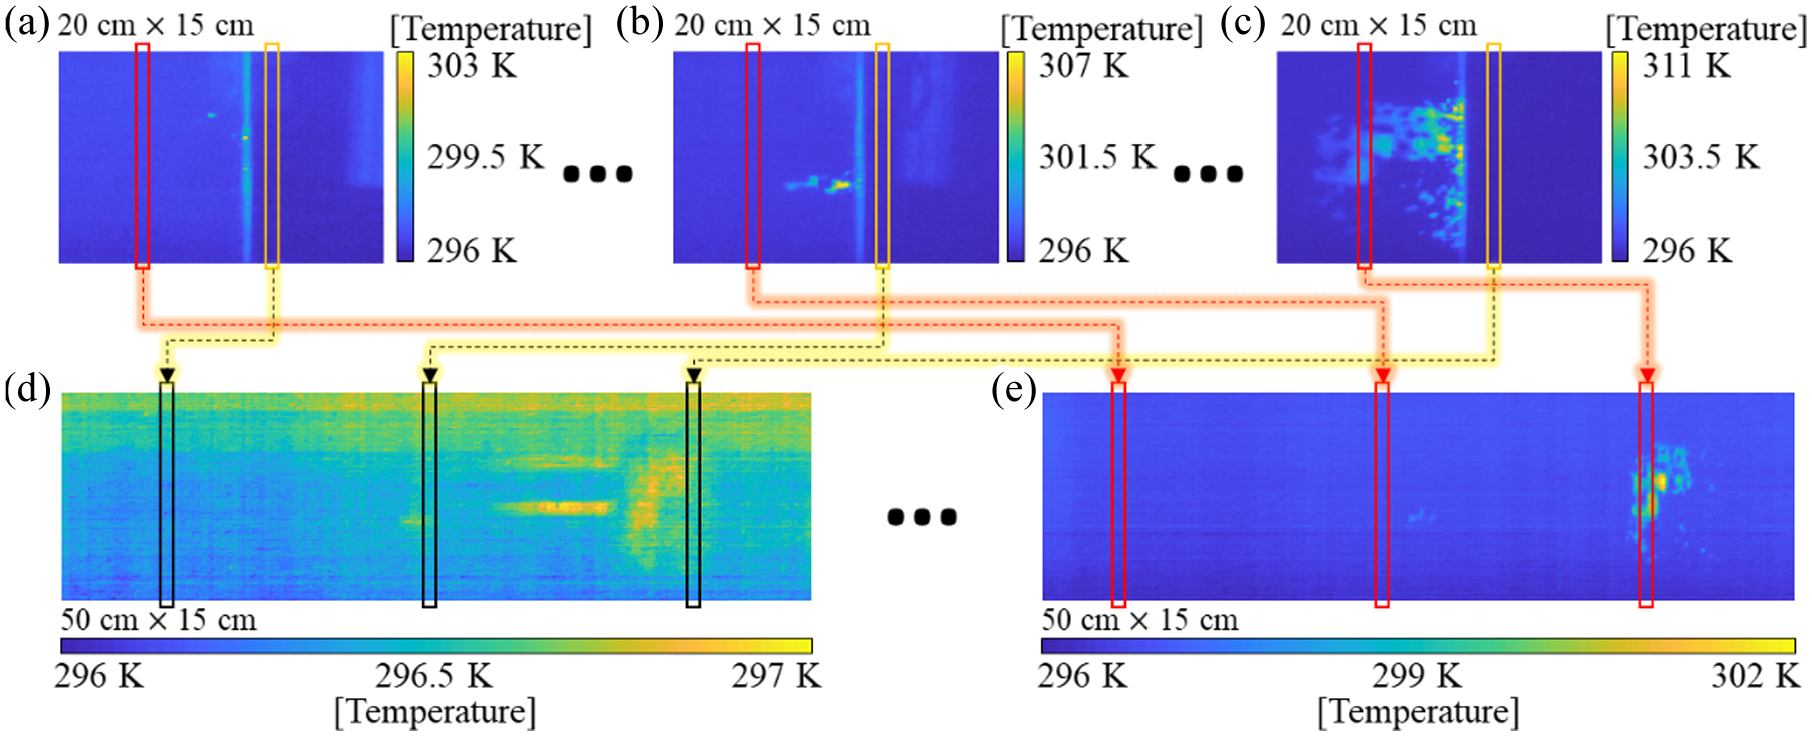
Construction of the reconstructed IR video in the reconstructed time domain using IR videos in the time domain.
Subsequently, the response energy calculation algorithms were applied to the reconstructed IR video, and the heat response throughout the measured ROI was visualized, as shown in Figure 15(a). Next, a binarized image is generated to classify the paint delamination area, as shown in Figure 15(b). In this case, the paint delamination area was estimated to be 579 cm. The lock-in amplitude value was calculated for the painted areas without delamination, as shown in Figure 15(c). The paint thickness was then quantified and visualized, as shown in Figure 15(d), using an empirical mapping function that was predetermined using the reference paint specimen. Here, an empirical mapping function that estimated paint thickness based on the lock-in amplitude value was constructed using training data of a total of 1500 spatial points (150 spatial points per specimen) that were measured from a total of 10 specimens prepared with a paint thickness deviation of 50 μm:
where T is the estimated paint thickness at spatial point (x, y). The average paint thickness was around 203 µm. Finally, each paint defect was successfully quantified and visualized in the PCE image shown in Figure 15(e).
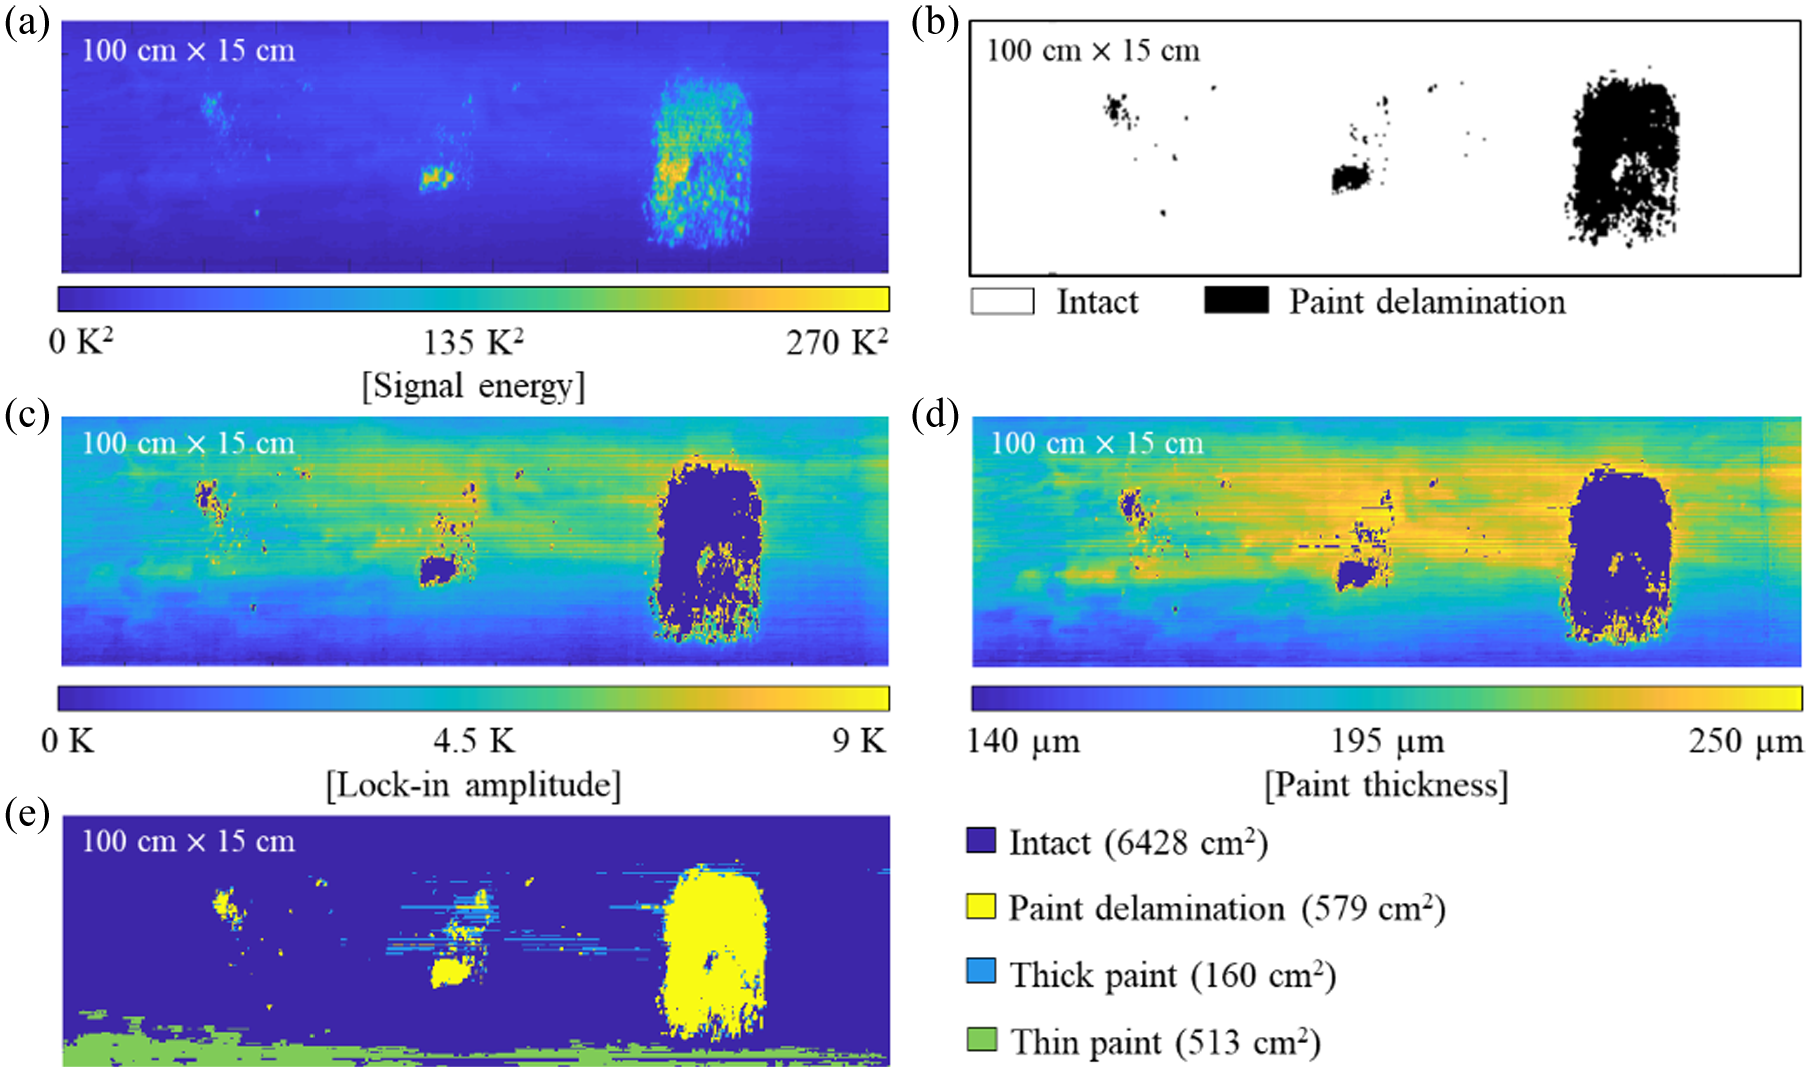
PCE results for laboratory test specimen: (a) response energy image, (b) binarized delamination image, (c) lock-in amplitude image, (d) paint thickness image, and (e) PCE image.
The laboratory tests revealed that the PCE system can estimate the paint thickness with less than 10% error (average 14 µm) and the paint delamination size with less than 7% error (37.55 cm2). The ground-truth delamination size was measured manually by scrubbing the paint layer around the delamination. Furthermore, the paint thickness estimation error was calculated by comparing the estimated paint thickness values with those obtained using a commercial eddy-current sensor (DUALSCOPE MP0R-FPW; Germany; Helmut Fischer GmbH).
Field tests
Target bridge
According to the Facility Management Act published by the Ministry of Land, Infrastructure, and Transport of South Korea, paint conditions are ranked from A to E based on the size of the abnormal paint thickness area and defects, as described in Step 4 of Chapter 3. The target bridge span stipulates a normal paint thickness of 240 µm. According to the facility management standard, a paint thickness range of 228–252 µm is rated as grade A, while a range of 168–227 µm or 253–312 µm is evaluated as grade B.
Field tests of the PCE system were conducted on a Deungsun steel box-girder bridge in South Korea, as depicted in Figure 16. The bridge had 40 composite spans of steel boxes and prestressed concrete girders. The Deungsun Bridge is exposed to high humidity because of its proximity to the river, making the steel box girders susceptible to delamination. Because the bridge was built in 1988, normal wear and tear were observed throughout the bridge.
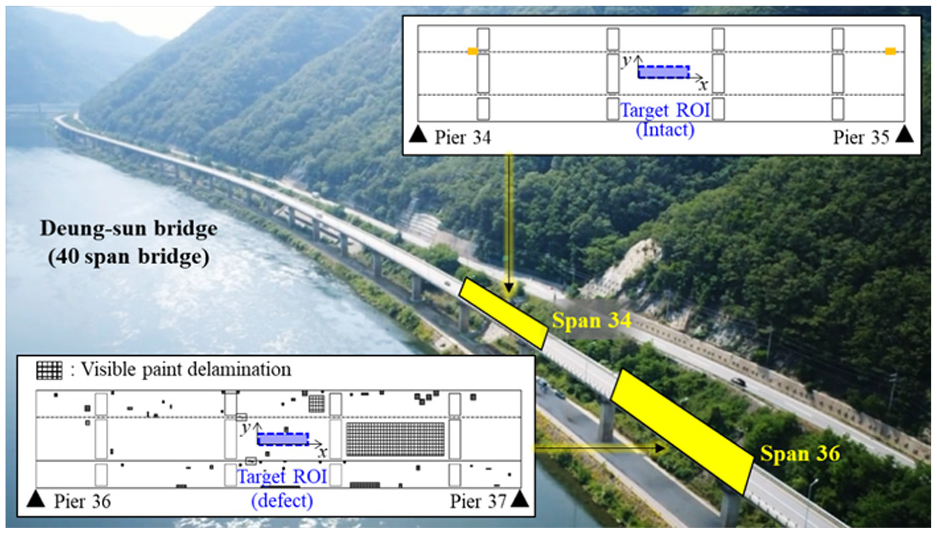
Deungsun bridge and target inspection areas.
Most of the steel box-girder spans were well maintained and evaluated as grade A or B. However, the 36th span of the bridge has an average paint thickness of 360 µm, significantly thicker than the nominal thickness. Because of its excessive paint thickness, the 36th span was more vulnerable to delamination. For the field tests, 100 × 15 cm2 segments of the 34th span (intact case) and 36th span (defect case) were inspected using a PCE system.
Field test procedures and results
Figure 17 presents an overview of the inspection of the Deungsun Bridge using the developed PCE system. First, the PCE system flows toward the inspection area, defined as the ROI beneath the target bridge girder. Once the PCE system was attached to the target inspection area, a DC motor was activated to rotate the motorized wheels attached to the wall-crawling drone. A trigger signal was sent to the laser thermography module. The wall-crawling drone then began scanning the paint surface at a constant speed of 10 mm/s, recording IR and vision videos while emitting a line laser beam. The IR and vision videos were acquired at a frame rate of 30 Hz, and the line laser beam had an output power of 10 W. Occasionally, the scanning speed fluctuated due to sudden wind blows. In such cases, videos recorded at various scanning speeds were excluded from further analysis. After scanning, the proposed paint defect inspection algorithm automatically visualizes the paint thickness and delamination.
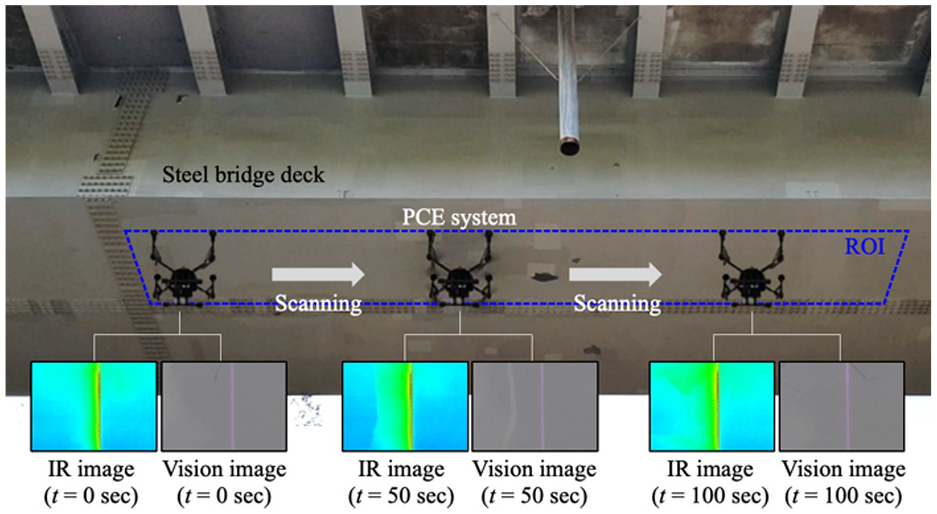
Inspection of Deungsun Bridge using the proposed PCE system.
Figure 18 illustrates the estimated scanning speeds of the wall-crawling drone along the x and y directions of the 36th span. The scanning speed was initially maintained at a target scanning speed of 10 mm/s and gradually increased because of the sudden wind gust. Consequently, data collected for only up to 110 s were used for data analysis. If the scanning speed increases, sufficient thermal energy required for inspection may not be generated in the paint, making it impossible to quantify the paint above a certain thickness. All field test results were validated by manual inspections conducted in accordance with the Facility Management Act published by the Ministry of Land, Infrastructure, and Transport of South Korea. Aerial work vehicles were used to access beneath the 34th and 36th bridge girders, which were 20 m above the ground.
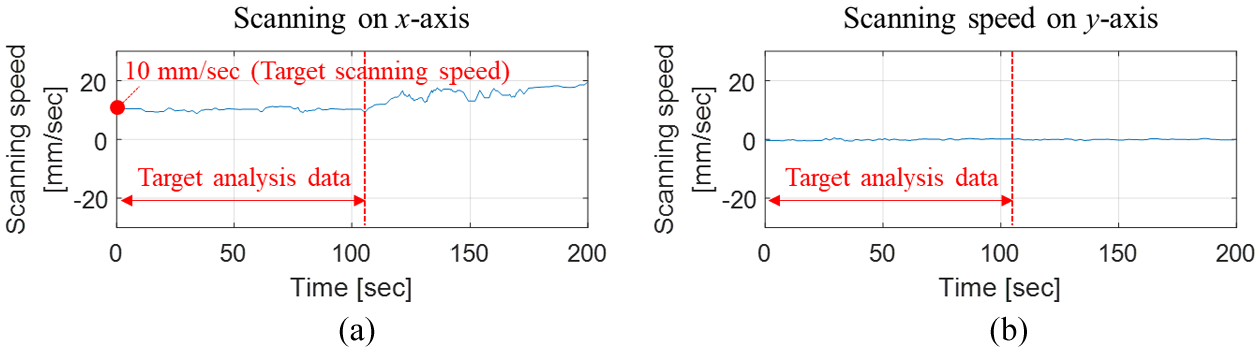
Scanning speed estimation of the wall-crawling drone along (a) the x-direction and (b) the y-direction.
Figure 19(a) to (d) presents the PCE results performed on the 36th span. Paint delamination areas were successfully identified within the target ROI, as shown in Figure 19(b). Then, the variation of the paint thickness over the entire ROI except the delamination area was quantified and visualized, as shown in Figure 19(c). The average paint thickness was estimated to be 386 μm. The delamination area, abnormal paint areas, which are either 30% thicker or thinner than the nominal thickness value, were estimated to be 85, 1076, and 39 cm2, respectively, representing 0.56%, 67.17%, and 0.26% of the ROI area, respectively, as shown in Figure 19(d). The overall thickness estimation error was around 42 μm compared with 100 reference measurements obtained by an eddy-current sensor. Furthermore, the error of the delamination area estimation was approximately 6.2% when compared with the manual visual inspection.
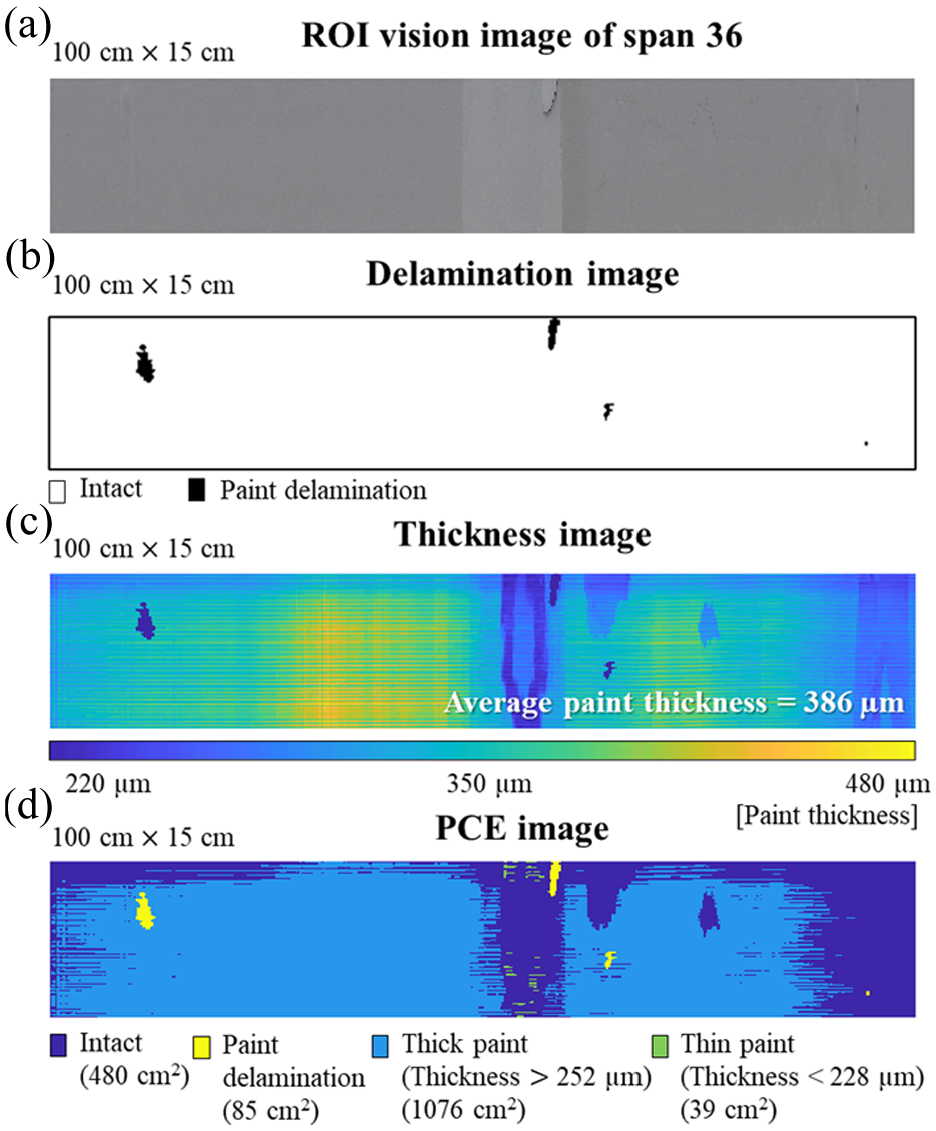
Paint condition evaluation results on defect areas in span 36: (a) ROI vision image of span 36, (b) Delamination image, (c) Thickness image, and (d) PCE image.
Figure 20 shows the test results obtained from the 34th span (normal area) of the Deungsun Bridge. Using the developed PCE system, paint delamination was not observed within the 34th span. The average paint thickness was around 248 μm, within the normal range of the nominal paint thickness of 248 μm. Regarding paint defects, the areas of paint delamination, either thicker or thinner than the normal paint thickness range, were estimated to be 0, 27, and 15 cm2, representing 0%, 1.82%, and 1.01% of the ROI, respectively. The paint thickness estimation error was around 29 μm.
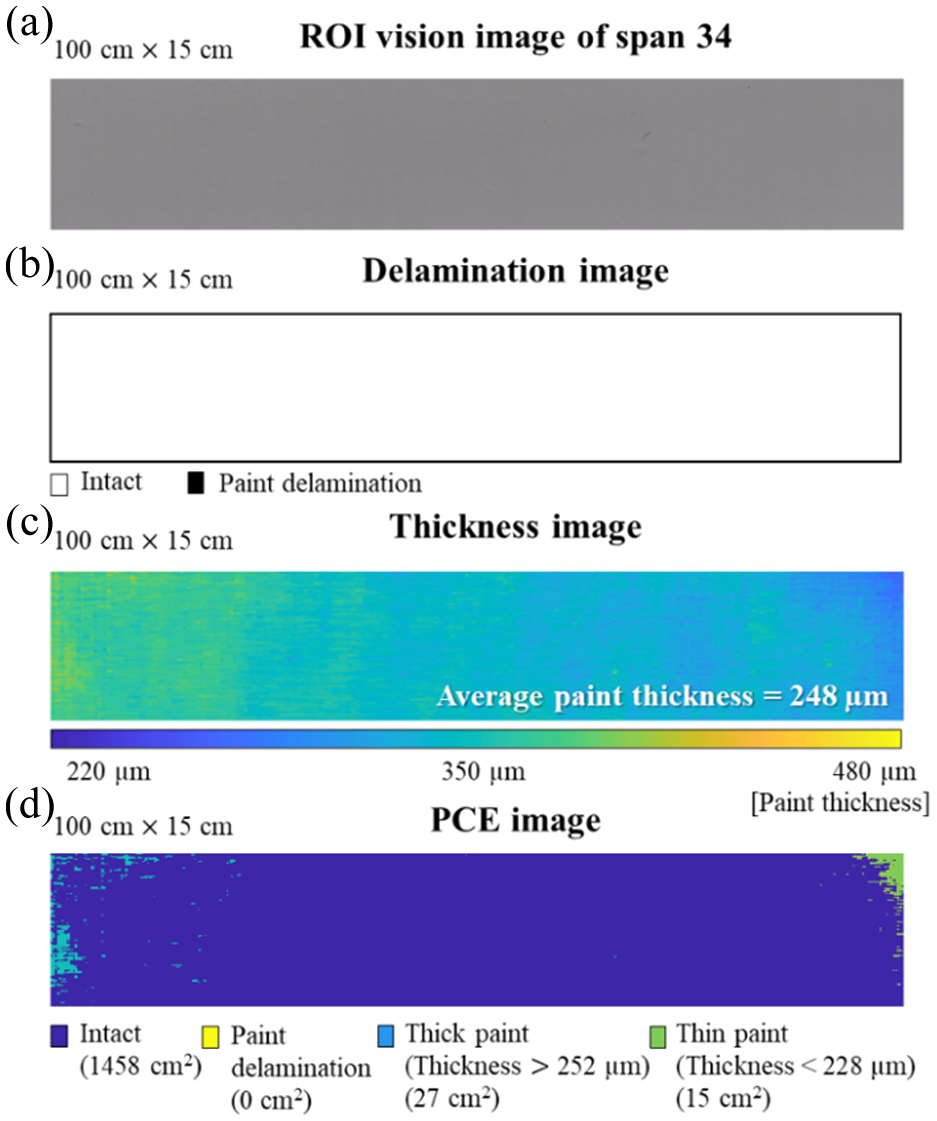
Paint condition evaluation results on intact areas in span 34: (a) ROI vision image of span 34, (b) Delamination image, and (c) Thickness image. (d) PCE image.
Conclusion
This study proposes a new steel bridge PCE system by integrating a wall-crawling drone with a laser thermography module. The proposed PCE system instantaneously and automatically visualizes the invisible paint thickness distribution and hidden paint delamination on steel bridges. The wall-crawling drone was attached to the bottom surface of the bridge deck, and it scanned the target surface. As the drone crawled, the line laser module generated heat energy on the paint surface, and the resulting heat response was measured using an IR camera. Subsequently, the PCE algorithm quantifies and visualizes the paint thickness and hidden delamination over the scanned surface. The main achievements of this study can be summarized as follows: (1) integration of a wall-crawling drone with laser thermography for rapid and remote PCE; (2) development of a motorized wheeled drone to improve paint inspection stability and reliability, even in environments where the laser thermography module is mounted on a drone; and (3) automated and instantaneous quantification and visualization of invisible paint thickness distribution and hidden delamination. The performance of the PCE system was validated through laboratory-scale and field-bridge tests. The test results demonstrate that the PCE system successfully visualized paint thickness and delamination areas, with estimation errors of less than 10 μm for paint thickness and 1 cm2 for delamination area. Note that, while the proposed system demonstrates strong potential for high-precision detection and quantification of coating defects, its current use is best suited for localized-area, detailed inspections due to the narrow FOV and low crawling speed. Future research will focus on improving the system’s scalability for broader infrastructure applications. Future research will focus on increasing the FOV using wide-angle IR cameras and enhancing the drone’s crawling stability and speed, aiming to improve the overall scanning efficiency for field-scale applications. Furthermore, the detection of paint delamination and the estimation of paint thickness rely on statistical computation and curve fitting based on baseline data, which may pose challenges related to overfitting or reduced reliability under varying inspection conditions. As more IR image data becomes available, the method is planned to be improved by incorporating machine learning techniques to enable automatic detection and classification of various types of defects. In addition, in addition to abnormal paint thickness and delamination, checks and chalking should be properly detected and classified. Moreover, because the proposed technology is an inspection based on surface temperature analysis, unexpected false alarms may occur owing to the contamination of the inspection surface. Therefore, the usability is expected to increase if various vision technologies are used together to prevent this problem.
Footnotes
Declaration of conflicting interests
The authors declared no potential conflicts of interest with respect to the research, authorship, and/or publication of this article.
Funding
The authors disclosed receipt of the following financial support for the research, authorship, and/or publication of this article: This work was partly supported by Institute for Information & communications Technology Planning & Evaluation (IITP) grant funded by the Korea government (MSIT) (RS-2019-II190075 and Artificial Intelligence Graduate School Support Program (KAIST) and Korea Ministry of Land, Infrastructure and Transport(MOLIT) as [Innovative Talent Education Program for Smart City].