






Abstract
Track condition significantly influences the fatigue performance of metro bogie frames and constitutes a critical external factor in their structural durability. However, existing approaches to track evaluation rely primarily on track geometry measurements or axle box acceleration data and seldom establish a direct relationship with the fatigue state of the bogie frame. This study proposes a damage-oriented track evaluation framework grounded in bogie frame fatigue safety to address this limitation. Using field test datasets, we identified fatigue-critical locations through detailed structural inspection and statistical analysis of segmental fatigue damage. We then developed a combined fatigue damage index to characterize the overall fatigue response of the bogie frame. Building on this, we introduced a track comprehensive excitation index (TCEI) that integrates equivalent track curvature, track structure index, and mean operating speed. The weighting coefficients of these parameters were determined using a vehicle-track coupled dynamic model. The results demonstrate that the track curvature and structure predominantly govern fatigue excitation, whereas the operating speed exerts a comparatively minor influence. Furthermore, we observed a clear positive monotonic correlation between TCEI and the combined fatigue damage. Based on fatigue damage exceedance probabilities, we established corresponding track evaluation thresholds. Overall, the proposed framework provides a practical and reliable tool for identifying track sections associated with elevated fatigue risk in metro bogie frames.
Keywords
Introduction
Urban rail transit systems underpin public transportation in major cities worldwide and support high-capacity mobility. The bogie frame functions as the principal load-bearing structure within these systems, facilitating load transfer, directional guidance, and supporting key suspended components such as braking and damping systems. To ensure safe operations, the bogie frame must maintain structural integrity under dynamic wheel-rail interactions, which track conditions strongly influence. In practice, metro trains operate across heterogeneous track environments and under demanding operating conditions, accelerating fatigue deterioration. These conditions frequently induce fatigue cracking at weld seams and other stress-concentrated regions, thereby compromising structural reliability and reducing the service life. Overall, these observations demonstrate that line-specific operating conditions play a decisive role in governing bogie frame fatigue damage and long-term performance.
A substantial body of research has investigated the mechanisms governing bogie frame fatigue and identified multiple contributing factors. Wang et al.1–3 developed an instrumented metro bogie frame to capturein-service load spectra and evaluate fatigue damage at critical locations. Subsequent studies have examined the effects of rail corrugation and other track-induced excitations, confirming their significant contribution to fatigue accumulation. 4 Mao et al. 5 demonstrated that motor-current-induced resonance can trigger fatigue failure in high-speed train bogie frames, while Qu et al. 6 showed that periodic stress fluctuations promote crack initiation over time. Additionally, metro-focused studies revealed that uneven axle box acceleration amplitudes and wheel-rail P2 resonance in specific track sections can substantially amplify fatigue damage.7–9 Based on these findings, further research has shown that bogie-mounted components, including brake pipes, 10 cable brackets, 11 antenna beams, 12 lifeguards, 13 and coil springs, 14 are susceptible to excessive dynamic excitation when their natural frequencies coincide with those of the bogie frame under external loading conditions,15,16 ultimately leading to fatigue failure. These studies consistently highlight that externally induced excitations from track conditions play a crucial role in governing the fatigue behavior of vehicle components.
Beyond studies that directly focus on the bogie frame, researchers have increasingly examined wheel-rail vibration mechanisms to better characterize the external excitations transmitted from the track to the vehicle. Xiao et al., 17 Ling et al., 18 and Zhang et al. 19 modeled representative metro track structures and analyzed their characteristic vibration frequencies to capture dominant excitation features. Building on this work, Yuan et al. 20 and Luo et al. 15 investigated the relationship between bogie frame dynamic stresses and operational track conditions, demonstrating that the bogie vibration responses strongly depend on the service environment. Guan et al. 21 and Luo et al. 8 derived the wheel-rail P2 resonance frequencies for typical metro track systems, which may induce simultaneous resonance of both vehicle and track components. Although researchers have not yet fully clarified the causal interactions among P2 resonance, rail corrugation, and wheel out-of-roundness,22–25 they widely recognize these factors as major sources of external excitation that accelerate fatigue degradation in bogie frames. Among the available indicators, axle box acceleration remains the most commonly adopted measure of such excitations. For example, Liu et al. 26 established the transmission relationship between rail corrugation and axle box acceleration and proposed grinding thresholds to control vibration levels and mitigate fatigue accumulation at critical locations. 27 Despite providing valuable quantitative guidance for targeted maintenance, these approaches typically address isolated defects and do not adequately capture the overall condition of the track system.
In track quality assessment, researchers frequently use axle box acceleration to derive composite indicators, such as the rail corrugation index,28,29 to represent the overall track condition. However, because axle box acceleration reflects a system-level response, it functions more effectively as a warning indicator than a physically interpretable descriptor of underlying excitation sources. Geometry-based approaches offer an alternative perspective; for instance, Wang et al. 30 reviewed Track Quality Index (TQI) formulations across multiple countries and highlighted both commonalities and methodological differences. Nevertheless, conventional TQIs exhibit several limitations. Lasisi et al. 31 and Movaghar and Mohammadzadeh 32 identified substantial subjectivity in parameter selection and weight assignment, whereas Ma 33 demonstrated that traditional TQIs primarily describe track smoothness and weakly correlate with vehicle dynamic responses, such as wheel-rail forces and vehicle accelerations. To address these issues, Offenbacher et al. 34 proposed a normalized TQI formulation that improves general applicability. Despite these advancements, most existing indices remain focused on track irregularities and fail to account for the coupled vehicle-track dynamics. Consequently, they often neglect vehicle characteristics and operational conditions that are critical to running safety, 35 particularly the interaction between track condition and abnormal dynamic responses in key vehicle components.
Although researchers have extensively investigated the fatigue failure mechanisms of bogie frames and their interactions with external service environments, they have not yet fully translated these findings into practical engineering applications. Existing studies rarely establish a service environment evaluation method that directly reflects bogie frame damage. To address this gap, developing such an evaluation method would enable practitioners to quantify the severity of track-induced excitations during routine metro operation and maintenance. From the perspective of fatigue reliability, this approach can also support targeted recommendations for improving track conditions that contribute to structural degradation. Moreover, from an engineering standpoint, a damage-linked evaluation framework can guide the targeted inspection of fatigue-prone regions and facilitate condition-based maintenance planning, thereby enhancing the overall reliability and service life of metro bogie systems, without relying on dedicated track geometry measurements or axle-box acceleration data.
Figure 1 illustrates the overall research framework as a flowchart summarizing the methodology adopted in this study. The remainder of this paper is organized as follows. The second section describes the field test configuration, data processing procedure, and the rigid-flexible coupled vehicle-track dynamic model. The third section presents the methodology and results for fatigue control location (FCL) selection, combined fatigue damage index construction, and track comprehensive excitation index (TCEI) formulation. The fourth section develops the TCEI-based track evaluation criteria and presents the case study. The fifth section summarizes the main conclusions.
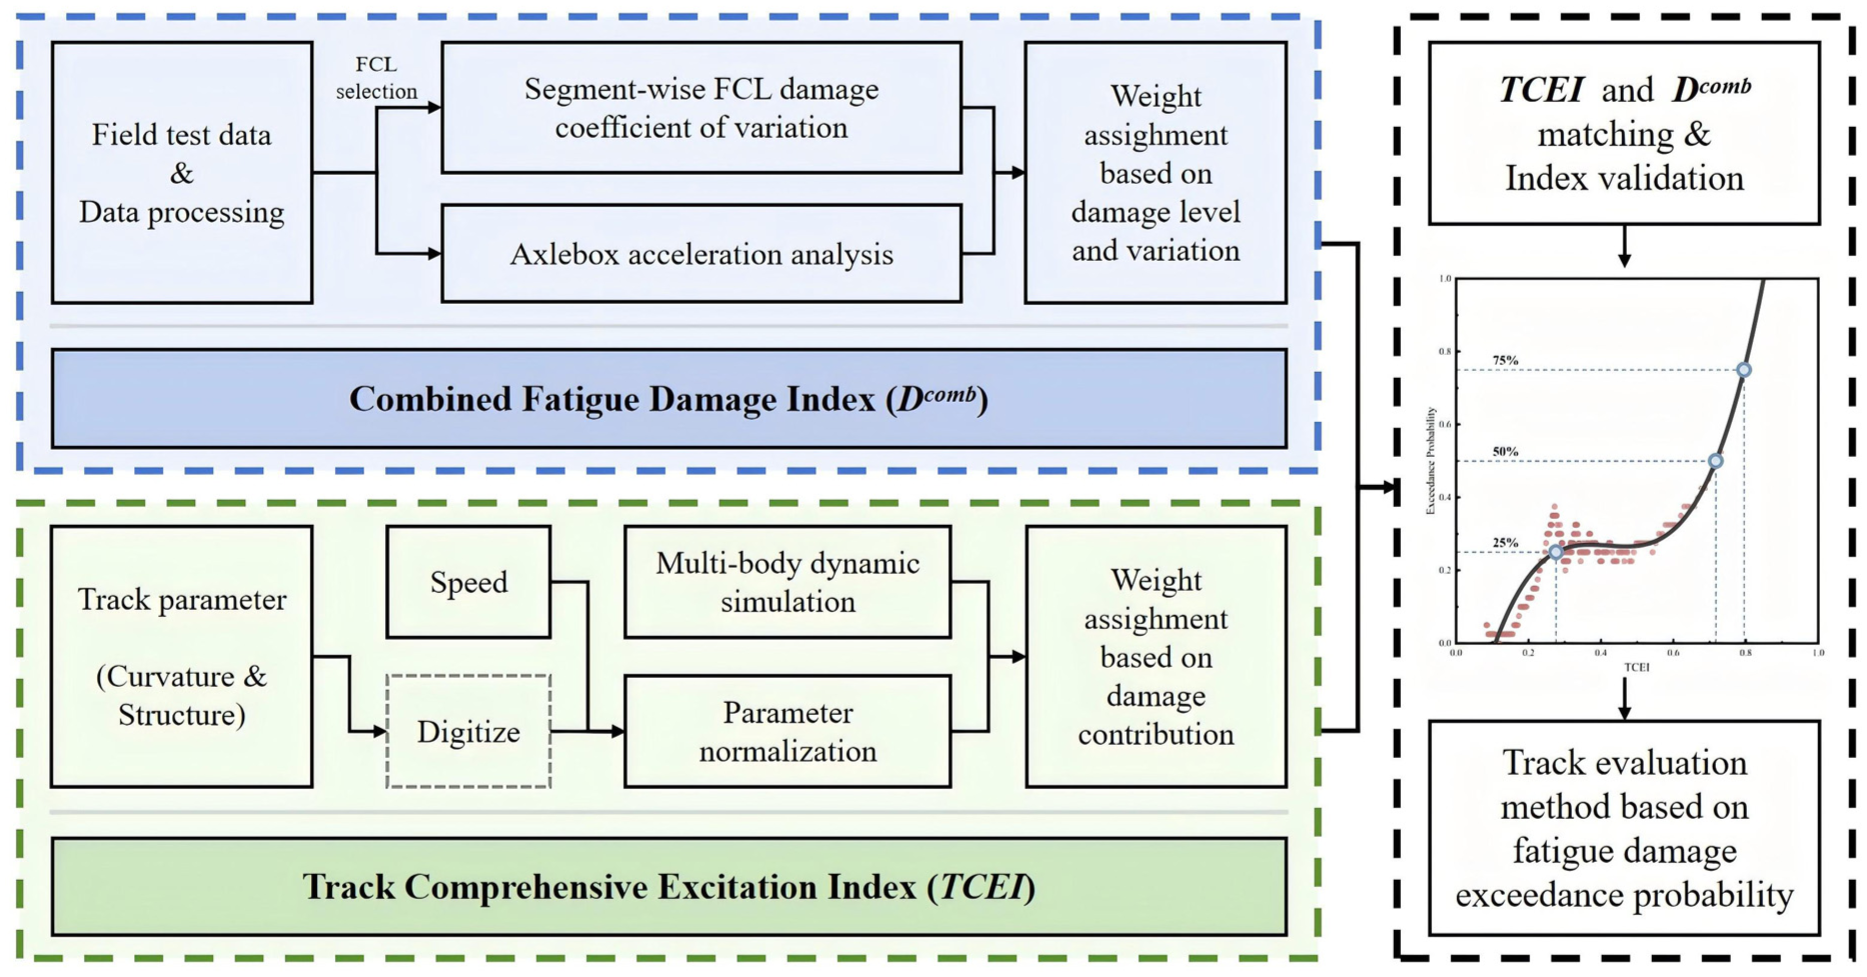
Flowchart of the proposed research methodology.
Data foundation establishment
Before conducting the field tests, we installed strain gauges and complementary sensors on a metro bogie frame to capture its structural response under operational conditions. We first calibrated the instrumented frame through laboratory bench tests to ensure measurement accuracy and reliability,8,15 and then mounted it on an operational metro train. During field operation, the system continuously recorded real-time data and dynamic stress responses at predefined critical locations on the bogie frame.
Field test data collection and processing
We conducted a field test on a high-capacity metro line in a major city in mainland China. The line extends over 57.7 km and operates under diverse conditions, with curve radii ranging from 300 to 2000 m and a maximum service speed of 80 km/h. Due to the constraints of the urban environment, the track system incorporates multiple structural forms, including standard monolithic track (SMT) and vibration-mitigation designs such as floating slab track (FST) and ladder-type sleeper track (LST). Figure 2(a) illustrates the structural configurations of these track types, while Figure 2(b) presents the layout of the instrumented bogie.
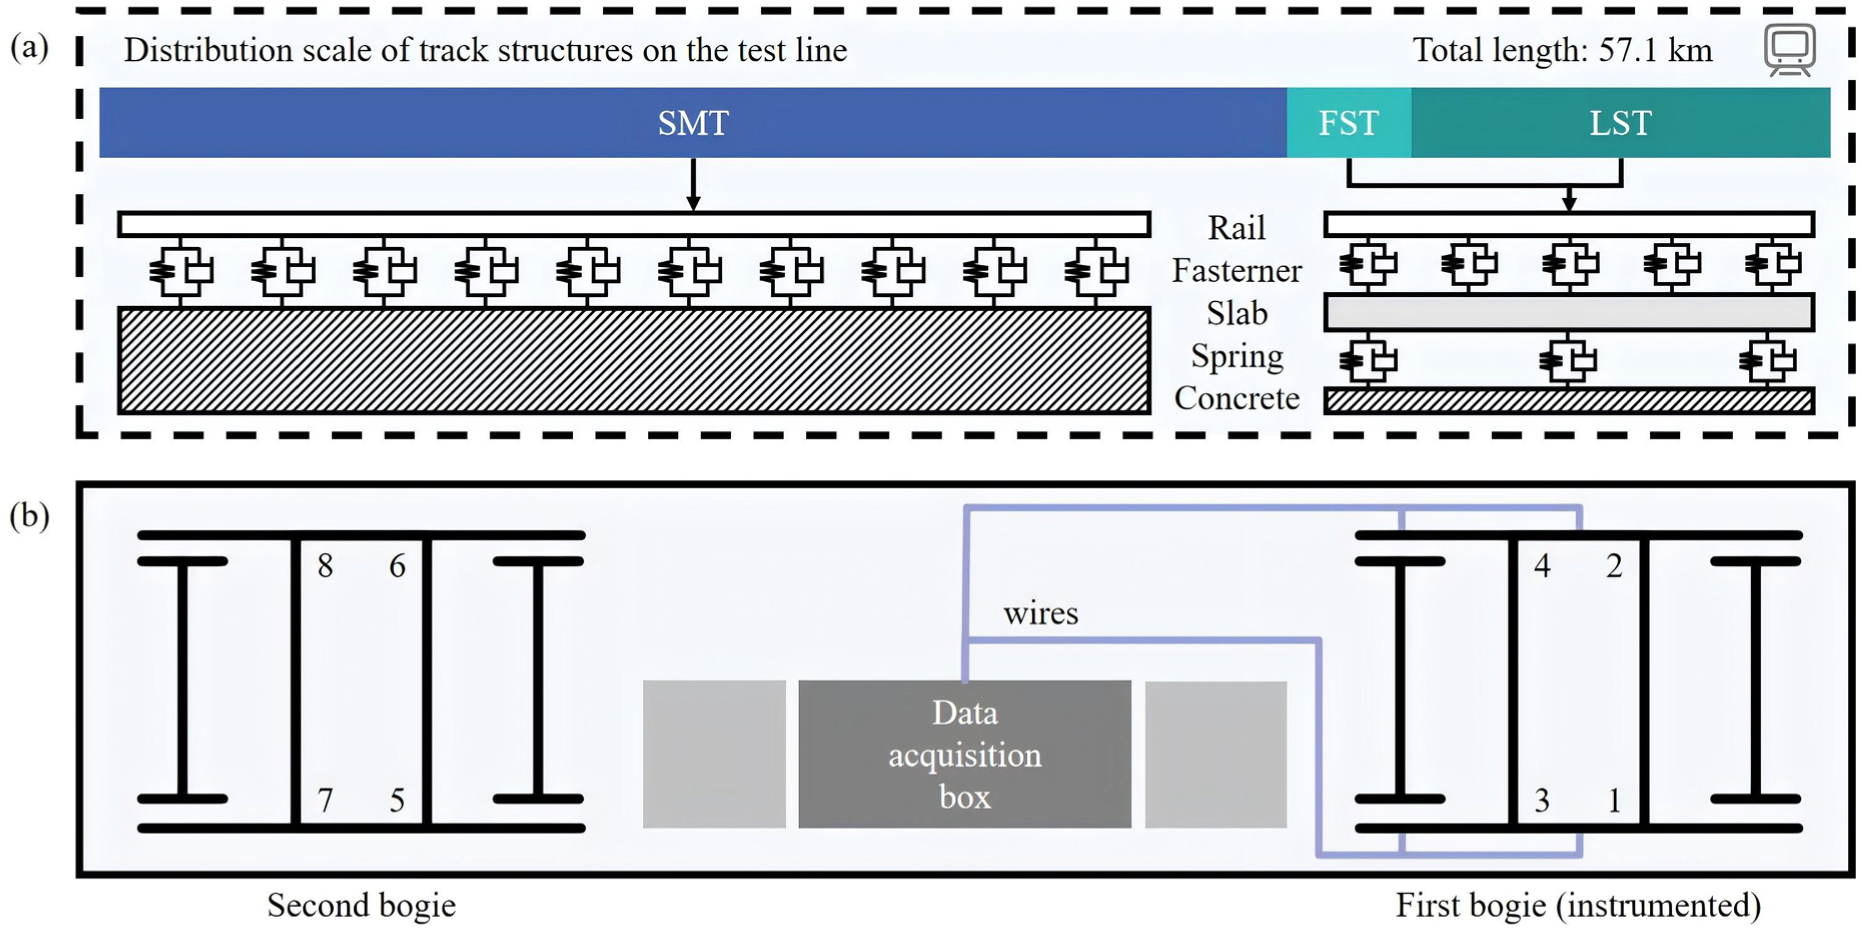
Schematic of the field test setup: (a) track structures on the test line and (b) instrumented bogie layout.
Strain gauges were installed at selected FCLs to measure the dynamic stress response of the bogie frame under real service conditions. Accelerometers were mounted on the top surfaces of all four axle boxes to capture wheel-rail vibration responses across varying operating conditions and track environments. These axle box acceleration signals directly quantify the excitation transmitted from the track to the bogie and therefore serve as a primary basis for constructing vibration-related indices in this study. To further characterize vehicle steering behavior during metro operation, we installed a gyroscope beneath the car body to continuously record real-time yaw rate data.
To ensure sufficient data coverage and statistical reliability, the field test was conducted continuously for 3 months under randomly assigned service schedules. All measurement signals were acquired using an HBM eDAQ data acquisition system housed in an integrated equipment box beneath the train floor. During operation, both strain and acceleration signals were sampled at 1000 Hz to capture high-frequency dynamic responses. The system temporarily stored the recorded data on board, and the test team retrieved and downloaded it daily for subsequent processing and analysis.
We applied a comprehensive preprocessing procedure to the raw dynamic stress data to ensure robust data quality and analytical reliability. This procedure included noise filtering, removal of abnormal signal spikes, and zero-drift correction to eliminate distortions introduced by the data acquisition system. These steps improved both the accuracy and stability of the measured signals. In addition, we applied a 5–100 Hz band-pass filter to the dynamic stress signals at all FCLs as well as to the axle box acceleration channels. This frequency band corresponds to the dominant modal frequency range of the bogie frame and contains the primary dynamic components contributing to fatigue damage.
To ensure spatial consistency in the analysis, we discretized the entire test line into consecutive 200 m segments, which served as the fundamental units for data processing and index evaluation. This segment length is also consistent with that commonly adopted in conventional TQI studies, thereby aligning with established track assessment practices. We first calculated fatigue damage indicators and excitation-related parameters for each segment. For station-interval-level analysis, we then averaged the segment-wise results within each corresponding interval to obtain representative values. This approach enables consistent comparison across different sections of the line while preserving local variability in track-induced responses.
Rigid-flexible coupled dynamic model
To construct a comprehensive index that integrates track- and operation-related factors, we must quantify their relative contributions in a consistent and physically meaningful manner. However, field test data inherently suffer from incomplete coverage of operational factor combinations. Although the tested metro line captures certain combinations of speed, track structure, and excitation severity, practical constraints and operational regulations prevent the realization of all possible scenarios. As a result, the dataset does not fully support the identification of main and interaction effects, which limits the robustness of weight determination in the index formulation. Furthermore, evaluating track grading thresholds against bogie frame fatigue response requires a controlled environment in which operating conditions can be systematically varied—an objective that field data alone cannot achieve.
To address these limitations, we employed a rigid-flexible coupled dynamic model of the metro vehicle-track system to supplement missing operational conditions and corresponding response data at the selected FCLs, as illustrated in Figure 3. The model incorporates a flexible representation of the bogie frame along with detailed track components, enabling accurate simulation of structural responses under varying excitation conditions. Developed, calibrated, and validated in a previous study, 15 this model is adopted here without modification to maintain methodological consistency.
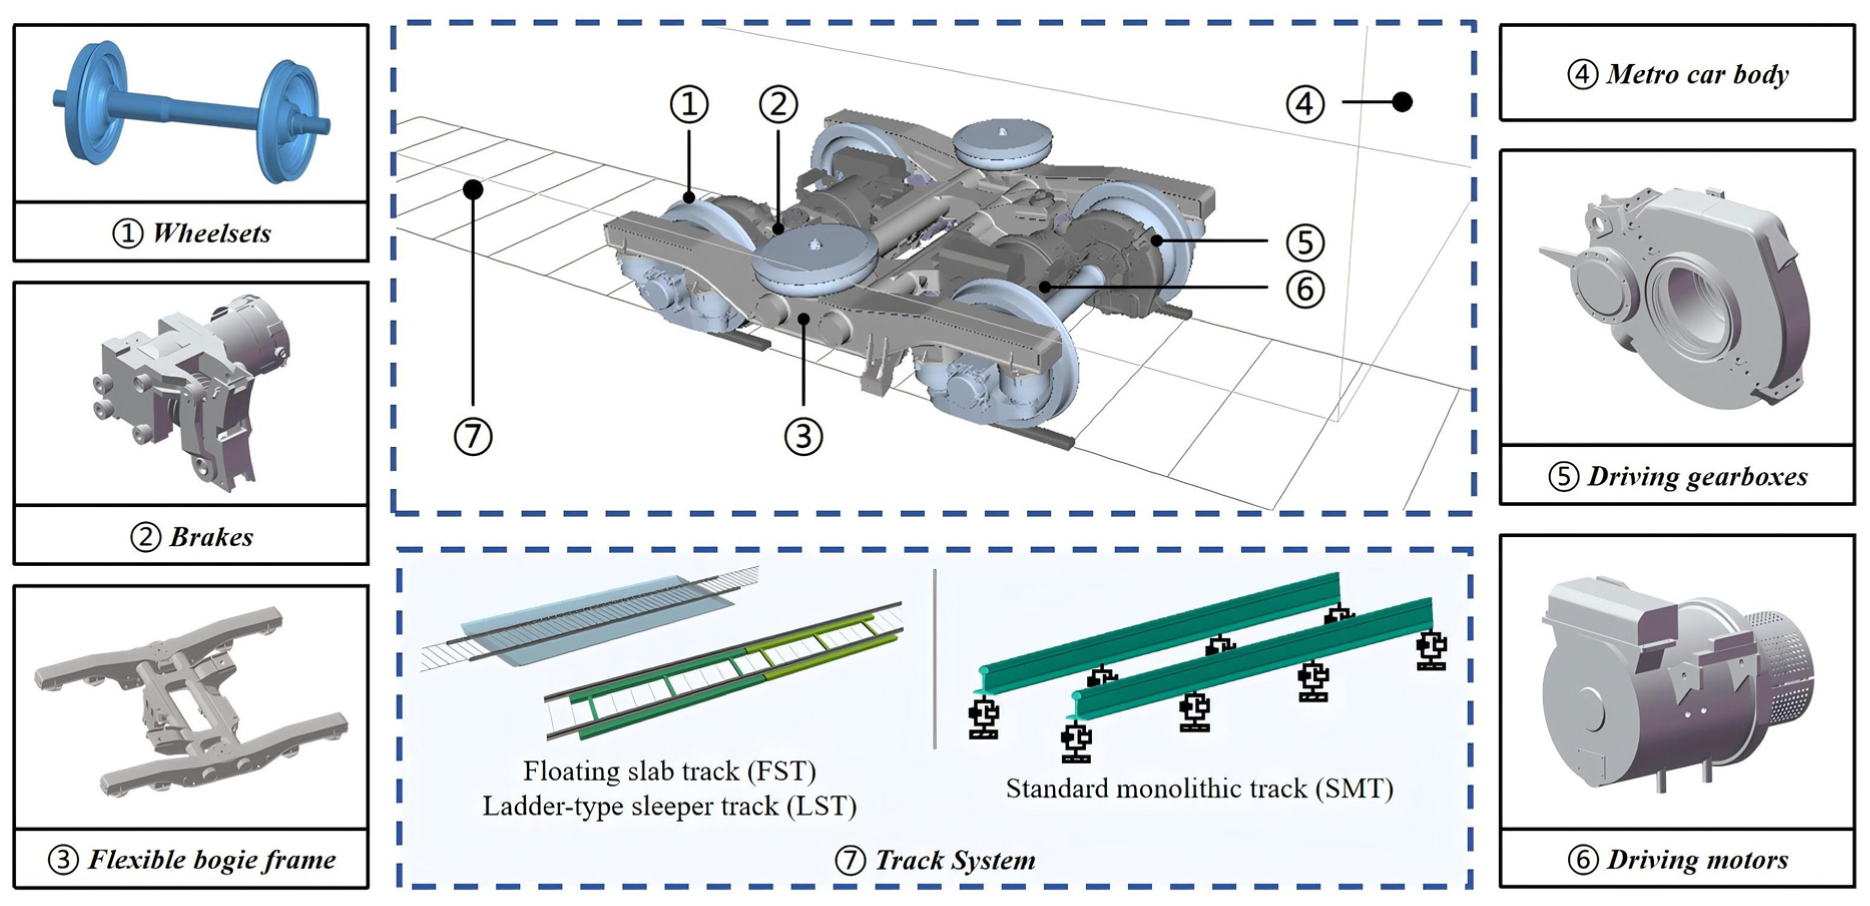
Schematic of the rigid-flexible coupled vehicle-track dynamic model.
In this model, the vehicle-track coupled system was established in SIMPACK software, with the main vehicle components modeled as rigid bodies and the tested bogie frame introduced as a flexible body. The flexible bogie frame was first analyzed in ABAQUS and then imported into SIMPACK through the flexible body interface, allowing its elastic deformation and modal stress response to be coupled with the multibody vehicle dynamics. The track subsystem was modeled using the SIMPACK Nonlinear Flextrack module, and the normal wheel-rail contact force was calculated based on Hertzian contact theory. Model validation was performed by comparing simulated and measured bogie-frame dynamic stresses in both time and frequency domains, showing that the model could reproduce the main amplitude and dominant frequency characteristics. The numerical model complements the field measurements by providing additional response data and enabling systematic exploration of operating conditions. It was therefore used for single-factor perturbation simulations and TCEI weight determination.
Construction of damage-oriented indices for track evaluation
This section presents the core methodology of the proposed damage-oriented track evaluation framework. It covers the key assumptions underlying the analysis, the selection of critical FCLs, the construction of the combined fatigue damage index to represent the overall bogie frame fatigue demand, and the development of the TCEI as a simplified and physically interpretable measure of track-induced excitation. The methodological framework integrates measured data and model-based insights to establish a direct link between track conditions and structural fatigue performance.
Methodology
Key assumptions
Based on measured dynamic stress responses of the bogie frame, we aim to construct a combined fatigue damage index representing overall frame fatigue and a TCEI characterizing track conditions, which are then linked to assess the relationship between track excitation and structural fatigue. During this process, certain simplifications are applied, and the following assumptions are made: (1) To evaluate the relative influence of operating speed, curve radius, and track structure on bogie-frame fatigue, single-factor perturbation simulations are performed using the rigid-flexible coupled dynamic model at a representative baseline operating condition. It is assumed that the influence of each parameter varies approximately linearly around this reference. (2) The contributions of the TCEI parameters to fatigue are assumed to be independent and additive, while potential nonlinear interactions among the parameters are neglected.
Critical track-sensitive FCL selection
To identify FCLs that are both structurally critical and sensitive to track-induced excitation, a two-step selection procedure was adopted. First, candidate FCLs were determined based on field crack inspection and prior stress analyses. During the field tests, 156 motor bogies of the same type, with approximately 1.5 million km of service mileage and standardized factory maintenance records, were inspected. Fatigue cracks were mainly observed at the weld seams connecting the crossbeams to the motor hanger cover plates and web plates, while fewer cracks were found at the weld seams between the gearbox hanger vertical plates and the crossbeams. These crack-prone regions are consistent with previous studies,4,8,15 which reported relatively high equivalent stress levels at crossbeam-related weld seams. Therefore, the weld seams associated with the crossbeams were selected as candidate FCLs for subsequent fatigue damage analysis.
The fatigue damage at the selected FCLs was evaluated using Miner’s linear cumulative damage rule. The accumulated damage

where
However, the non-uniform distribution of track structures along the metro line and the varying lengths of individual track sections complicate direct comparisons of total accumulated fatigue damage across different FCLs or track types. To enable comparison among different FCLs and track sections with unequal lengths, the damage per kilometer (DPK) 8 was introduced as a normalized damage indicator:

where
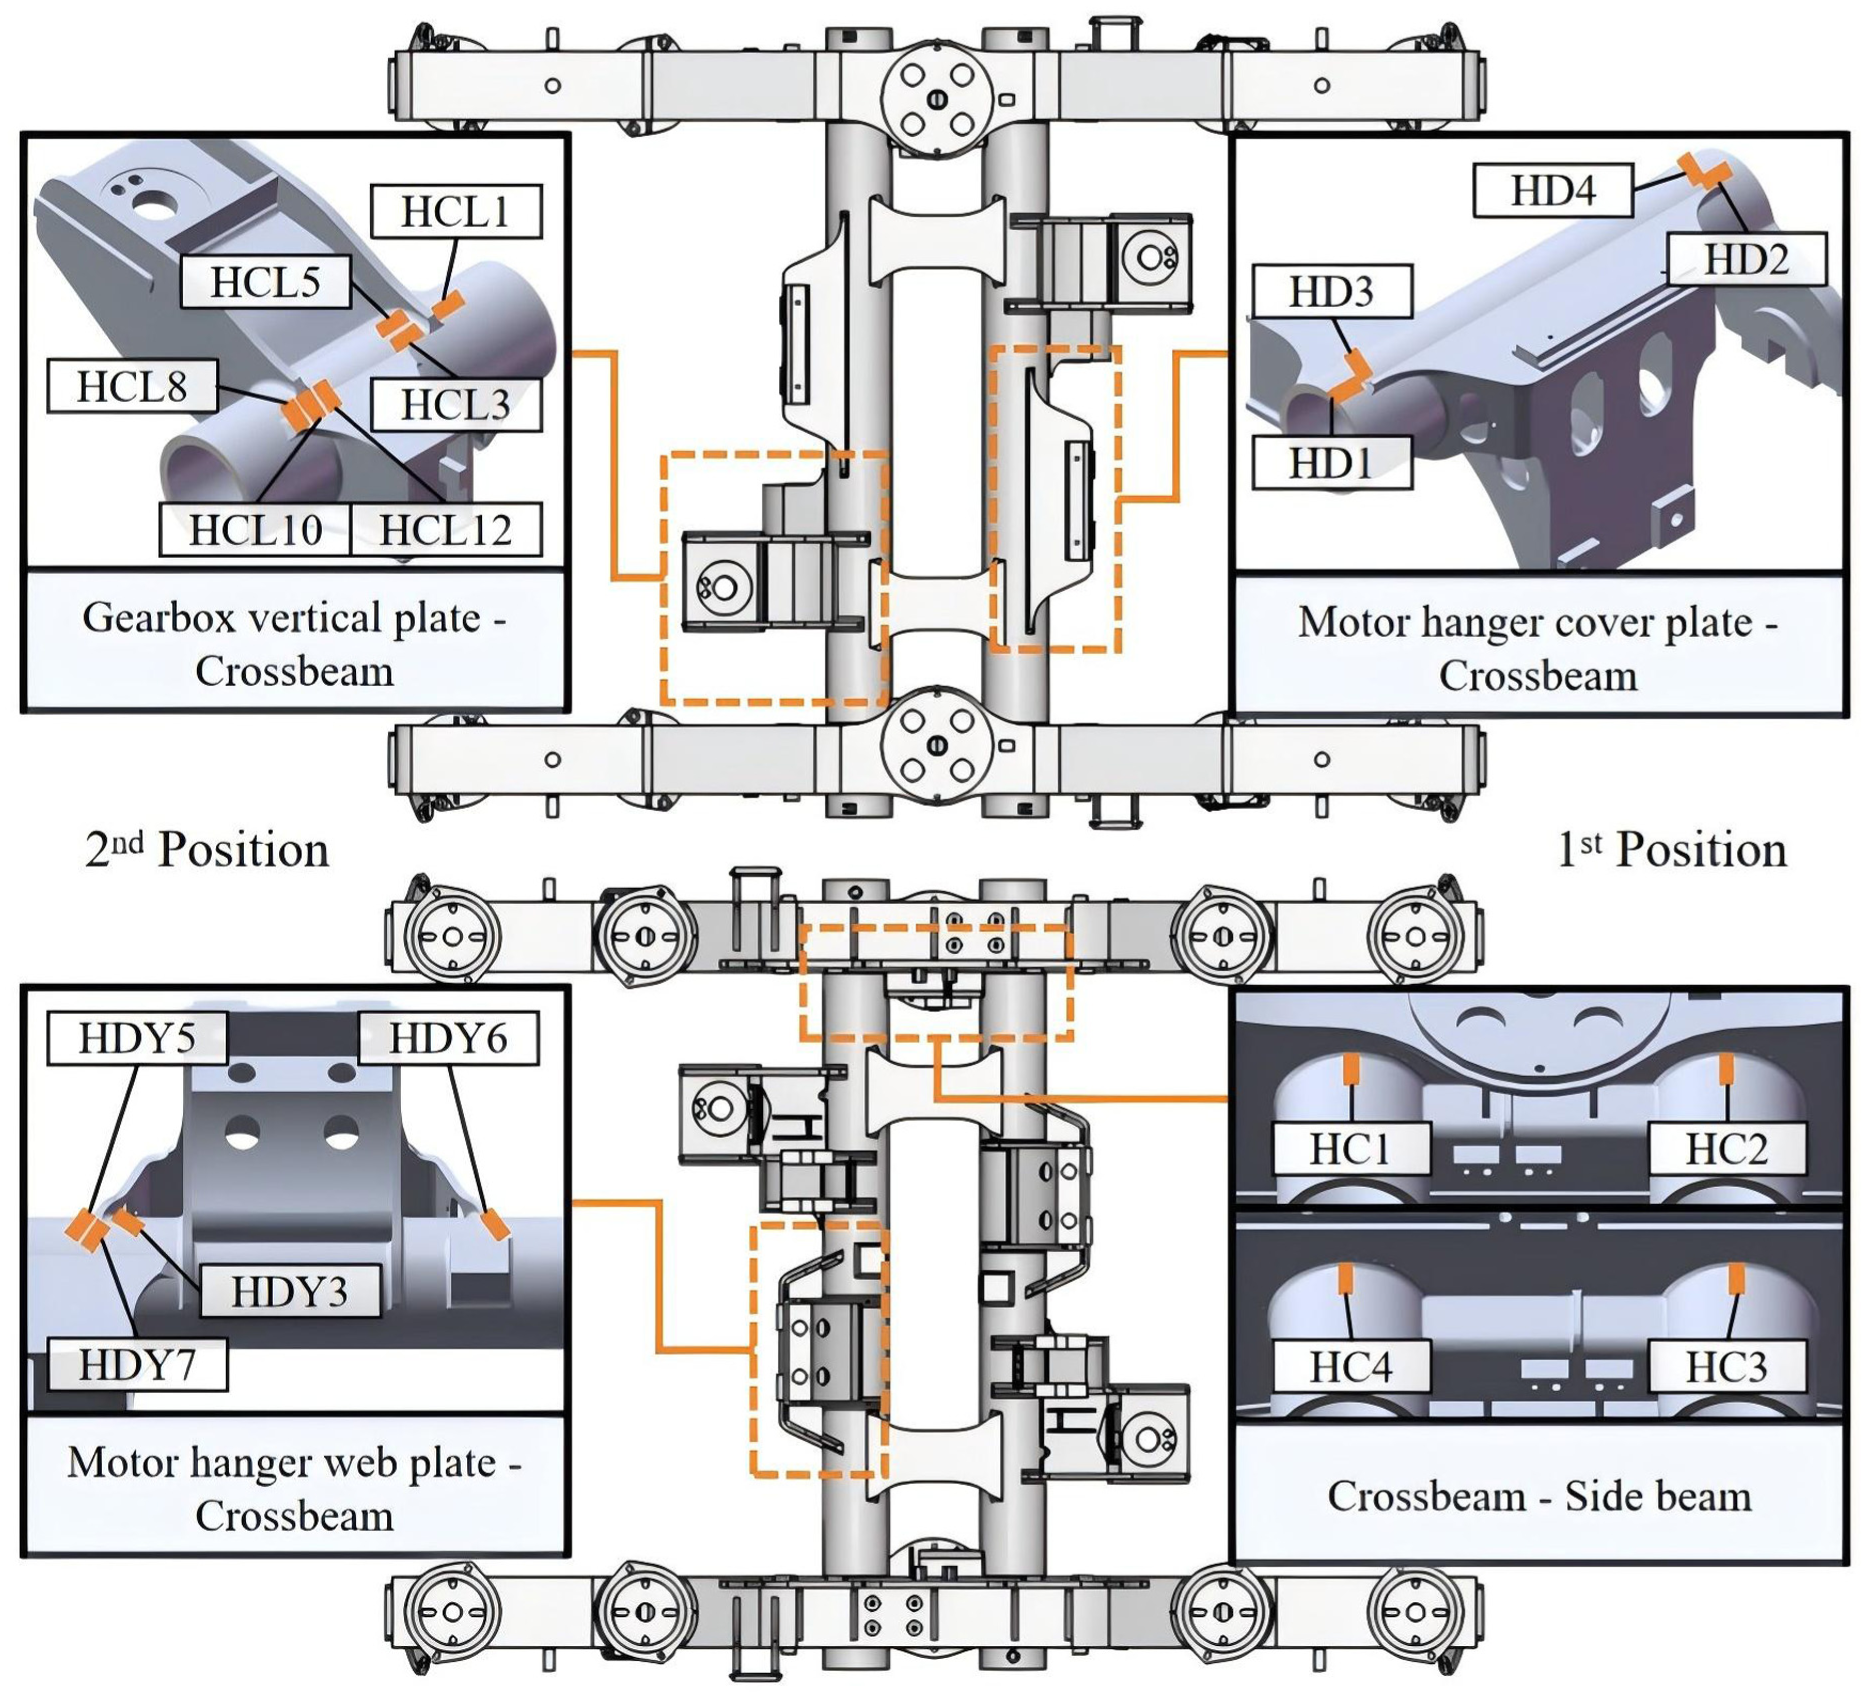
FCLs on the bogie frame. FCL: fatigue control location.
In the first screening step, segment-wise fatigue damage was used to evaluate both fatigue severity and spatial sensitivity of each FCL. The stress histories at each candidate FCL were divided into 200 m segments, 30 and the corresponding DPK was calculated for each segment. Each FCL was then characterized using three statistical metrics: the mean DPK, representing its overall fatigue demand; the coefficient of variation (CV), capturing the variability of damage along the line and thus the sensitivity to track condition variations; and median normalization of the mean DPK, which ensures robustness against outliers. The normalized mean DPK was multiplied by the CV to form a dimensionless screening indicator that integrates both the overall damage level and the spatial sensitivity, effectively identifying the FCLs most responsive to track-induced variations.
In the second screening step, the sensitivity of each FCL to track-induced excitation was further examined using partial correlation analysis. The root m?ean square (RMS) value 36 of the vertical acceleration at the front-right axle box was selected as the representative excitation indicator, because previous analysis 8 showed that this channel exhibits the highest vibration energy and plays a dominant role in exciting bogie-frame diagonal modes.For each 200 m segment, the axle box acceleration signal was filtered within 40–80 Hz, and the RMS value was calculated to quantify the excitation intensity. Since fatigue damage is affected by both track excitation and operating speed, the mean speed of each segment was used as a control variable. Passenger load was not included as an additional control variable because previous field-test results 4 showed that its influence on bogie-frame fatigue damage is relatively small compared with track-induced dynamic excitation. Partial Pearson and partial Spearman correlation coefficients were then calculated between segment-wise DPK and axle box acceleration RMS. The partial Pearson coefficient was used to evaluate linear association, whereas the partial Spearman coefficient was emphasized to characterize monotonic relationships and improve robustness against the strong nonlinearity of DPK.
The Spearman correlation coefficient is defined as the Pearson correlation coefficient computed on the ranked variables. For a dataset comprising

where

where
Construction of the combined fatigue damage index
After the track-sensitive FCLs were identified, their fatigue responses were further integrated to obtain a single indicator representing the overall fatigue demand of the bogie frame. Since different FCLs exhibit different levels of fatigue severity, spatial variability, and sensitivity to track-induced excitation, a weighted aggregation scheme was adopted to construct the combined fatigue damage index.
For the

The normalized weighting factor was then obtained as:

where
Based on the normalized weighting factors, the combined fatigue damage index of the

By integrating the fatigue responses of multiple selected FCLs,
Construction of TCEI
While
Because the selected excitation-related factors differ in their physical units and representations, they were reformulated into consistent numerical forms to enable unified calculation and index formulation. The equivalent curvature was introduced to represent the geometric effect of curved tracks within each 200 m segment. For a segment containing several curve elements, the equivalent curvature can be expressed as:

where

where
Segments with larger equivalent curvature (which means smaller curve radius) tend to generate stronger wheel-rail interaction forces and, subsequently, impose greater fatigue demand on the bogie frame. In contrast, segments with lower equivalent curvature typically consist of tangent tracks or large-radius curves, where geometric effects contribute less significantly to the overall excitation level.
The track structure effect was represented by a track structure index. Considering the dynamic similarity between SMT and FST in the fatigue-sensitive frequency range,
8
these two track forms were grouped into one category, while LST was treated as a separate category. The structure index of the

where
Mean operating speed
Since these factors have different physical meanings and units, min-max normalization was applied before aggregation:

where
In existing studies on track condition indices, researchers typically determine the weights of influencing factors using either data-driven approaches, such as the entropy weight method, 37 or simplified equal-weight assumptions, as commonly adopted in conventional TQIs. Entropy-based methods assign weights based on the statistical dispersion of each indicator within a dataset, whereas equal weighting assumes that all factors contribute identically. Although these approaches are straightforward to implement, they do not adequately suit the objectives of this study. Data-driven schemes rely heavily on dataset-specific statistical characteristics and therefore lack physical interpretability, while equal-weight approaches neglect the distinct mechanical roles that different factors play in governing vehicle-track interaction and fatigue behavior.
In contrast, we design the TCEI to reflect the physical contribution of key track and operational parameters to bogie frame fatigue damage, rather than merely ranking segments based on statistical variability. Accordingly, to determine the weighting factors of the TCEI, a mechanism-oriented weighting strategy was adopted rather than an entropy-based or equal-weight approach. Specifically, the validated rigid-flexible coupled vehicle-track dynamic model described in ‘Rigid-flexible coupled dynamic model’ section was used to perform single-factor perturbation simulations. A representative baseline operating condition was first defined, and one factor was varied at a time while the others were kept constant. The variation range of
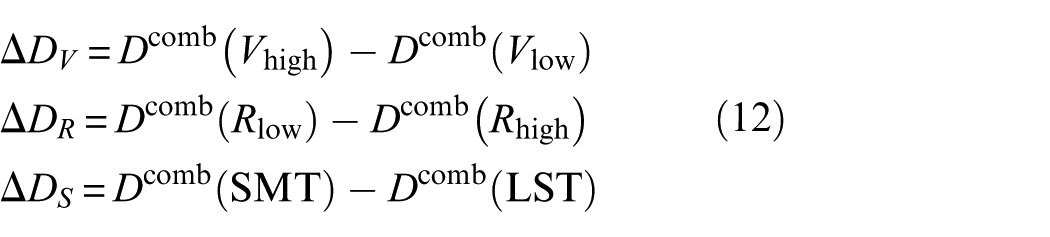
where
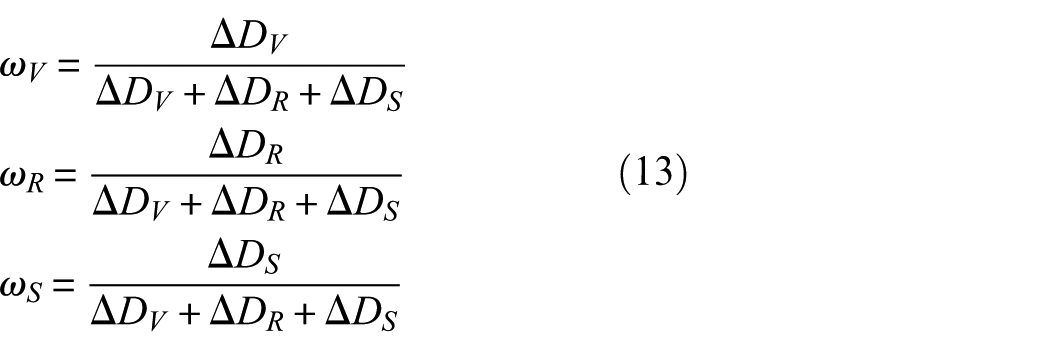
Here,
Following the additive structure commonly used in related evaluation indices,31,33,36 the TCEI is constructed by integrating the weighted contributions of the selected excitation-related factors. For the

where
Index construction results
Based on the methodology described in the previous section, this section presents the index construction results obtained from the measured field data and model-based simulations. Specifically, the track-sensitive FCLs are first identified using the screening and correlation procedures, after which the weighting results for combined fatigue damage index and the TCEI are presented. These results provide the basis for the subsequent track evaluation and case study in the fourth section.
Results of FCL selection
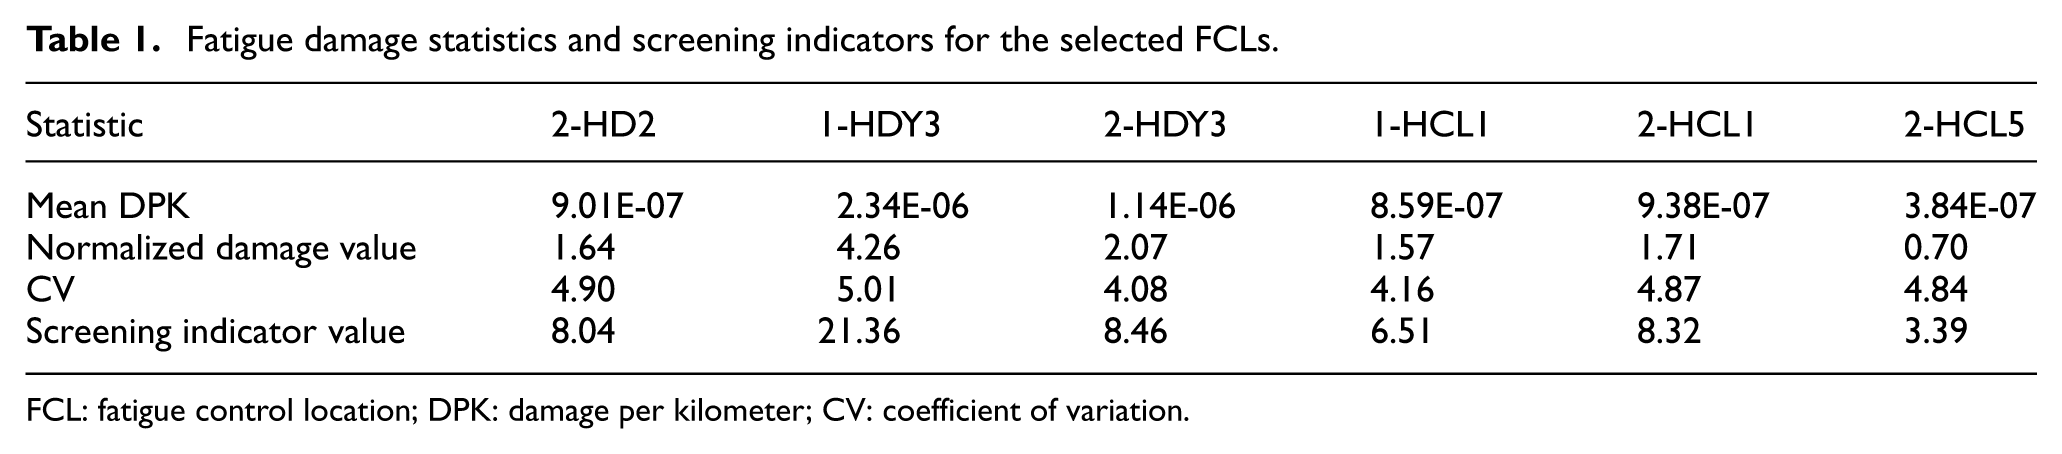
Figure 5 presents the screening indicators calculated from the normalized mean DPK and CV values for the candidate FCLs, and Table 1 summarizes the detailed fatigue damage statistics of the finally selected locations.
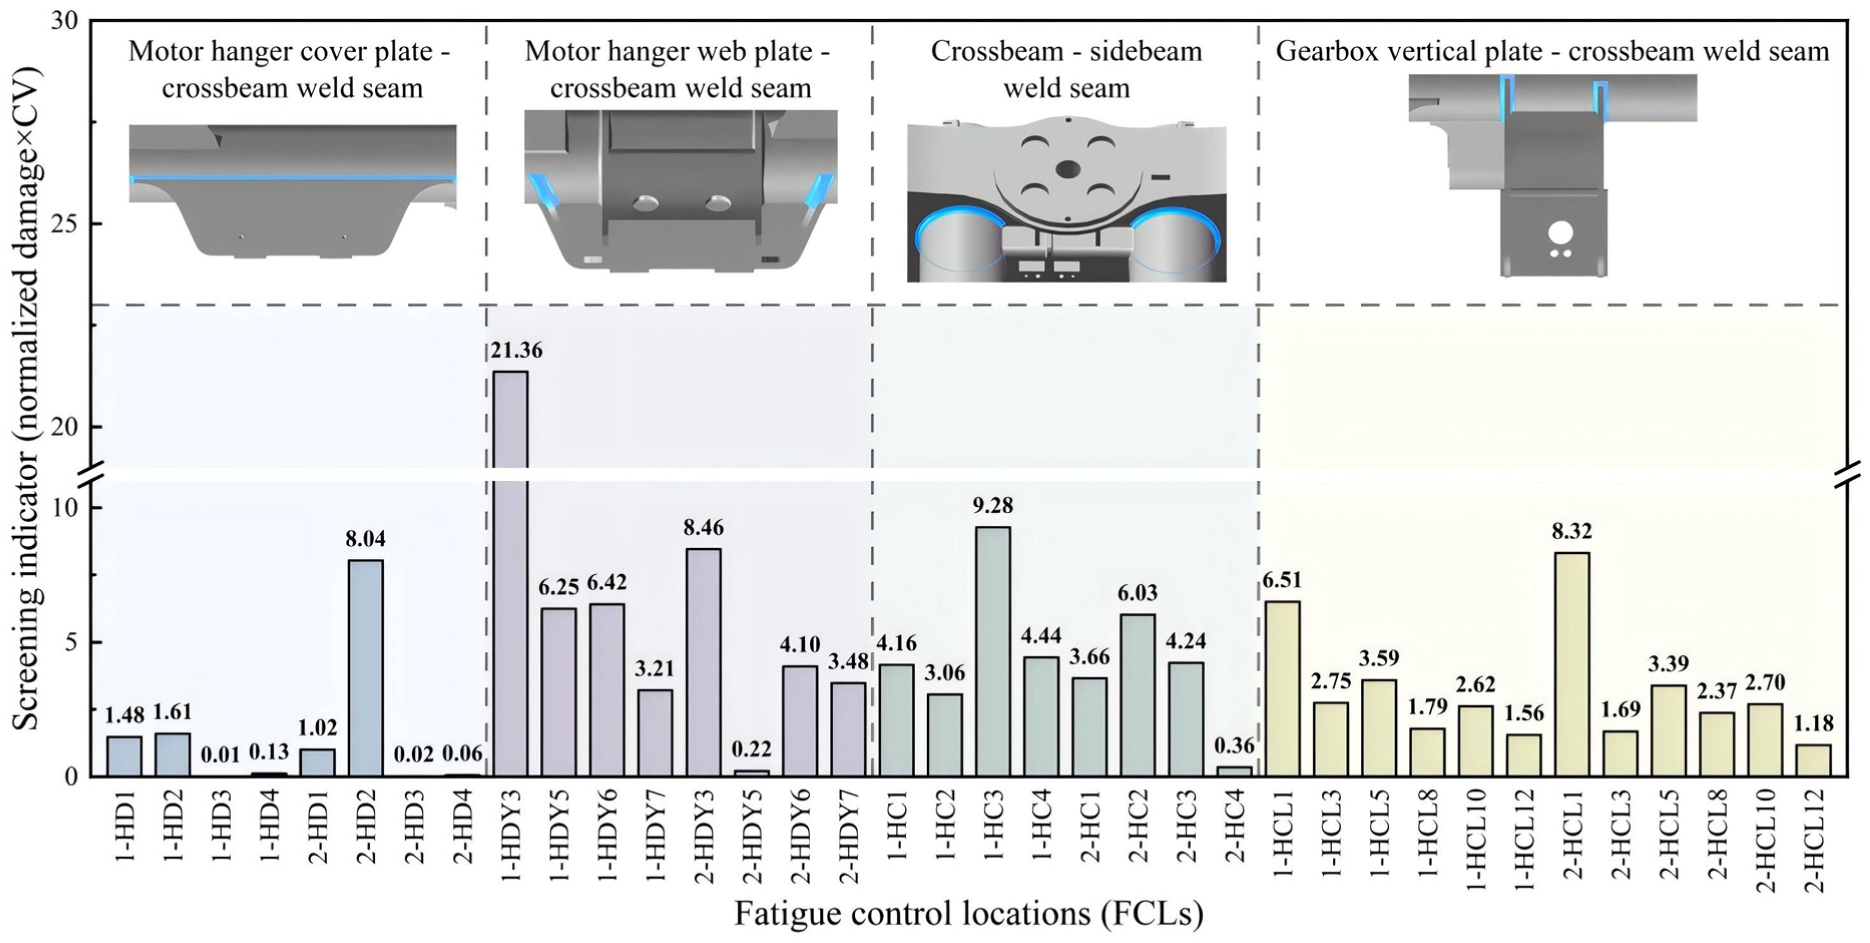
Screening indicator based on normalized fatigue damage and CV for different FCL. CV: coefficient of variation; FCL: fatigue control location.
Fatigue damage statistics and screening indicators for the selected FCLs.
FCL: fatigue control location; DPK: damage per kilometer; CV: coefficient of variation.
As shown in Figure 5, the screening indicator varies markedly across different welded regions of the bogie frame. Locations associated with the motor hanger and gearbox hanger exhibit relatively high values, indicating both elevated fatigue demand and strong spatial variability. In contrast, although some HC locations at the crossbeam-side beam weld seam show noticeable fatigue responses, their screening indicators remain comparatively low, and field inspections report limited crack occurrence in these regions. We therefore excluded these HC locations from further analysis. Notably, field observations indicate a potential cracking risk at 2-HCL5; we retained this location despite its moderate screening indicator. By integrating relative fatigue demand, spatial variability, field crack evidence, and prior stress-based findings, we ultimately selected 2-HD2, 1-HDY3, 2-HDY3, 1-HCL1, 2-HCL1, and 2-HCL5 as representative FCLs for subsequent correlation analysis and the development of the track evaluation method.
To further verify whether these selected FCLs are sensitive to track-induced excitation, partial correlation analysis was performed while controlling for mean operating speed. The results are summarized in Table 2. The partial Pearson correlation coefficients range from approximately 0.45 to 0.53, indicating a moderate linear relationship between axle box vibration and fatigue damage. In comparison, the partial Spearman correlation coefficients consistently exceed 0.7 for all six selected FCLs, and all correlations are statistically significant at the 0.05 level. This result indicates a strong and stable monotonic relationship between track-induced excitation and fatigue damage, while also suggesting that the excitation-damage relationship is nonlinear and is more appropriately characterized by rank-based Spearman correlation measures.
Partial Pearson and Spearman correlation coefficients controlling for mean speed.

Overall, the selected six FCLs exhibit high fatigue relevance, evident spatial variability, field-supported cracking risk, and clear sensitivity to track-induced excitation. Therefore, they were retained as the representative fatigue-sensitive locations for the construction of combined fatigue damage index and the subsequent track evaluation.
Weighting results of combined fatigue damage index
Based on the selected FCLs identified in ‘Results of FCL selection’ section and the weighting method described in ‘Construction of the combined fatigue damage index’ section, the preliminary and normalized weighting coefficients for the combined fatigue damage index were calculated, as summarized in Table 3. These weights quantify the relative contribution of each selected FCL to the overall fatigue-response representation of the bogie frame.
Weighting coefficients for the combined fatigue damage index.

As shown in Table 3, 1-HDY3 has the largest normalized weight, accounting for approximately 39.5% of the total contribution. This result is consistent with its high mean DPK, large spatial variability, and strong correlation with track-induced excitation, indicating that this location plays a dominant role in characterizing the fatigue response of the bogie frame under the investigated service conditions. The remaining FCLs show moderate contributions, with normalized weights ranging from 0.059 to 0.151. Their inclusion ensures that the combined fatigue damage index reflects fatigue responses from multiple critical welded regions rather than relying on a single measurement location.
Therefore, the constructed combined fatigue damage index provides an integrated representation of bogie-frame fatigue demand and is used as the target fatigue-response variable in the subsequent evaluation of the relationship between track excitation and structural damage.
TCEI weighting and construction results
Based on the TCEI formulation described in ‘Construction of track comprehensive excitation index’ section, the structural impact coefficients and weighting factors were first determined before calculating the segment-wise TCEI values. For the track structure index, SMT and FST were treated as one equivalent category because of their similar vibration and fatigue-related response characteristics in the fatigue-sensitive frequency range. 8
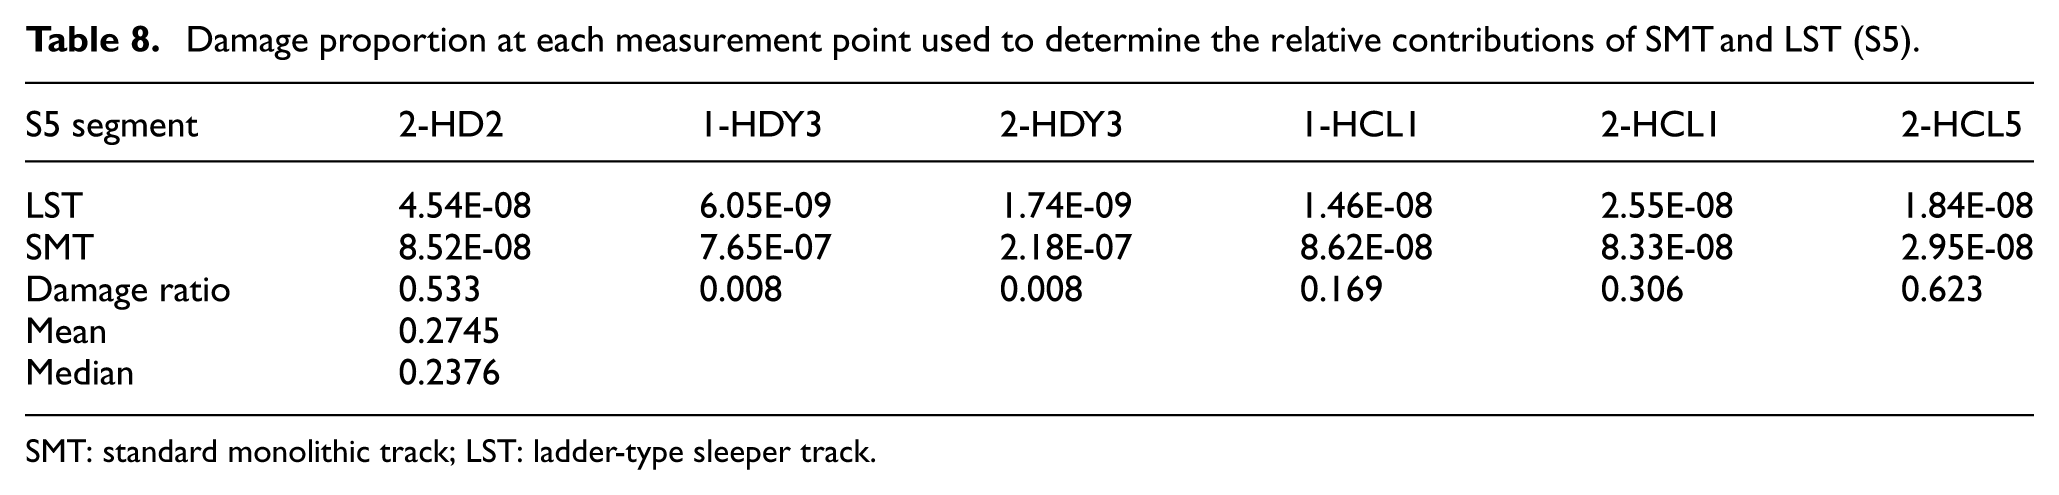
The relative coefficient of LST was calibrated using quasi-controlled comparisons between SMT and LST sections under comparable operating and geometric conditions. The S6 interval was selected as the primary comparison because SMT and LST alternately appear within the same R = 450 m curve, where the operating speed and curve radius remain nearly unchanged. An additional R = 600 m curve section in S5 was also examined as a supplementary comparison, and the LST/SMT damage ratios were found to have mean and median values of approximately 0.275 and 0.238, respectively, as shown in Appendix 1. Based on these results, the coefficient of SMT/FST was normalized to 1, while the coefficient of LST was assigned as 0.25. This coefficient should be regarded as a line-specific calibrated parameter rather than a universal value.
To determine the weighting factors of the three TCEI components, single-factor perturbation simulations were performed using the validated rigid-flexible coupled vehicle-track dynamic model. One parameter was varied at a time while the other inputs, including vehicle properties, track irregularity profiles, and baseline operating conditions, were kept unchanged to isolate the effect of each factor. Figure 6 illustrates the simulation conditions used for the weighting analysis. Random track irregularities based on Lu et al.’s 38 study were introduced to provide a realistic representation of the measured line conditions.
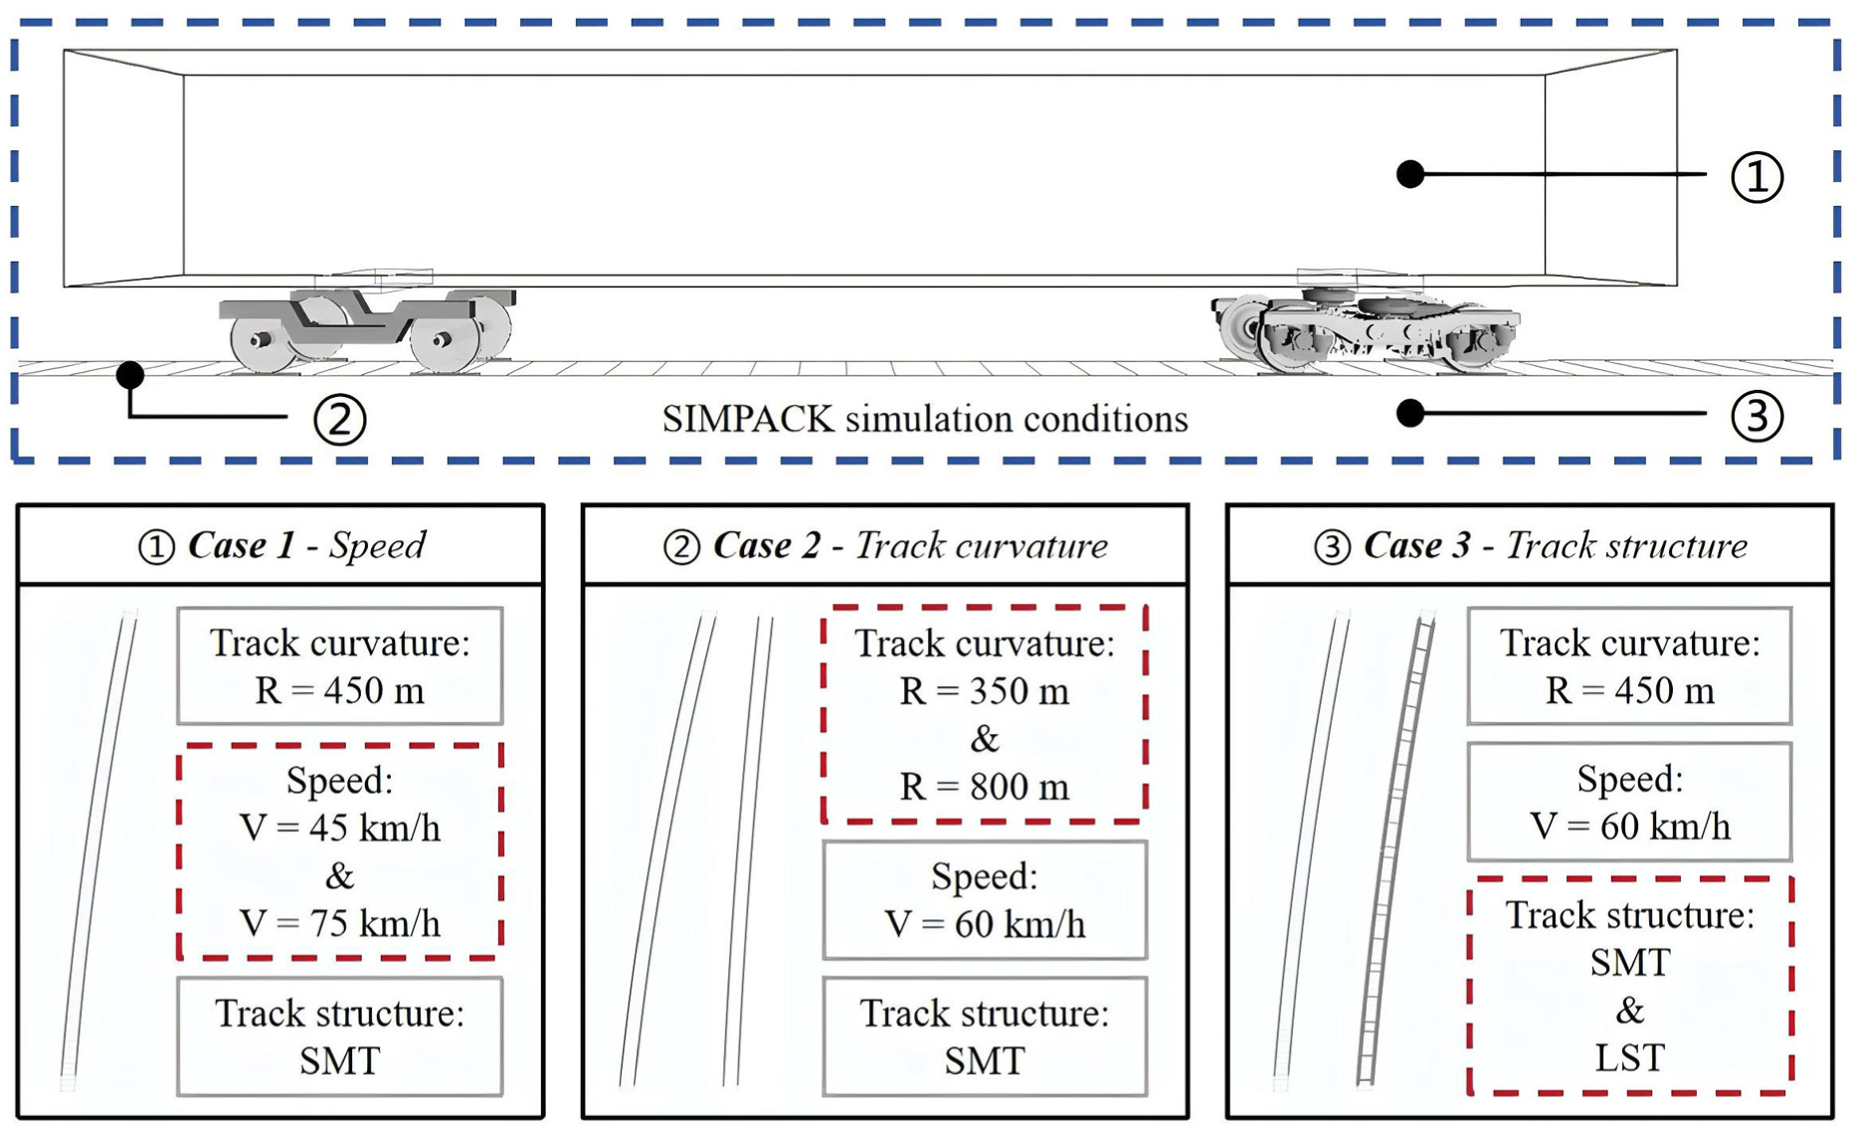
SIMPACK simulation conditions for determining the TCEI parameter weights. TCEI: track comprehensive excitation index.
The baseline condition was selected as a representative operating scenario to avoid biasing the sensitivity analysis toward either extremely mild or extremely severe conditions. For curve radius, R = 450 m was adopted as a typical small-radius curve condition. This selection was further supported by measured DPK values under SMT sections, where the damage level at R = 450 m was found to lie between those at R = 350 m and R = 800 m. For operating speed, 45 and 75 km/h were selected to represent lower and higher service-speed levels within the normal operating range, respectively. Signals below 45 km/h generally showed limited fatigue-relevant dynamic response, while data above 75 km/h were relatively limited in the investigated line. Although nonlinear interactions among speed, curvature, and track structure may exist, the single-factor perturbation simulations were intended to quantify relative sensitivity for constructing physically interpretable TCEI weights under a simplified engineering framework.
The resulting damage variation ranges and normalized weighting factors are listed in Table 4.
Weighting coefficients of the TCEI parameters.
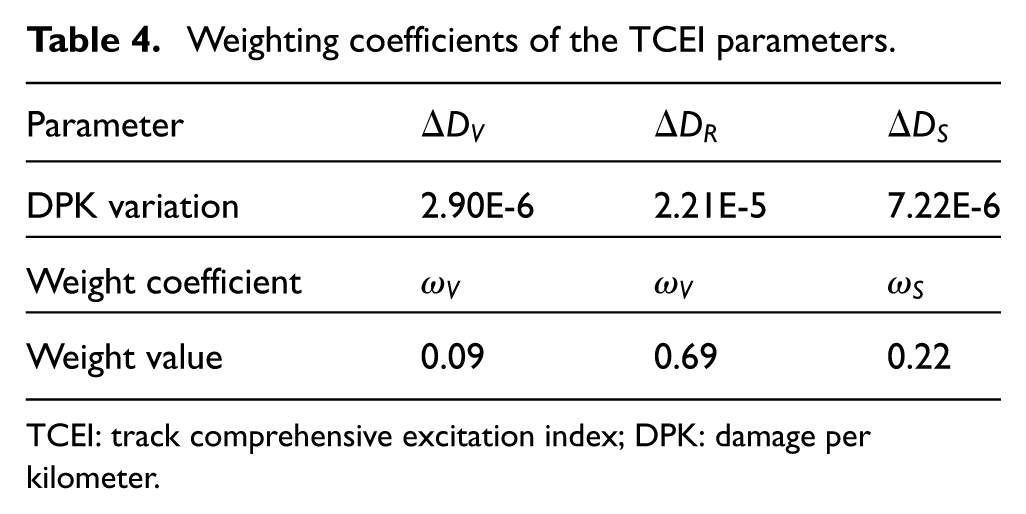
TCEI: track comprehensive excitation index; DPK: damage per kilometer.
As shown in Table 4, equivalent curvature has the largest weighting coefficient, accounting for 0.69 of the total contribution. This result indicates that curve-related geometric excitation plays the dominant role in governing bogie-frame fatigue under the investigated operating conditions. The track structure index has the second-largest weight of 0.22, confirming that the dynamic characteristics of different track structures also have a considerable influence on fatigue excitation. In contrast, mean operating speed contributes only 0.09, suggesting that its effect is relatively limited compared with curvature and track structure. This finding is consistent with previous studies,8,15 which showed that track curvature and structural characteristics are the primary factors affecting bogie-frame dynamic stress and fatigue damage in metro systems.
Using the obtained weighting coefficients, the TCEI value of each 200 m segment was calculated by combining the normalized mean speed, equivalent curvature, and track structure index. To obtain a station-interval-level representation, the segment-wise component parameters and TCEI values were averaged within each interval. Figure 7 presents the distribution of the TCEI components and the resulting TCEI values across all station intervals.
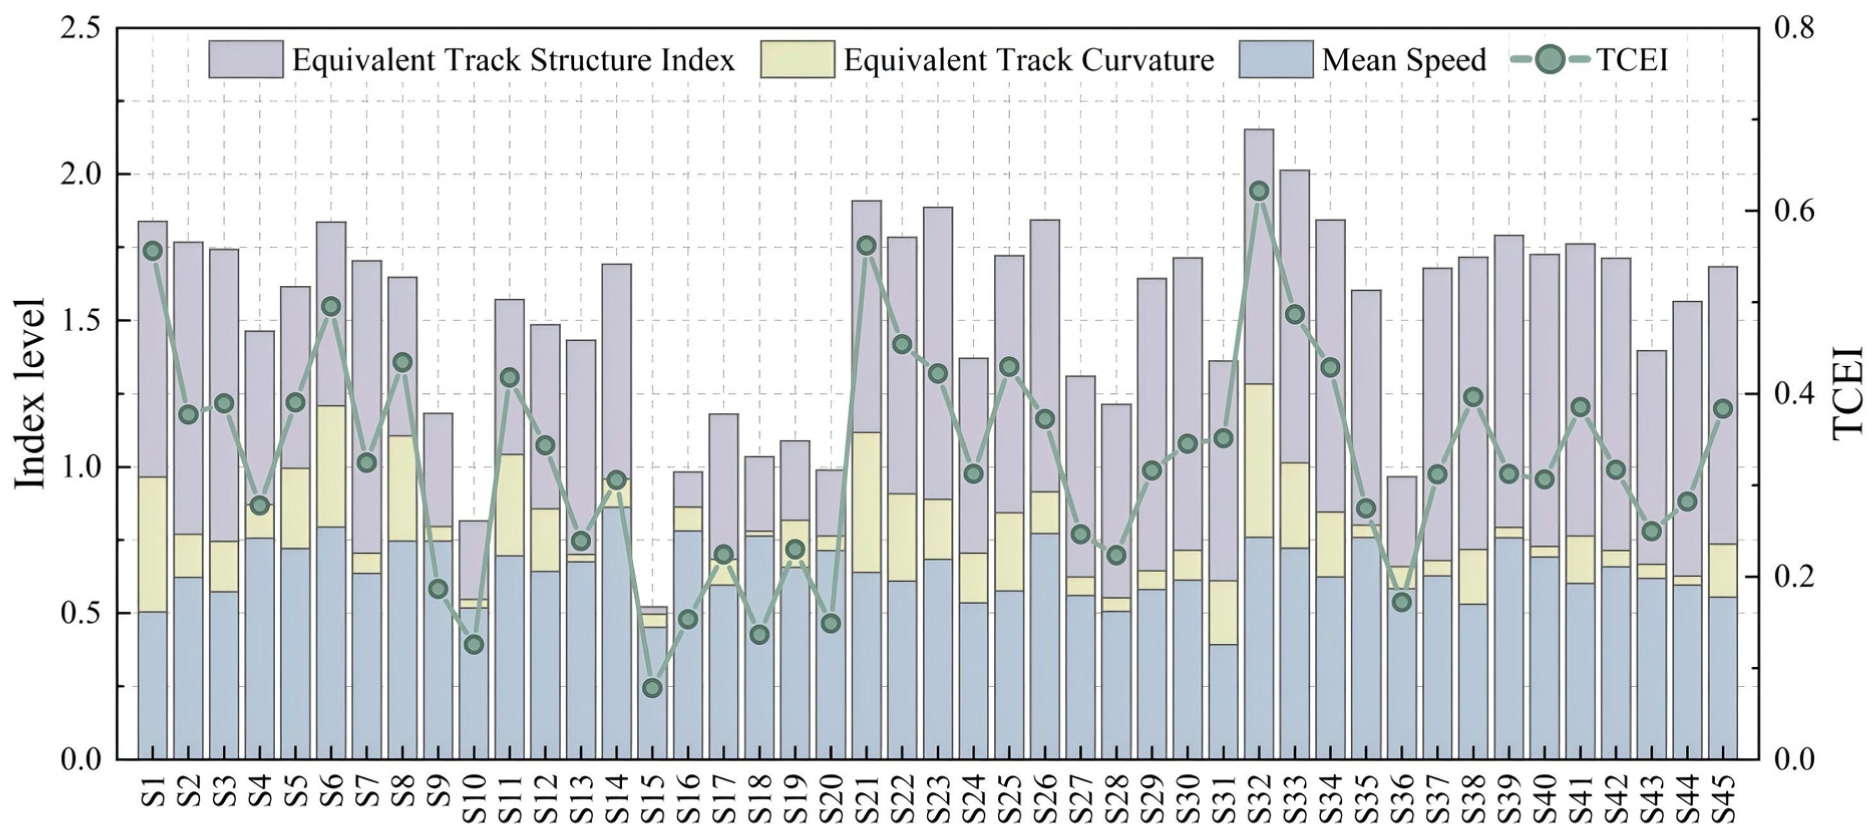
Distribution of TCEI component parameters and TCEI across all station intervals. TCEI: track comprehensive excitation index.
As shown in Figure 7, the mean operating speed varies only slightly across station intervals, whereas equivalent track structure index and track curvature show substantially larger fluctuations. When combined with their higher weighting coefficients, these two parameters emerge as the primary contributors to differences in track-induced excitation conditions. Notably, station interval S32 exhibits the highest values across all three parameters, reflecting a potentially severe fatigue environment for the bogie frame. This interval includes an extended section of the SMT track and a sharp curve with a radius of 350 m, both of which intensify excitation levels. Other intervals, such as S1, S6, S21, and S33, also demonstrate relatively high TCEI values due to the combined presence of small-radius curves and SMT track structures. Therefore, high TCEI values are mainly associated with sections where adverse geometric and structural conditions coexist.
It should be noted that the weighting coefficients and structural impact coefficients obtained here are calibrated for the investigated metro line and vehicle-track system. The proposed framework is transferable mainly at the methodological level, whereas specific parameter values, including the TCEI weights, track-structure coefficients, and evaluation thresholds, should be recalibrated before application to other vehicle-track systems.
Index validation
To validate the effectiveness of the constructed TCEI, Figure 8 presents the relationship between the segment-wise TCEI values and the combined fatigue damage index

As shown in Figure 8, most segments are concentrated within the low-to-moderate TCEI range of 0–0.4, whereas relatively few segments fall within the high TCEI range above 0.6. These high-TCEI segments generally correspond to more severe excitation conditions and are therefore further examined in the subsequent track evaluation. To quantify the relationship between TCEI and
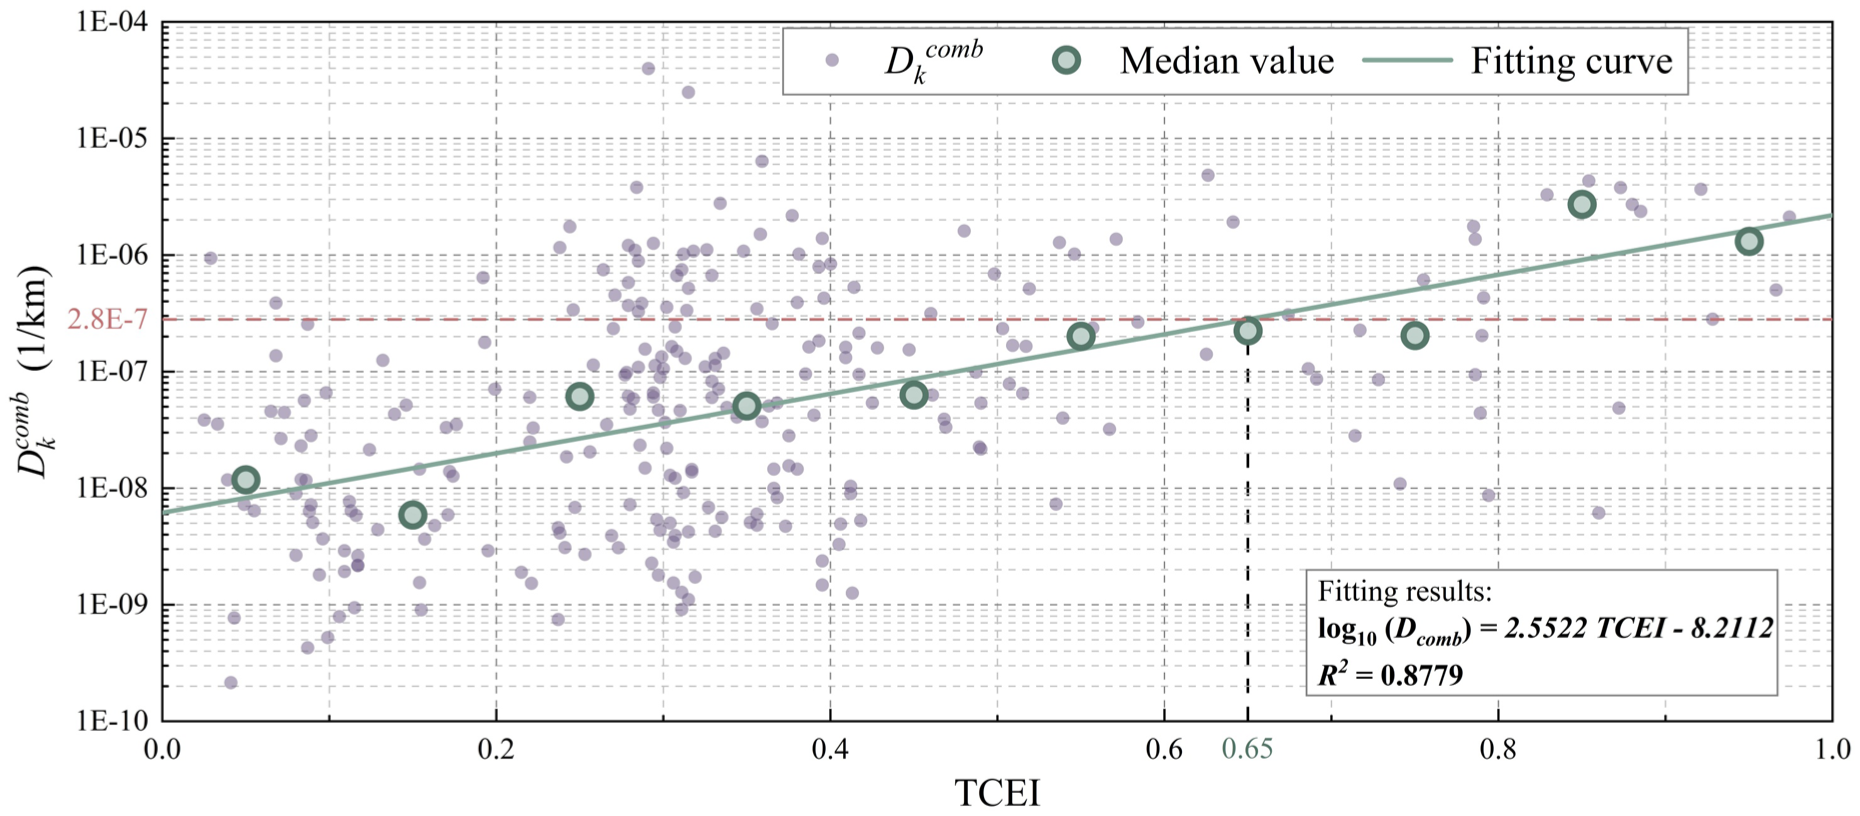
Relationship between TCEI and
Nevertheless, the scatter distribution exhibits noticeable dispersion, which can be attributed to the complex composition of the metro track system, random track irregularities, and nonlinear transmission between track excitation and bogie-frame response. To reveal the underlying trend more clearly, the dataset was grouped into TCEI intervals with a step size of 0.1, and the median
To further describe this overall tendency, a log-linear trendline was fitted using the 10 binned median values. Since

with
Track evaluation and case study
Building on the validated relationship between TCEI and combined fatigue damage index in ‘Index validation’ section, this section develops an exceedance-probability-based track evaluation criterion for practical maintenance decision-making. In conventional track quality assessment, threshold values are commonly used in TQI-based methods to distinguish track sections requiring inspection or maintenance from those considered acceptable.32,35 Following this threshold-based evaluation logic, the present study establishes TCEI boundaries by linking track-induced excitation to the probability that the combined fatigue damage exceeds the reference threshold derived from the bogie frame design mileage. In this way, continuous TCEI values are converted into low-, moderate-, and high-risk categories for fatigue-oriented track evaluation.
Track evaluation based on TCEI
Because individual segment responses exhibit substantial scatter, point-wise analysis does not adequately reveal the relationship between TCEI and fatigue exceedance. To address this limitation, we employ a sliding-window approach to estimate the local exceedance probability of fatigue damage along the TCEI axis. We first rank all segments according to their TCEI values and then apply a moving window containing consecutive segments to evaluate the statistical behavior of fatigue damage under similar excitation conditions. In the primary analysis, we set the window length to 40 segments to balance statistical robustness and sensitivity to local variations.
Within each window, we define the exceedance probability as the fraction of segments whose combined fatigue damage
To assess the influence of window length on exceedance probability estimation, we performed additional analyses using window sizes of W = 30, 40, and 50. As shown in Figure 9(a), the resulting fitted curves closely overlap for TCEI < 0.6, indicating that the exceedance probability remains highly stable across the primary range of the data set. Differences become noticeable only when TCEI > 0.6, where the exceedance probability increases sharply, and the number of available samples decreases. Even within this region, the TCEI values corresponding to a 75% exceedance probability vary by less than 0.07 across the three window sizes, demonstrating limited sensitivity to window length. Based on this consistency, we selected W = 40 for subsequent analysis as a balance between statistical stability and resolution. Figure 9(b) presents the final relationship between TCEI and the exceedance probability of the fatigue damage threshold, with red markers representing empirical exceedance probabilities obtained using the sliding-window approach described earlier.
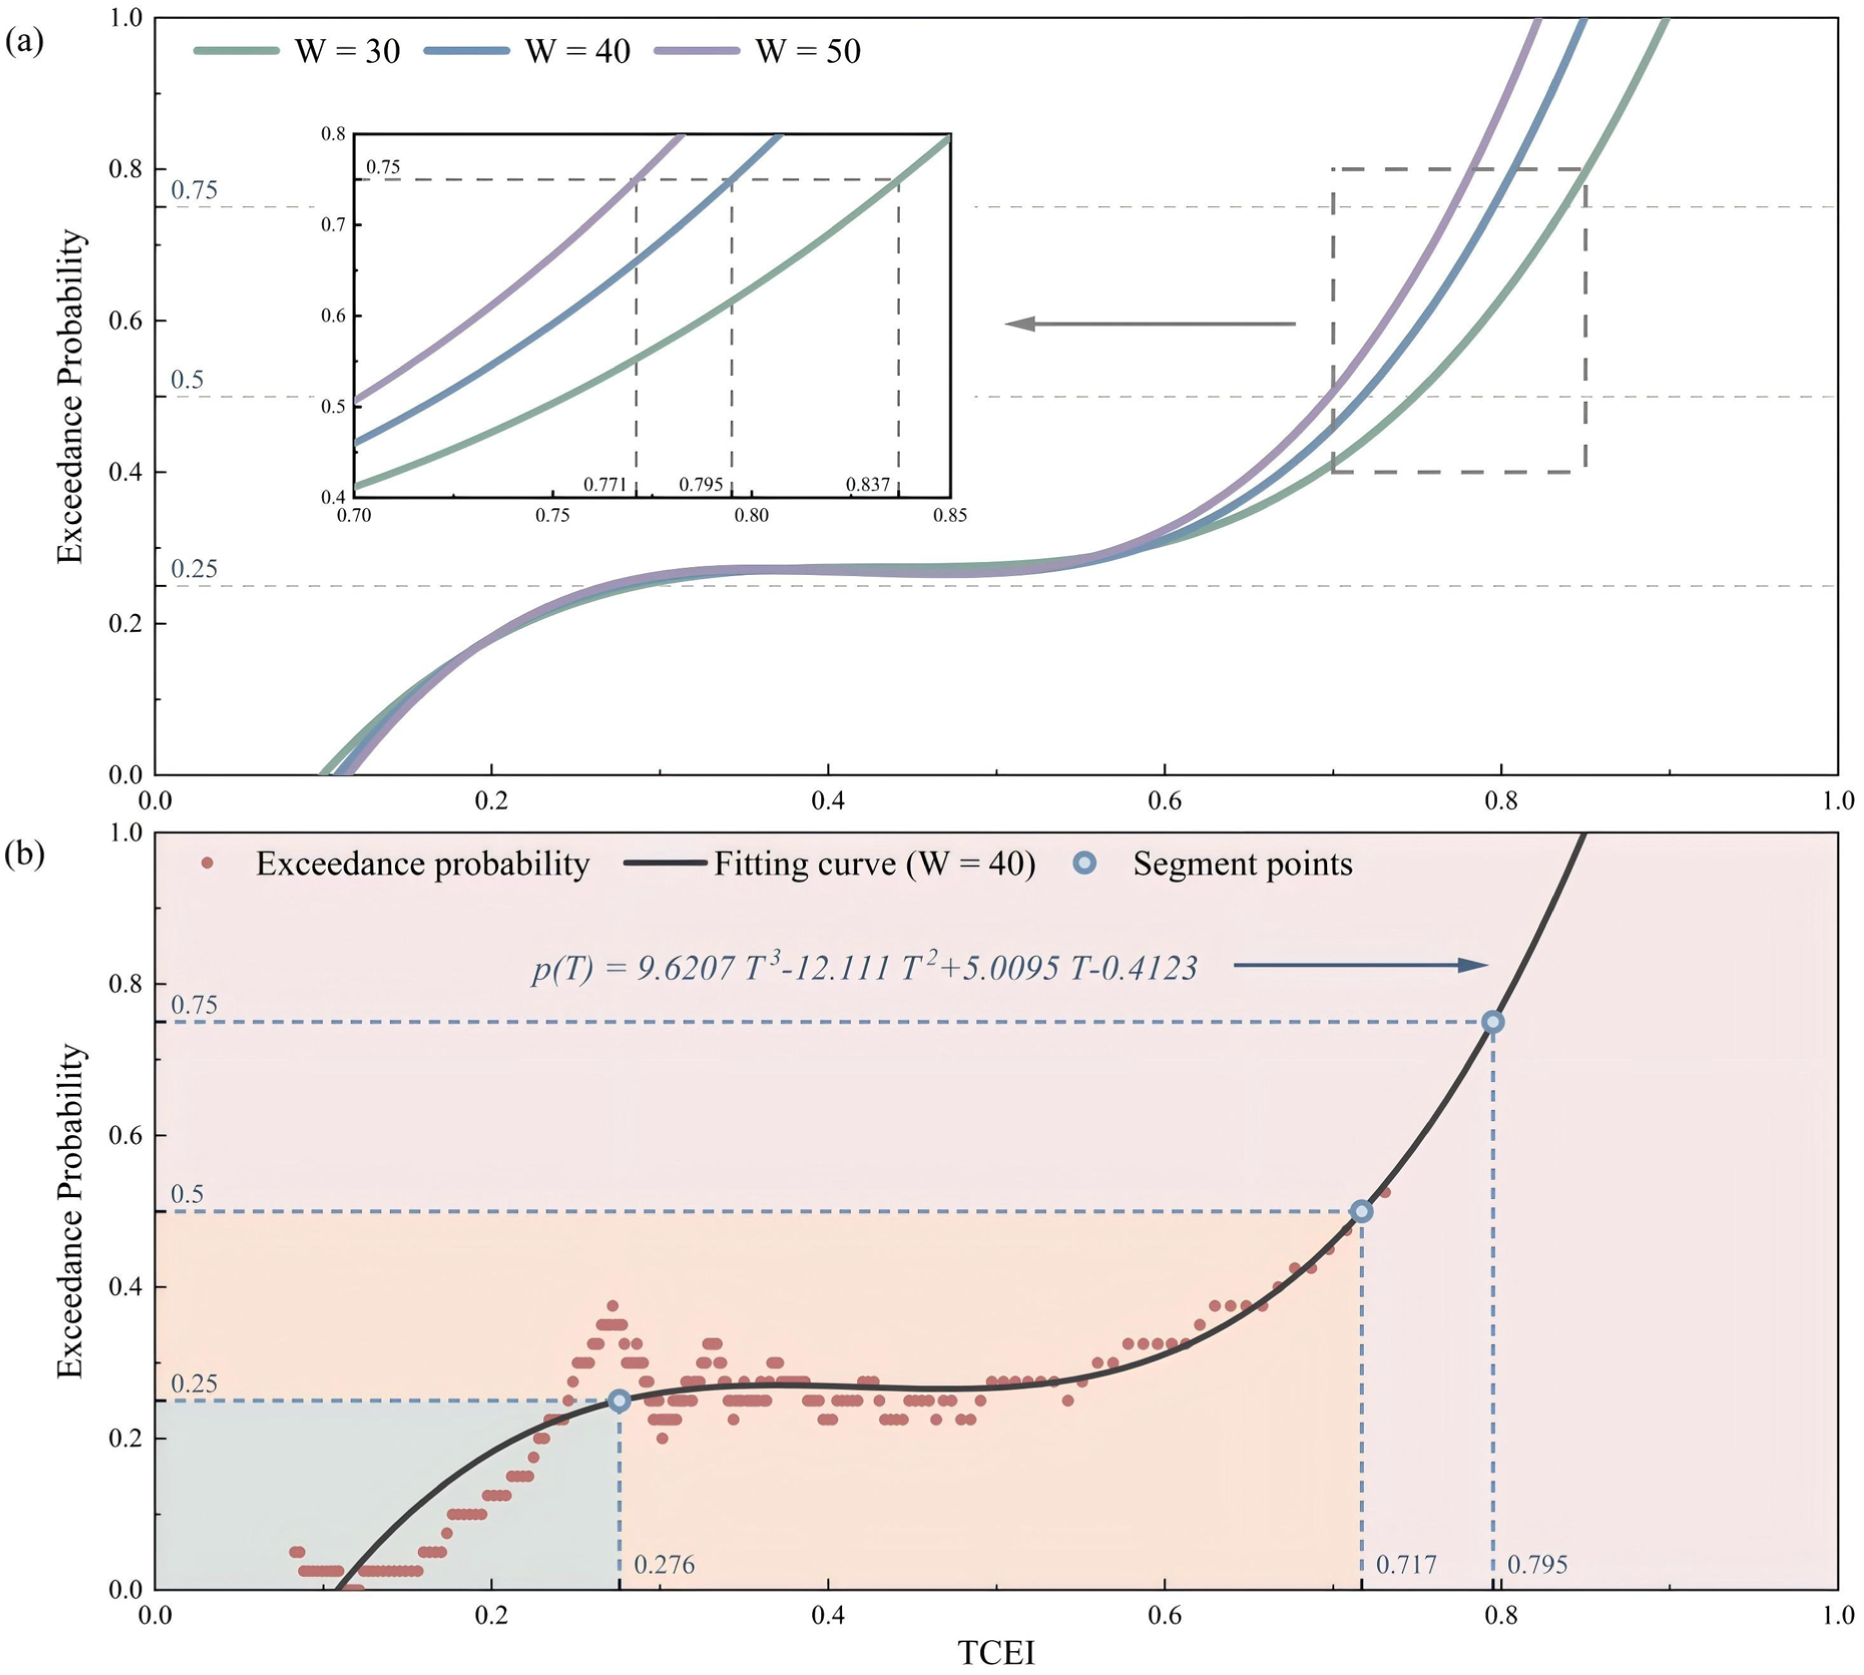
Determination of TCEI evaluation thresholds based on exceedance probability: (a) influence of sliding window length on the fitted exceedance probability curves and (b) final fitted curve and threshold identification using W = 40. TCEI: track comprehensive excitation index.
To characterize the overall relationship between TCEI and the exceedance probability, we fitted a third-order (cubic) polynomial to the empirical data. Compared with higher-order models, the cubic formulation achieves a coefficient of determination of

As shown in Figure 9, the exceedance probability increases rapidly with TCEI in the low-excitation region (TCEI < 0.3), indicating that key factors such as track curvature and track structure begin to exert a stronger influence on bogie frame fatigue behavior. A similarly sharp increase is observed in the high-excitation region (TCEI > 0.5), reflecting the elevated fatigue risk associated with severe track conditions. In contrast, intermediate range (TCEI = 0.3–0.5) exhibits a plateau, where the exceedance probability remains nearly constant at around 0.25. This behavior suggests that, within this interval, variations in excitation intensity do not significantly alter fatigue risk. Instead, the bogie system appears to operate in a relatively stable regime, where additional factors, such as vehicle dynamics or local structural characteristics, may exert comparable influence and merit further investigation.
Coefficients of the fitted cubic polynomial function (W = 40).

Based on the fitted curve, we determine the TCEI values corresponding to different exceedance probability levels. Specifically, the 25, 50, and 75% exceedance probabilities correspond to TCEI values of 0.276, 0.717, and 0.795, respectively, as illustrated by the blue dashed lines and marked intersection points in Figure 9. These characteristic points provide quantitative thresholds for evaluating fatigue risk under varying excitation conditions. From an engineering perspective, we interpret the 25% level as a warning threshold and the 50% level as a critical intervention threshold. Notably, the small difference between the 50% and 75% thresholds indicates that fatigue risk increases sharply once TCEI exceeds a certain level; an increment of approximately 0.078 in TCEI raises the exceedance probability from 50 to 75%. This rapid escalation suggests that the system transitions quickly into a high-risk state under severe excitation. Therefore, for uniform 200 m track segments and considering the overall trend of increasing exceedance probability, we adopt the TCEI values corresponding to the 25 and 50% levels—approximately 0.28 and 0.72—as practical evaluation thresholds. It is also worth noting that the 50% exceedance-probability threshold of approximately 0.72 is reasonably close to the reference value of approximately 0.65 obtained from the log-linear trendline in previous section. This agreement suggests that the probability-based threshold is broadly consistent with the trend-based validation result.
When TCEI < 0.28, we classify the system as operating in a low-risk state, where track-induced excitation remains relatively small, and the probability of fatigue failure is minimal. In the intermediate range 0.28 < TCEI < 0.72, the system transitions into a moderate-risk state, in which fatigue damage may develop at critical locations of the bogie frame; under these conditions, we recommend enhanced monitoring and targeted inspection. When TCEI > 0.72, we classify the system as high risk, indicating severe track conditions and a significantly elevated probability of fatigue failure. Under such conditions, operators should implement timely mitigation measures to reduce operational risk and ensure safe operation.
Comparison between TCEI and conventional track condition indicators
Conventional track condition assessment methods typically rely on either axle box acceleration or track geometry parameters. In acceleration-based approaches, researchers use axle box signals to derive indices such as the rail corrugation index,28,29 which serve as the basis for condition evaluation. In geometry-based approaches, practitioners compute the TQI from measurements collected by dedicated inspection vehicles and then analyze the statistical characteristics of the recorded geometry data. In the present study, however, such inspection data were unavailable, preventing direct comparison with conventional TQI metrics. Instead, we evaluated the effectiveness of the proposed track evaluation method by comparing the TCEI with several single-parameter indicators, including the RMS value of vertical axle box acceleration, operating speed, equivalent track curvature, and track structure index. We summarized their Spearman correlation coefficients with fatigue damage in Table 6 to assess their relative performance.
Spearman correlation coefficients between

TCEI: track comprehensive excitation index.
Figure 10 compares the RMS values of vertical axle box acceleration with the proposed TCEI across all station intervals. Overall, both indicators exhibit similar spatial trends, indicating that the TCEI effectively captures variations in track-induced excitation along the line. However, noticeable discrepancies remain in several intervals, particularly S1, S7, S32, and S40–S44, as highlighted by the light red boxes in the figure. These differences reflect the inherent limitations of axle box acceleration as a system response quantity. Specifically, axle box acceleration depends not only on track condition but also on operating speed, local irregularities, and wheel-rail contact behavior, which complicates its physical interpretation. Moreover, its measurement relies on field measurements, and high response amplitudes do not clearly indicate whether excitation originates from geometry, structural configuration, localized defects, or transient impacts. In addition, part of the measured excitation attenuates through the primary suspension before reaching the bogie frame, meaning that axle box acceleration does not directly correspond to fatigue-relevant loading. High values may also occur at localized features such as turnouts, rail joints, and transition sections, which occupy limited portions of the line and therefore may not significantly influence overall fatigue damage distribution.
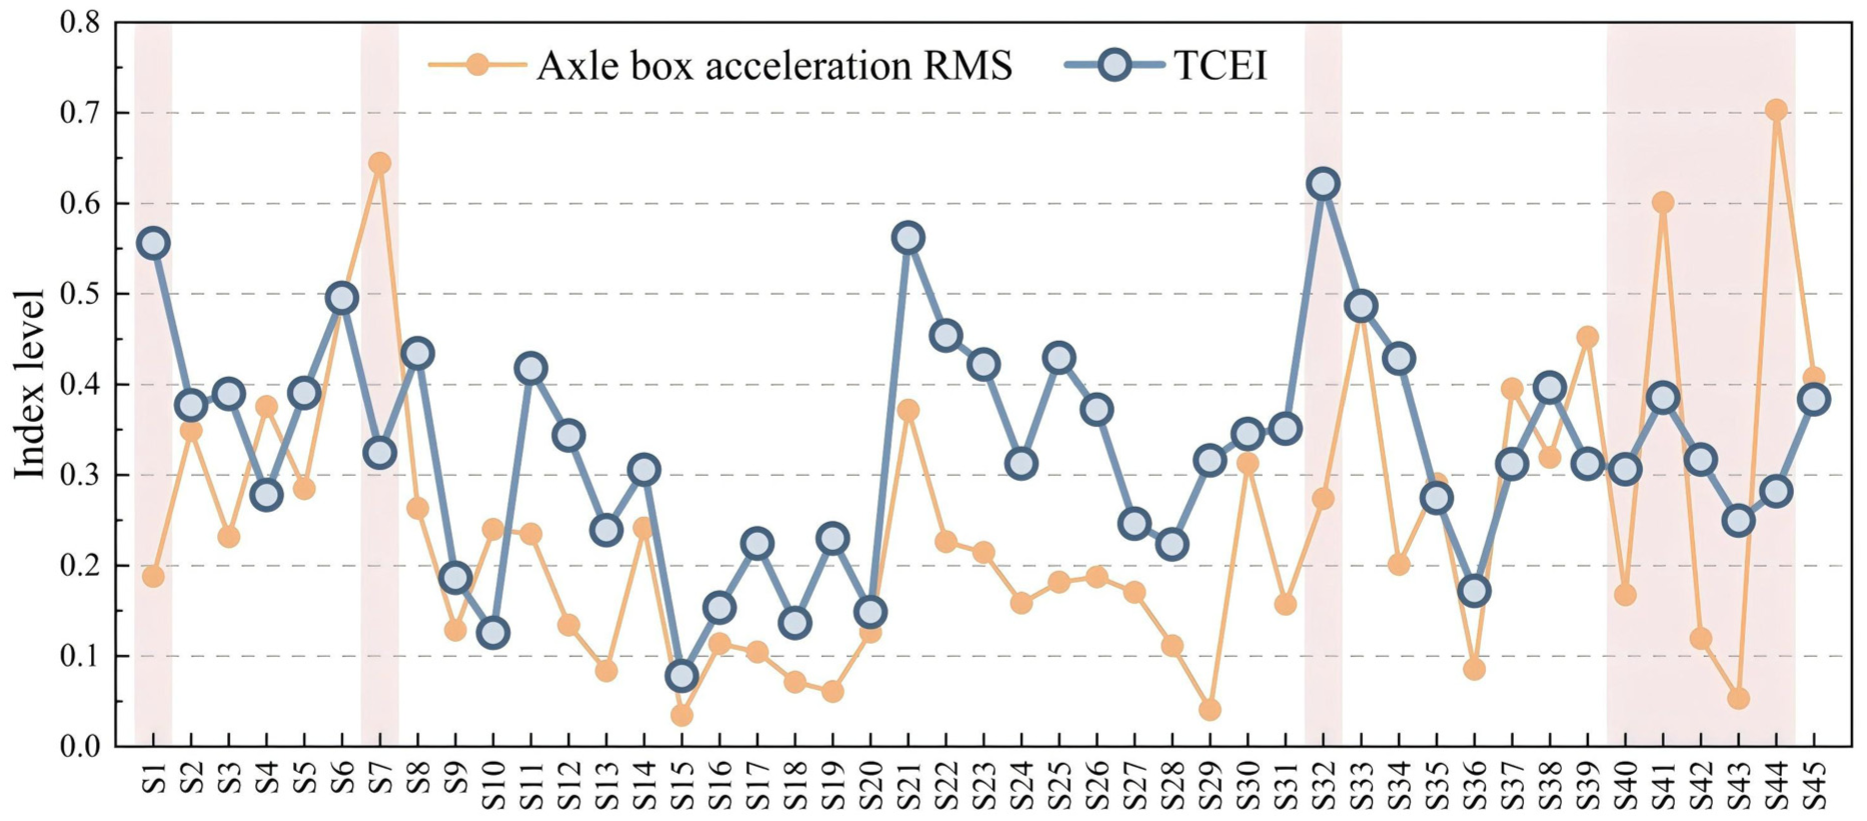
Comparison of RMS axle box acceleration and TCEI across all station intervals. TCEI: track comprehensive excitation index.
The results presented in Table 6 show that the proposed TCEI maintains a moderate yet statistically significant monotonic association with the combined fatigue damage of the bogie frame. Notably, the equivalent track structure index exhibits a correlation of similar magnitude, confirming that track structural characteristics play a key role in fatigue behavior on the investigated line. However, the primary advantage of the TCEI does not lie in outperforming all individual indicators in terms of correlation strength. Instead, it stems from its ability to integrate operating conditions, track geometry, and structural features into a single, physically interpretable framework. This integrated representation provides a more comprehensive surrogate descriptor of track-induced excitation and makes the TCEI particularly suitable for engineering applications involving segment-level track evaluation and fatigue-risk assessment.
Conclusions
This study proposes a damage-oriented track evaluation method for metro systems from the perspective of bogie frame fatigue safety. Unlike conventional approaches such as the TQI, which primarily assesses track condition based on geometric parameters or response-based indicators, the proposed framework directly links track evaluation to measured fatigue damage in the bogie frame. By integrating crack inspection results with statistical analysis of segment-wise fatigue damage—particularly variability measures such as standard deviation and CV—we identify FCLs that are most sensitive to variations in track condition and operational parameters. We then construct a combined fatigue damage index from measured structural responses to represent the overall fatigue state of the bogie frame. Building on this foundation, we develop the TCEI, which integrates the effects of track curvature, track structure, and operating speed into a unified and physically interpretable measure. This formulation eliminates the need to evaluate individual track features separately and instead provides a practical indicator for assessing excitation severity and its impact on fatigue performance. Consequently, the proposed track evaluation method enables efficient identification of track sections associated with elevated fatigue risks during metro operation. The main conclusions are as follows:
Fatigue damage of the bogie frame is primarily governed by six critical FCLs: 2-HD2, 1-HDY3, 2-HDY3, 1-HCL1, 2-HCL1, and 2-HCL5. These locations are mainly concentrated at weld seams between the crossbeam and the motor hanger cover plate and web plate, and between the crossbeam and the gearbox hanger vertical plate. Among them, 1-HDY3 contributes most significantly, with a normalized weight of 0.395, followed by 2-HDY3 with 0.151. The contributions of 2-HD2 and 2-HCL1 are equal at 0.140, while 1-HCL1 contributes 0.115, and 2-HCL5 exhibits the lowest contribution at 0.059.
The proposed TCEI combines normalized mean speed, equivalent curvature, and track structure index into a unified and compact descriptor of track-induced excitation relevant to bogie frame fatigue. The weight identification results indicate that track curvature dominates the excitation effect, with a weighting coefficient of 0.69, followed by the track structure index of 0.22, while operating speed contributes only 0.09. These findings confirm that fatigue excitation in metro bogie frames is primarily governed by track geometry and structural characteristics, with operating speed playing a secondary role under the investigated conditions.
Based on the established relationship between TCEI and the combined fatigue damage index, we classify metro track segments according to the exceedance probability of the fatigue damage threshold. The analysis shows that TCEI values of approximately 0.28 and 0.72 correspond to the 25 and 50% exceedance probabilities, which we adopt as the boundaries for low, moderate, and high-risk track conditions. Compared with single-parameter indicators such as axle box acceleration, equivalent curvature, or track structure index, the proposed TCEI integrates multiple excitation sources into a single framework. This integration enables a more comprehensive and physically interpretable representation of the track environment and its influence on bogie frame fatigue.
Overall, the proposed indices link track condition with bogie-frame fatigue response and provide a practical basis for identifying sections requiring inspection or maintenance. They can support targeted monitoring of fatigue-sensitive locations and the prioritized allocation of maintenance resources in metro operations.
Several limitations and transferability issues should also be noted. Passenger load variation was not systematically incorporated into the present framework, and nonlinear interactions among speed, curvature, and track structure were not explicitly considered due to the additive formulation of TCEI. In addition, the track structure component was represented at an aggregated segment level, without distinguishing finer-scale features such as rail type or fastener configuration. Future studies may refine the framework using expanded datasets, more detailed track-structure information, and multi-factor sensitivity analysis. From the perspective of transferability, the proposed damage-oriented framework is methodologically applicable to other railway systems because vehicle component failures induced by track degradation remain a common engineering concern. However, the specific parameters obtained in this study are line- and vehicle-dependent. Key parameters, including track-structure coefficients, TCEI weights, and evaluation thresholds, should therefore be recalibrated before applying the method to other passenger, freight, or metro lines.
Footnotes
Appendix
Damage proportion at each measurement point used to determine the relative contributions of SMT and LST (S5).
| S5 segment | 2-HD2 | 1-HDY3 | 2-HDY3 | 1-HCL1 | 2-HCL1 | 2-HCL5 |
|---|---|---|---|---|---|---|
| LST | 4.54E-08 | 6.05E-09 | 1.74E-09 | 1.46E-08 | 2.55E-08 | 1.84E-08 |
| SMT | 8.52E-08 | 7.65E-07 | 2.18E-07 | 8.62E-08 | 8.33E-08 | 2.95E-08 |
| Damage ratio | 0.533 | 0.008 | 0.008 | 0.169 | 0.306 | 0.623 |
| Mean | 0.2745 | |||||
| Median | 0.2376 | |||||
SMT: standard monolithic track; LST: ladder-type sleeper track.

Funding
The authors disclosed receipt of the following financial support for the research, authorship, and/or publication of this article: This work was supported by National Natural Science Foundation of China (grant number U2468210).
Declaration of conflicting interests
The authors declared no potential conflicts of interest with respect to the research, authorship, and/or publication of this article.