
Abstract
Egg shells and fish scales are two abundantly available by-products from food industries which can be used as filler materials to reinforce polymer composites. The bulk of discarded chicken eggshells and fish scales are disposed of in landfills, which cause environmental issues. The present research work focuses on the water absorption, mechanical and tribological properties of epoxy composites reinforced with chicken eggshells and catla fish scale particles. Hybrid composites incorporating both fillers were also made and evaluated. Results from the water absorption tests showed that the addition of fillers decreased the water absorption of the composites than neat epoxy. Tensile and impact tests revealed that the inclusion of fillers reduced the tensile and impact strength of the composites compared to neat epoxy, but improved the tensile modulus. The hybrid composite (EFREC) showed improvement in both flexural strength and modulus in comparison to neat epoxy. Also, the results from the wear tests revealed that the addition of fillers improved the wear resistance of the composites. Among all the mechanical and wear tested composite specimens, the hybrid composite (EFREC) showed the best performance. This was also validated from the SEM images of the fracture and wear surfaces of the composites.
Introduction
Natural fillers derived from animals and plants have been used as reinforcing materials in thermoset and thermoplastic matrices for the preparation of composites in recent years. 1 Environmental friendly properties like biodegradability, ease of availability, light weight coupled with low cost have led to significant use of natural fillers in composite industries. 2 In addition to the above advantages, natural fillers also have low hardness values, which prevents abrasion on manufacturing machine tools. 3 The types, sizes, and arrangement of the fillers influence the composites’ mechanical strength, thermal stability, and electrical conductivity. Furthermore, aspect ratio, the presence of a binding agent, and the interface between polymer matrices and fillers all have a major impact on composites’ properties.4,5 Egg shells and fish scales are two abundantly available by-products from food industries which can be used as filler materials to reinforce polymer composites. The bulk of discarded chicken eggshells and fish scales are disposed of in landfills, which cause environmental issues. 6 Their degradation generates ammonia, hydrogen sulfide, and amines, all of which have adverse effect on human health and the environment7,8 So, by using these waste products from food processing industries as natural fillers in composite industries, their adverse effect on the environment can be prevented. Most of these natural filler reinforced composites had found application in variety of sectors like packaging and automobile industries.9,10
Organic components (collagen, fat, lecithin, scleroprotein, various vitamins, etc.) account for around 40%–55% of the weight of fish scales, while inorganic components account for around 7%–25% of the weight (hydroxyapatite, calcium phosphate, etc.). Many researchers have developed fish scale-reinforced polymer composites for variety of applications.11–13 Aradhyula et al. 14 studied the mechanical properties of catla fish scales (CFS)/polypropylene (PP) composites. They found that for 30% CFS reinforced composites, there was an improvement of 11%, 17% and 35% in hardness, flexural strength and modulus of elasticity values in comparison to neat PP. Satapathy et al. 15 observed that by adding fish scale as a reinforcement to the epoxy resin, the wear resistance of the polymer composites can be enhanced. Yogeshwaran et al. 16 studied the mechanical properties of Epoxy/graphene/fish scale and fermented spinach hybrid bio composites. They observed that in comparison to fish scales/graphene/epoxy composite and fermented spinach/graphene/epoxy composite, the fish scales/fermented spinach/graphene/epoxy hybrid composite exhibited better mechanical properties.
Mineral limestone, also known as calcium carbonate, is a popular inorganic filler used to reinforce polymer composites. 17 Calcium carbonate in the form of calcite accounts for 94–97% of the chemical content of eggshells.18,19 So, waste egg shells can be used as an alternative to limestones to reinforce polymer composites. Many researchers have developed egg shell reinforced polymer composites for variety of applications.20,21 Eggshells (5, 10, 15, and 20 wt.%) were mixed with a synthetic epoxy matrix in a recent study. 22 Tensile strengths and Young’s modulus of the eggshell reinforced epoxy composites rose by 5%, 12%, 36%, and 16%, respectively, while un-notched Izod impact strength improved by 12%, 28%, 13%, and 11%, compared to the neat epoxy resin. Rahman et al. 23 investigated the mechanical properties of eggshell/unsaturated polyester composites and commercial calcium carbonate/unsaturated polyester composites with filler loading of 5, 10, 15, 20, and 25 wt%. They found that the tensile strength of eggshell/unsaturated polyester composites enhanced by 17%, 83%, 24%, 7%, and 14%, respectively, when compared to commercial calcium carbonate/unsaturated polyester composites, which increased by 1%, 69%, 19%, 7%, and 12% respectively.
Although, many researchers have developed and investigated the mechanical and tribological properties of fish scale reinforced polymer composites and egg shell reinforced polymer composites separately, however, very few research work have been done on the development and analysis of fish scale and egg shell reinforced hybrid polymer composites. Therefore, the aim of the present research work is to develop and investigate the mechanical and tribological properties of egg shell-fish scale reinforced hybrid epoxy composites (EFREC). Results were also compared to those obtained from fish scale reinforced epoxy composites (FREC) and egg shell reinforced epoxy composites (EREC).
Materials and methods
Materials
Catla fish scales were obtained from the freshwater fish markets of Varanasi, India. Waste chicken egg shells were gathered from the fast food joints of Varanasi, India. Epoxy matrix (LY 556) having a density of 1.25 gm/cm3 and its hardener (HY 951) were purchased from Atul Chemical works (Cuttack, India).
Processing of fish scales
The catla fish scales obtained from the fish markets were submerged for a time period of 2 h in a hot water bath having a temperature of 80°C to remove the impurities sticking to its surface. The washed fish scales were dried in the sun for 48 h to remove the moisture from the fish scale. A hot air oven was used to remove any remaining moisture content of the fish scales for another 2 h at 110°C. These fish scales were then pulverized in a flour mill, and the resulting material was sieved to achieve extremely fine powder particles.
Processing of egg scales
The obtained chicken eggshells were washed many times under running water, and the chicken eggshell membrane was removed during this procedure. The washed eggshells were dried in the sun for 10 h. The eggshells were further oven dried for a time period of 12 h at 85°C to remove any remaining moisture content. Hand compression was used to physically crush the dry eggshells, which were subsequently pulverized in a planetary ball mill to obtain extremely fine powder particles.
Composite fabrication
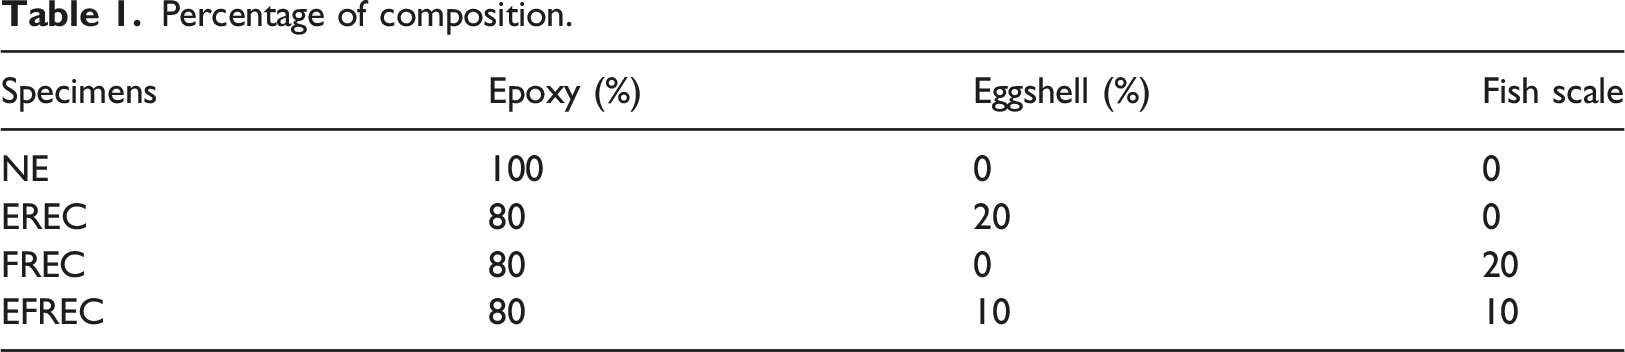
Percentage of composition.
Water absorption test
The water absorption characteristics of fish scale and eggshell reinforced epoxy composites were evaluated by using ASTM D570-98 standard. The composite specimens were submerged for a time period of 24 h in distilled water and the changes in the weight of the composites were recorded after 24 h. The following formula was used to compute the percentage of water absorption for the composite specimens.
W I = Initial weight of the composite sample before submersion.
Mechanical testing
The tensile strength and modulus of the fish scale and eggshell reinforced polymer composites were determined by the tensile strength test performed by 100 kN Instron 5,982 universal testing machine on composite samples (140 mm × 16 mm × 5 mm) according to ASTM D3039. Impact strength of the fish scale and eggshell reinforced polymer composites were obtained by the charpy impact strength test conducted by Resil Impactor impact testing machine on composite samples (125 mm × 13 mm × 5 mm) according to ASTM D6110-10 standard. Microhardness properties of the composite specimens were also evaluated at a load of 400 gm by Microindentation Tester:MHT3 (Anton Paar). All the mechanical tests were repeated for a minimum number of three times for each type of composite specimen.
Tribological test
Tribological tests (dry sliding wear tests) of fish scale and eggshell reinforced epoxy composites were carried out on a ball-on-block wear test setup supplied by Ducom Instruments, Bangalore, India. The dry sliding wear experiments were performed on the rotating composite samples (35 mm × 35 mm × 5 mm) and a stationary steel ball of 10 mm dia was used as the counter surface during the experiments. The wear experiments were performed at different normal loads (10 N, 15 N, 20 N and 25 N), different sliding velocities (0.5 m/s, 1 m/s, 1.5 m/s and 2 m/s) and at different sliding distance (500 m, 1,000 m, 1,500 m and 2,000 m). A friction sensor was used for the measurement of friction force. The weight loss of the wear tested fish scale and eggshell epoxy composites were measured with the help of an electronic balance (accuracy 10−4 gm) and the weight loss (WLS) of the wear tested composite samples were calculate from the equation (1) as given below
WF = Final weight of tribo-tested composite specimens (gm).
WI = Weight of the composite before the wear test (gm).
Scanning electron microscopy (SEM)
Tensile fracture surfaces and wear tracks of the composite samples were studied with the help of a scanning electron microscope (EVO-Scanning Electron Microscope MA15/18 by Carl Zeiss Microscopy Ltd). The Quorum 150 R ES metallizer was used to metallize the tested composite surfaces with an 11 nm gold layer prior to inspection.
Results and discussions
Water absorption test
The results of the water absorption test of the neat epoxy and the composite specimens were presented in Figure 1. It is found that the filler reinforced epoxy composites has a significantly lower water absorption rate in comparison to neat epoxy (NE). The hydrophobic nature of the filler particles (both eggshell and fish scale), as well as the bonds produced by the fillers, might explain this substantial decrease.22,24 The rate of water absorption also varies depending on the type of filler. The water absorption of neat epoxy is reduced from 0.38% to 0.22% when eggshell particles are added to it. In addition, including fish scale particles into the epoxy decreases water absorption from 0.38% to 0.18%. Thus, fish scale reinforced epoxy composites (FREC) has a lower water absorption rate when compared to eggshell reinforced epoxy composites (EREC). Better packing and uniform dispersion of the fish scale particles may well have resulted in a stronger bond that resists water penetration, resulting in a decrease in water absorption rate of FREC in comparison to EREC. Also, the addition of both fish scale and egg shell particles into the epoxy reduced the water absorption from 0.38% to 0.11%. Hence, the hybrid composite, I. e, fish scale and eggshell reinforced epoxy composites (EFREC), had the lowest moisture absorption rate among all the tested composite specimens. This might be owing to the synergistic action of calcium carbonate-based eggshell particles, which results in a composite material with increased barrier characteristics and improved packing and homogeneous dispersion of fish scale particles, resulting in a stronger bonding with the epoxy matrix.22,24 Percentage of water absorbed by NE, EREC, FREC and EFREC.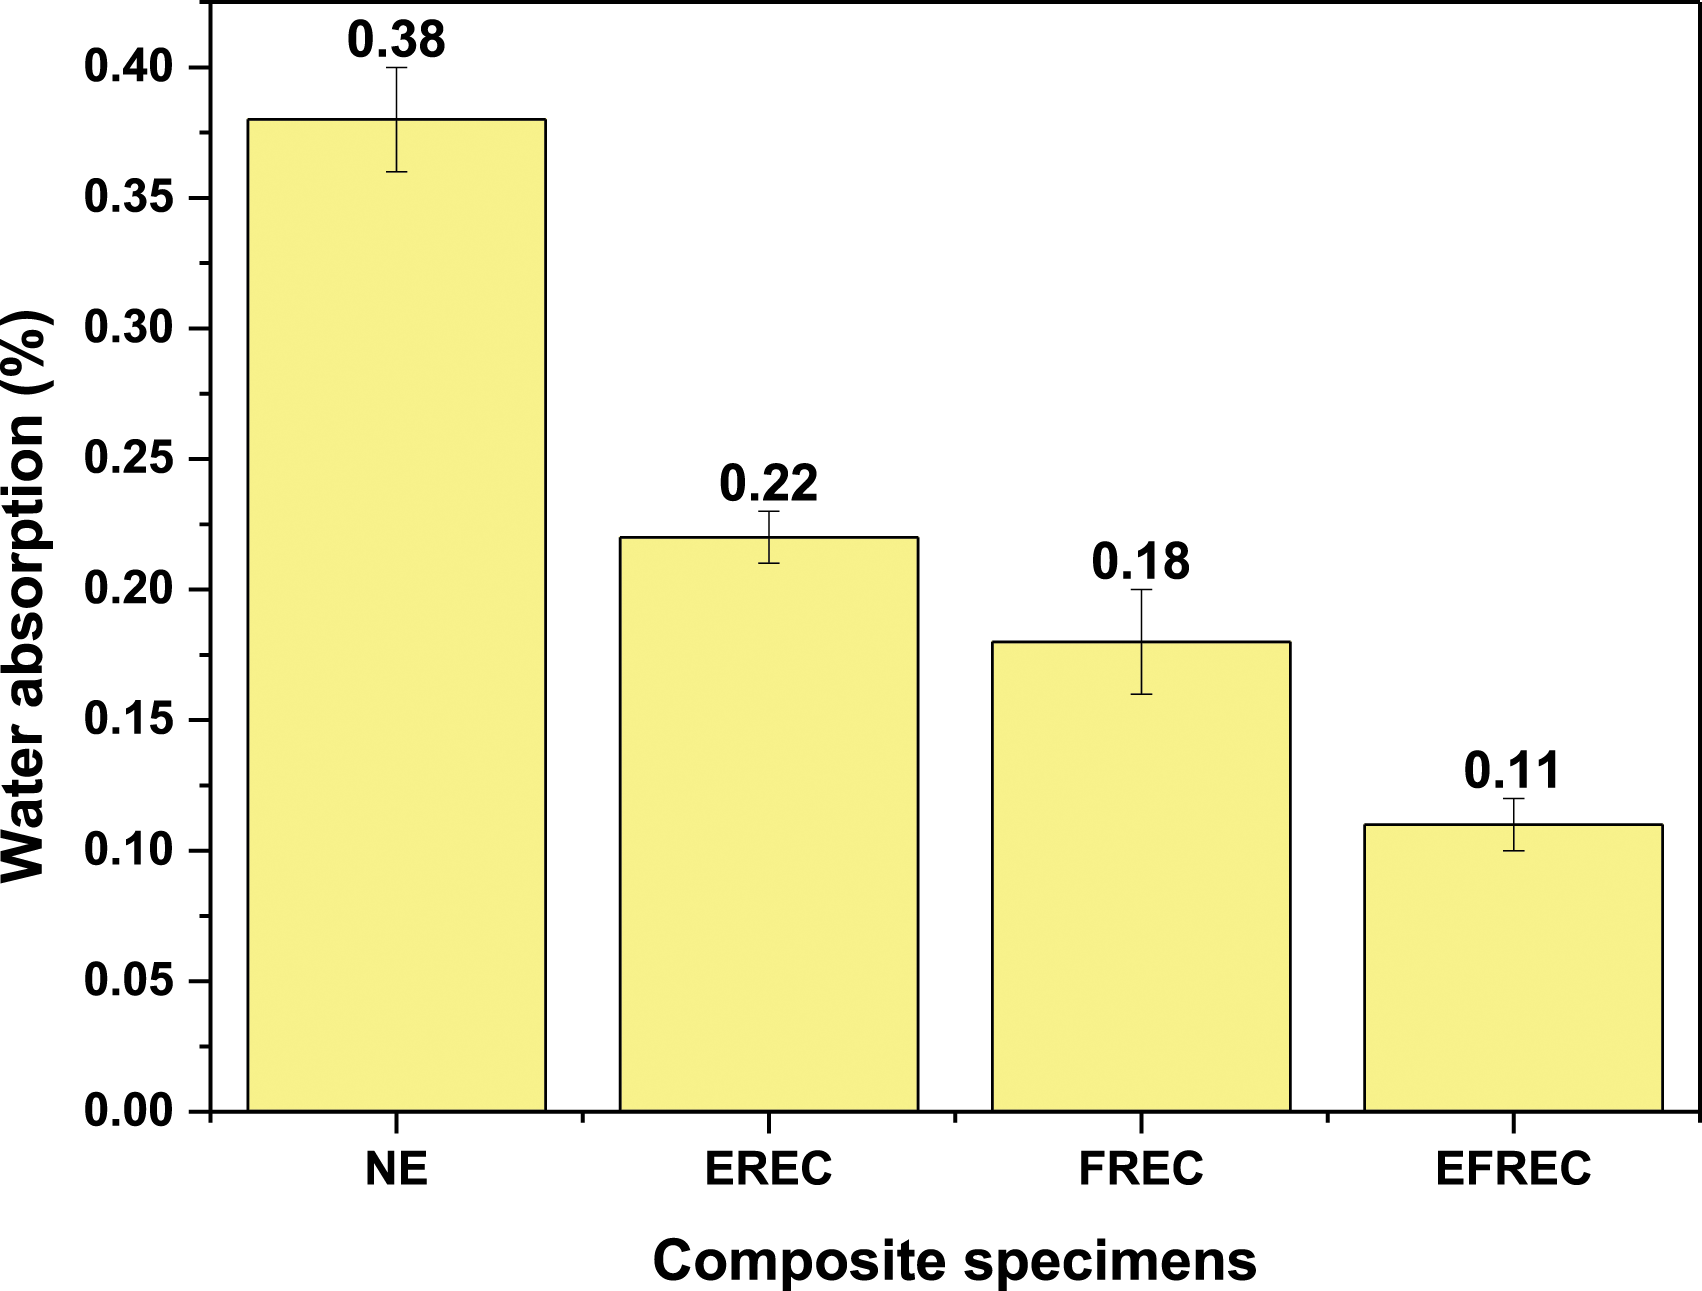
Mechanical test
The tensile test results were represented in terms of tensile strength, tensile modulus and stress-strain curves in Figure 2, Figure 3 and Figure 4 respectively. From the Figure 2, it can be observed that the addition of both eggshell and fish scale particles has led to a reduction in tensile strength of the composites. The tensile strength of NE was 26.80 MPa, however the tensile strength of EREC, FREC and EFREC was reduced by 51.19%, 44.44% and 37.16% respectively in comparison to NE. Several researchers also obtained similar results.25–27 The fillers (both eggshell and fish scale), according to the researchers, lower the TS of the composites due to poor adherence of the filler with the matrix caused by agglomeration of the filler particles in the polymer matrix. This may have resulted in poor stress transfer from the polymer matrix.
25
From the Figure 2, it is also observed that there is an improvement of 13.83% and 28.74% in tensile strength of FREC and EFREC when compared to EREC. This may be due to the non-uniform dispersion of eggshell particles in the epoxy matrix which may have resulted in stress concentration points leading to poor fiber-matrix interfacial adhesion.
28
This demonstrates that the tensile strength of the composite is extremely sensitive to the interfacial bonding of the filler and epoxy matrix. Tensile strength of NE, EREC, FREC and EFREC. Tensile modulus of NE, EREC, FREC and EFREC. Tensile Stress-Strain curves of NE, EREC, FREC and EFREC.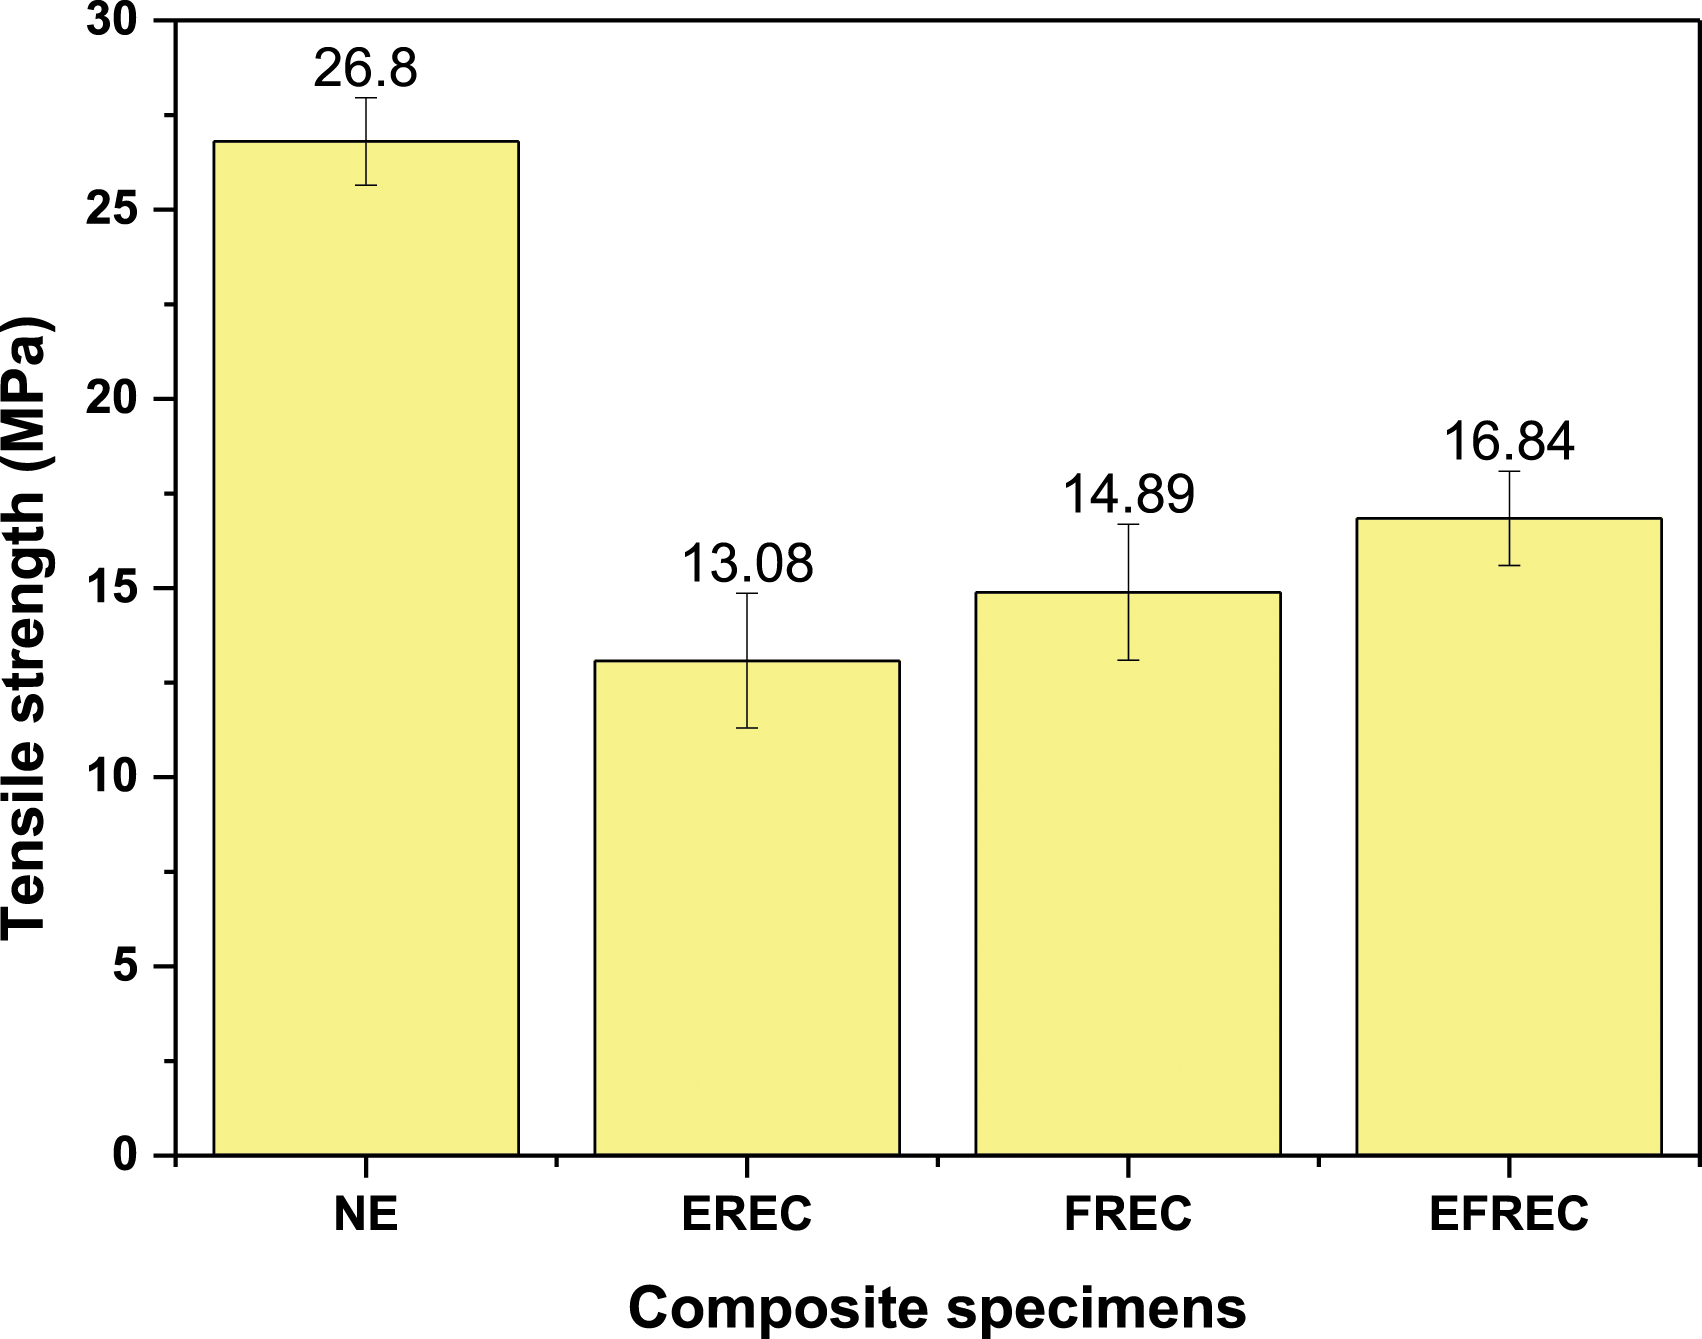
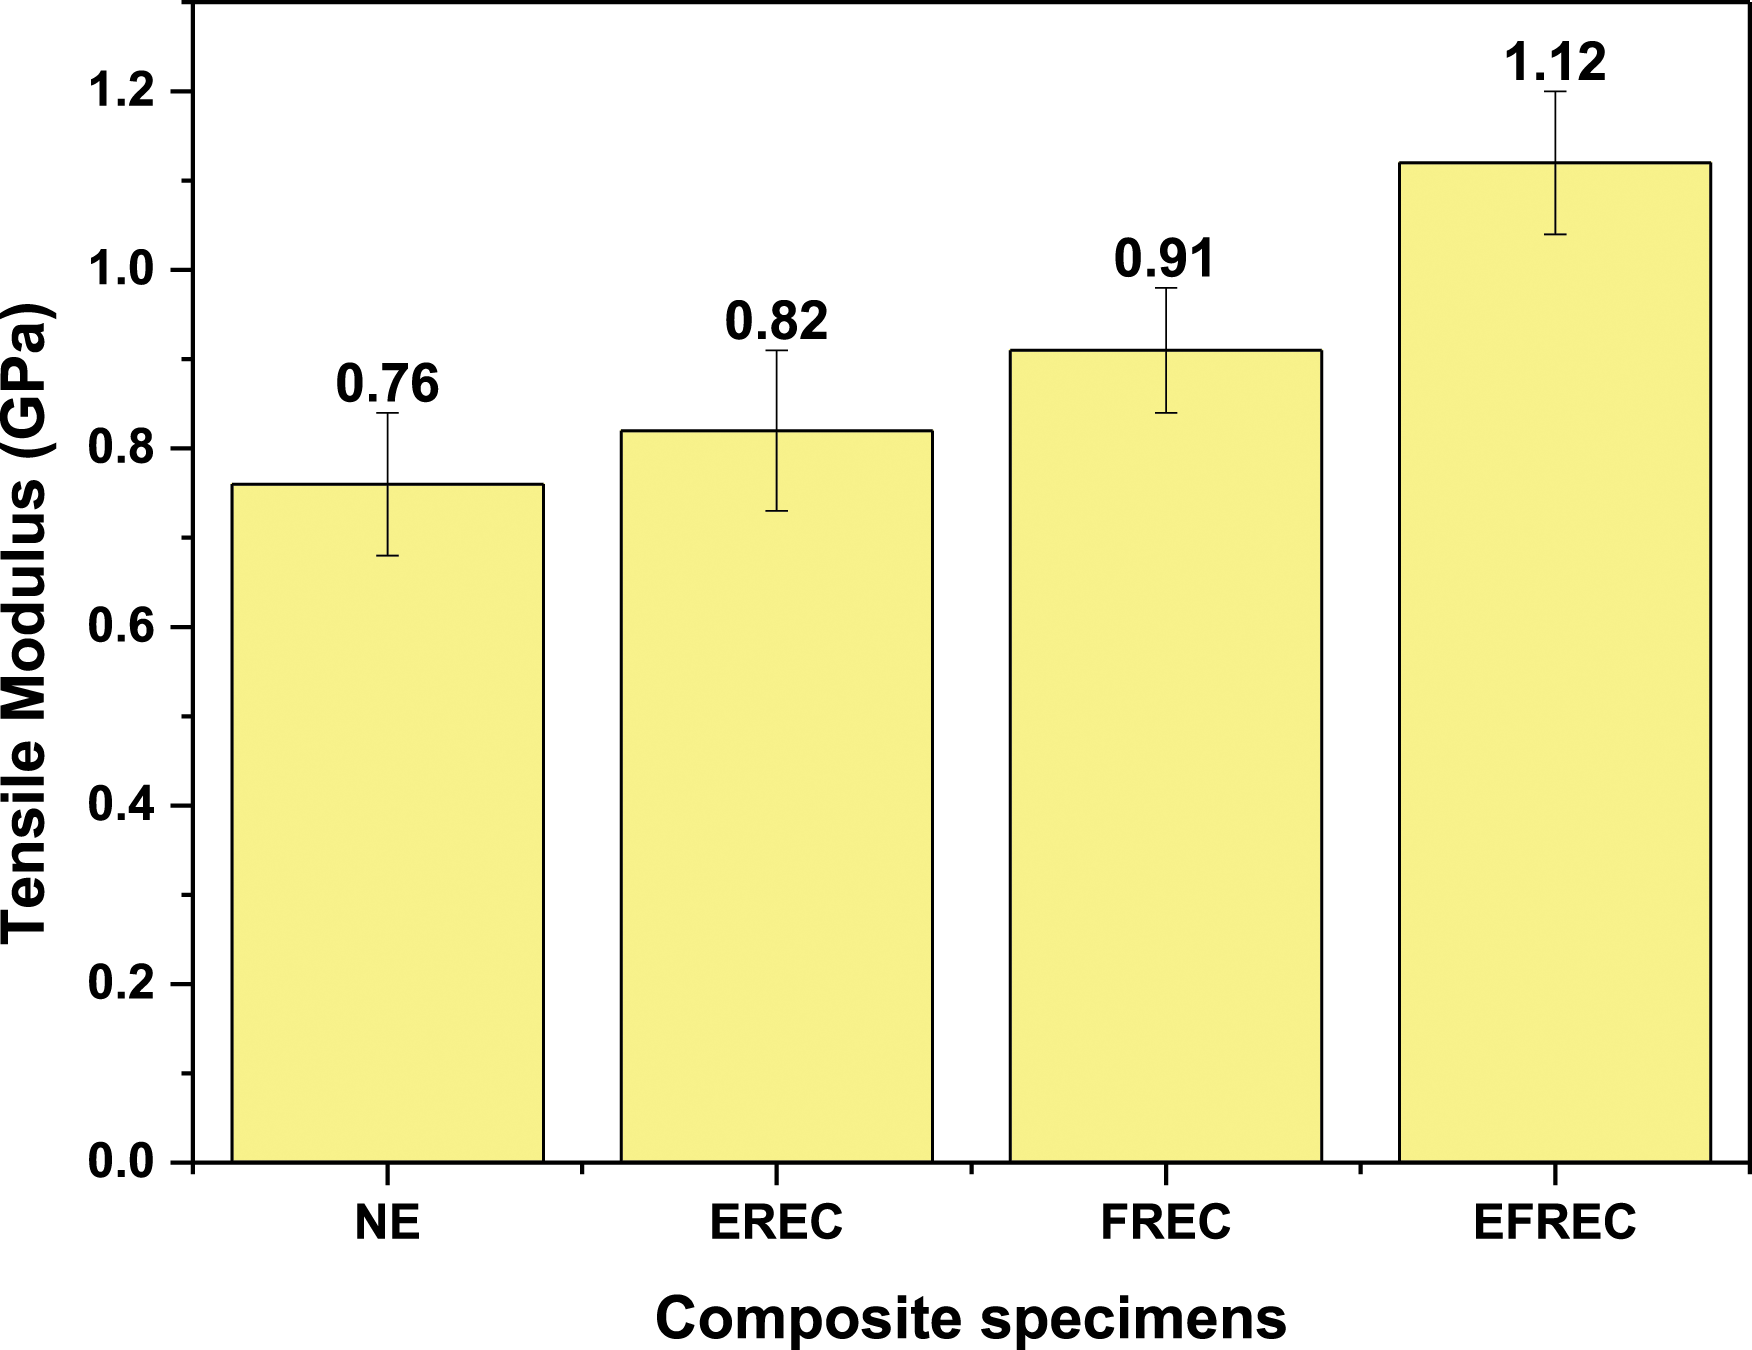
However, contrary to the tensile strength, the tensile modulus increases with addition of both eggshell and fish scales in to the epoxy. The tensile modulus of NE was 0.76 GPa but the tensile modulus of EREC, FREC and EFREC was improved by 7.89%, 19.73% and 47.36% respectively in comparison to NE (Figure 3). This increase in tensile modulus of the filler reinforced composites might be caused by the incorporation of rigid and stiff filler materials like eggshell and fish scale. Also due to better dispersion, there is a wider interface region between the fillers and epoxy matrix. Furthermore, there may be a weak Vander Waals force, which should be sufficient to form the required bonding between the filler and the matrix.29,30
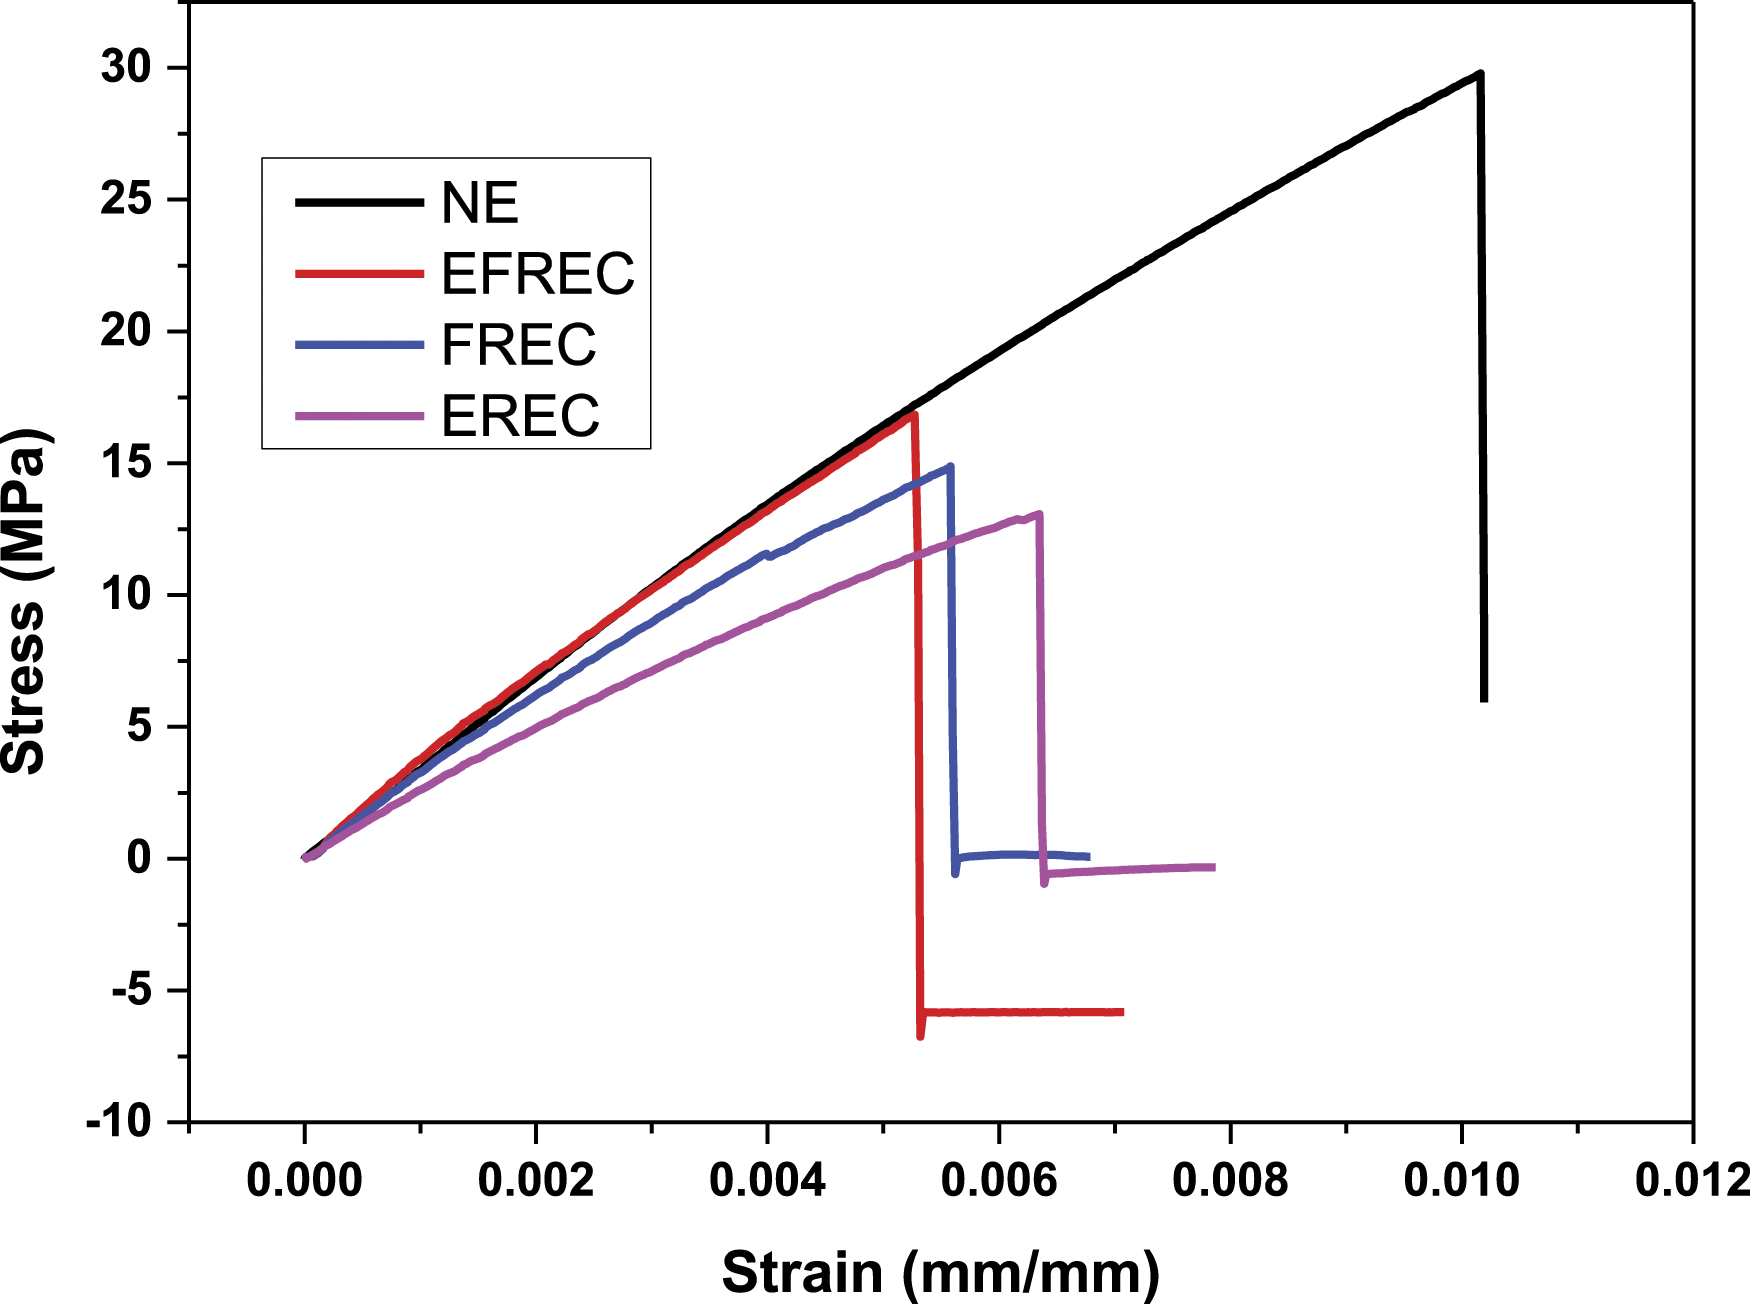
The tensile stress - strain curves of different filler (both eggshell and fish scale) reinforced epoxy composites were shown in Figure 4. As the fillers were included into the epoxy resin, the strain-at-break was dramatically reduced in comparison to the strain-at-break of NE. The addition of eggshell and fish scale particles to the epoxy matrix causes the composite materials to stiffen. 31 The inclusion of fillers in epoxy matrix results in composite materials with higher brittle characteristics than NE. This can be due to the agglomeration of filler elements in the epoxy matrix which may have resulted in the formation of composite materials with a lower elastic and a greater plastic region. 32
Flexural modulus and flexural strength of NE and filler reinforced epoxy composites are shown in Figure 5 and Figure 6 respectively. It can be observed from Figure 5, that the flexural modulus reduced substantially once the eggshell particles were introduced in the polymer matrix. This might have happened due to the improper dispersion of eggshell particles in the epoxy matrix.
33
Introduction of fish scales into the epoxy matrix also reduced the flexural modulus of developed composites in comparison to NE. But, there is an improvement of 33.69% in flexural modulus of FREC when compared to the EREC. The lower flexural modulus demonstrated by EREC compared to FREC might be attributed to poor bonding between the eggshell particles and the polymer matrix, which ultimately lowered the flexural modulus of the produced composites.
34
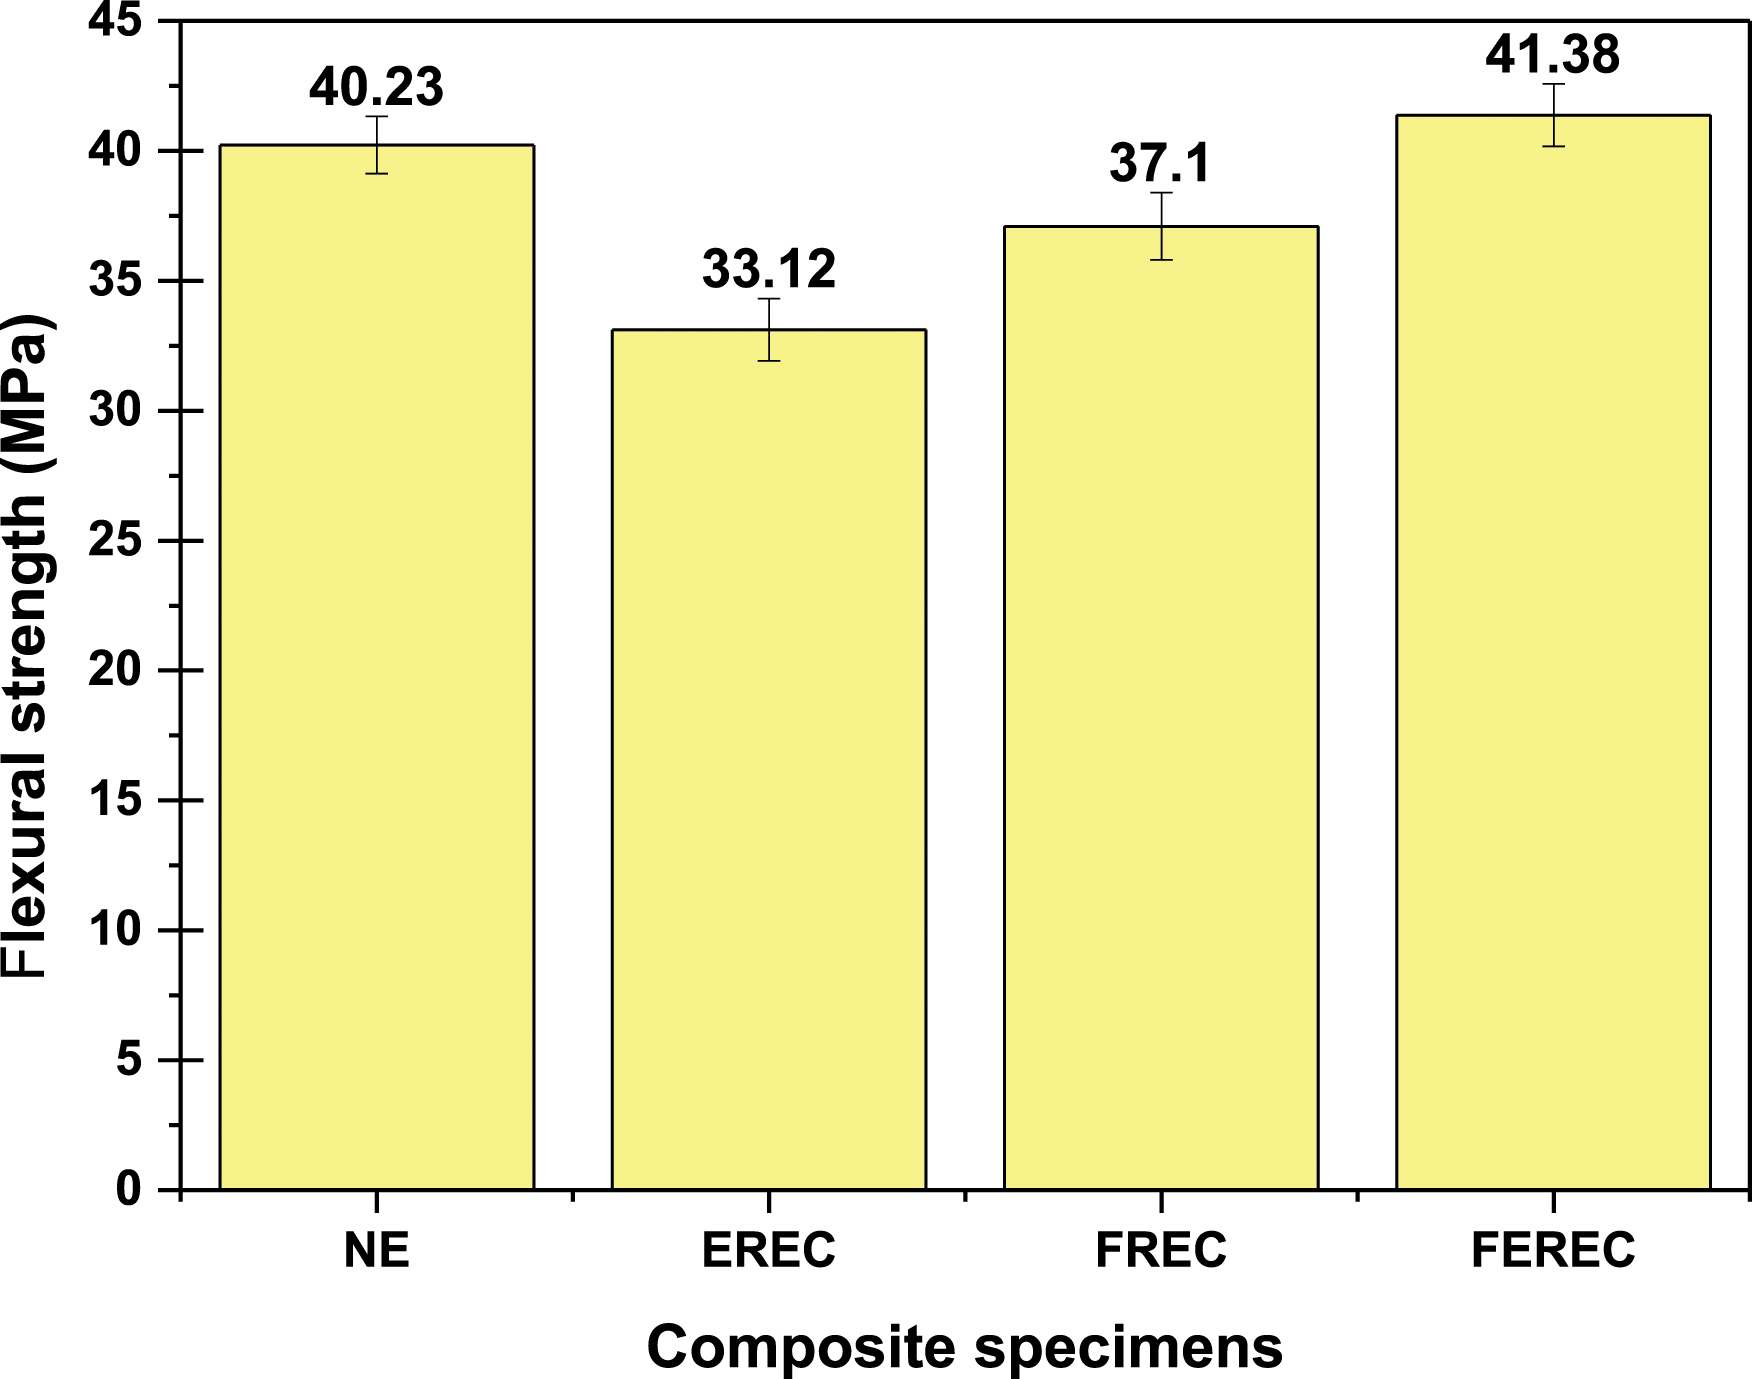
However, the flexural modulus of the hybrid composites developed by reinforcing both eggshell and fish scales found to be greater than all the flexural tested composites including NE. There is an improvement of 4.92%, 61.95% and 21.13% in flexural modulus of EFREC when compared to the flexural modulus of NE, EREC and FREC. This can be due to better dispersion of both eggshell and fish scale particles in the epoxy matrix and also due to the increase in crystallinity of the hybrid composite which may have increased the interfacial adhesion of the filler materials and the epoxy matrix.35,36 Also, for the NE and the developed composites, the flexural strength followed the same pattern as flexural modulus (Figure 6). In the case of FREC, there is an improvement of 12.02% in flexural strength over the EREC and reduction of 7.78% in flexural strength over the NE. Overall, the hybrid composites, i.e, EFREC exhibited better flexural strength among all the tested composites and NE. The eggshell particles in EREC have a greater tendency to agglomerate than the eggshell particles in EFREC, which increases the mobility of the polymer matrix and, as a result, reduces the overall stiffness of the composite.34,37 This may be the reason for better flexural properties of EFREC in comparison to other composites. Flexural modulus of NE, EREC, FREC and EFREC. Flexural strength of NE, EREC, FREC and EFREC.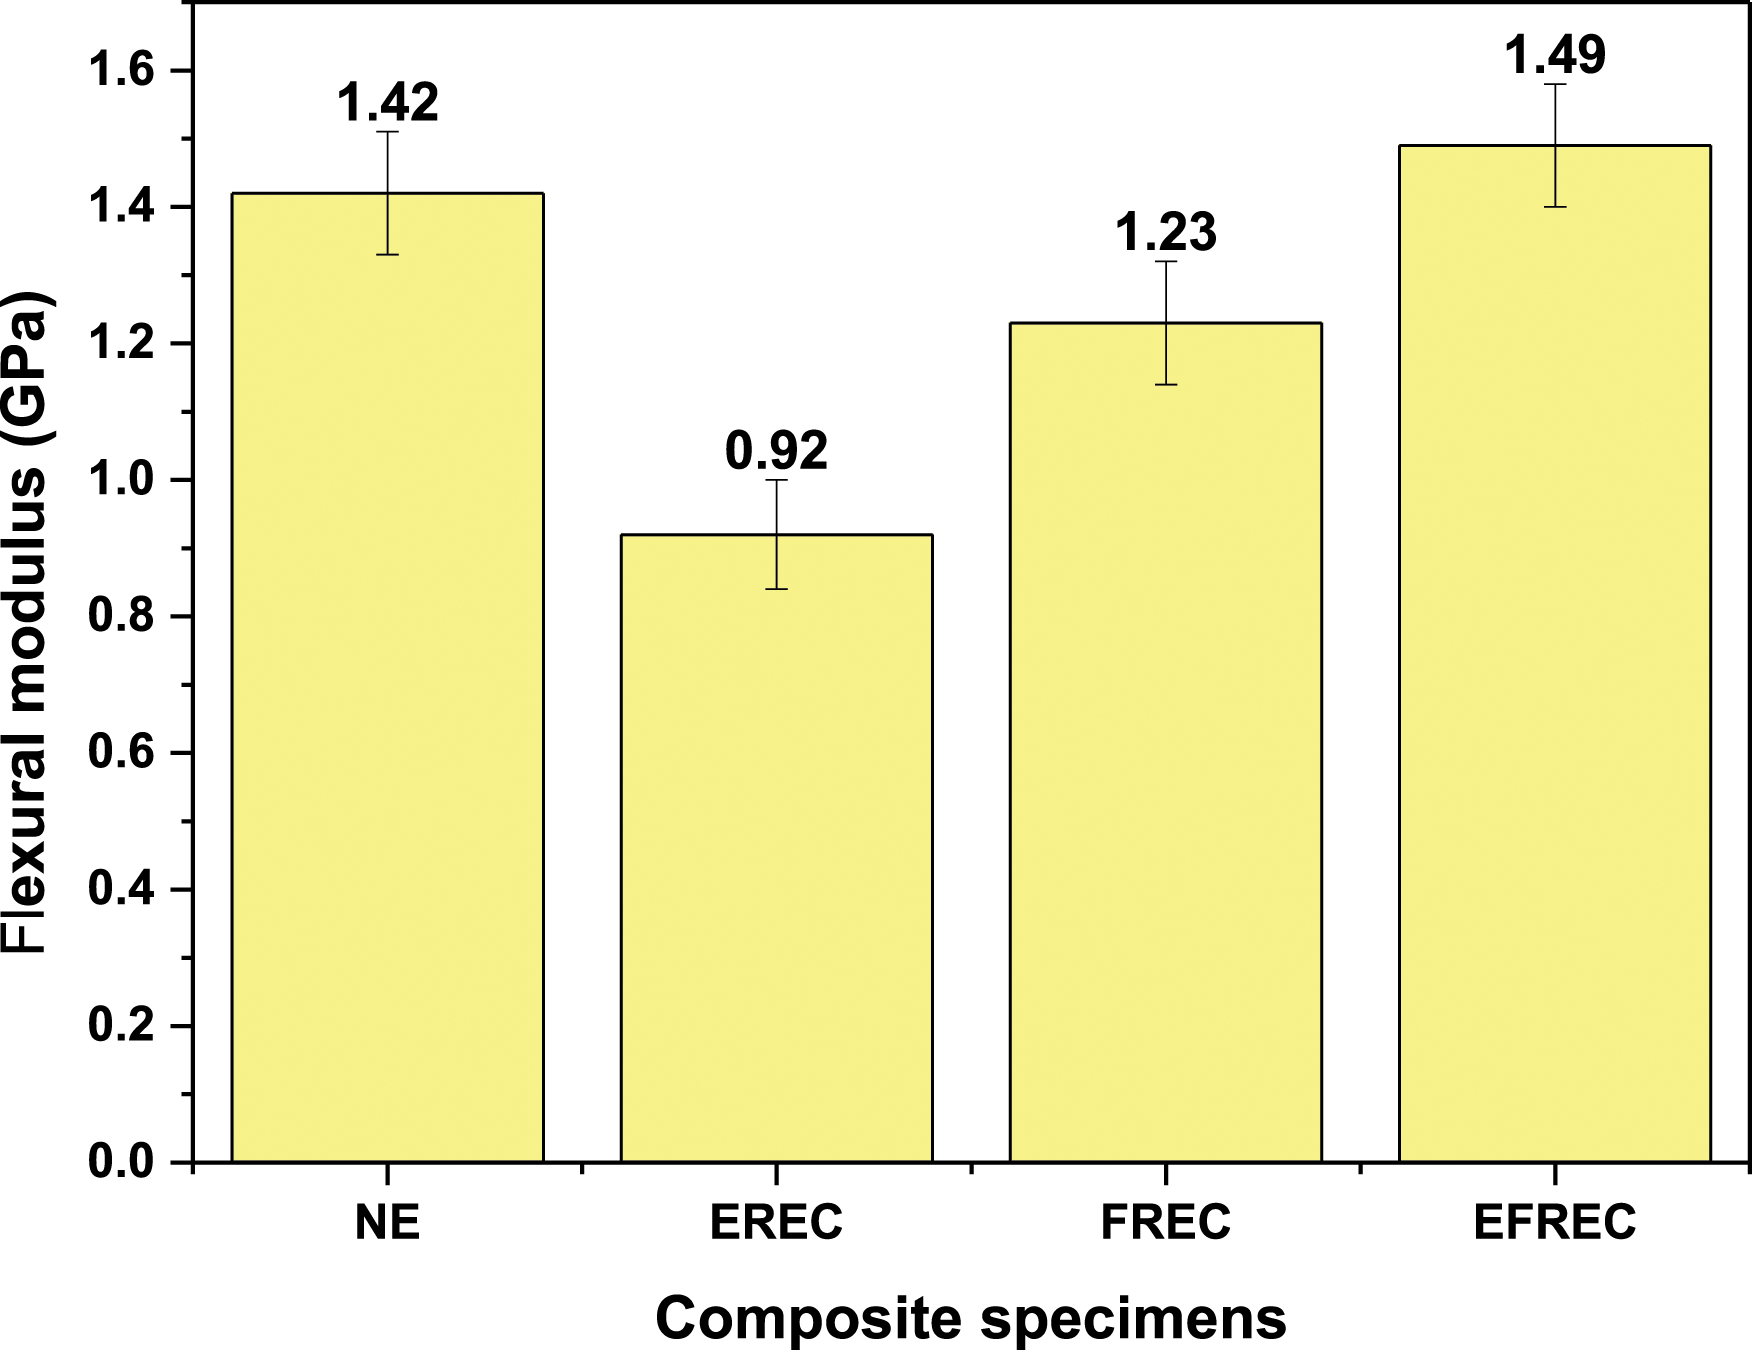
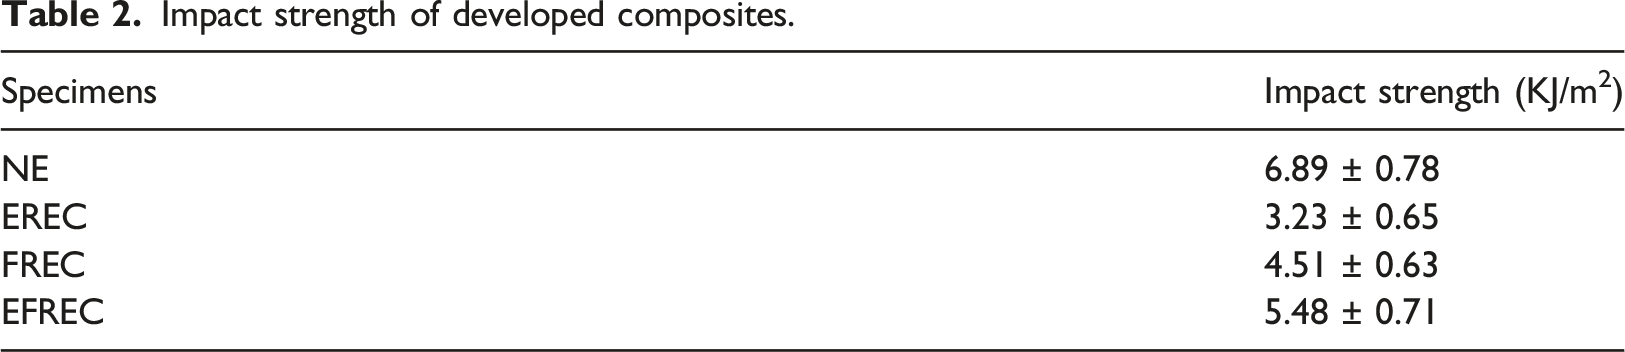
Impact strength of developed composites.
SEM analysis of tensile fracture surface
SEM micrographs of fracture surfaces of NE, EREC, FREC and EFREC were shown in Figure 7. As shown in Figure 7(b), eggshell particle agglomeration and microcracks were found on the fracture surface of EREC. Because of the greater quantity of shell particles, the agglomeration and microcracks might be caused by a lack of epoxy at grain interfaces.
22
In this scenario, the greater particle agglomeration cause stress concentrations, which reduces the bonding between the eggshell particles and matrix, resulting in crack propagation and a reduction in strength. The fracture surfaces of FREC and EFREC showed a tight compact structure with reasonably smooth plateaus in Figures 7(c),(d). This suggests that the incorporation of fish scales particles and combination of both fish scale and eggshell particles into the epoxy matrix at the initial stage may have introduced an incused crack arresting and holding mechanism into the matrix, which acted as a crack propagation barrier, resulting in enhancement in strength, fracture toughness, and lower water absorption rate. SEM images of tensile fractured surfaces (a) NE (b) EREC (c) FREC and (d) EFREC.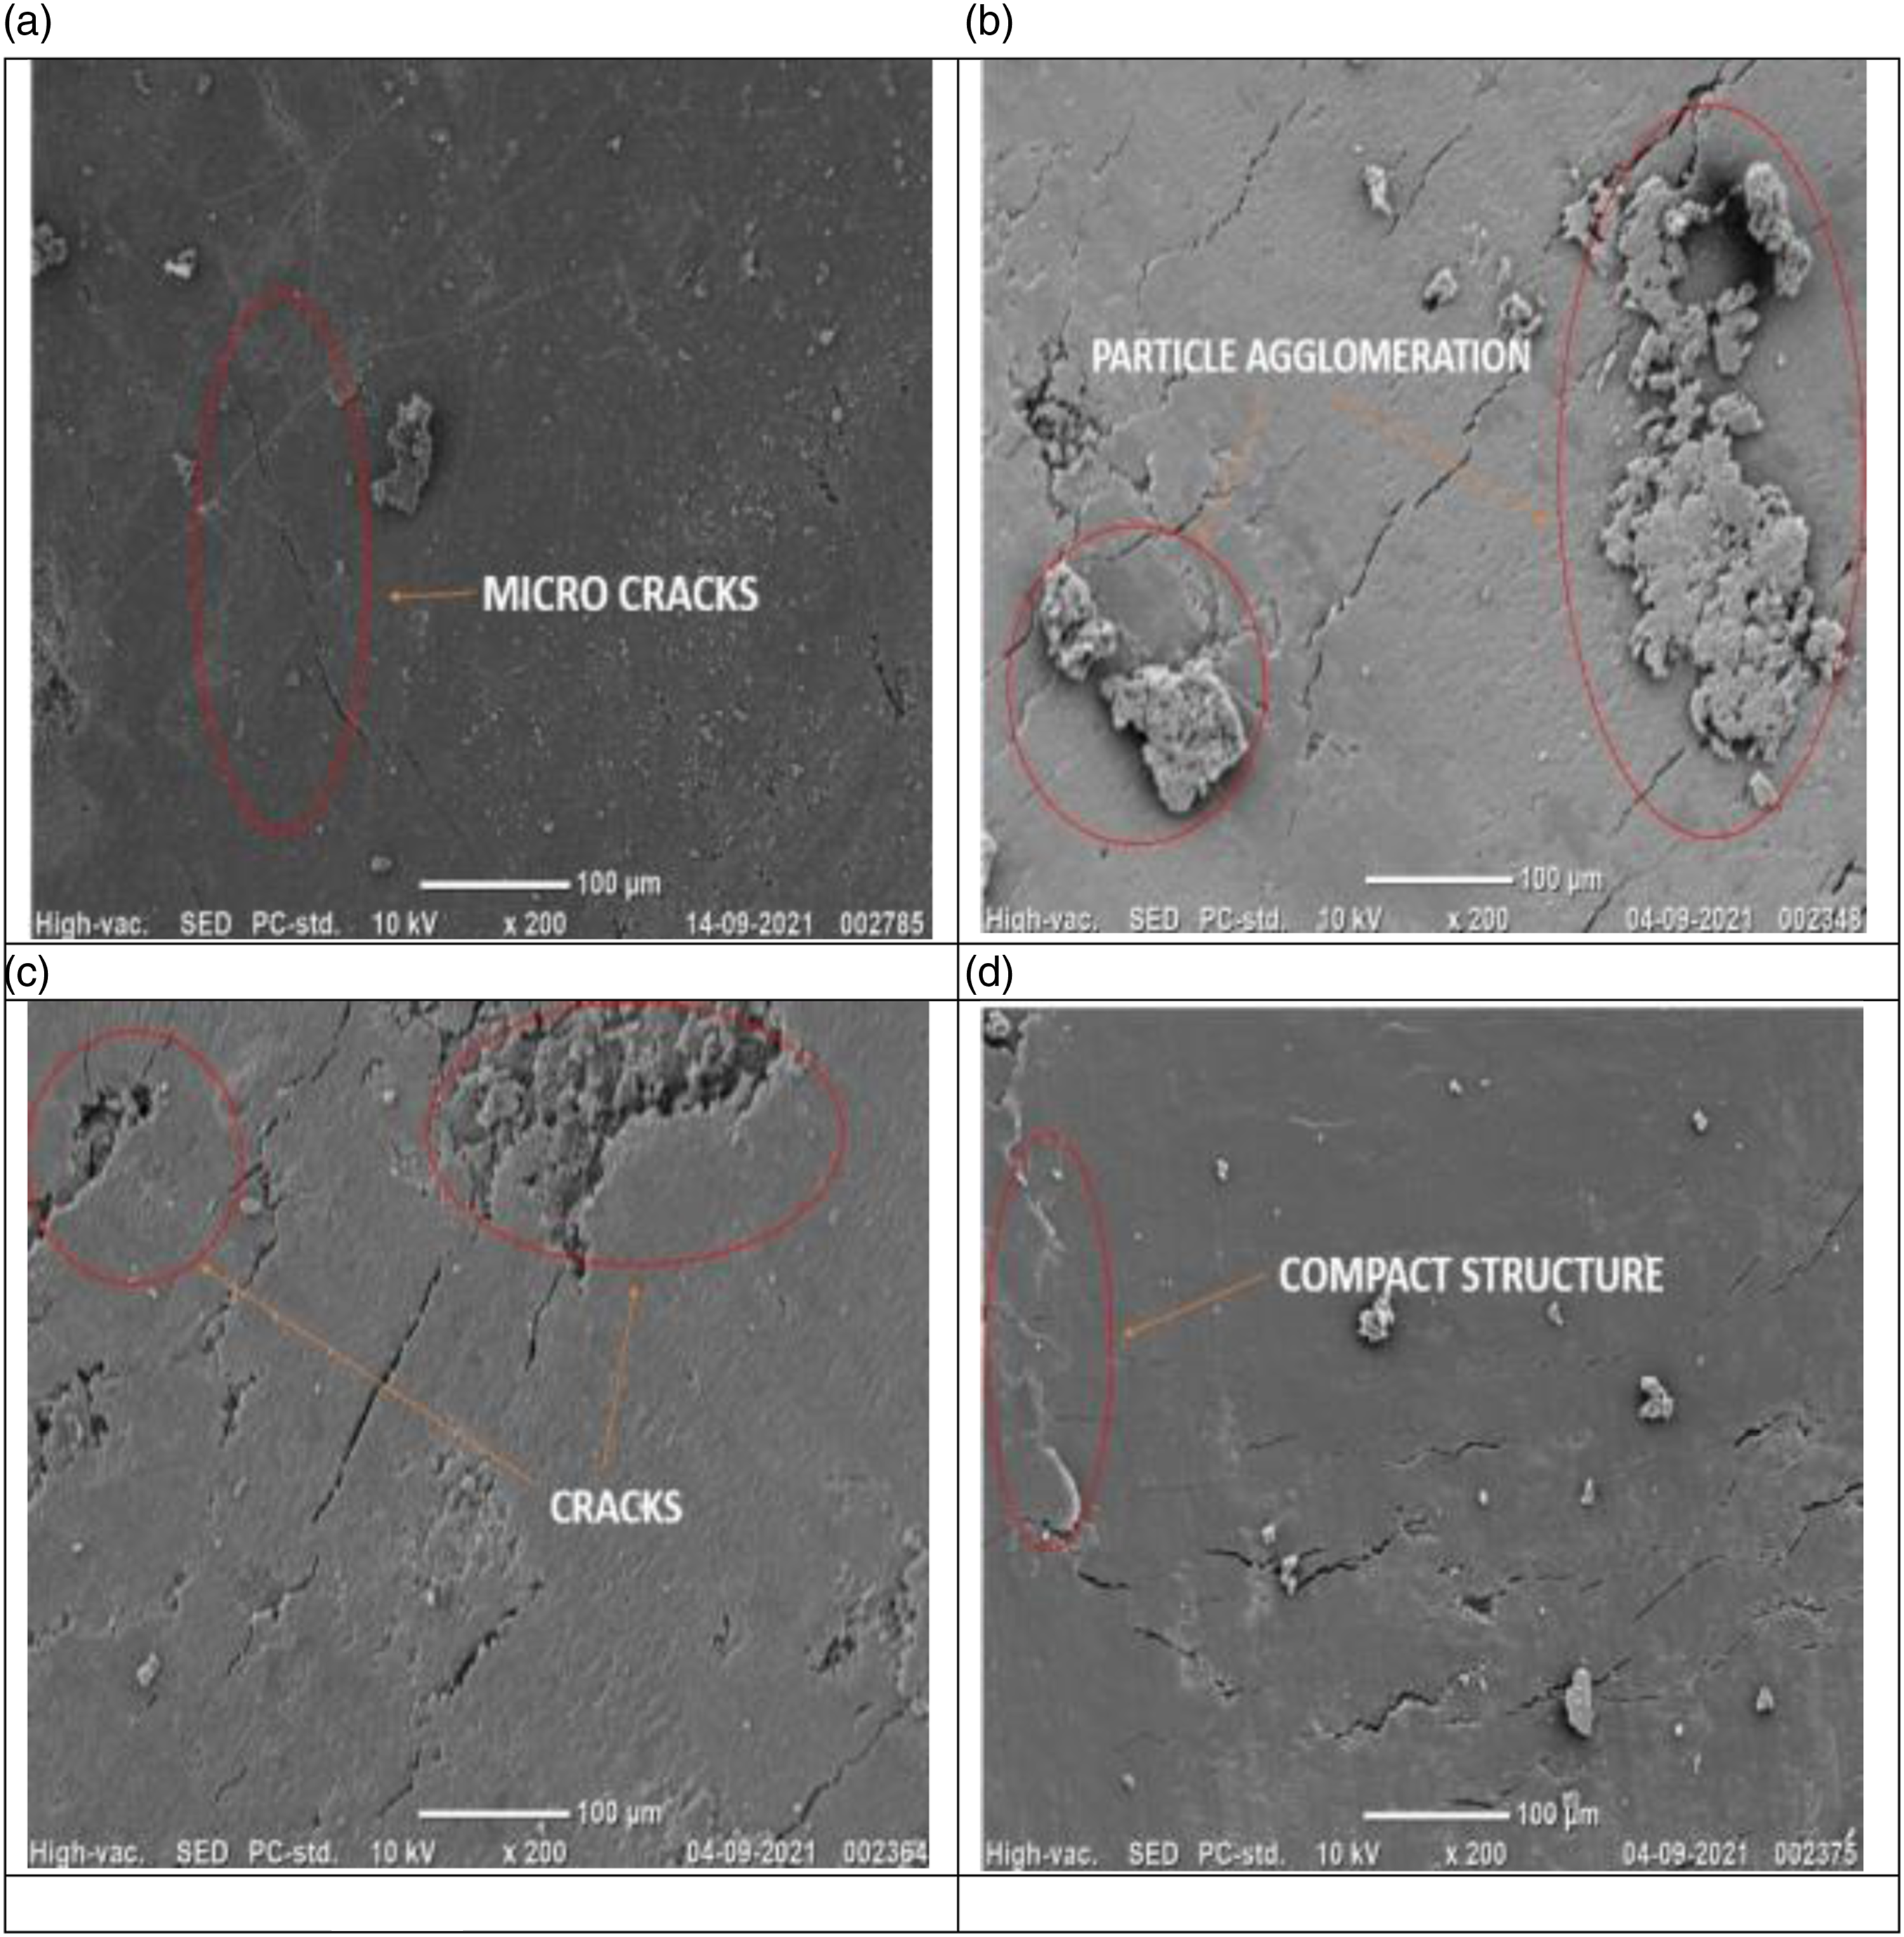
Tribological properties
Effect of applied load on weight loss
The effect of applied load (10 N, 15 N, 20 N and 25 N at constant sliding speed 0.5 m/s and constant sliding distance 500 m) on the weight loss of NE and the filler reinforced composites were shown in Figure 8. When it came to the effect of applied normal load, it was discovered that as the applied normal load increased, the weight loss increased as well. This could be owing to the considerable heat developed at the interface, which causes the epoxy matrix to degrade. As a result, the filler particles were easier to extract and draw out, resulting in more material removal from the composites and the NE.39,40 Among all the wear tested samples, the NE exhibited the maximum weight loss at all loads (Figure 8). This could be due to the absence of filler particles resulting in little or no resistance offered by the soft epoxy against the steel ball. However, the introduction of eggshell and fish scales in the epoxy considerably reduced the weight loss of the developed composites. This may be due to the resistance offered by the filler particles against the steel ball. Among all the composite specimens, the EFREC exhibited the best wear resistance, followed by FREC and EREC. This may be because of better dispersion of egg shell particles in EFREC than in EREC also due to the lesser agglomeration of fish scales in the epoxy matrix which may have contributed to better filler-matrix bonding resulting in lesser material removal of EFREC and FREC than the EREC. Weight loss versus Applied load for NE, EREC, FREC and EFREC.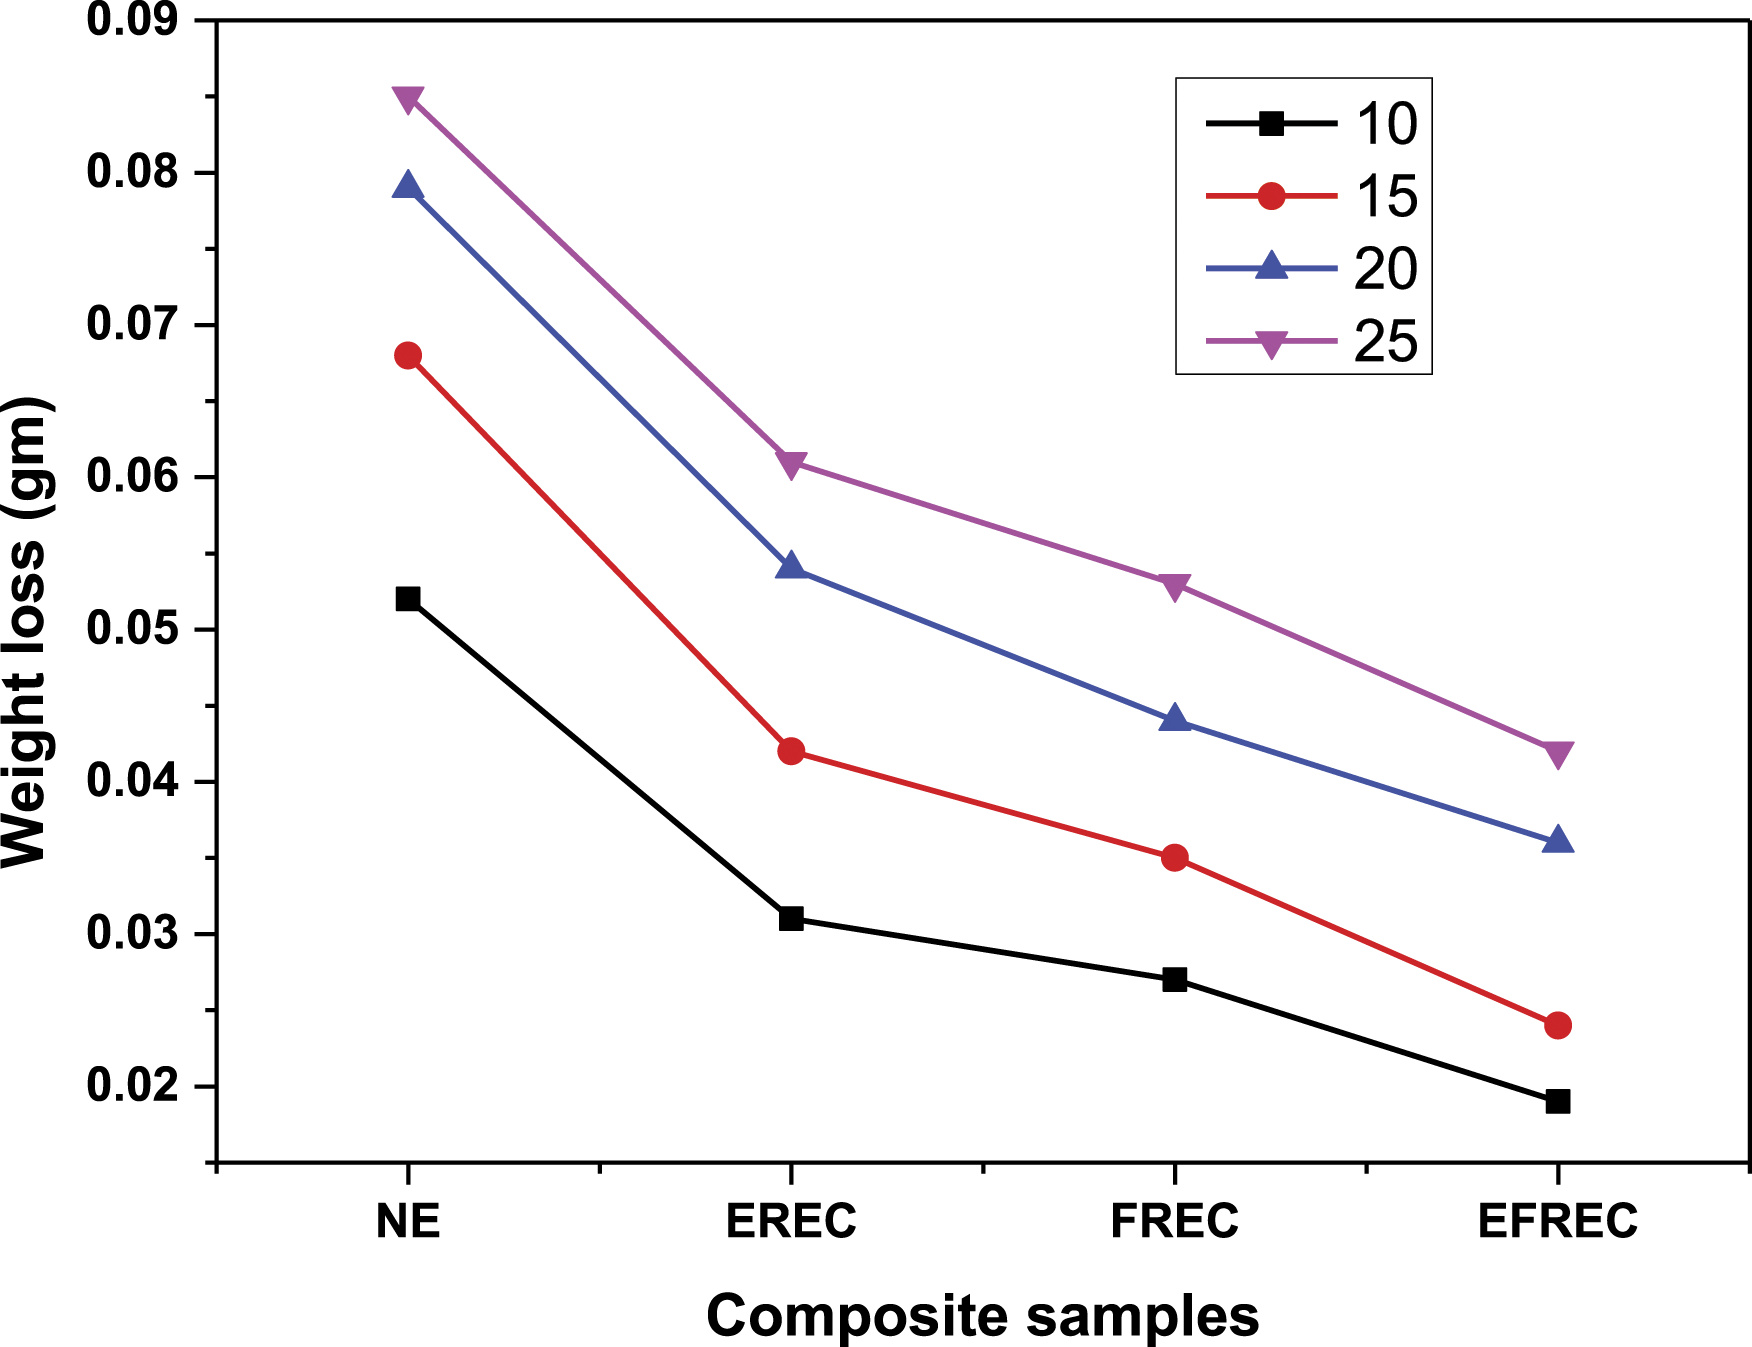
Effect of sliding distance on weight loss
The effect of sliding distance (500 m, 1,000 m, 1,500 m and 2,000 m at constant speed 0.5 m/s and constant applied load 15 N) on the weight loss of NE and filler reinforced composites were shown in Figure 9. The weight loss of NE and all the filler reinforced composite specimens rose with increasing sliding distance, which was attributable to progressive material removal with distance, as seen in the Figure 9. The temperature of the contact zone rose with increasing sliding distance during abrasion, which might weaken the bonding and result in greater material loss at longer sliding distances.
41
As in the case with applied load, NE exhibited the maximum weight loss at all sliding distance among all the wear tested samples. This might be owing to the lack of filler particles, resulting in the polymer matrix offering little resistance to the steel ball. However, all the filler reinforced epoxy composites showed better wear resistance in comparison to NE. This might be due to the filler particles in the epoxy matrix providing resistance to the steel ball resulting in reduced material loss. The EFREC has the best wear resistance of all the composite specimens, followed by FREC and EREC. This might be attributed to more uniform egg shell particle dispersion in EFREC than in EREC, as well as reduced agglomeration of fish scales in the epoxy matrix, which could have led to improved filler-matrix bonding and therefore less material loss in EFREC and FREC than in EREC at different sliding speed. Weight loss versus Sliding distance for NE, EREC, FREC and EFREC.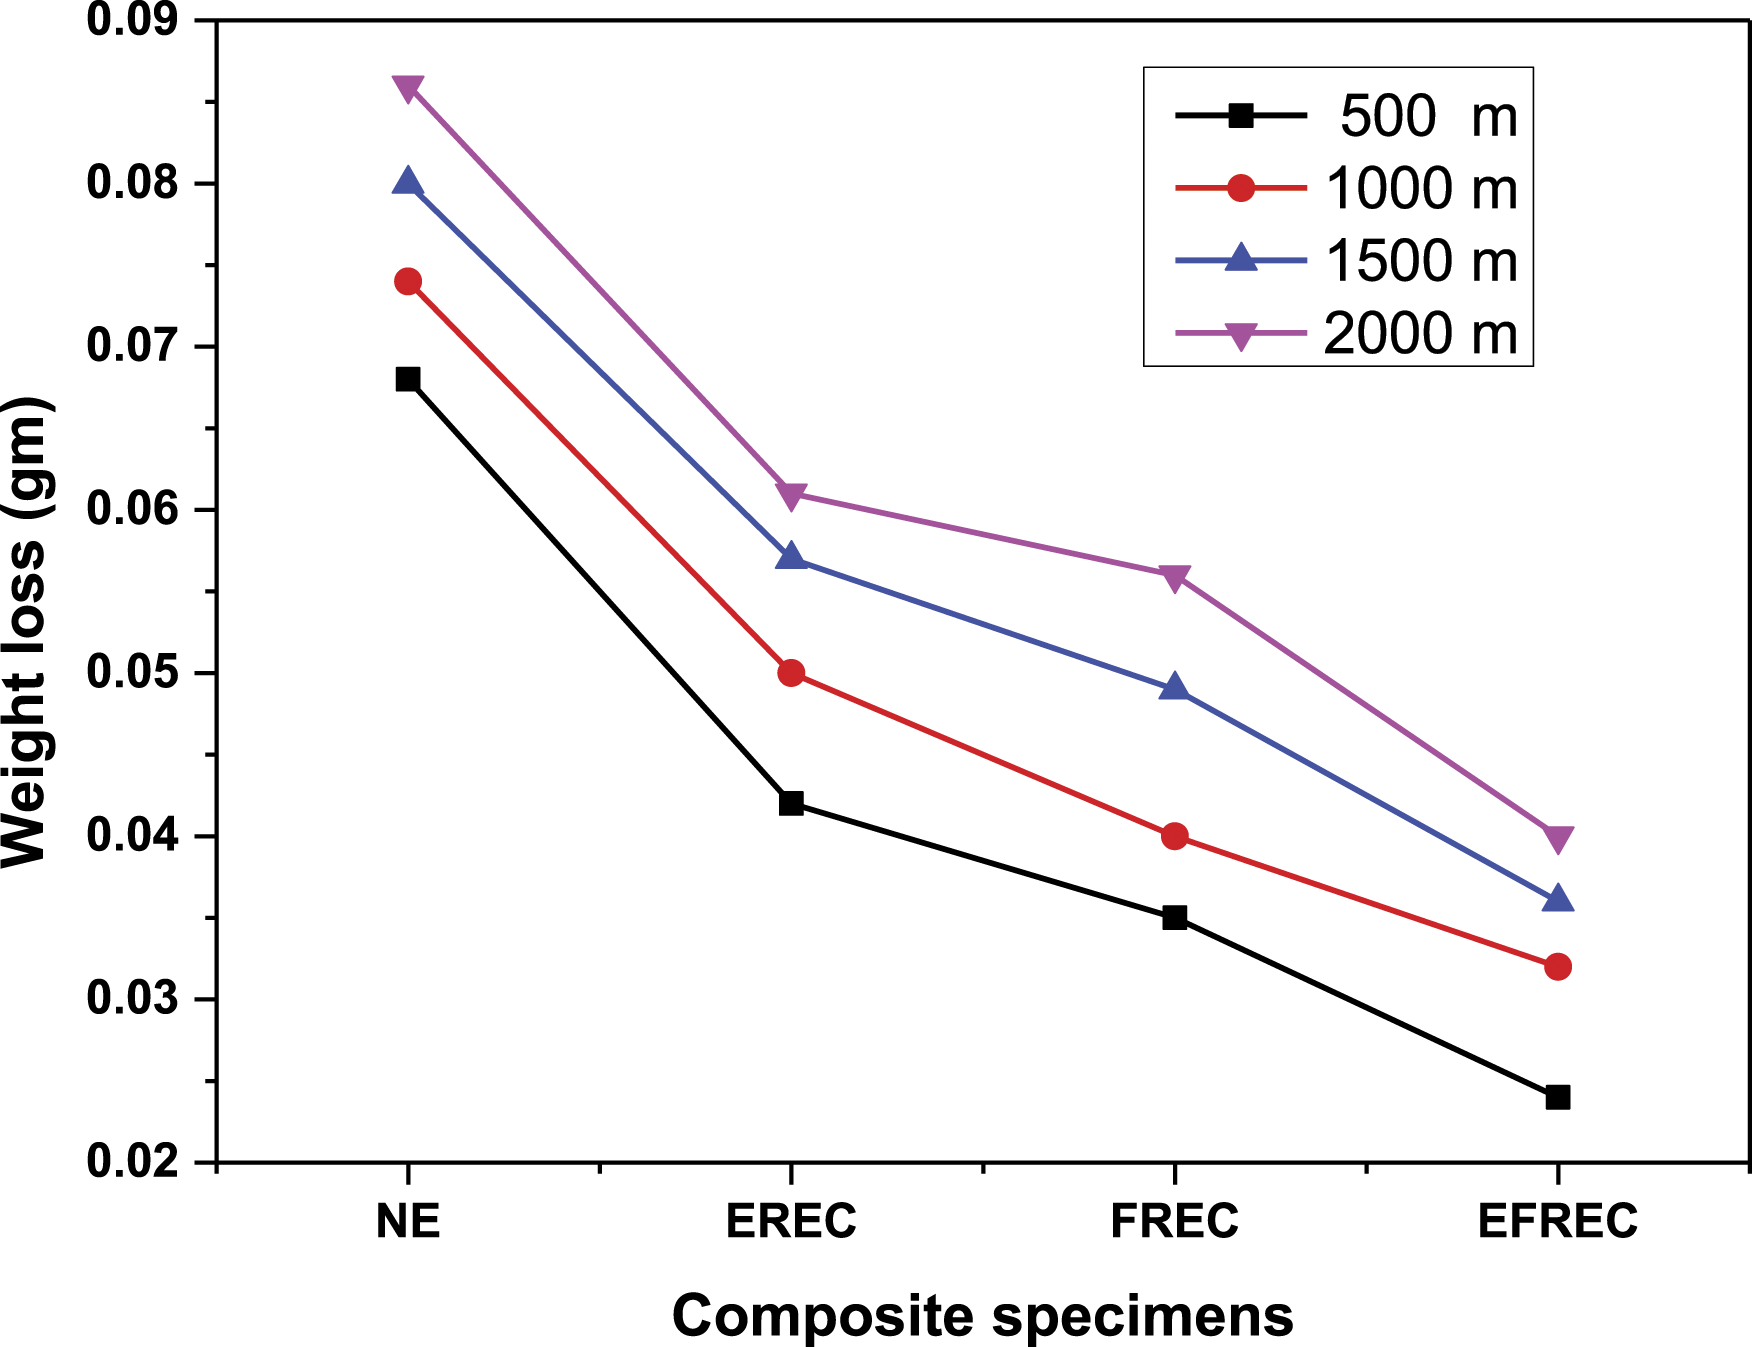
Effect of sliding speed on weight loss
The effect of sliding speed (0.5 m/s, 1 m/s, 1.5 m/s and 2 m/s at constant sliding distance 500 m and constant applied load 15 N) on the weight loss of NE and filler reinforced epoxy composites are shown in Figure 10. The weight loss of all wear tested specimens accelerated as the sliding speed increased (Figure 10). This was due to the fact that the time of rubbing stayed constant for each sliding velocity, even if the degree of rubbing and friction increased as the speed increased.42,43 As the sliding velocity rose, so did the generation of frictional heat, which weakened the epoxy’s mechanical characteristics and reduced the polymer’s wear performance.44,45 As in the case with applied load and sliding distance, the NE showed maximum weight loss among all the tested samples at all sliding distance. This may be due to the absence of any filler particles within the epoxy. However, in comparison to NE, all the filler reinforced epoxy composites exhibited enhanced wear resistance. Filler reinforcement, in general, serves to reduce the area of contact between the polymer matrix and the steel ball.46,47 This may be the possible reason for better wear resistance of filler reinforced composites.
48
Among all the wear tested composite samples at different sliding speed, EFREC shown the best wear performance followed by FREC and EREC. The hybrid composite (EFREC) developed might have the proper amount of eggshell and fish scale in the epoxy matrix which may contributed to more uniform dispersion of these filler particles in the epoxy matrix than EREC and FREC. This might explain why EFREC outperforms all other developed composites in terms of wear resistance. Weight loss versus sliding velocity for NE, EREC, FREC and EFREC.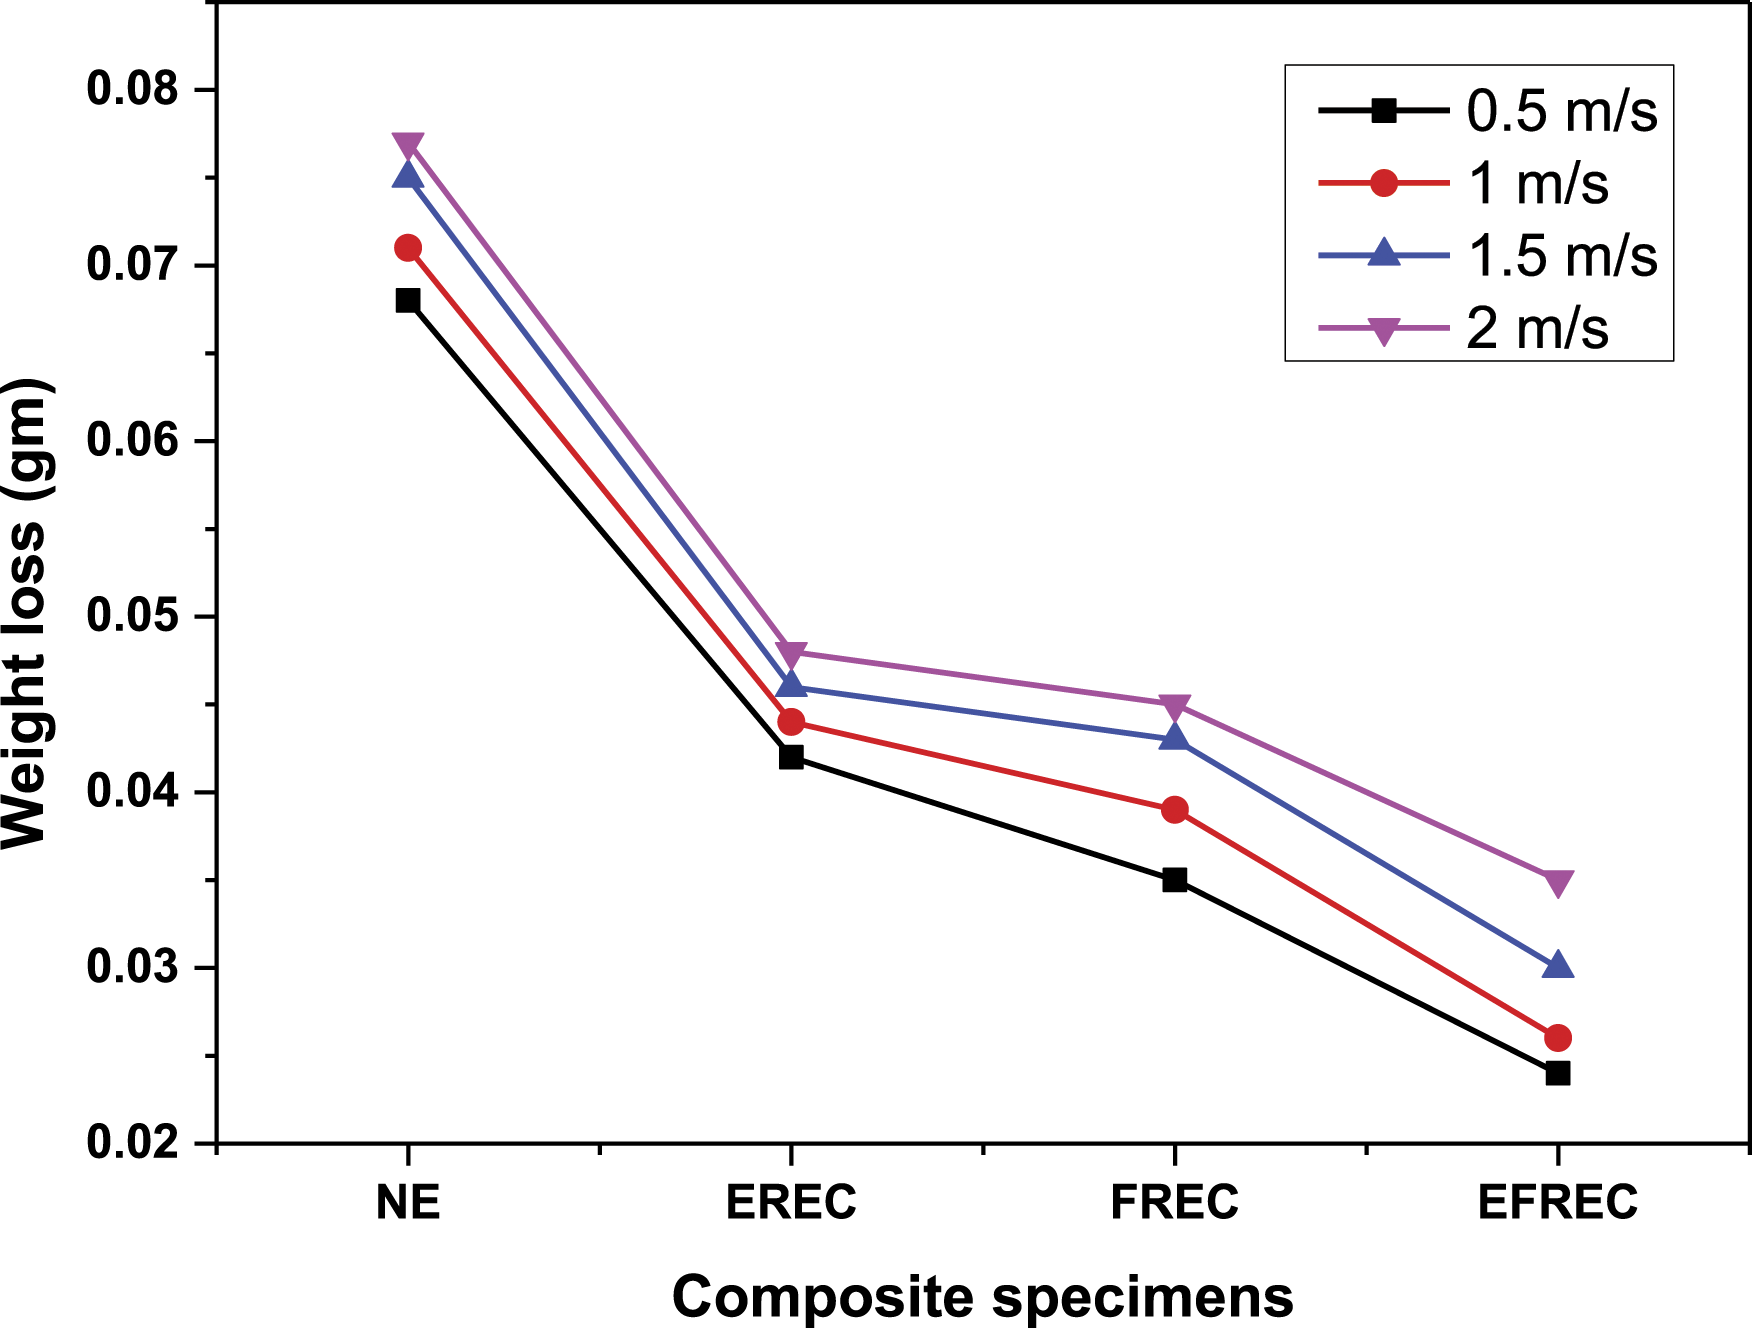
SEM analysis of wear surface
SEM images of wear surface of NE, EREC, FREC and EFREC were shown in Figure 11. Under the dry sliding circumstances, the wear surface of NE suffered substantial damage, as seen in Figure 11(a). Such excessive weight loss may have happened due to the absence of any filler materials in the epoxy which may have offered resistance against the counter surface. Several deep groves can also be observed on the wear surface of EREC (Figure 11(a)). This can be due to the disconnection or improper bonding between the filler materials and the matrix. The SEM images of wear surfaces of FREC and EFREC in Figures 11(c),(d) shows the development of a friction film between two contact surfaces, which results in fewer matrix fractures and enhanced tribological characteristics in terms of reduced wear.49,50 This validate the better wear performance of FREC and EFREC in comparison to NE and EREC. SEM images of wear surfaces of the composites at 15 N applied load, 0.5 m/s sliding speed and 2,000 m sliding distance: (a) NE (b) EREC (c) FREC and (d) EFREC.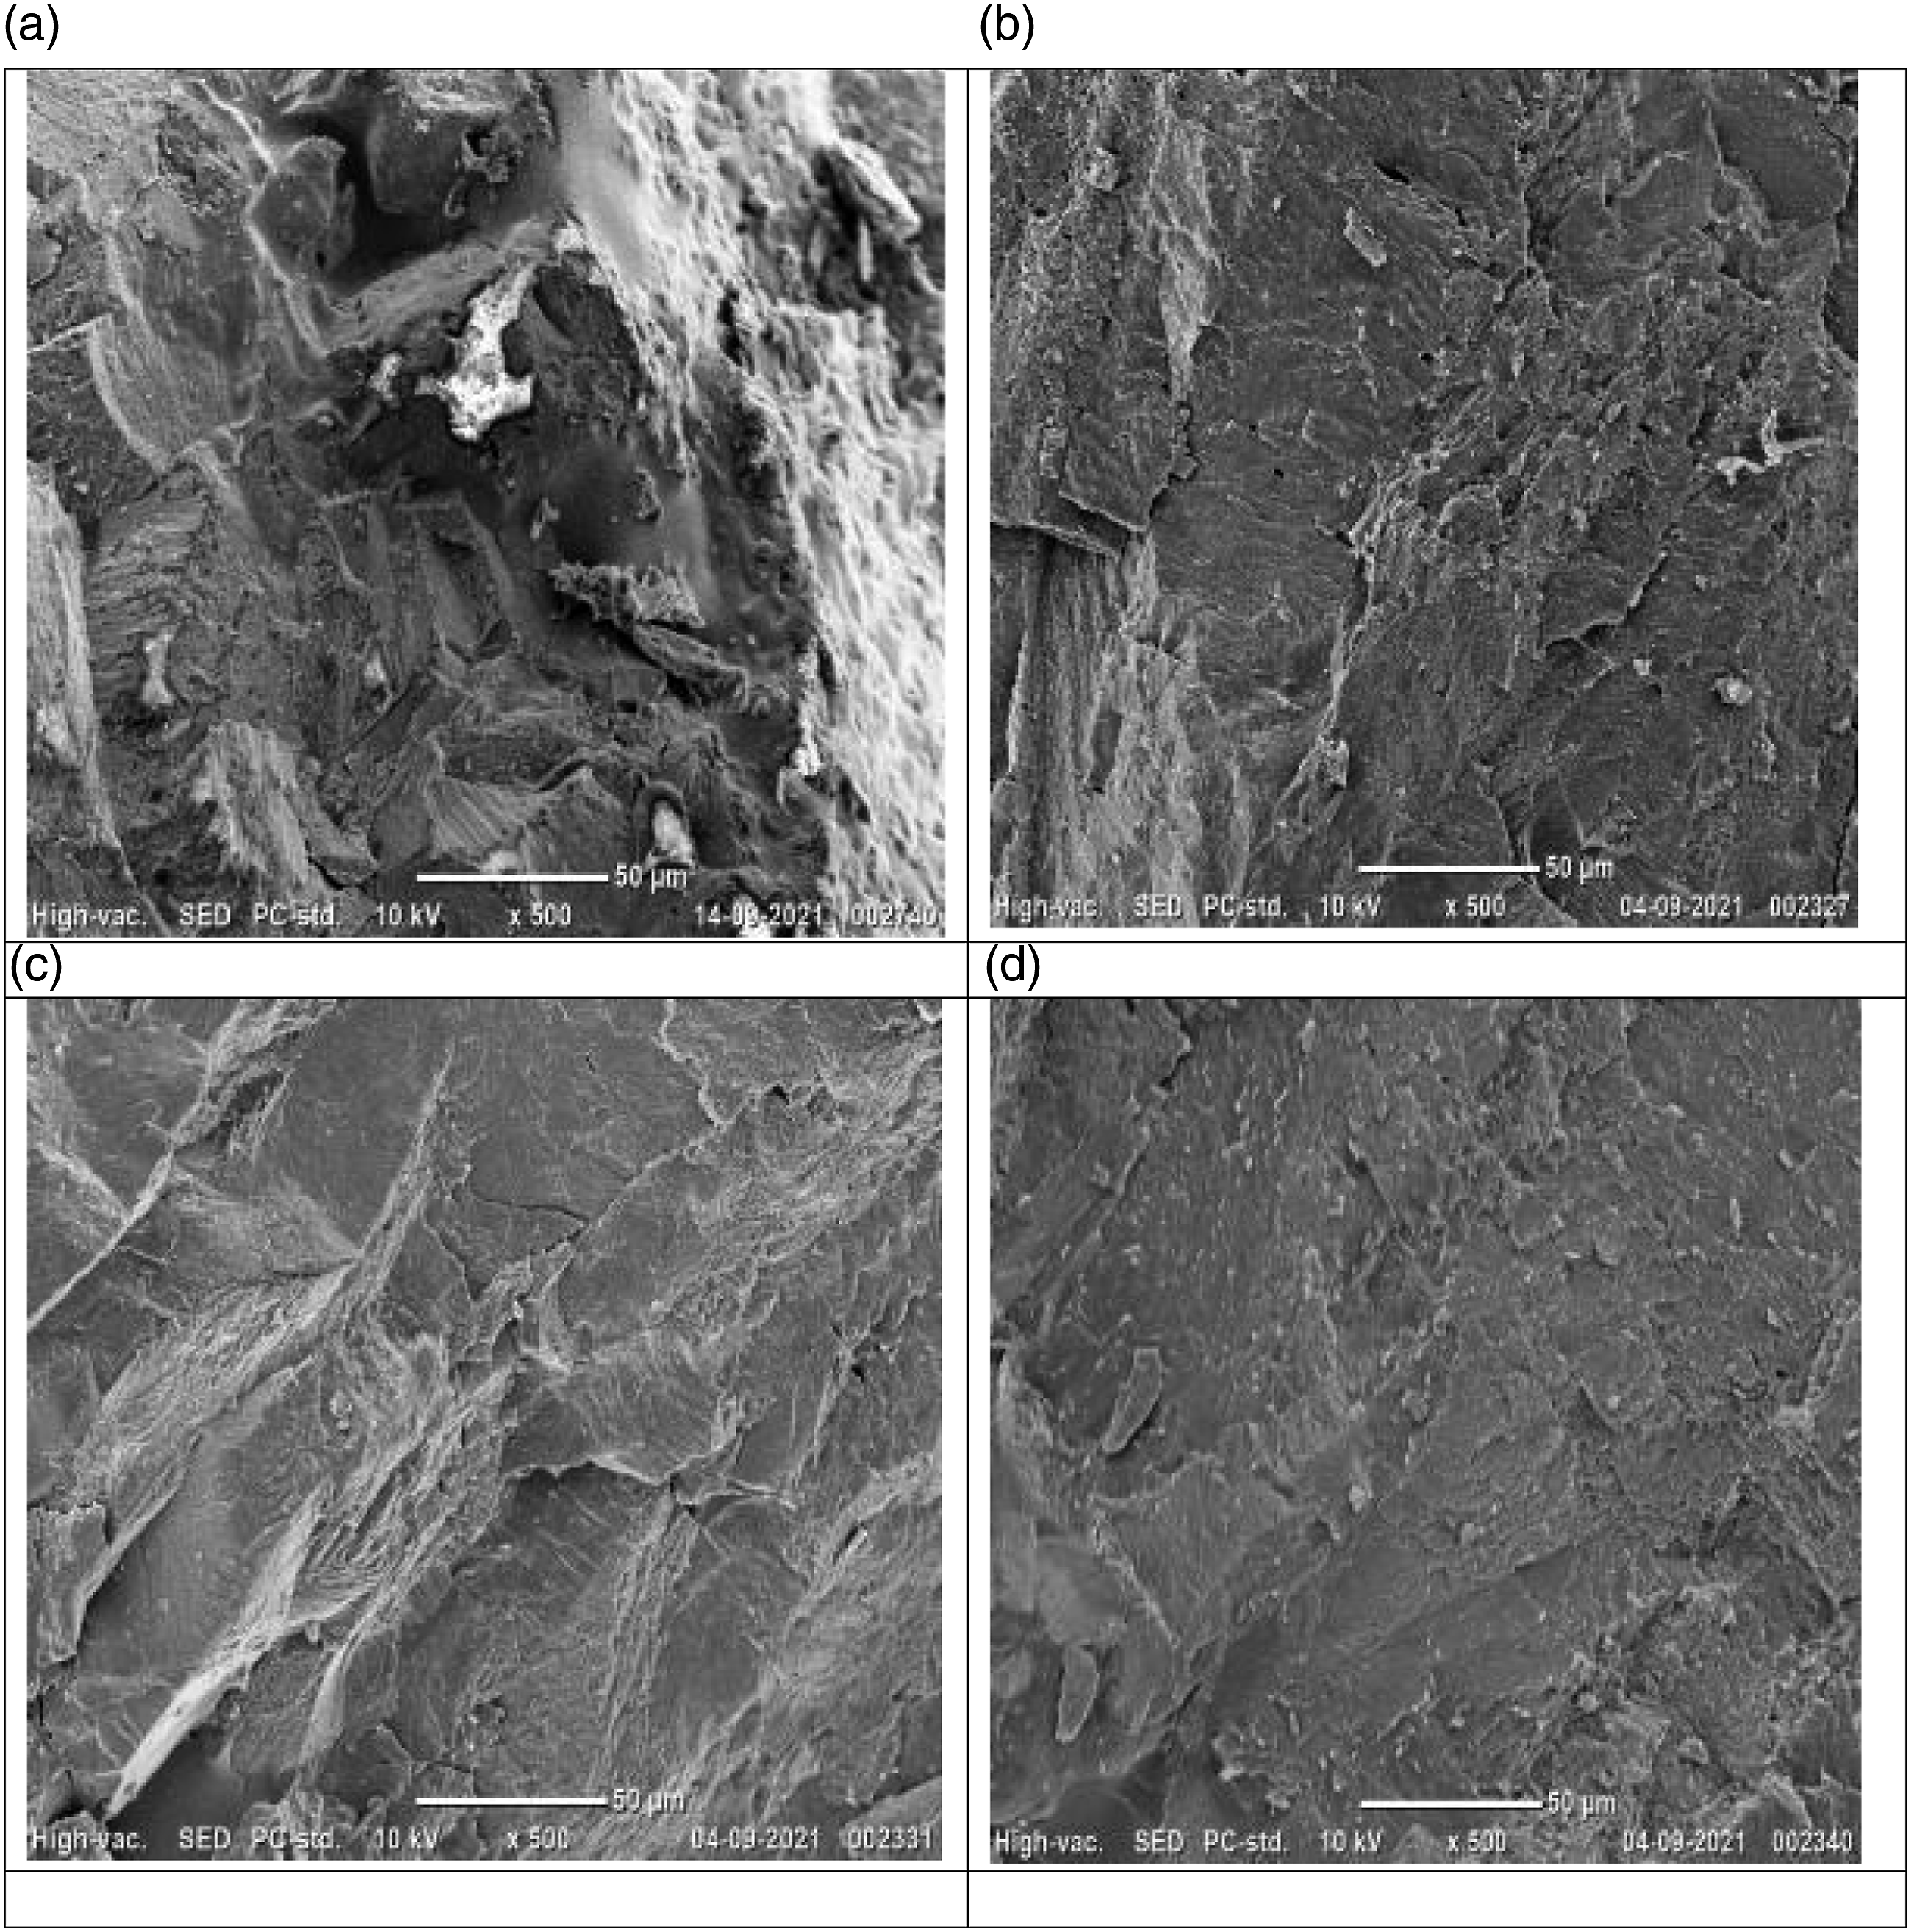
Conclusion
Eggshell, fish scales and combination of both eggshell and fish scales were mixed with the epoxy to develop bio-composites. The water absorption, mechanical, tribological, and morphological characteristics of the samples were all measured. Based on the experimental results the following conclusions can be drawn: 1. The best resistance to water absorption was shown by the hybrid composite (EFREC) followed by FREC, EREC and NE. 2. EFREC exhibited significant improvement in tensile, flexural and impact properties when compared to FREC and EREC. All the developed composites have superior tensile modulus in comparison to NE. However, all the developed composites have poor tensile and impact strength in comparison to NE. Also, EFREC showed maximum improvement in flexural strength and modulus when compared to EREC, FREC and NE. 3. All the filler reinforced epoxy composites exhibited superior wear resistance when compared to NE. Among all the developed composites, EFREC exhibited best mechanical and wear resistance properties followed by FREC and EREC. This was also confirmed by the SEM images of fracture and wear surfaces of the composites.
Footnotes
Declaration of Conflicting Interests
The author(s) declared no potential conflicts of interest with respect to the research, authorship, and/or publication of this article.
Funding
The author(s) received no financial support for the research, authorship, and/or publication of this article.
Data availability statement
The raw/processed data required to reproduce these findings cannot be shared at this time as the data also forms part of an ongoing research work.
Availability of data and material
Due to the nature of this research, participants of this study did not agree for their data to be shared publicly, so supporting data is not available.
Consent for publication
The authors hereby consents to publication of the present research work in this journal, if selected for publication.