
Abstract
Laser engraving / chemical milling is a hybrid manufacturing technology which is suitable for the fabrication of the key components in aerospace industries. Here, we originally proposed a molecular dynamics model to study the chemical reactions and corrosion mechanism between TA15 titanium alloy and the mixed HF-HNO3 solution. Then, experiments on corrosions are carried out to optimise the mixing ratio of the mixed HF-HNO3 solution. Results indicate that the corrosion mechanism in chemical milling is governed by HF-induced activation-driven dissolution and HNO3-mediated oxidation-induced passivation. The increase of HF ratio in the mixed solution can lead to higher surface roughness and hydrogen absorption. The increase of HNO3 ratio in the mixed solution can lead to lower corrosion rates. A formulation is obtained to reveal the relationship between corrosion rate and concentration of HF and HNO3. By consideration of the corrosion rate, surface roughness and hydrogen embrittlement risk, the optimal mixed ratio is 8% HF concentration and 14% HNO3 concentration with corrosion rate of 3.405 g·m−2·s−1. The proposed model and the summarised formulation can provide theoretical basis and practical process parameters for chemical milling and surface treatment of TA15 titanium alloy.
Introduction
Chemical milling has emerged as a critical manufacturing technology in aerospace and military sectors for processing thin-walled, complex-shaped or large-area titanium alloy components, as it eliminates tool-induced stresses and deformation, ensuring structural integrity.1,2 This non-contact method employs controlled chemical dissolution, typically using acidic solutions containing hydrofluoric and nitric acids with specific additives, to selectively remove material without mechanical force. Titanium alloys exhibit a combination of highly desirable properties, including low-density, high-specific strength, excellent thermal strength, strong corrosion resistance, superior low-temperature performance and good processability. These advantages enable their widespread applications in aviation, aerospace, petroleum, chemical, marine and medical industries.3–7 However, titanium alloys exhibit high deformation resistance and susceptibility to fracture during cold machining, making chemical milling a preferred process for material removal and complex-shaped workpieces. Owing to its unique advantages in weight reduction and complex structure formation, chemical milling has become an indispensable technology in aerospace and military manufacturing.8,9
The corrosion dissolution rate during chemical milling of titanium alloys is highly dependent on the composition, proportions and formulation of the chemical milling solution. Precise control of these parameters enables stable and uniform material removal rates. However, in actual production, ideal chemical milling conditions are difficult to sustain. Instability in mixed acid ratios can cause fluctuations in corrosion rates or trigger hydrogen embrittlement risks induced by hydrogen absorption. Therefore, deepening the understanding of the corrosion dissolution mechanism in titanium alloy chemical milling is crucial for achieving precise control of the corrosion process. 10
Regarding the corrosion dissolution of titanium alloys, numerous scholars have conducted extensive research. These studies encompass the corrosion behaviour of titanium alloys in various acidic media, including nitric acid, 11 sulphuric acid, 12 hydrochloric acid, 13 hydrofluoric acid 14 and multiple organic acid systems.15–17 Li et al. 18 revealed the corrosion behaviour of pure titanium in H₂SO₄, HCl and HNO3 solutions containing varying concentrations of F−. Their findings revealed that pure titanium exhibited the most severe corrosion in fluoride-containing HNO3. Wang et al. 19 studied the corrosion behaviour of pure titanium in a 0.05 M H₂SO₄ solution containing fluoride ions. They observed that titanium spontaneously passivated in solutions containing 0.0005 M and 0 M fluoride ions, the latter of which accelerated corrosion. Wei et al. 20 investigated the corrosion and passivation behaviour of Ti-3Mo titanium alloy in 20 wt% hydrochloric acid solutions at different annealing temperatures. Results indicated that the corrosion rate increased with rising annealing temperature. Chen et al. 21 investigated the difference in repassivation rates of titanium in 3.5 wt% NaCl and 6 M HNO3. Findings revealed that titanium exhibited poorer corrosion resistance in 6 M HNO3 compared to 3.5 wt% NaCl. Wu et al. 22 investigated the electrochemical behaviour and passivation film properties of selective laser-melted and forged TA15 alloy in H₂SO₄ solutions. The study indicated that the passivation film formed on the SLM TA15 alloy surface effectively protected the alloy, enhancing its corrosion resistance in H₂SO₄ solutions. Liu's team 23 investigated the influence of Zn2+ on Ti corrosion behaviour in H₂SO₄ and F− solutions. Mass loss results demonstrated that the presence of Zn2+ in corrosive solutions accelerated Ti corrosion.
Experimental studies are crucial for validating corrosion mechanisms, but corrosion processes in real engineering environments often occur over extended time scales, posing significant challenges for direct observation. Therefore, computer-based simulation techniques hold substantial value for investigating corrosion mechanisms. In recent years, researchers have employed molecular dynamics simulations24–26 to explore metal corrosion mechanisms at the microscopic scale.27–30 Chen et al. 31 revealed the degradation behaviour of Fe₂O3 passivation films in hydrochloric acid solutions at the atomic scale, discovering that residual stresses and partial relaxation of deformation during corrosion contribute to reduced corrosion rates. Balasooriya et al. 32 analysed defect-driven corrosion mechanisms on steel surfaces, investigating the formation of protective layers versus reactive oxide layers under varying oxygen coverage. Chen et al. 33 elucidated the atomic mechanism of Cl−-induced Cu₂O corrosion using machine learning potential functions, indicating extensive chemical adsorption of Cl− on the Cu₂O(111) plane, which significantly reduces the dissolution energy barrier for lattice copper. Zr-based amorphous coatings were prepared on TA2 substrates via plasma spraying by Jin et al. 34 It was found that the increased diffusion coefficient of oxygen atoms in the ZrO₂ passivation film, compared to its TiO₂ counterpart, resulted in enhanced corrosion resistance over the TA2 substrate. Furthermore, numerous researchers have validated the corrosion inhibition effects of several metallic inhibitors using molecular dynamics simulations, including nicotinic acid hydrazide-grafted chitosan, 35 phosphate derivative K₂SrP₂O₇, 36 phytic acid, 37 water and alcoholic extracts of Mikania micrantha, 38 3-acetylquinoline thiosemicarbazone 39 and 1-hexadecyl-2,3-dimethylimidazole hexafluorophosphate. 40
Recent studies have established critical findings regarding the specific roles of acidic components in chemical milling: hydrofluoric acid acts as the primary etching agent, where highly electronegative F− ions easily form soluble complexes to accelerate active dissolution, whereas oxidising agents like nitric acid promote repassivation by facilitating the rapid formation of a dense TiO₂ barrier layer.
Despite these macroscopic empirical findings, a critical research gap persists. Existing studies on titanium alloy dissolution focus almost exclusively on macroscopic experimental data, leaving the atomic-scale mechanisms largely unexplored. This limitation severely restricts the ability to regulate the dynamic competition between F−-induced activation and NO3−-induced passivation at the microscopic level. Due to this lack of fundamental mechanistic insight and the inadequate regulation of component ratios, current chemical milling processes often exhibit significant fluctuations in corrosion rates and poor process controllability. Consequently, the high-precision fabrication of titanium alloy components while strictly preventing hydrogen embrittlement remains a huge challenge.
Regarding this issue, molecular dynamics method is proposed to construct a dynamic model of the titanium–mixed acid interface, revealing the dynamic microscopic mechanisms of corrosion reactions in nitric acid–hydrofluoric acid mixed media. Corrosion experiments are carried out to investigate the regulatory mechanisms of different HF-HNO3 mixed acid ratios on the corrosion reaction of TA15 titanium alloy. This research provides data support and theoretical basis for the design of titanium alloy milling processes.
Experiment and simulation procedure
Experimental design
Annealed TA15 titanium alloy plates with a thickness of 6 mm were selected as the experimental material in this research. These plates were machined into multiple rectangular specimens measuring 60 mm × 15 mm. The chemical compositions of the TA15 titanium alloy employed in this research are presented in Table 1, which conform to the Chinese National Standard GB/T 3620.1-2016. 41
Chemical compositions of TA15 (wt.%). 41

A series of weight loss experiments were conducted to systematically investigate the effect of different ratios of nitric acid–hydrofluoric acid mixed solutions on the corrosion rate of TA15 alloy. Prior to testing, the specimen surfaces were progressively polished using 400-grit, 800-grit, 1200-grit and 2000-grit wet sandpaper in a cross-hatch pattern. Subsequently, samples were polished using a 100-nm silica suspension until the surface exhibited a mirror-like finish with no visible marks. Cleaning involved sequential rinsing with distilled water and anhydrous ethanol, followed by degreasing with acetone. After air-drying with cold air, initial mass was measured on an analytical balance with 0.01 g precision. The acids used in the experiment included 50% nitric acid and hydrofluoric acid, which were mixed in a specific ratio to form an acid mixture. Due to the highly corrosive nature of hydrofluoric acid, all experimental operations were conducted in polytetrafluoroethylene containers.
The complete corrosion testing workflow is systematically illustrated in Figure 1. The procedure initiates with sample polishing and weighing, followed by static immersion in mixed acid solutions with varying HF and HNO3 ratios. Post-corrosion, the specimens are subjected to systematic surface characterisations, including SEM morphology observation, X‑ray diffraction (XRD) phase detection and hydrogen content analysis, to comprehensively evaluate the corrosion behaviour.
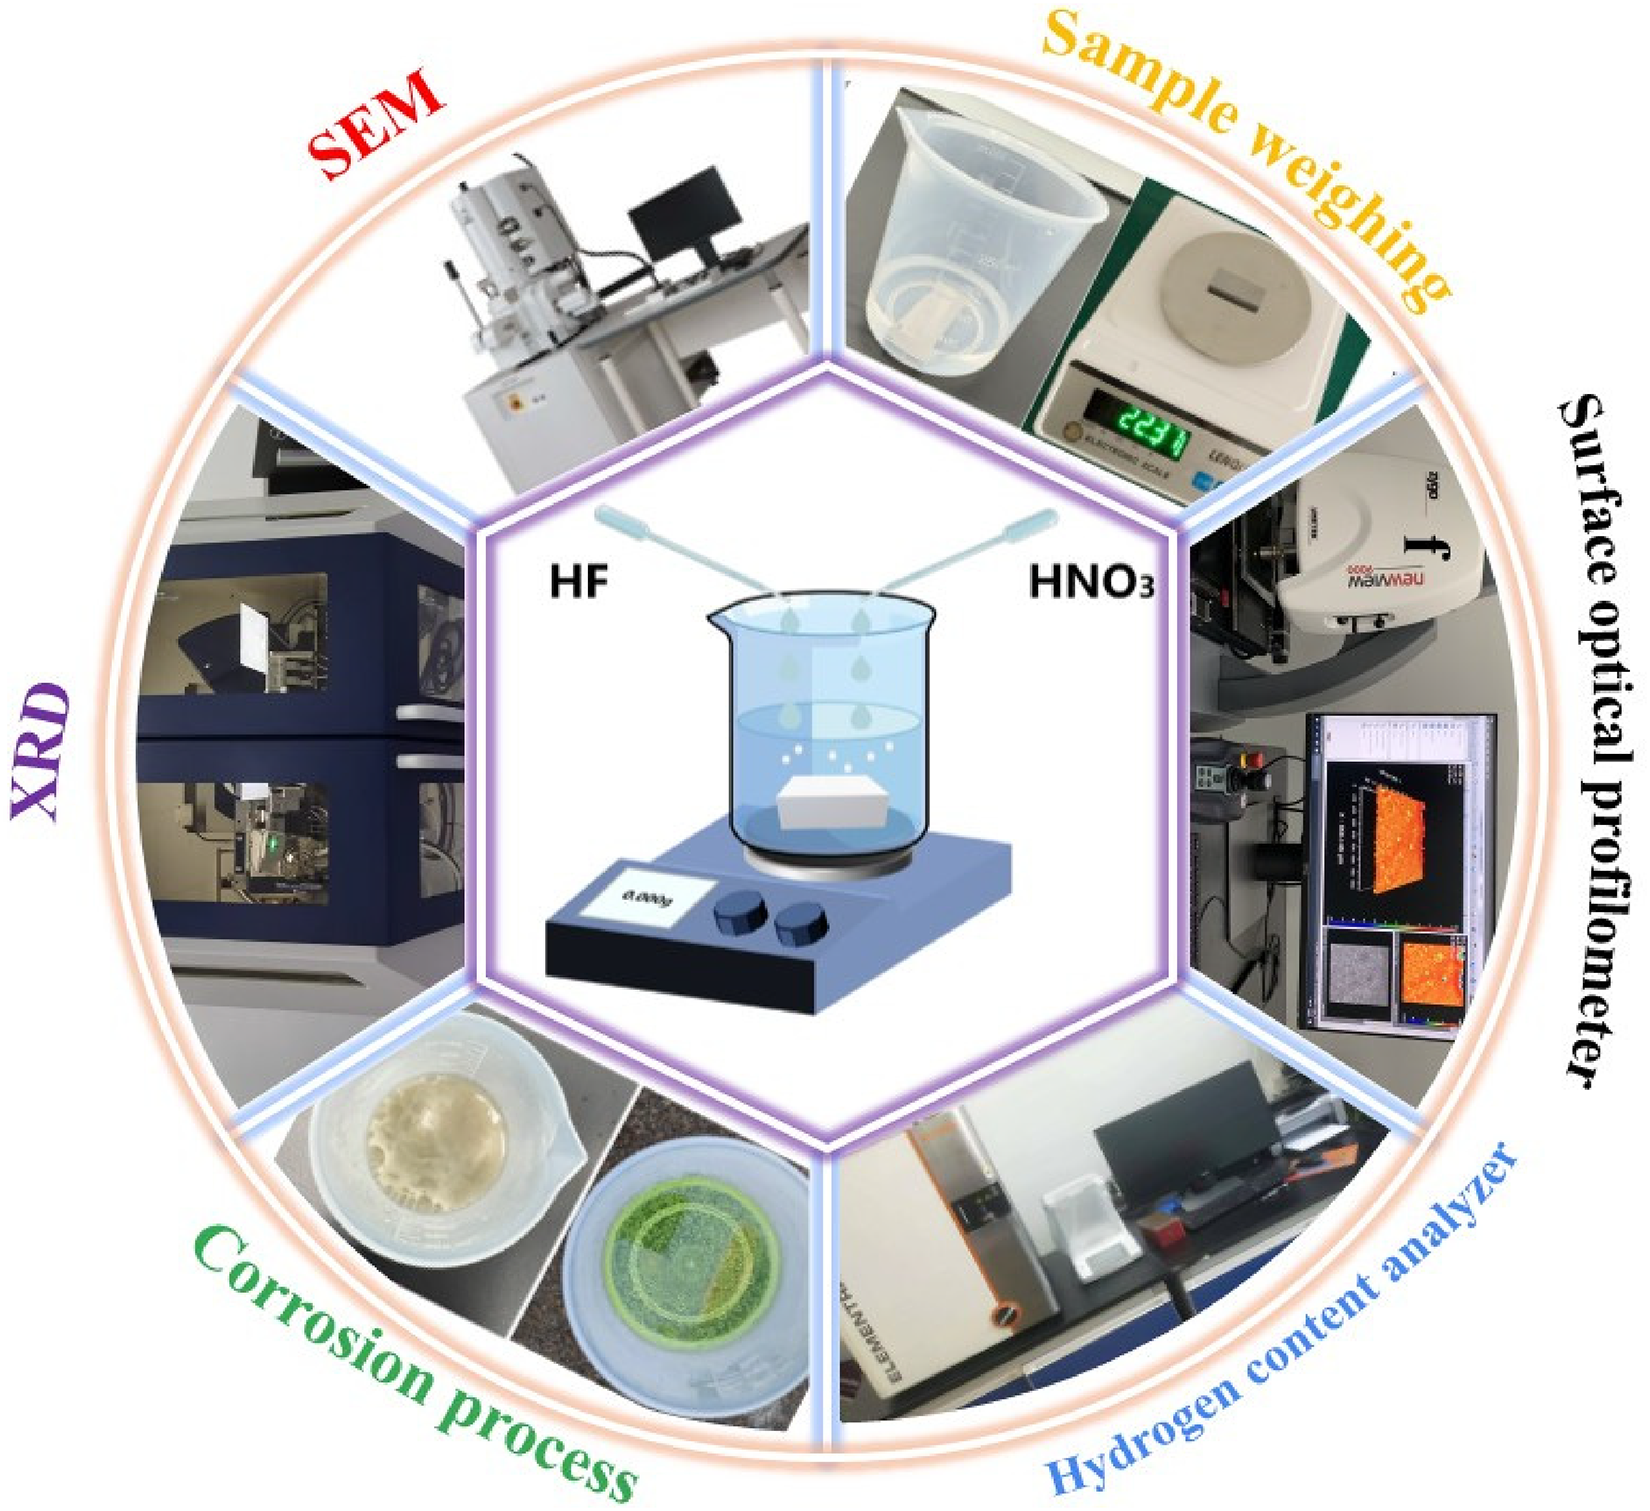
Corrosion testing flow chart.
The experimental strategy was systematically designed to first validate the molecular dynamics simulations and subsequently optimise the mixed acid formulation. Initially, an acid ratio screening was conducted by fixing the total H+ concentration, which effectively isolated the competitive effects of varying HF:HNO3 volume ratios. Guided by the optimal volume ratio identified in this preliminary screening, progressive concentration gradient experiments were then performed. Ultimately, the final optimal formulation was determined by comprehensively evaluating the corrosion rate, surface roughness and the risk of hydrogen embrittlement.
In the experiment, mixed acid solutions of different concentrations were prepared with nitric acid and hydrofluoric acid ratios of 1:1, 1:2, 1:3, 2:1 and 3:1. To control variables, minimise experimental error and reduce the extent of the corrosion reaction, the hydrogen ion concentration of the prepared mixed acid solutions was fixed at 20%. During the experiment, specimens were immersed in the nitric acid–hydrofluoric acid mixture within each beaker for corrosion testing. At a specific time point (three minutes), the samples were carefully removed and subsequently subjected to a thorough rinsing process with distilled water followed by anhydrous ethanol. Afterwards, the samples were gently blotted with absorbent paper and then allowed to air-dry completely. Subsequently, the specimens were weighed on a precision electronic balance, and the weight loss at different acid concentrations and time intervals was recorded. This data was then used to calculate the corrosion rate. To ensure the reliability of the experimental data, six sets of corrosion tests were completed for each mixed acid solution ratio (each set consisting of three parallel experiments with repeated measurements).
Scanning electron microscopy can analyse the microstructural characteristics of corrosion products on the surface of corrosion specimens. Energy dispersive spectroscopy can analyse the elements and composition of micro-area corrosion products. Therefore, a Japanese SU8600 high-resolution field emission scanning electron microscope equipped with an Oxford UltimMax 100 energy dispersive X-ray spectrometer was employed to conduct scanning analysis of the corrosion specimens. This enabled us to determine the microstructural characteristics of the corrosion products, variations in elemental content and the morphology of the corrosion.
To conduct an in-depth analysis of the constituent phases within the specimens, XRD testing was performed. Copper target Kα radiation was used for the tests, which recorded XRD patterns within the 10°–90° range at a scanning speed of 2°/min. This enabled phase composition characterisation of samples with varying aluminium contents.
Surface roughness is one of the key parameters reflecting the surface quality of a specimen, typically used to characterise microscopic geometric shape errors on the specimen's surface. Surface roughness can be quantified by the arithmetic mean height (Sa) of the three-dimensional surface profile. A smaller Sa value indicates a smoother surface, while a larger Sa value indicates a rougher surface. This study employed a Zygo optical profilometer to scan the three-dimensional morphology of the specimen surfaces. Zygo is a non-contact optical interferometer, which provides more accurate imaging of porous corroded surfaces compared to contact profilometers. The final Sa value for each surface was determined by averaging the surface roughness values measured at three randomly selected locations on the sample surface.
To investigate the effect of different mixed acid ratios on material hydrogen content, this experiment employed an oxygen–nitrogen–hydrogen analyzer to measure hydrogen levels in corroded specimens. Each specimen was cut into three 3 mm × 3 mm × 3 mm cubes, which were then immersed in anhydrous ethanol to remove surface contaminants and minimise measurement errors.
Molecular dynamics simulation
The research investigated the corrosion reaction of titanium substrates in a mixed nitric acid–hydrofluoric acid solution through molecular dynamics simulations. To accurately simulate the corrosion process of titanium alloys via MD, the substrate model was constructed by directly obtaining the CIF file of the titanium unit cell's crystallographic structure. However, the crystallographic structure CIF file cannot be directly used for calculations in LAMMPS software and requires format conversion. Therefore, during the construction of the titanium substrate MD model, the titanium crystal file was imported into Materials Studio. Using the Supercell module, the crystallographic structure CIF file of the titanium unit cell was expanded to complete the initial model construction of the titanium substrate. Real-world metal corrosion environments contain highly complex compositions. Drawing on existing relevant studies,42,43 this work models the corrosion environment of titanium alloys as a weak electrolyte solution containing only water molecules, hydrofluoric acid and nitric acid. This simplification reduces modelling complexity and shortens computational cycles. To ensure the reliability of this MD model, molecular simulation software was used to construct models of water molecules, hydrofluoric acid and nitric acid. A total of 400 H₂O molecules, 120 H+ ions and 120 F− and NO3− ions in varying ratios (1:1, 1:2, 1:3, 2:1, 3:1) of 120 F− ions and NO3− ions into a box measuring 66.72 Å × 38.04 Å × 18 Å, then imported into LAMMPS. The ReaxFF potential function44–47 was employed to simulate corrosion reactions, investigating the effects of varying HF/NO3 ratios on titanium alloy corrosion behaviour. Figure 2 depicts the corrosion model at the titanium substrate–mixed acid interface. To accelerate the MD simulation process and enable sufficient reaction within limited computational time, the ReaxFF-MD simulations employed an NVT ensemble. The simulation temperatures were set to 300 K, 325 K, 350 K and 375 K. Temperature and pressure were controlled using the Nose–Hoover algorithm and Berendsen algorithm, respectively. The simulation ran for 1 ns with a time step of 0.001 ps and completed 1,000,000 steps. To ensure precise alignment between the substrate model and mixed acid solution model during merging and prevent atomic loss during relaxation, the ReaxFF-MD simulation system employs a shrinkable boundary condition along with the Z-axis and periodic boundary conditions along with the X and Y axes. The reaction force field employed in this research is based on parameters developed by Kim et al.,48,49 which systematically describes reactions between Ti, O, H, N and F atoms. The ReaxFF methodology ensures the reliability of the force field and enables effective simulation of titanium corrosion behaviour during kinetic processes. Atomic charges were calculated using the charge equilibrium method. 50 Post-processing of MD results was performed using OVITO software. 51

Titanium matrix-mixed acid corrosion model (a) HF:HNO3 = 1:1; (b) HF:HNO3 = 2:1; (c) HF:HNO3 = 3:1; (d) HF:HNO3 = 1:2; (e) HF:HNO3 = 1:3.
The theoretical foundation of ReaxFF lies in combining bond order formalism with a description of polarisable charges, thereby enabling a unified description of both reactive and non-reactive interactions between atoms. Consequently, this method can accurately simulate covalent and electrostatic behaviours in various materials.
52
The total energy of a system comprises both bonding and non-bonding energy components, expressed as48,49: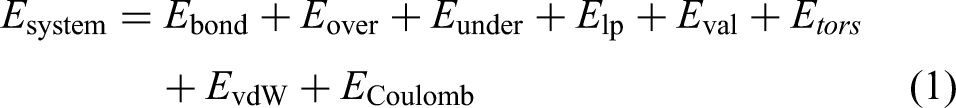
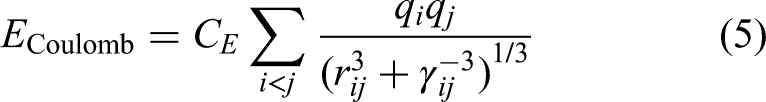
where Ebond originates from the bond order between atoms. Eover and Eunder are used to correct deviations in atomic coordination numbers from ideal valence states. Elp describes the contribution of lone pairs to the total energy. Eval and Etor represent the potential energy arising from three-body valence angle distortion and four-body dihedral torsion, respectively. EvdW incorporates short-range Pauli repulsion terms and long-range dispersion terms. ECoulomb of the system is evaluated based on charges calculated using the electronegativity equilibrium method to assess electrostatic interactions.52,53
Bond order and bond energy are key factors determining interatomic interactions. In the ReaxFF potential function used in this research, the bond energy term for each pair of atoms i and j is expressed as54,55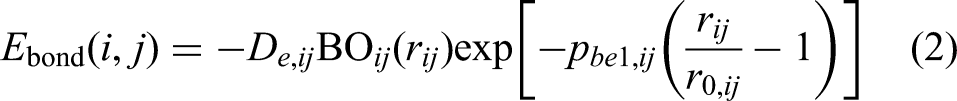
where
The fundamental assumption of the ReaxFF model is that the bond order 
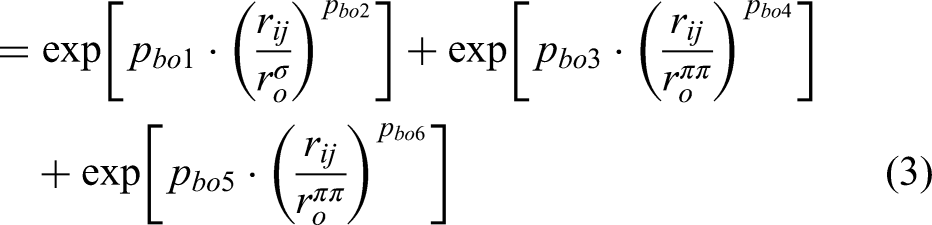
where
In the ReaxFF potential function, each element is characterised by a set of atomic parameters that govern interatomic interactions, polarisation responses as well as bond formation and breaking properties. The atomic parameter sets for the elements Ti, H, O, N and F are listed in Table 2 in the potential function files used.
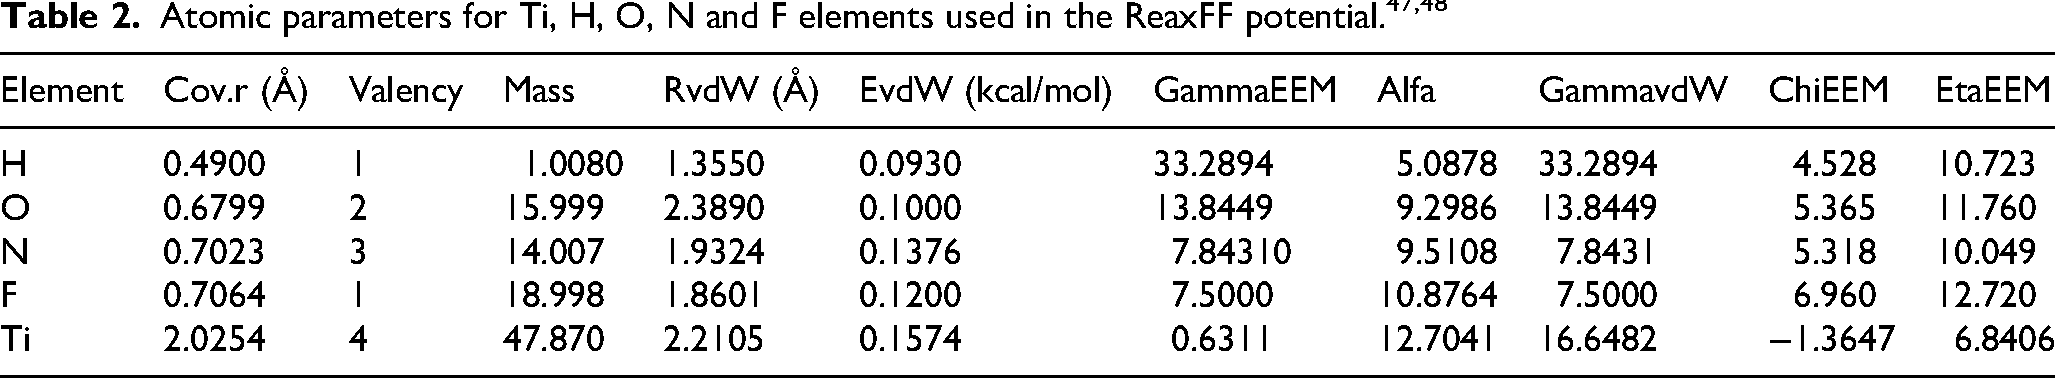
In Table 2, each atomic parameter is coupled to a specific energy term. cov.r represents the covalent radius, defining the effective size of an atom during bonding. It is used to calculate the bond order function, and its value directly influences the equilibrium position of bond length and bond energy. Valency denotes the idealised number of valence electrons in an atom, used to control over- and under-coordination penalty energies. RvdW and EvdW represent the van der Waals radius and potential well depth, respectively, which determine the non-bonding interaction term. alfa, gammavdW are the polarisability and van der Waals decay parameters, which affect the smoothness of the potential energy with distance.52,54–56
A more detailed description of each ReaxFF parameter can be found in the studies by Kim et al. 56 and van Duin et al. 57
Results and discussion
Chemical reaction on Ti-mixed acid interface
To investigate the molecular mechanism of nitric acid–hydrofluoric acid mixed solution corrosion on titanium alloys, we performed a 1 ns corrosion simulation using the ReaxFF force field on a titanium substrate–mixed acid interface corrosion model. Figure 3 shows the final geometric structure snapshots of simulation cells with different ratios of nitric acid–hydrofluoric acid mixed solutions after running for 1 ns at 350 K. The bonding reactions between the mixed acid solution and the titanium substrate, along with the separation of numerous titanium atoms from the substrate surface, confirm the vigorous corrosion reaction between the acidic solution and the titanium substrate. The figure reveals multiple small blank areas within the titanium substrate mesh after 1 ns of corrosion. These represent localised defects on the substrate surface caused by mixed acid solution corrosion. As the HF proportion in the mixed acid solution increases, the number of small-area corrosion defects on the substrate surface also rises, leading to the formation of large-area corrosion pits.

Corrosion morphology of titanium substrates exposed to mixed acid solutions at different concentrations (a) HF:HNO3 = 1:1; (b) HF:HNO3 = 2:1; (c) HF:HNO3 = 3:1; (d) HF:HNO3 = 1:2; (e) HF:HNO3 = 1:3.
During the corrosion process, highly electronegative F− ions aggressively bond with surface Ti atoms. This strong interaction significantly lowers the dissolution energy barrier, causing individual Ti atoms to detach from the crystal lattice and generating a multitude of surface vacancies (small-area defects). As the HF proportion increases, the frequency of this atomic extraction rises exponentially. Consequently, the rapid accumulation and coalescence of these adjacent atomic vacancies ultimately drive the formation of the large-area corrosion pits observed on the substrate surface.
A statistical analysis of the change in titanium atom loss over time was conducted to visually demonstrate the impact of nitric acid–hydrofluoric acid mixed solutions on the corrosion behaviour of titanium substrates. Figure 4 illustrates the curve showing the variation in titanium atom loss with simulation time. As evident from the graph, the curve exhibits a characteristic progression from slow to fast: atomic loss is initially gradual, with corrosion reactions occurring at an extremely slow pace. As time progresses, atomic loss increases sharply as the titanium substrate becomes directly exposed and undergoes vigorous reaction with the corrosive solution. An increase in the hydrofluoric acid proportion significantly accelerates titanium atomic corrosion loss, further confirming hydrofluoric acid as the primary factor driving titanium corrosion. Additionally, elevated temperatures lead to a marked increase in the number of corroded titanium atoms, indicating that the corrosion reaction is governed by a thermally activated mechanism.
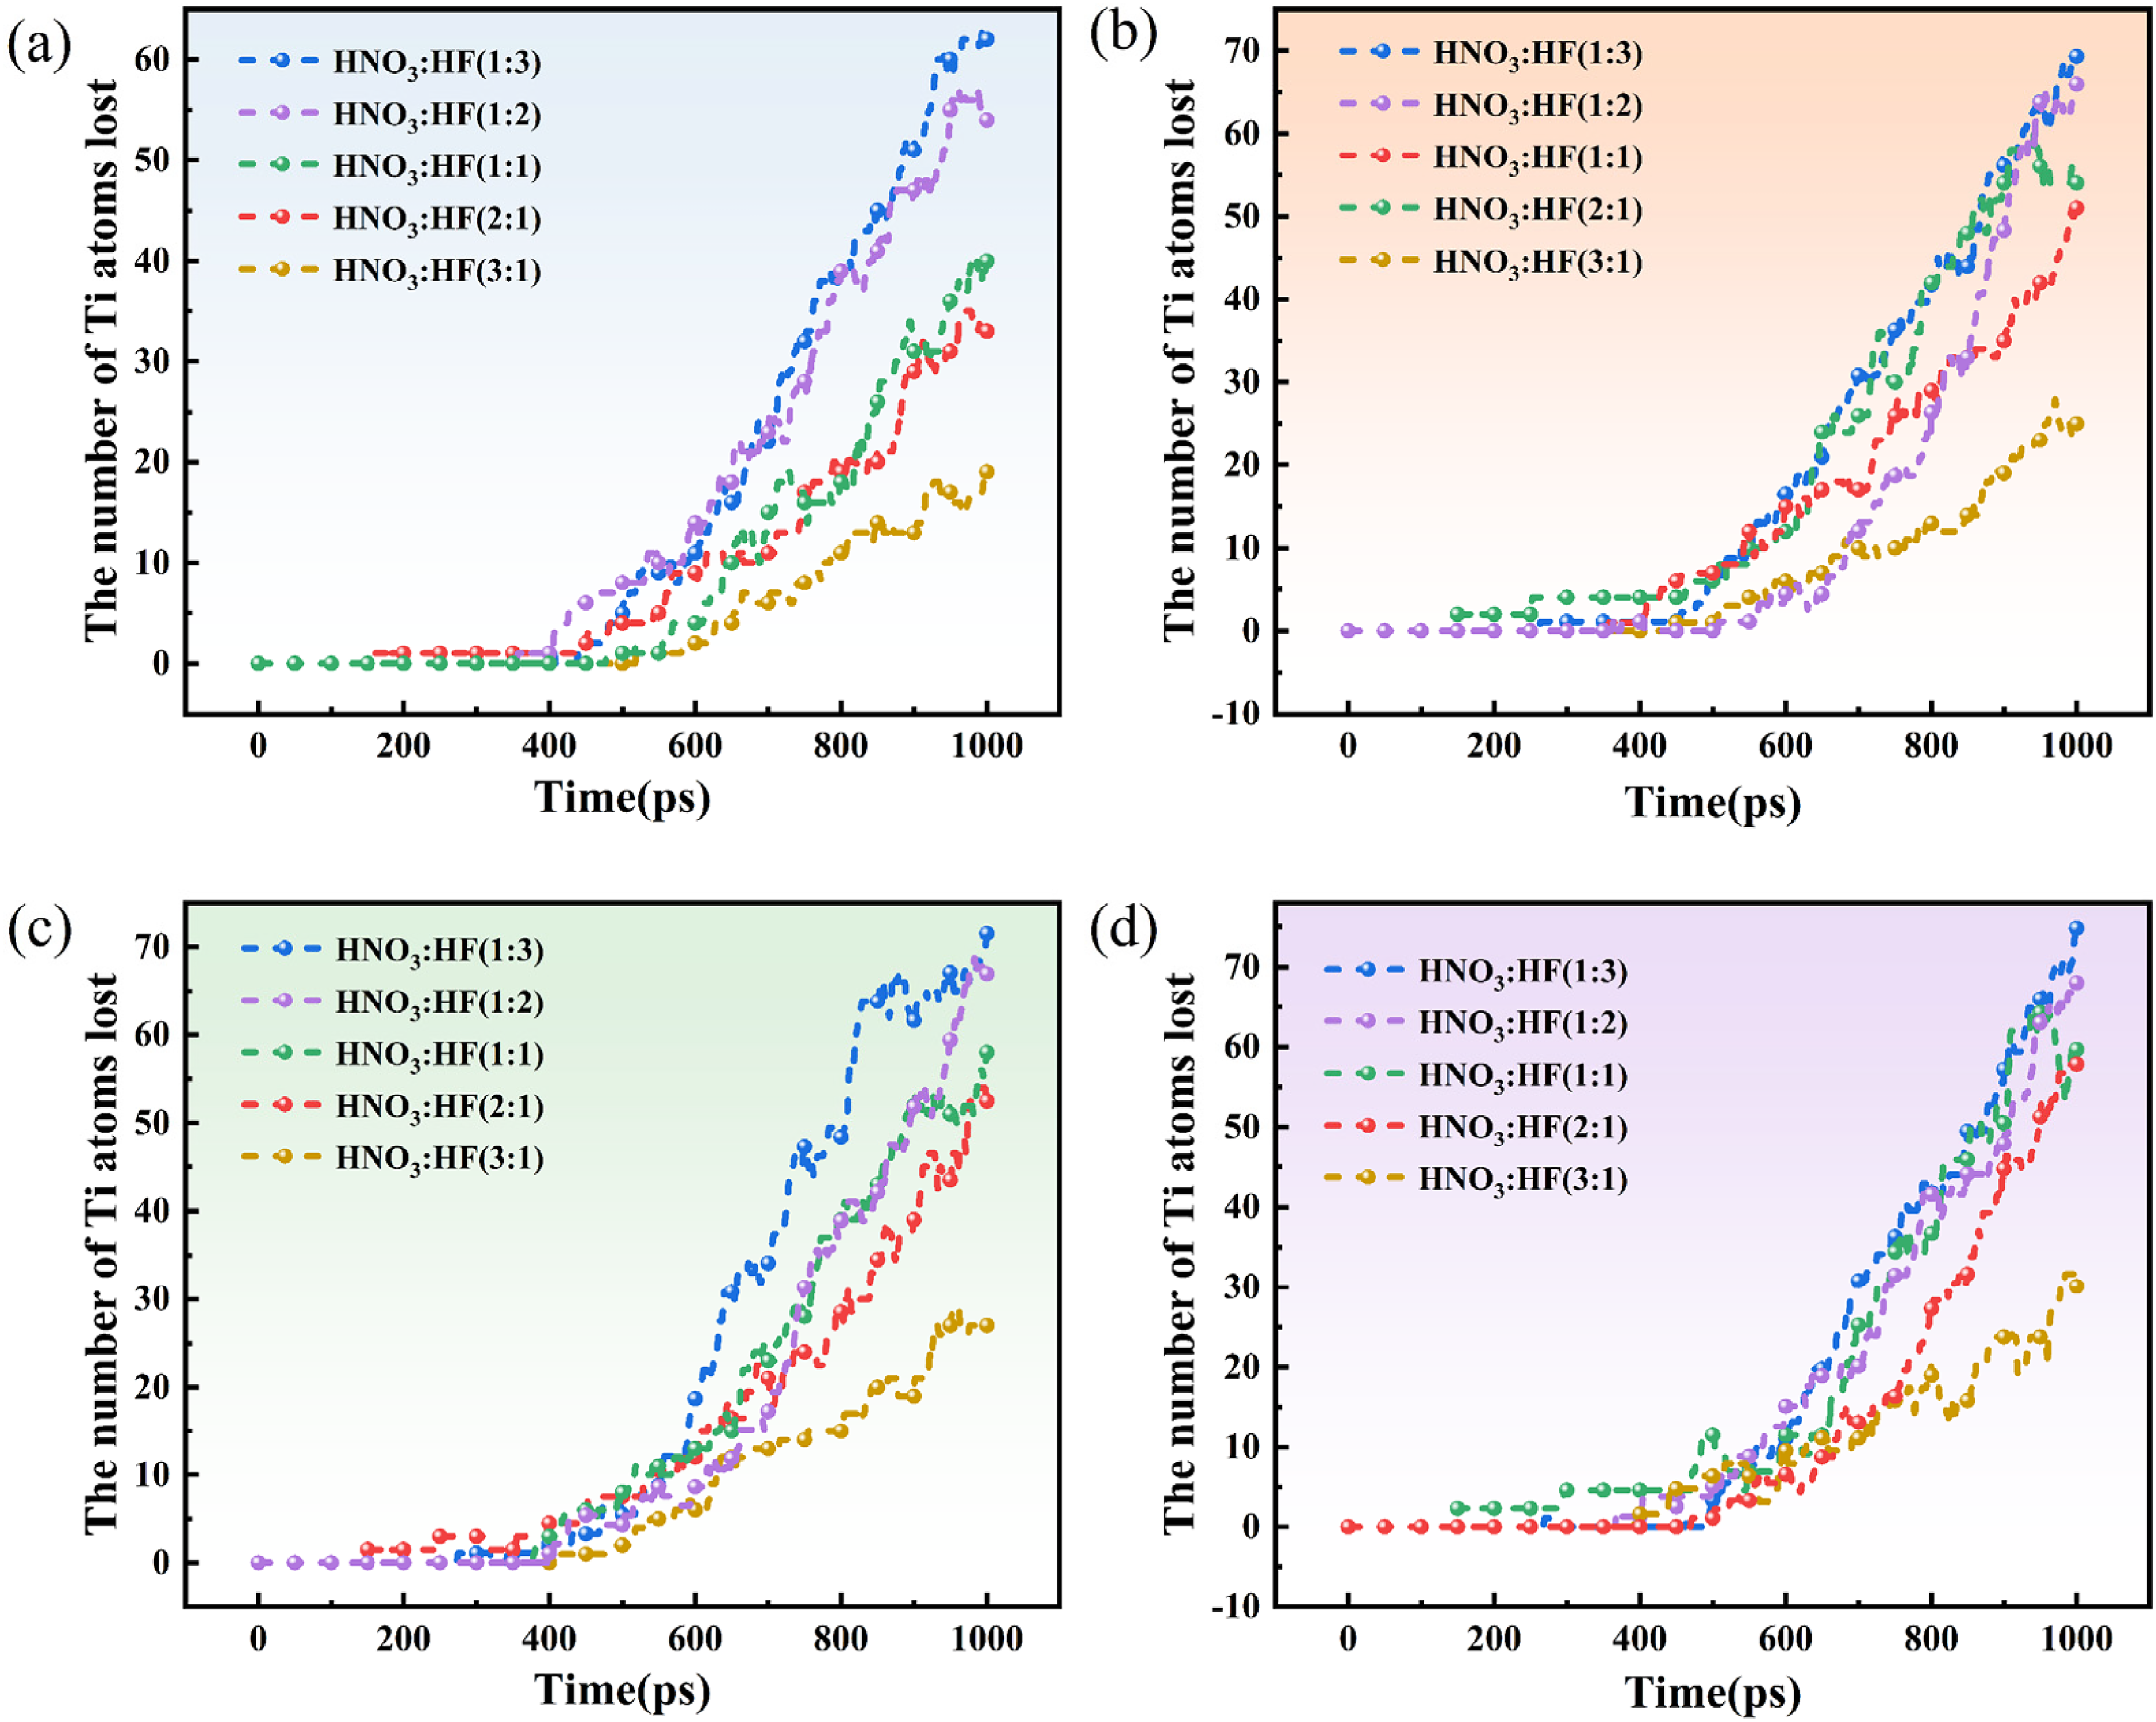
Curve of Ti atom loss at different temperatures (a) 300 K; (b) 325 K; (c) 350 K; (d) 375 K.
To investigate the interaction between the Ti substrate and the mixed nitric–hydrofluoric acid solution and quantitatively evaluate the migration rate and motion behaviour of particles within the system under this corrosive environment, the research employs mean square displacement (MSD) analysis.58–61 The diffusion capability of Ti atoms is one of the key factors influencing their corrosion kinetics. Therefore, accurately obtaining the diffusion coefficient of Ti atoms is crucial for revealing the microscopic dynamic mechanisms of the corrosion reaction.
The research calculated the MSD curves of Ti atoms at four different temperatures: 300 K, 325 K, 350 K and 375 K. The MSD calculation method is as follows
61
:
where
By analyzing the temporal variation of the MSD, the diffusion coefficient D can be further calculated.62,63 Assuming diffusion behaviour follows the Einstein relation,
64
D can be determined from the slope of the linear region of the MSD versus time curve
64
: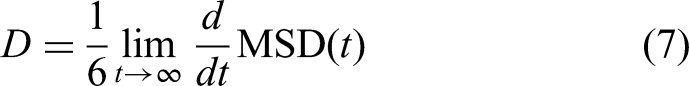
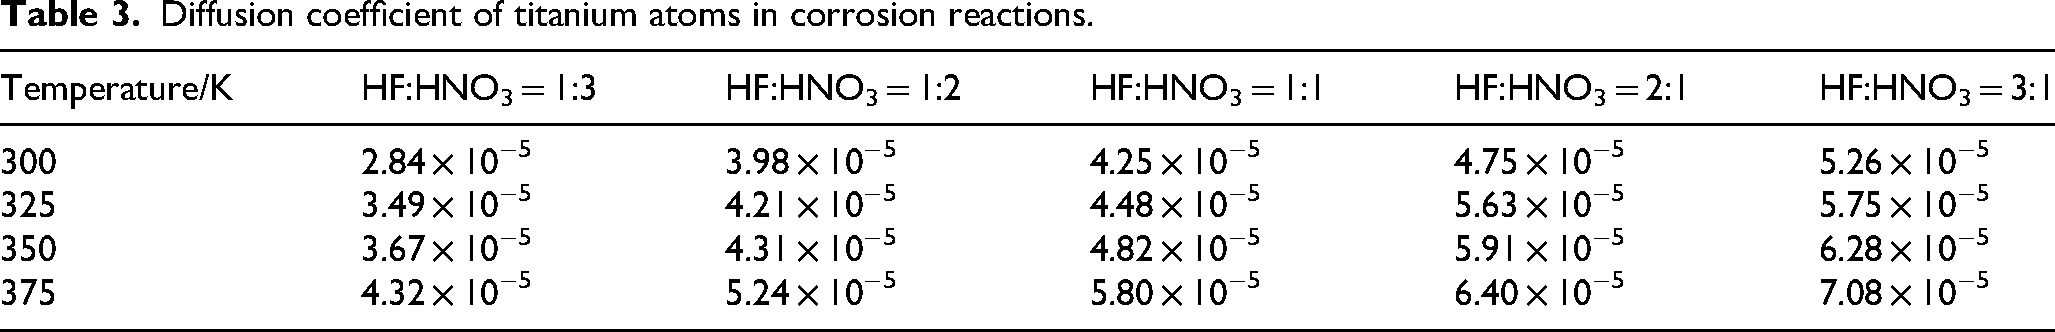
The diffusion coefficient of Ti atoms was further calculated through linear fitting of the MSD data, which are obtained from LAMMPS simulations and are displayed in Figure 5 over time under different temperature conditions. The corresponding results are summarised in Table 3. Data analysis indicates that the diffusion coefficient of Ti atoms exhibits a significant upward trend as the proportion of hydrofluoric acid in the mixed acid increases. This result directly confirms that HF strongly promotes the activation and dissolution of the titanium substrate during the corrosion process, accelerating the material corrosion rate. Additionally, the diffusion coefficient of Ti atoms also increases markedly with rising temperature. Elevated temperatures provide higher kinetic energy for atomic diffusion, thereby accelerating the corrosion reaction kinetics.
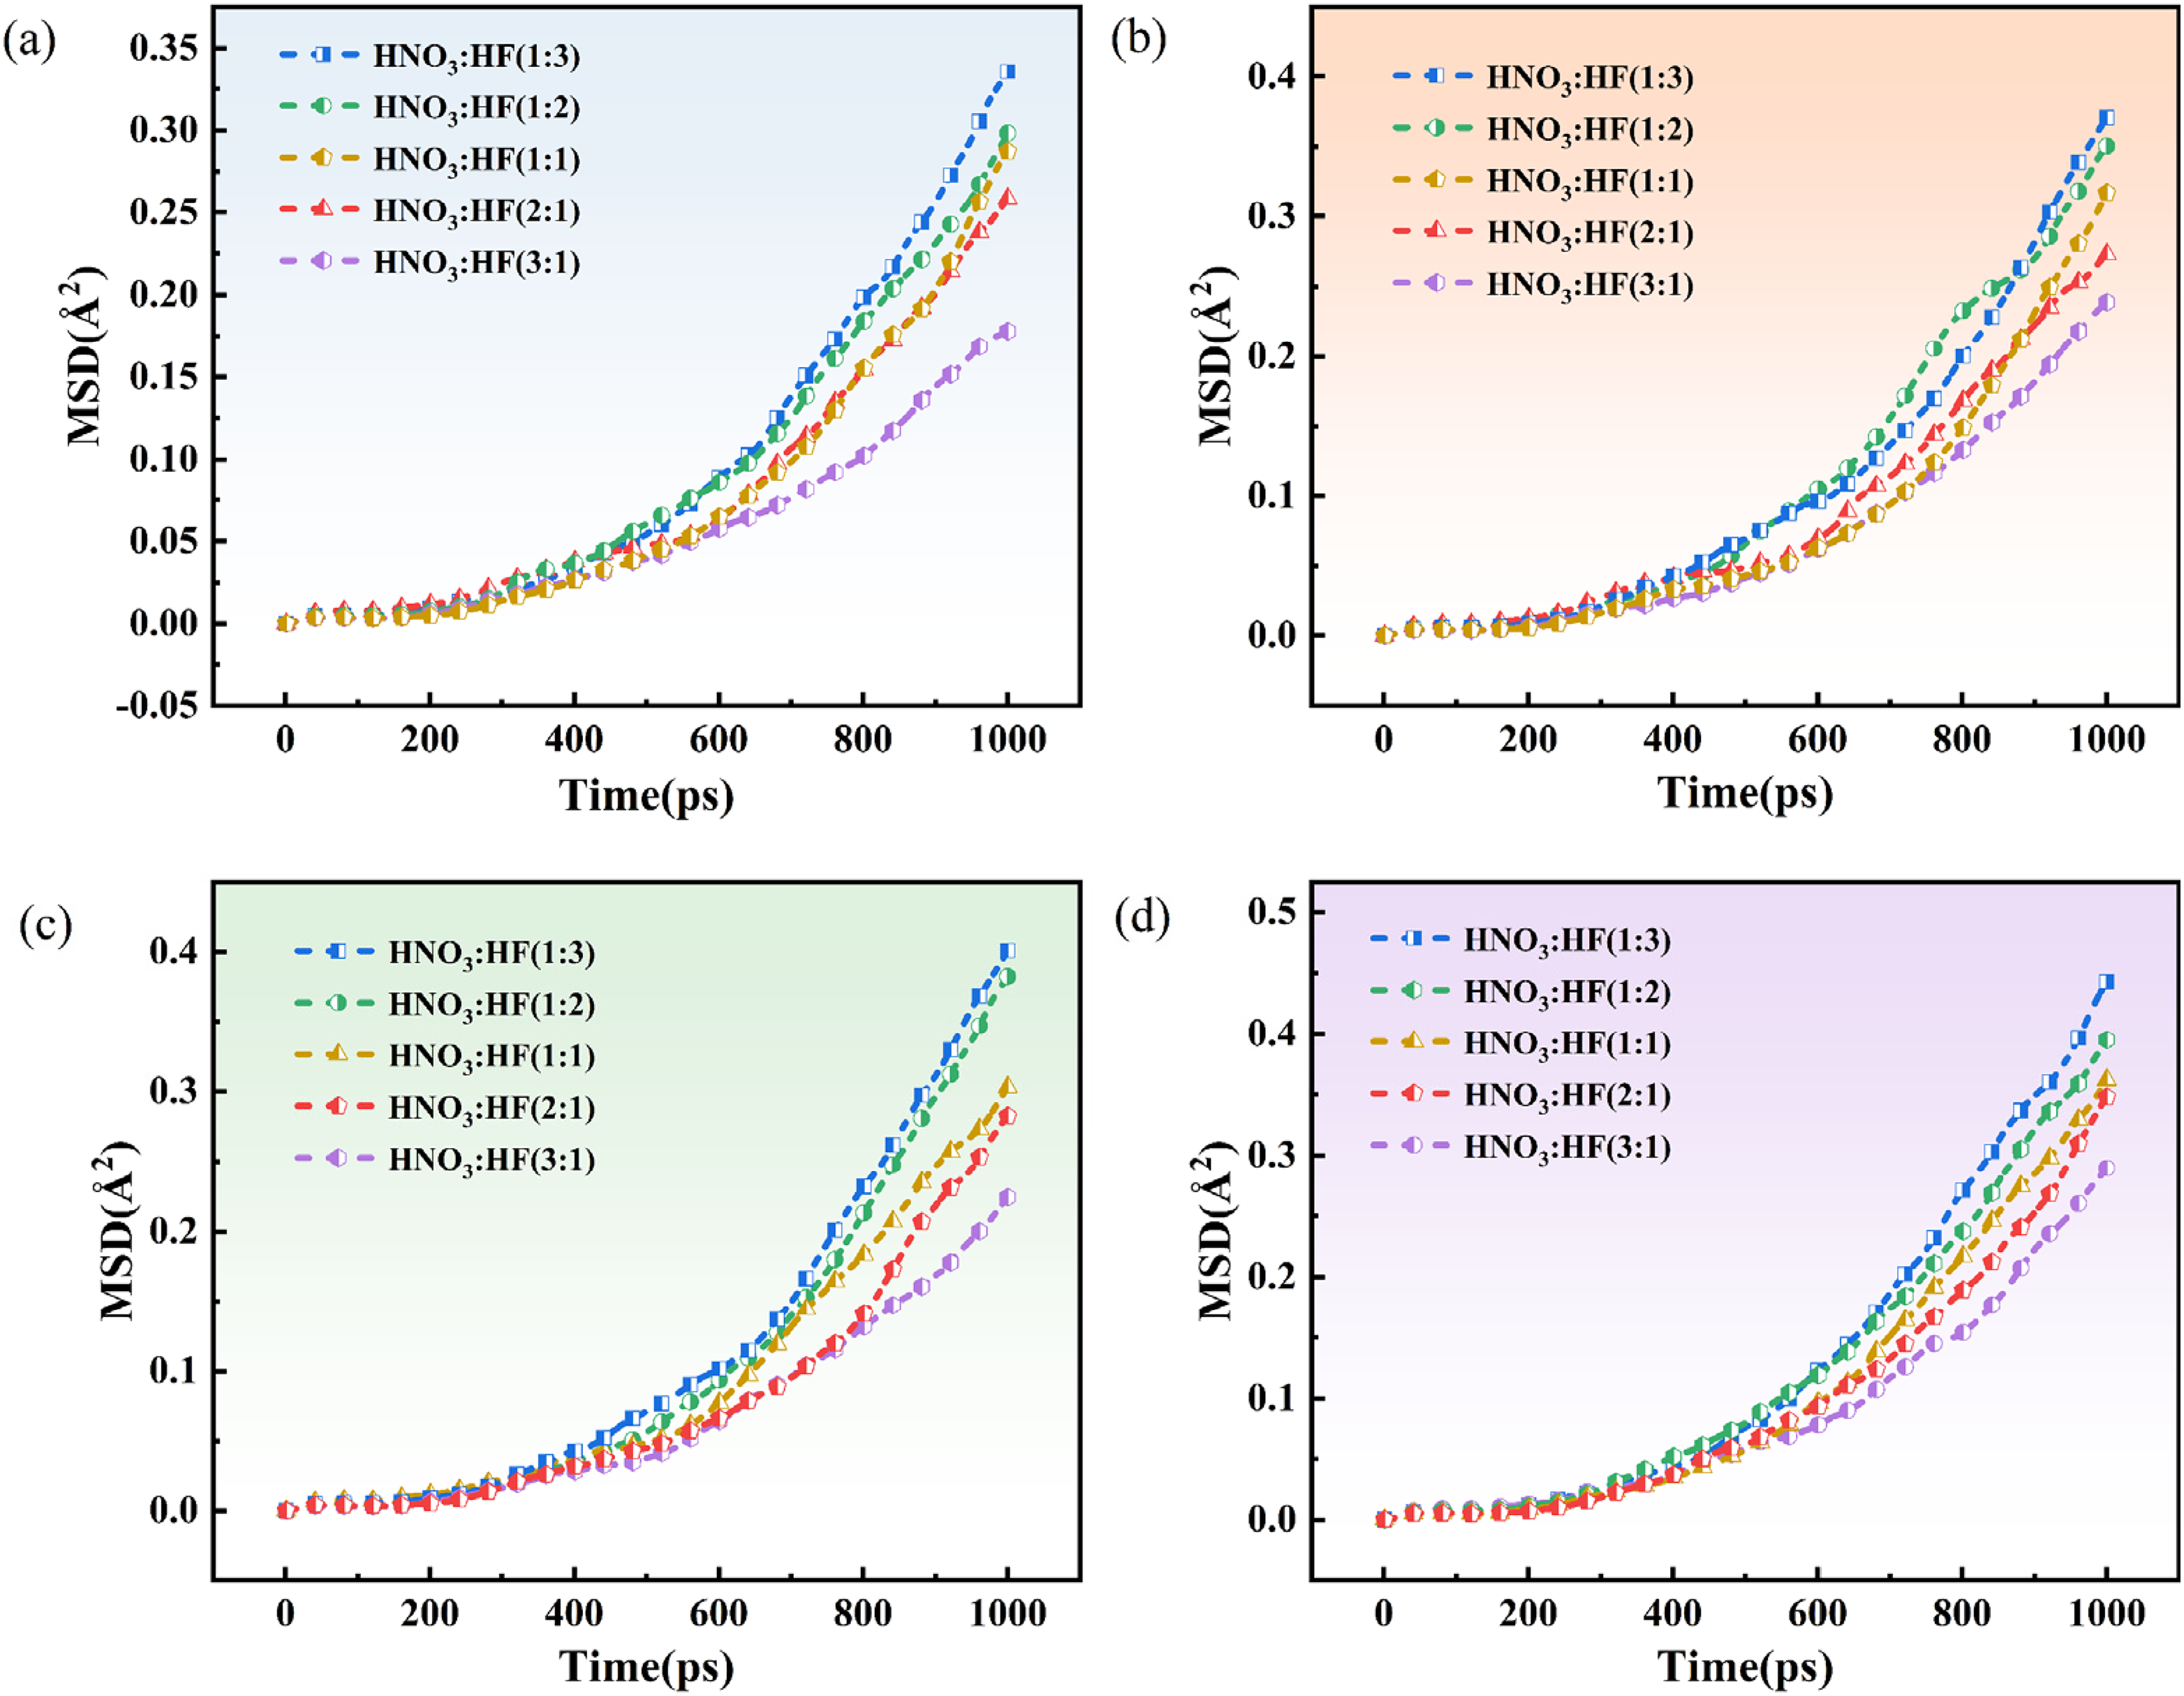
Mean square displacement (MSD) curves of Ti atoms at different temperatures (a) 300 K; (b) 325 K; (c) 350 K; (d)375 K.
Diffusion coefficient of titanium atoms in corrosion reactions.
The molecular mechanism of the corrosion process involves a complex competitive reaction between the activation dissolution of hydrofluoric acid and the oxidation passivation of nitric acid. Hydrofluoric acid preferentially reacts with titanium to form TiF₄ and hydrogen gas 10 :


Nitric acid promotes the formation of surface oxides:

In this reaction system, the dynamic equilibrium between the activation dissolution of HF and the passivation protection of HNO3 is crucial for achieving efficient and controllable corrosion of the titanium substrate. The overall reaction equation is as follows
10
: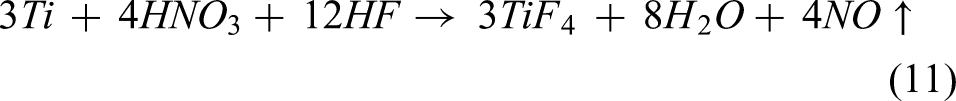
Figure 6 illustrates the mechanism of corrosion of a titanium substrate by a mixed nitric acid–hydrofluoric acid solution. From the overall reaction equation, hydrogen gas does not appear as a final product. However, the process of hydrogen generation is not eliminated; rather, the produced hydrogen is rapidly oxidised by nitric acid, thereby suppressing hydrogen gas formation. Specifically, during the reaction between hydrofluoric acid and titanium that generates hydrogen gas, nitrate ions in the corrosive solution participate throughout the entire reaction process. Most hydrogen atoms and molecules generated by corrosion react with nitrate ions to form NO. Nevertheless, a small fraction of hydrogen escapes complete oxidation by nitrate. This residual hydrogen either chemically adsorbs onto the titanium surface, forming titanium hydrides or diffuses into the metal interior as hydrogen atoms through defects such as grain boundaries and dislocations, leading to internal hydrogen dissolution. 65
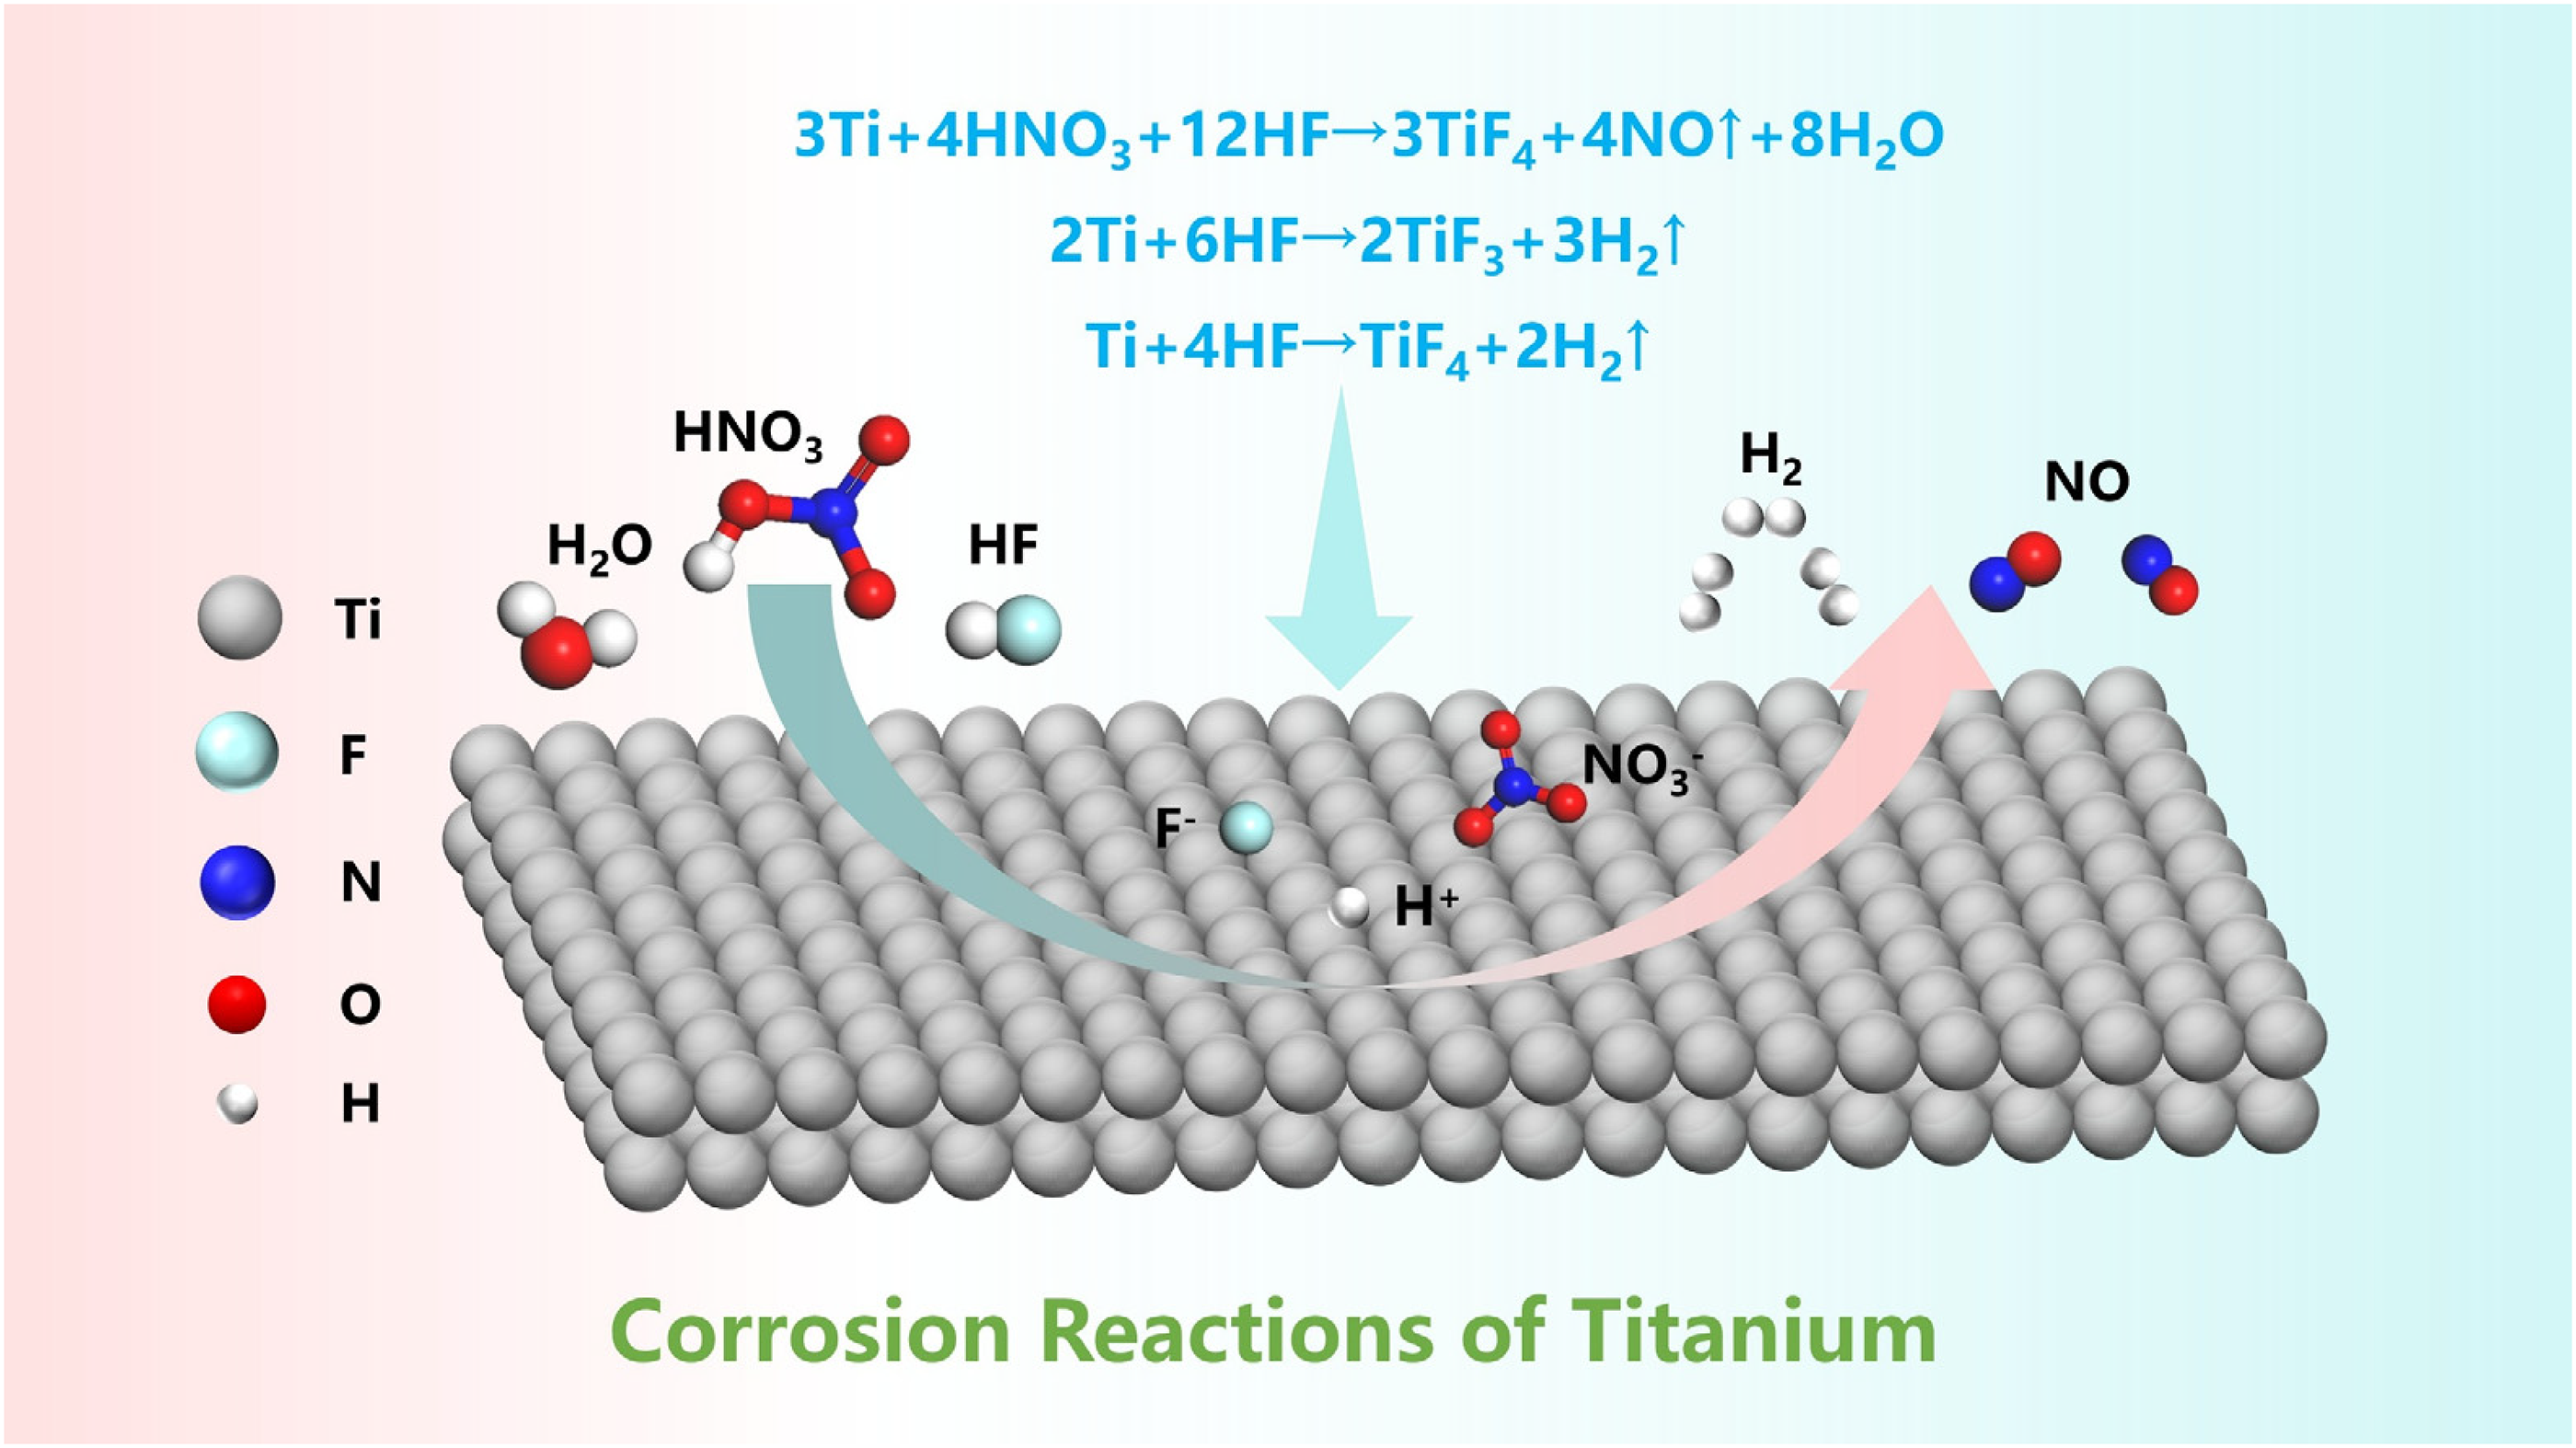
Schematic diagram of corrosion mechanism in Ti-HF-HNO3 system.
To investigate the effect of mixed acid solutions with varying ratios on hydrogen permeation behaviour, this study further measured the number of hydrogen atoms within the titanium substrate under different temperature conditions. The relationship between hydrogen content and simulation time is shown in Figure 7. The figure indicates that as the proportion of hydrofluoric acid increases and the simulation time extends, the number of hydrogen atoms in the titanium substrate significantly rises. This demonstrates that HF not only promotes titanium dissolution during corrosion but also intensifies hydrogen permeation behaviour. Conversely, as the proportion of nitric acid increases, the enrichment of hydrogen atoms within the titanium substrate markedly decreases. This is attributed to the strong oxidising properties of HNO3, which promote the formation of a passivation film on the surface, thereby inhibiting hydrogen desorption and infiltration. Additionally, elevated temperatures significantly accelerate the corrosion reaction kinetics, further increasing the dissolution of hydrogen within the substrate.
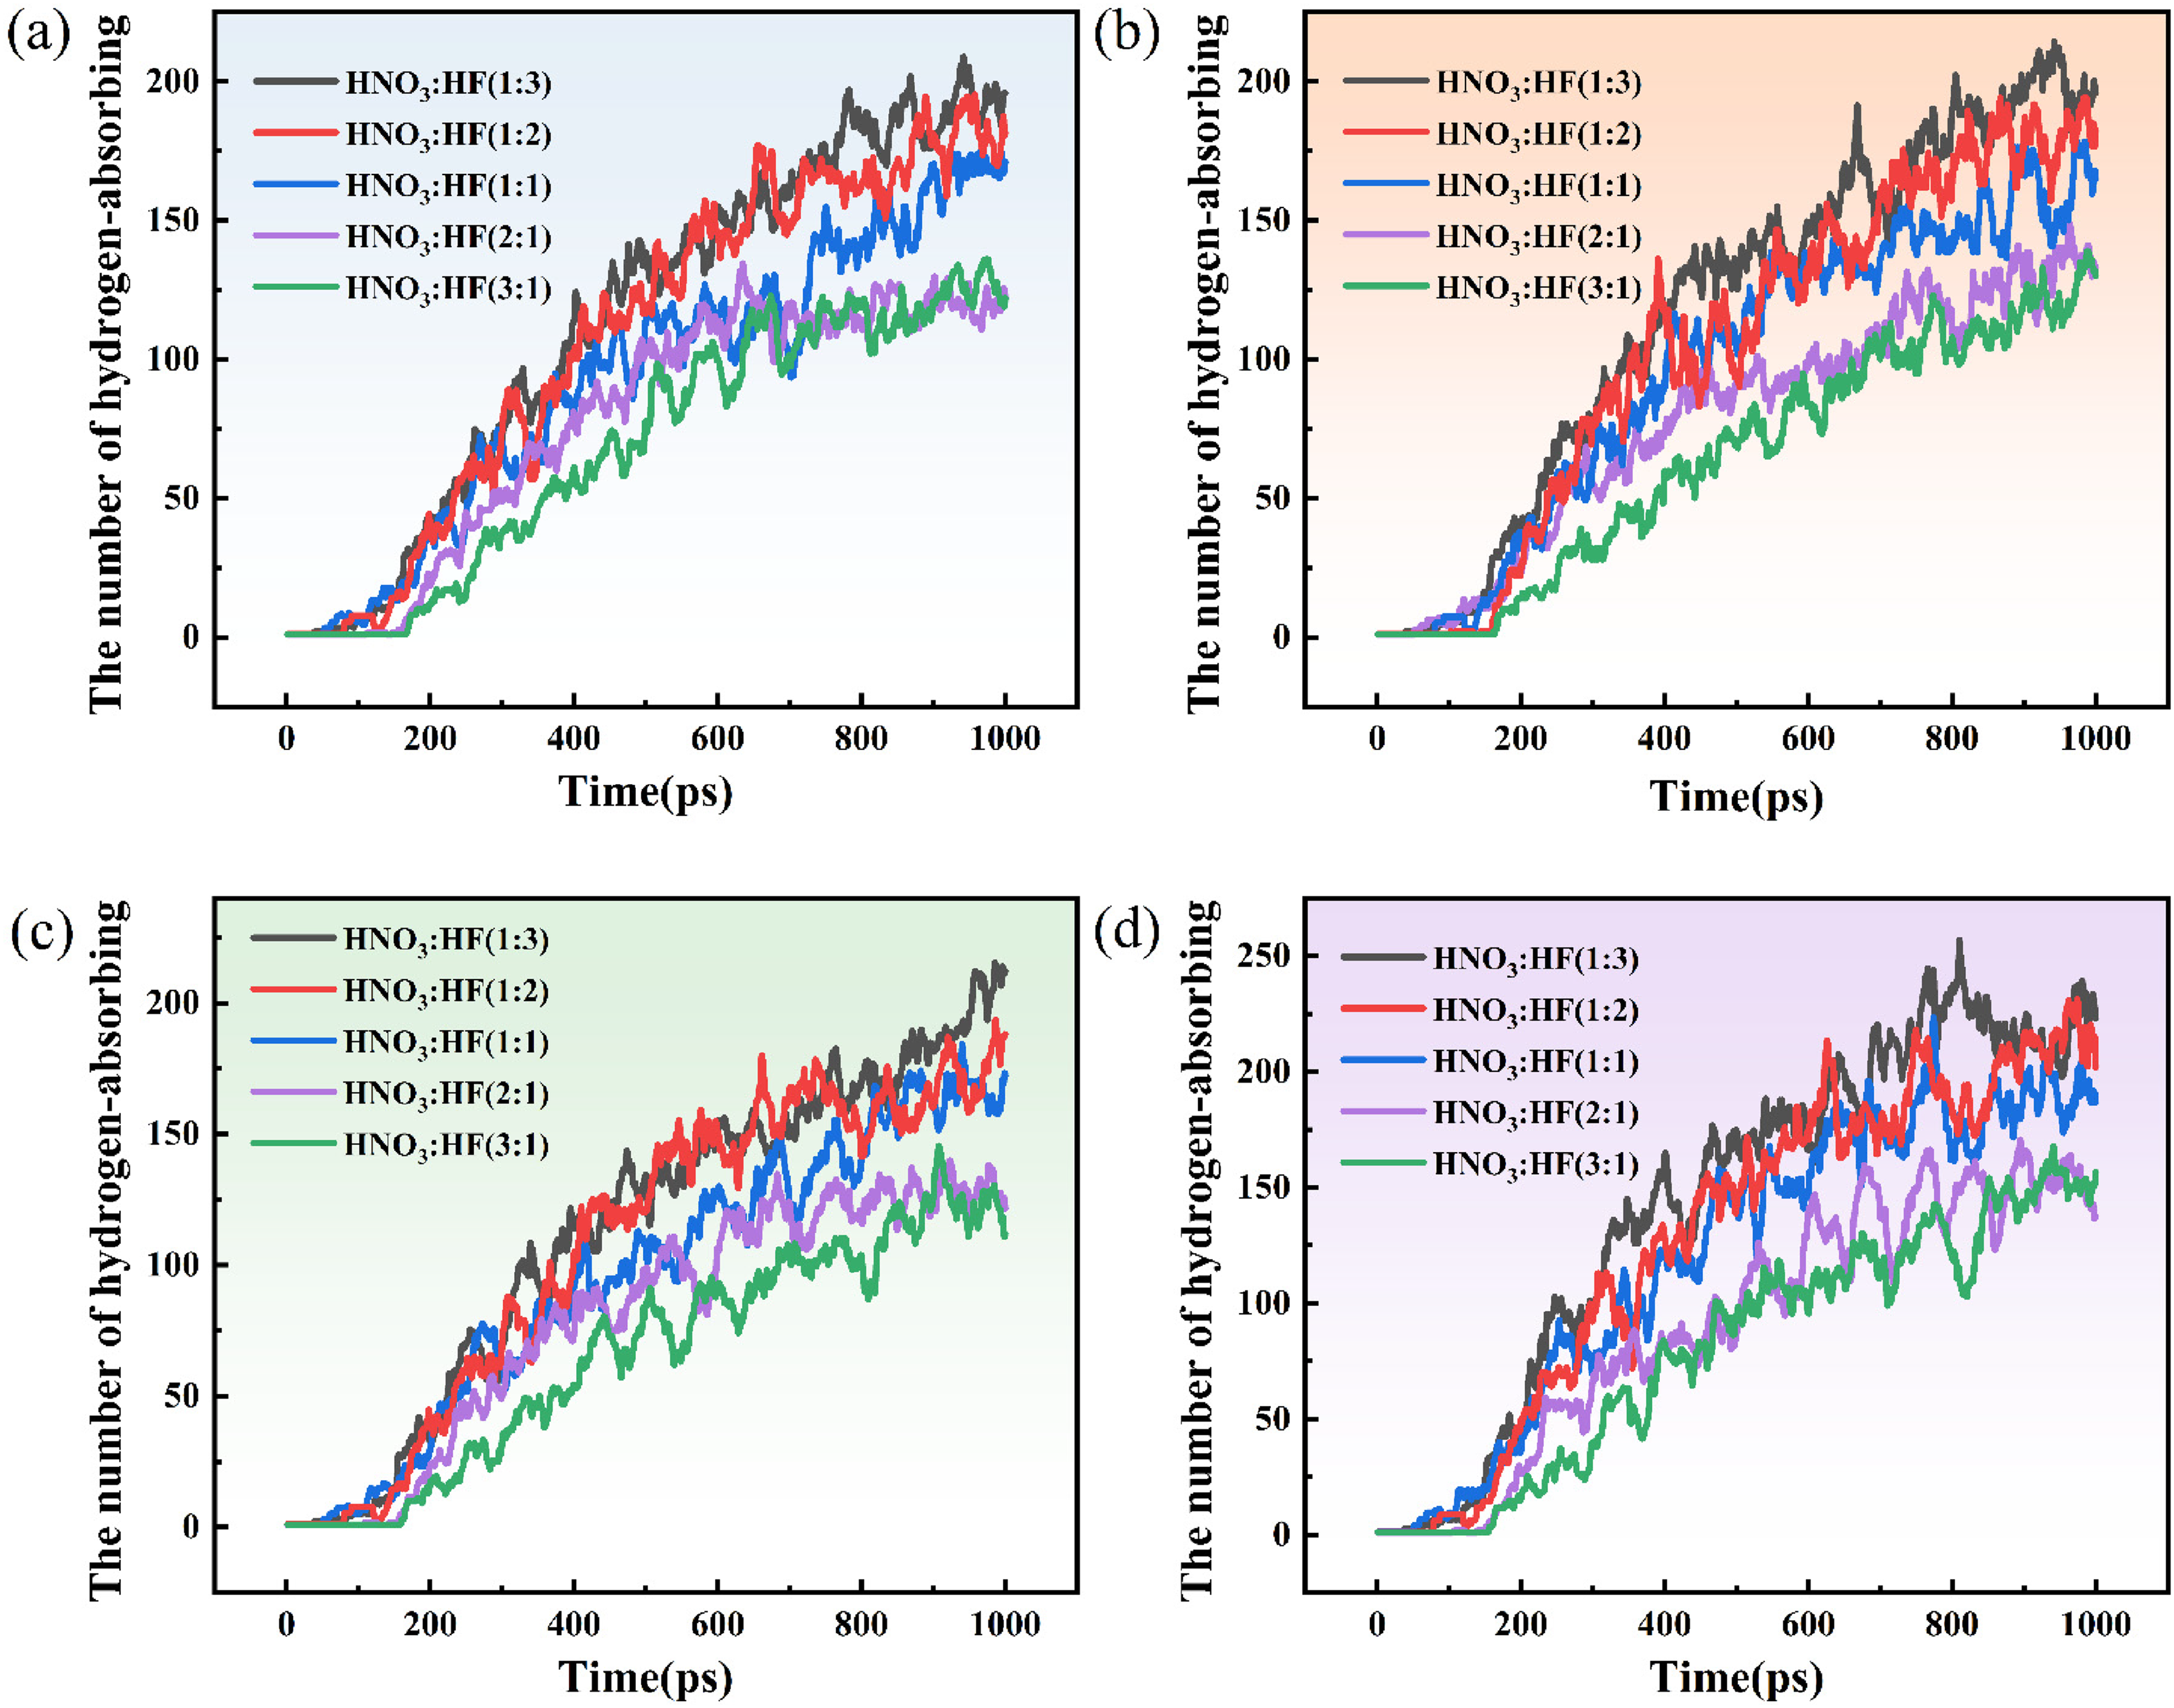
Hydrogen absorption curve of titanium substrate over time at different temperatures (a) 300 K (b) 325 K; (c) 350 K; (d) 375 K.
Corrosion kinetics and surface characterisation analysis of TA15
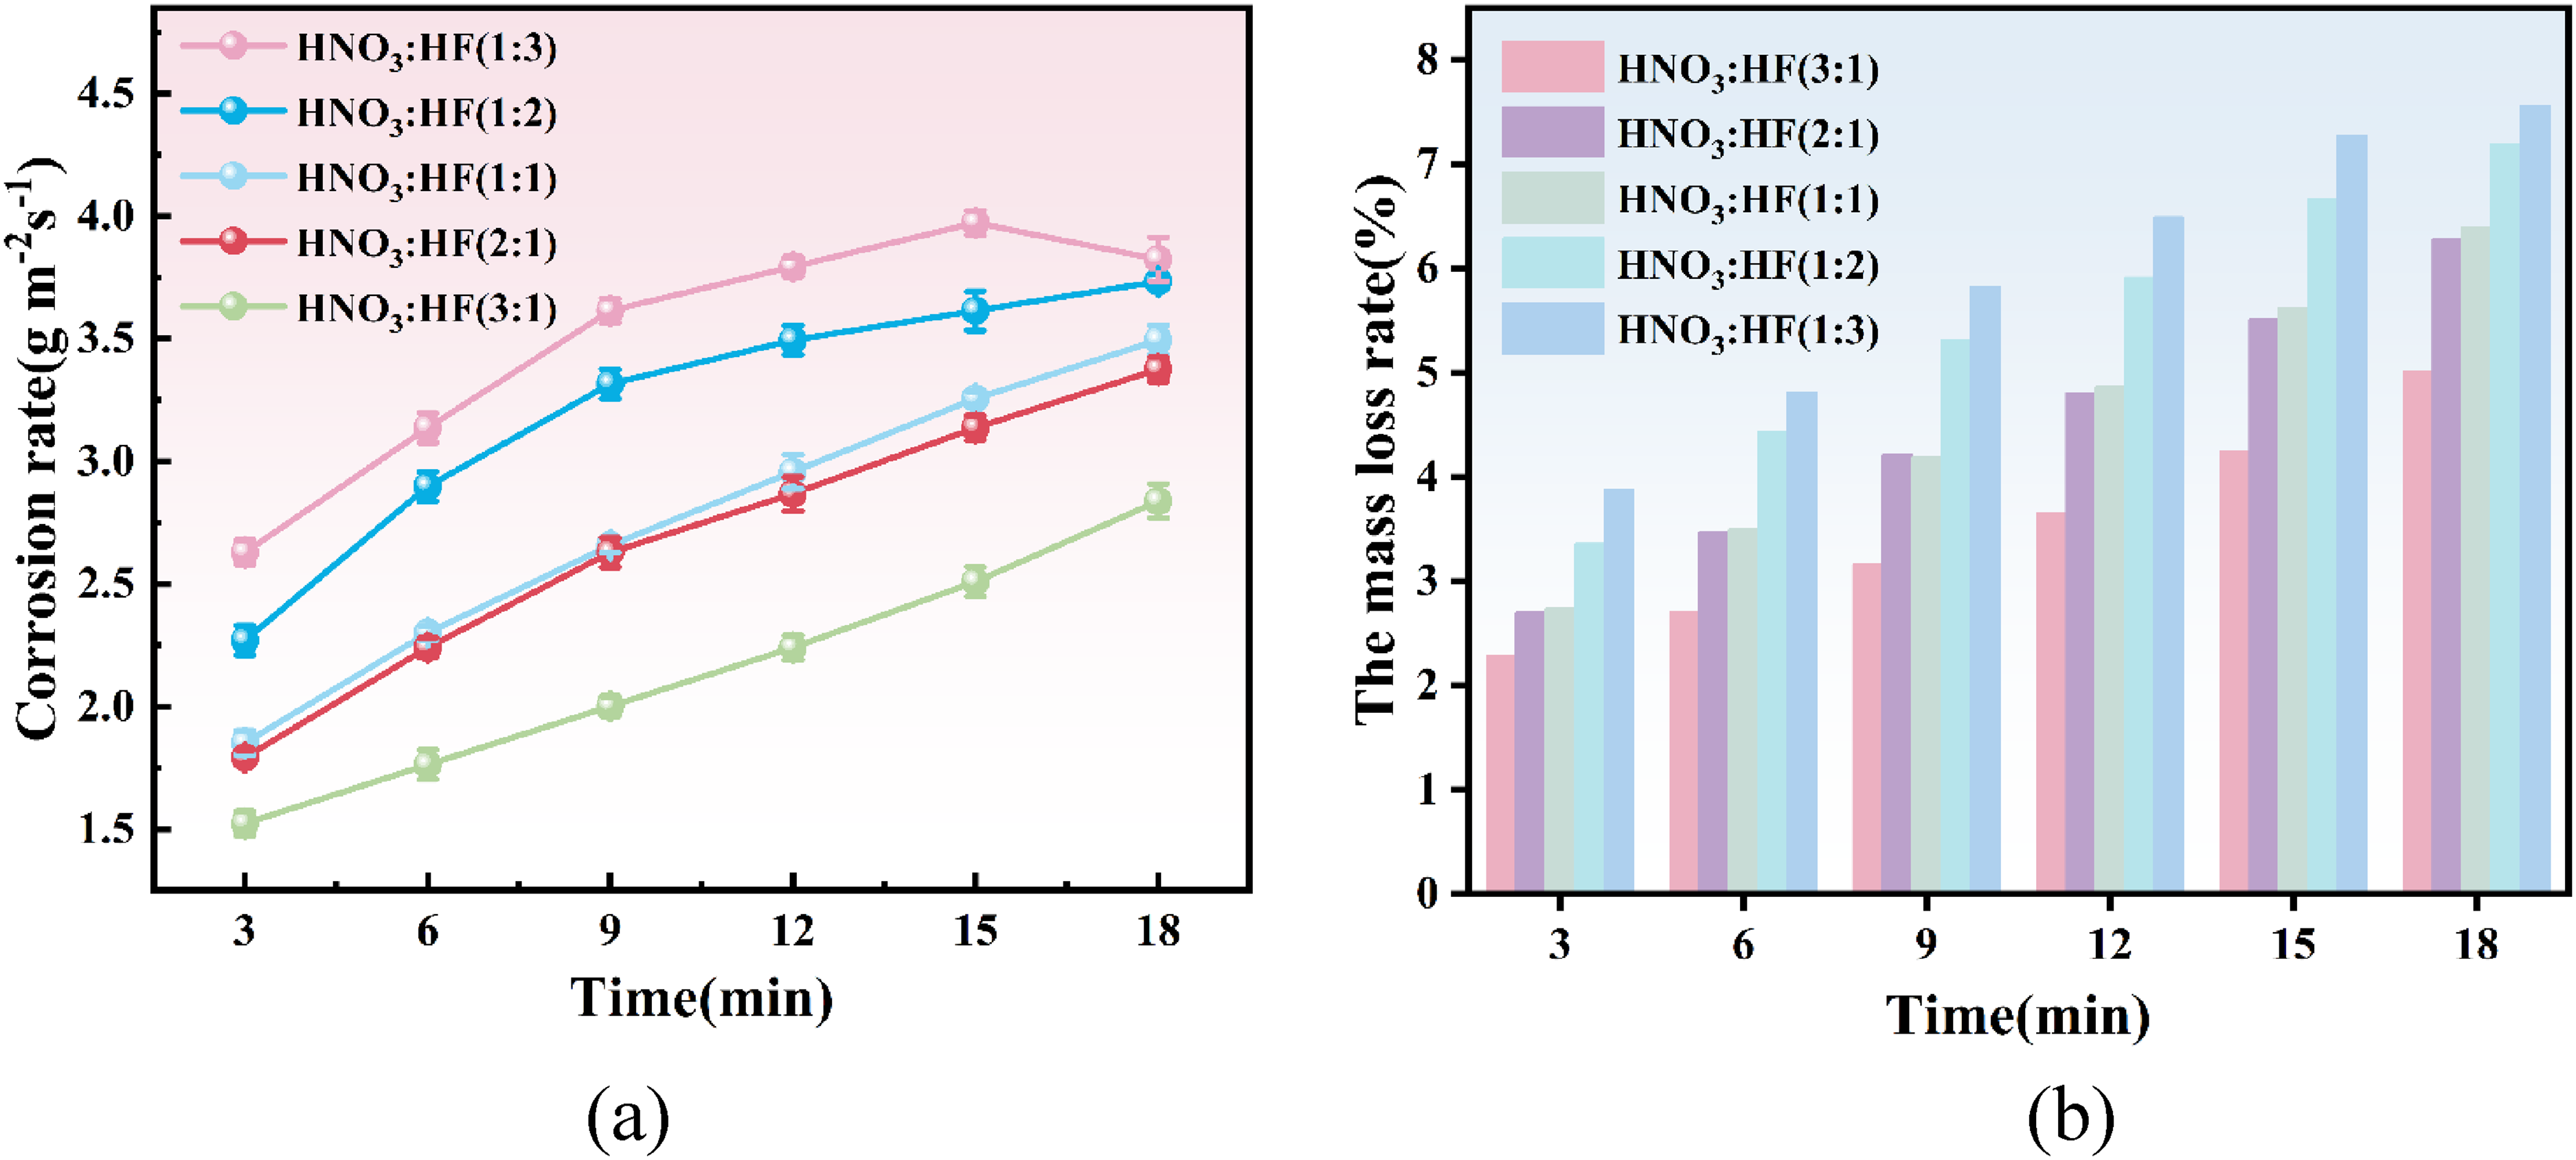
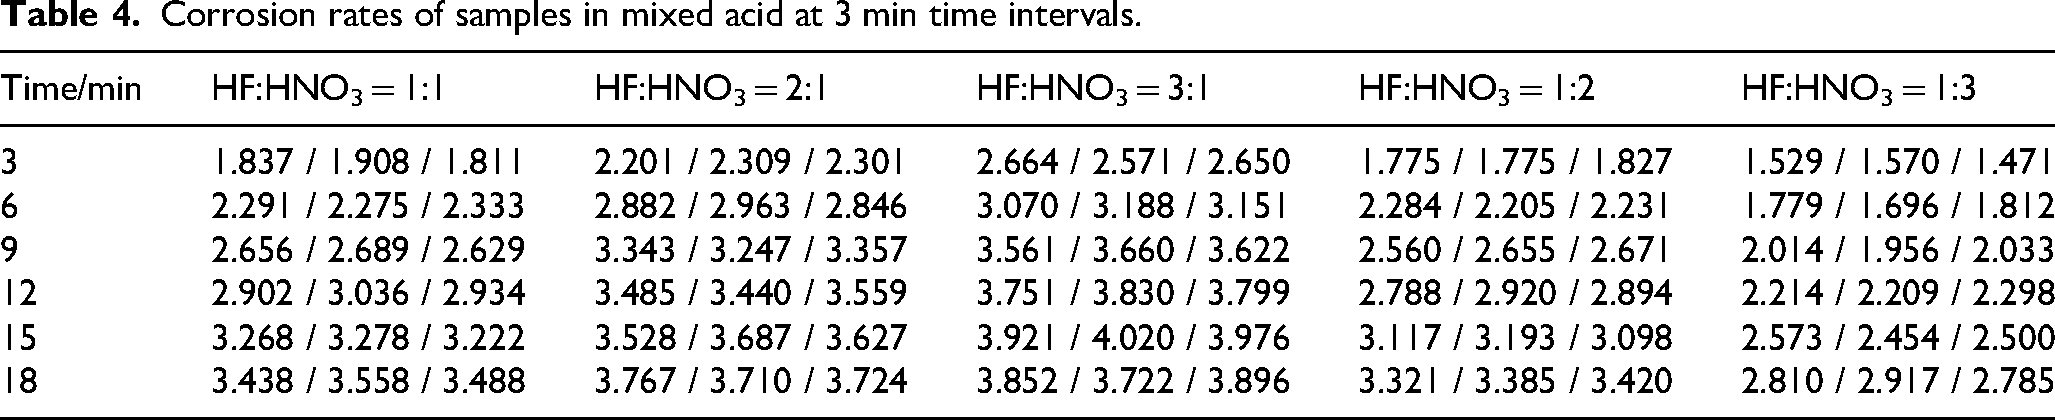
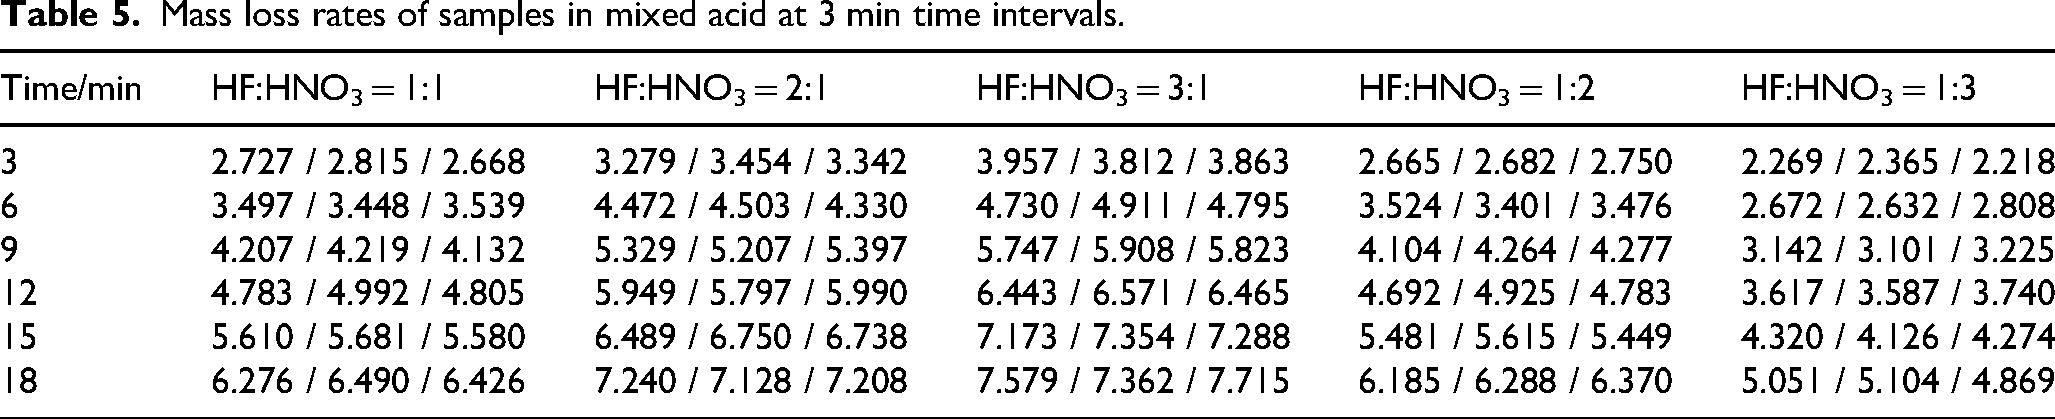
To systematically investigate the influence of mixed acid ratios (nitric acid and hydrofluoric acid) on the corrosion behaviour of titanium alloys, this study employed the weight loss method to precisely measure the mass changes of specimens after corrosion testing. Based on the mass loss data, corrosion rates and mass loss rates were calculated for different acid mixtures, with detailed results presented in Tables 4 and 5. The corresponding trend curves showing the variation of corrosion rates and mass loss rates with acid ratios are depicted in Figure 8.
Mass loss rates and corrosion rates of samples in HF-HNO3 mixed acid.
Corrosion rates of samples in mixed acid at 3 min time intervals.
Mass loss rates of samples in mixed acid at 3 min time intervals.
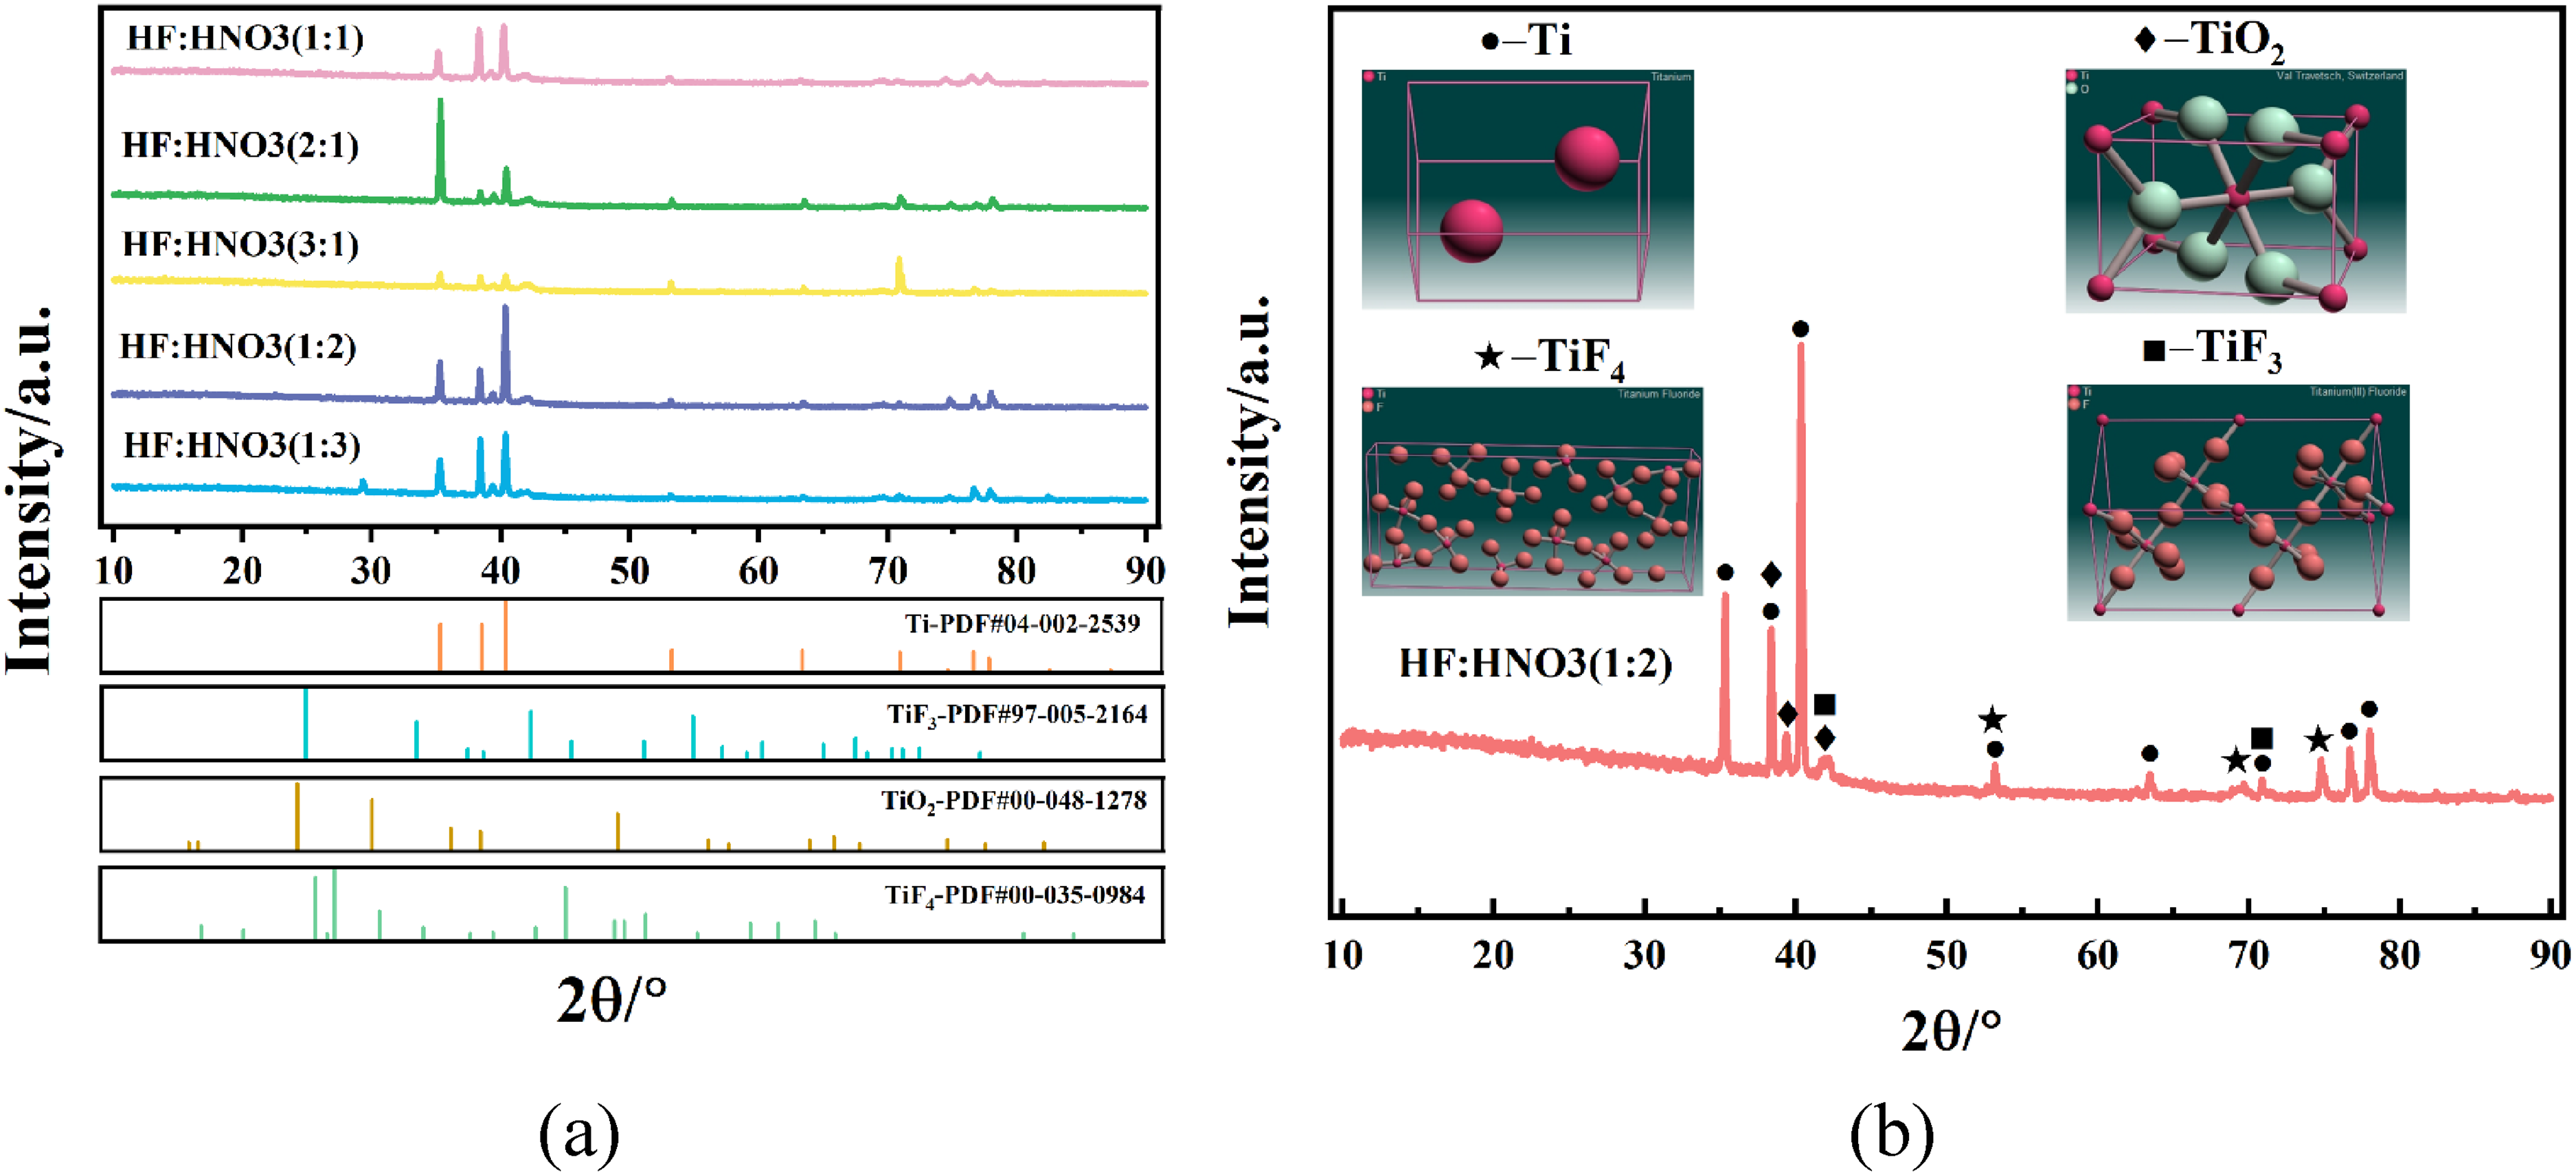
The quality loss rate is calculated using the following formula
66
:
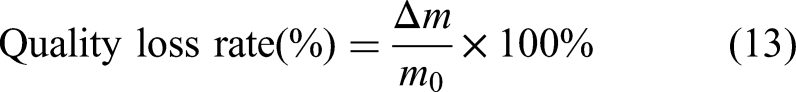
where Δm denotes the difference obtained by subtracting the instantaneous mass from the initial mass, m0 represents the initial mass of the sample (g) and m₁ denotes the mass of the cleaned corrosion specimen (g).
The corrosion rate can be calculated from the mass loss using the following formula
66
:
where S represents the surface area of the specimen (m2), Vcorr denotes the average corrosion rate (g·m−2·s−1) and t indicates the immersion corrosion time (s).
Analysis results indicate that both the corrosion rate and mass loss rate of the specimens generally increase with prolonged corrosion duration. During the initial corrosion stage, the mixed acid solution primarily reacts with the titanium oxide film (TiO₂) on the titanium alloy surface. Once the oxide layer dissolves, the acid solution further erodes the exposed titanium substrate, accelerating the corrosion process. Notably, when HF:HNO3 = 3:1, the corrosion rate decreased during the final 3 min. This may result from the HF concentration in the reaction system reaching a depletion threshold, reducing the amount of acid solution participating in effective corrosion reactions. The corrosion rate strongly depends on the volume ratio of HNO3 to HF in the mixed acid. The HF:HNO3 = 3:1 group exhibited the highest corrosion rate at all time points, indicating that high-concentration HF rapidly disrupts surface structures and promotes rapid dissolution of titanium. Conversely, the HF:HNO3 = 1:3 group exhibited the lowest and most stable corrosion rate. This is primarily attributed to the strong oxidising and passivating effects of high-concentration HNO3, which significantly suppressed the progression of the corrosion reaction.
To evaluate changes in the microstructure of the sample surface, electron microscopy observations were conducted. Figure 9 shows SEM images of the TA15 alloy after corrosion in mixed solutions of nitric acid and hydrofluoric acid at different ratios. All images exhibit typical material loss and morphological changes, but significant morphological differences are observed under varying acid ratios. The surface of the sample with a high HF ratio exhibits numerous dark pits, grooves and coarse protrusions. Local magnifications reveal severe selective corrosion in these areas, likely corresponding to rapid dissolution at grain boundaries, phase boundaries or defects. The high HF concentration causes intense localised corrosion with the fastest corrosion rate but results in high surface roughness.

Microstructural morphology of samples corroded by mixed acid solutions with different volume ratios (a) HF:HNO3 = 1:1; (b) HF:HNO3 = 2:1; (c) HF:HNO3 = 3:1; (d) HF:HNO3 = 1:2; (e) HF:HNO3 = 1:3.
These morphological observations can be mechanistically explained by the chemical interactions between the mixed acid and the titanium substrate. As reported in recent corrosion studies,66,67 F− ions exhibit an exceptionally strong chemical affinity for Ti. They readily penetrate the natural TiO2 passive film and react to form highly soluble fluorotitanate complexes, such as [TiF6]2−. This aggressive, localised active dissolution continuously extracts Ti atoms from the lattice, driving the rapid formation of the observed macroscopic corrosion pits at high HF concentrations. In contrast, the surface of the high nitric acid ratio sample (e.g., at an HF: HNO3 ratio of 1:3) appeared relatively flat and uniform. Magnification revealed fine, uniformly distributed shallow pits without large pits or cracks. Additionally, the blocky and flaky structures visible in the magnified image may represent either deposited corrosion products (e.g., TiF4, TiF3) or exposed titanium substrate morphology. The addition of sufficient HNO3 significantly alters the dissolution dynamic. Acting purely as a potent oxidising agent, 10 the abundant NO3− ions provide strong oxidising power that directly accelerates the repassivation process. This promotes the rapid formation of a thick, dense TiO2 passivation layer on the surface, which significantly inhibits severe corrosion. Consequently, this dynamic balance between F−-induced active dissolution and NO3−-promoted repassivation effectively suppresses localised attack, thereby stabilising the corrosion rate and yielding a uniformly milled, smooth surface.
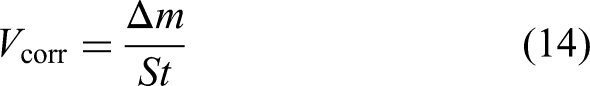
To systematically investigate the corrosion mechanism of TA15 titanium alloy in mixed nitric acid–hydrofluoric acid solutions at different ratios, the experiment employed energy-dispersive X-ray spectroscopy to perform elemental mapping analysis on the surfaces of corroded specimens (Figures 10 and 11). As shown in Figure 11, the elemental distribution on the corroded surfaces closely correlates with the acid volume ratios, which further confirms the ‘activation-passivation’ mechanism. In the HF-dominated solution (Figure 11(c), HF:HNO3 = 3:1), a dense distribution of F element is observed, indicating intense active dissolution and the formation the formation and retention of fluoride products such as TiF₄/TiF3. Conversely, in the HNO3-dominated solution (Figure 11(e), HF: HNO3 = 1:3), the surface shows a clear enrichment of N elements alongside a weakened F signal. This confirms that a higher HNO3 concentration promotes the rapid formation of a nitrogen-doped passivation layer, which effectively blocks F− ion penetration and suppresses further corrosion. Furthermore, the transition of elemental dominance from F to N across the intermediate ratios (Figure 11(a), 11(b) and 11(d)) is in excellent agreement with the atomic-scale molecular dynamics simulations. This confirms that macroscopic corrosion is controlled by the dynamic competition between HF-driven atomic dissolution and HNO3-promoted repassivation.

Energy dispersive spectroscopy surface scanning energy-dispersive spectroscopy images of samples corroded with mixed acid solutions of different volume ratios (a) HF:HNO3 = 1:1; (b) HF:HNO3 = 2:1; (c) HF:HNO3 = 3:1; (d) HF:HNO3 = 1:2; (e) HF:HNO3 = 1:3.
Energy dispersive spectroscopy surface scan element distribution map of samples corroded with mixed acid solutions of different volume ratios (a) HF:HNO3 = 1:1; (b) HF:HNO3 = 2:1; (c) HF:HNO3 = 3:1; (d) HF:HNO3 = 1:2; (e) HF:HNO3 = 1:3.
To investigate the effect of mixed acid solutions at different ratios on the surface roughness of corroded samples, the experiment measured the three-dimensional surface topography of corroded specimens using a Zygo optical profilometer. Among these measurements, Sa (arithmetic mean height) serves as an extended metric for Ra on the surface. As shown in Figure 12, surface roughness Sa increased from 0.277 to 0.313 μm with rising hydrofluoric acid concentration. This primarily resulted from the rapid formation of large bubbles on the sample surface under high-concentration hydrofluoric acid. The escape of these bubbles intensified pit formation, while the ongoing dissolution process led to the coalescence of corrosion pits, ultimately creating larger and deeper defects that significantly increased surface roughness. The presence of nitric acid mitigated the corrosive action of hydrofluoric acid, reduced bubble formation and prevented pitting caused by localised flaking of reaction products. Specifically, as nitric acid concentration increases, the surface progressively becomes smoother, with roughness Sa decreasing to 0.224 µm and 0.186 µm, respectively.

Three-dimensional surface morphology after corrosion of mixed acid solutions with different volume ratios (a) HF:HNO3 = 1:1; (b) HF:HNO3 = 2:1; (c) HF:HNO3 = 3:1; (d) HF:HNO3 = 1:2; (e) HF:HNO3 = 1:3.
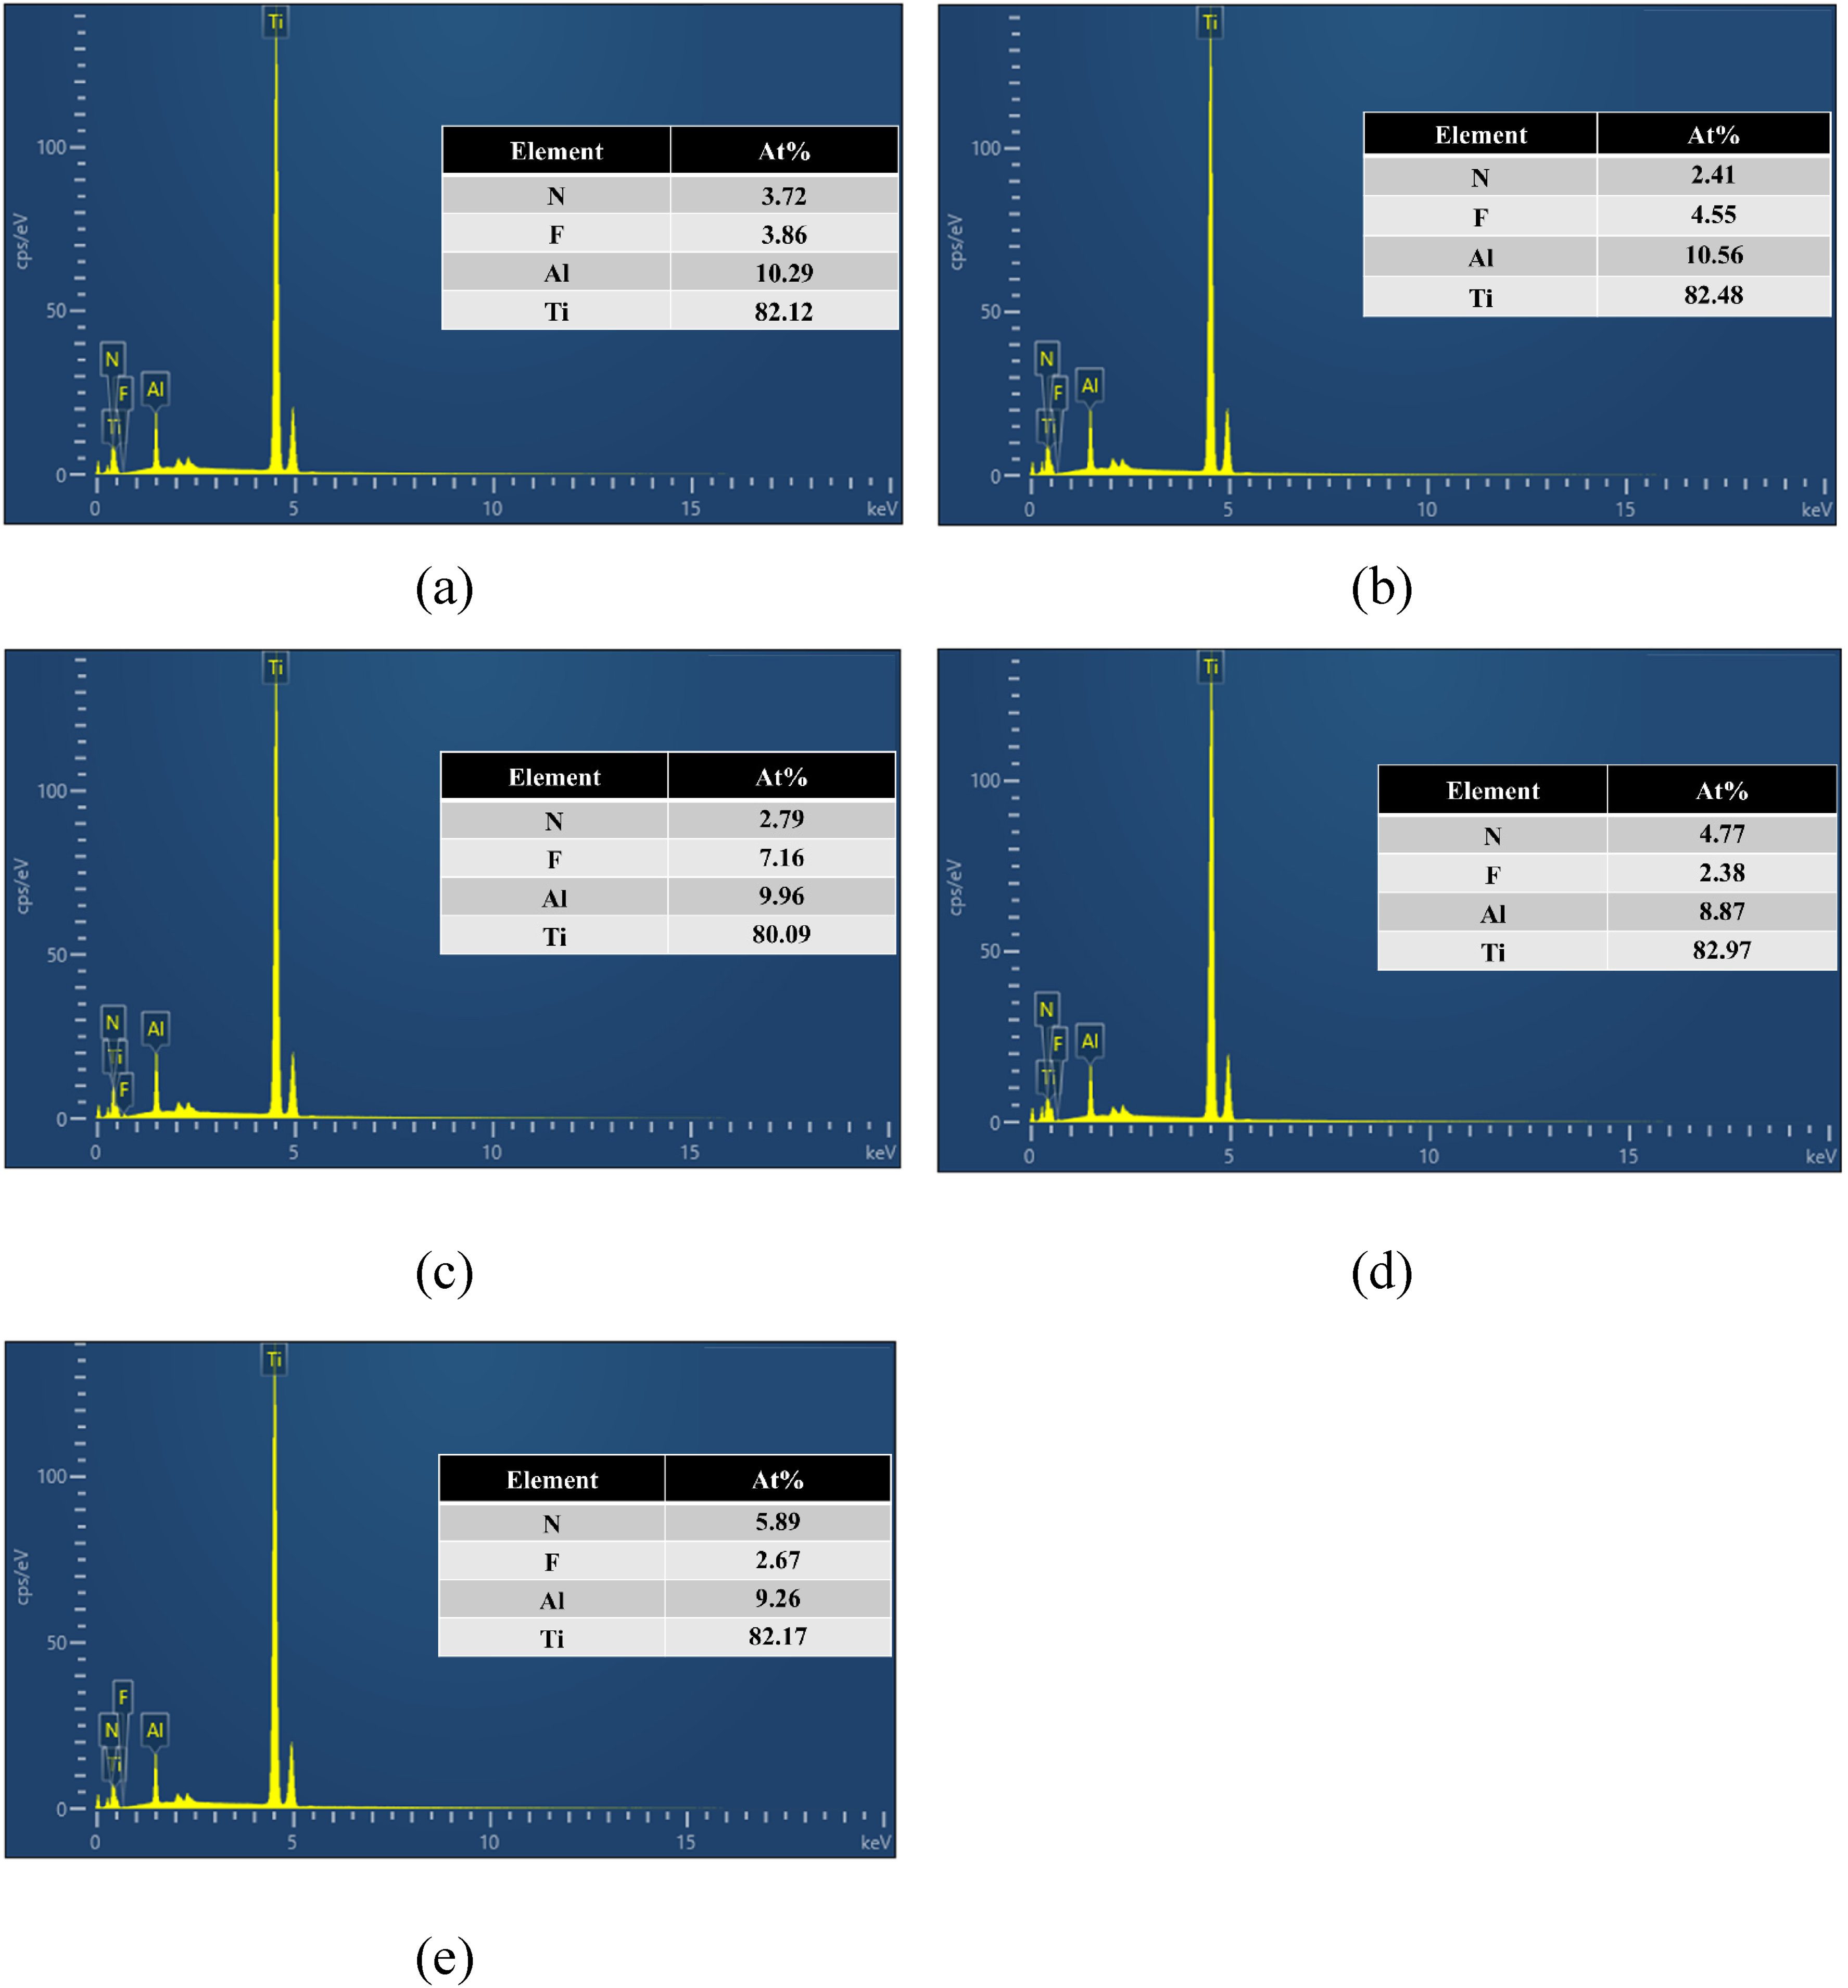
Subsequently, we conducted XRD analysis on the phase structure of the TA15 specimen after corrosion in mixed solutions of nitric acid and hydrofluoric acid at different ratios. The results are shown in Figure 13. The XRD diffraction patterns clearly indicate that the corroded titanium alloy surface primarily consists of a Ti matrix, TiO₂, TiF₄ and TiF3, with the main corrosion products being TiF3 and TiF₄. The positions of the diffraction peaks remained stable after corrosion, and the diffraction intensity showed a slight increase trend with extended corrosion time. When the HF proportion was higher, the diffraction peaks of TiF3 and TiF₄ were relatively stronger, while the TiO₂ peak was weaker. When the HNO3 proportion was higher, the TiO₂ diffraction peak significantly intensified, while the titanium fluoride peaks were relatively weaker.
XRD characterisation of specimens (a) XRD diffraction patterns of specimens after corrosion by mixed acid solutions with different volume ratios (b) phase diagram of specimens after corrosion in HF:HNO3 = 1:2 solution.
Due to titanium alloys’ high sensitivity to hydrogen, hydrogen embrittlement is one of their primary failure mechanisms. Consequently, hydrogen content in chemically milled components must be strictly controlled. To systematically investigate how different volume ratios of nitric acid and hydrofluoric acid affect hydrogen permeation behaviour in titanium alloys, this study measured hydrogen content in specimens corroded by mixed acids at varying ratios, with the results shown in Figure 14.
Hydrogen content in test specimens after corrosion by mixed acid solutions with different volume ratios.
The quantitative evaluation of hydrogen permeation presented in Figure 14 is of profound significance for establishing a reliable processing window during chemical milling. The figure indicates that hydrogen content is significantly regulated by the mixed acid ratio: the lowest hydrogen content was observed at HF:HNO3 ratios of 1:2 and 1:3, at 0.0056% and 0.0054%, respectively. Conversely, hydrogen content markedly increased with higher HF ratios (2:1 and 3:1), reaching 0.0107% and 0.0121%, respectively.
Titanium alloys are intrinsically highly susceptible to hydrogen embrittlement, with a critical failure threshold typically ranging from 0.01% to 0.0125%.68,69 The experimental data reveals that the HF:HNO3 ratio of 3:1 dangerously pushes the hydrogen content to 0.0121%. Exceeding this threshold may lead to the precipitation of hydride phases, which can trigger hydrogen embrittlement and catastrophic mechanical failure. Therefore, optimising the ratio to 1:2 is not merely conducive to achieving a superior surface finish but is fundamentally critical to preserving the structural integrity, mechanical reliability and overall service safety of the aerospace components.
To systematically investigate the corrosion behaviour of titanium alloys in mixed solutions of HNO3 and HF, and to precisely optimise their concentration ratio, the research builds upon the previously determined optimal volume ratio (HF:HNO3 = 1:2). Two additional concentration gradient experiments were designed to determine the optimal concentration range for each component. The specific experimental design is as follows:
With HNO3 concentration fixed at 15%, the system adjusts the HF concentration ratio. The gradient settings for HF concentration are: 4%, 5%, 6%, 7%, 8% and 9%. With HF concentration fixed at 8%, the system adjusts the HNO3 concentration relative to HF under these conditions. The gradient settings are: 8%, 10%, 12%, 14%, 16% and 18%.
To eliminate interference from the natural oxide film on the titanium alloy surface during corrosion rate measurements, all specimens underwent uniform acid pickling pre-treatment prior to experimentation. Subsequently, the mass changes of each specimen after corrosion testing were precisely measured using the gravimetric method. Based on the mass loss data, the corrosion rates for both sets of experimental specimens were calculated, with detailed numerical results presented in Table 6. The corresponding trend curves showing the variation of corrosion rates with acid concentration are depicted in Figure 15, visually revealing the nonlinear influence of the HF:HNO3 concentration ratio on the corrosion rate of the titanium alloy.
Relationship curves between HF and HNO3 concentration gradients and the corrosion rate of TA15 titanium alloy.
Corrosion rate of TA15 titanium alloy under HF and HNO3 concentration gradient experiments.
The results indicate that at a fixed HNO3 concentration of 11%, the weight loss rate of the specimens continuously increases with rising HF concentration. This trend demonstrates that HF plays a dominant activating role in the corrosion process, with its elevated concentration significantly promoting the dissolution reaction of the titanium alloy. Conversely, at a fixed HF concentration of 8%, the weight loss rate of the specimens first increases and then decreases as the HNO3 concentration rises. This nonlinear variation stems from the dual effect of nitric acid: at lower concentrations, HNO3 primarily promotes corrosion through its strong oxidising properties. However, once its concentration exceeds a critical threshold, excess nitric acid preferentially induces the formation of a dense passivation layer on the metal surface. This layer effectively inhibits further corrosion, thereby reducing the weight loss rate.
By empirically fitting the experimental data obtained in this study (as shown in Figure 15), fourth-order polynomial functions describing the corrosion rate of the TA15 sample as a function of hydrofluoric acid and nitric acid concentrations were derived as follows:
Relationship between corrosion rate and HF concentration: Relationship between corrosion rate and HNO3 concentration:


Ultimately, after comprehensively evaluating factors such as corrosion rate, surface roughness and hydrogen embrittlement risk control, the optimal corrosion solution formulation for this experiment was determined to be: 8% hydrofluoric acid concentration and 14% nitric acid concentration. This ratio not only achieves high material removal efficiency but also significantly improves surface uniformity while effectively suppressing hydrogen embrittlement. Furthermore, the results of this study align with previous research,7,8 further supporting the feasibility of this ratio for chemical milling of titanium alloys.
Ultimately, the established atomistic-to-macroscopic correlation provides a robust theoretical framework for the aerospace industry to rationally design chemical milling fluids. By precisely controlling the mixed-acid formulation based on this mechanism, manufacturers can enable high-precision fabrication while strictly guarding against catastrophic hydrogen embrittlement failures, thereby ensuring the long-term structural integrity and service safety of titanium alloy components.
While the current study provides profound insights into the competitive corrosion mechanisms of TA15 titanium alloy in mixed HF-HNO3 solutions, it still has certain limitations regarding real-world engineering applications. Specifically, this research primarily focused on corrosion behaviours within static acid solutions and did not dynamically control the temperature fluctuations during the highly exothermic chemical milling process. In actual industrial manufacturing, fluid hydrodynamics and temperature variations can significantly alter the localised activation–passivation balance and the resulting surface integrity. Therefore, future work will focus on investigating flow-induced corrosion mechanisms under dynamic hydrodynamic conditions and developing precise temperature-controlled systems. This future scope will further bridge the gap between fundamental mechanisms and practical process optimisation for complex aerospace components.
Conclusions
In summary, the research systematically investigated the mechanism by which mixed nitric acid–hydrofluoric acid solutions at different concentrations affect the corrosion behaviour of TA15 titanium alloy through a combination of molecular dynamics simulations and experimental verification. It comprehensively examined the regulatory patterns of acid ratio and concentration changes on the material's microstructure, corrosion rate and surface roughness, providing a critical theoretical foundation and data support for optimising the chemical etching process of TA15 titanium alloy. The main research findings are as follows:
Molecular dynamics simulations revealed the competitive corrosion mechanism at the atomic scale, confirming that F− acts as an activator while NO3− promotes passivation. An increase in HF proportion (from HF:HNO3 = 1:3 to 3:1) significantly elevates the diffusion coefficient of Ti atoms (from 2.84 × 10⁻⁵ to 5.26 × 10⁻⁵ at 300 K) and exponentially enhances the hydrogen absorption capacity into the lattice. The mixing ratio of HF to HNO3 strictly dictates the macroscopic corrosion quality. A high HF ratio (HF:HNO3 = 3:1) yields rapid dissolution but results in deep pitting with high surface roughness (Sa = 0.313 μm) and pushes the hydrogen content to a critical limit (0.0121%), severely elevating hydrogen embrittlement risks. Conversely, a high HNO3 ratio (HF:HNO3 = 1:3) produces a superior smooth surface (Sa = 0.180 μm) with low hydrogen absorption (0.0054%) due to the formation of a dense passivation layer. After a comprehensive evaluation of corrosion kinetics, surface integrity and hydrogen embrittlement constraints, the optimal chemical formulation was determined to be 8% HF and 14% HNO3. This formulation achieves a stable and highly efficient corrosion rate of 3.405g·m−2·s−1.
Footnotes
Acknowledgements
This work was supported by National Key Research and Development Program of China (2024YFB4610201), National Natural Science Foundation of China (12372191, 52332012).
Authors’ contribution
Zelong Yu contributed writing – original draft, data curation, methodology and formal analysis. Zhenhe Yu contributed to validation. Xu Guo contributed to writing – review & editing. Zhao Zhang contributed to writing – review & editing, supervision, funding acquisition and project administration.
Funding
The authors disclosed receipt of the following financial support for the research, authorship and/or publication of this article: This work was supported by the National Key Research and Development Program of China, (grant number 2024YFB4610201).
Declaration of conflicting interests
The authors declared no potential conflicts of interest with respect to the research, authorship and/or publication of this article.