
Abstract
This study investigates recurrent leakage failures that occurred at nearly identical locations in 1Cr18Ni9Ti stainless steel pipes from multiple aircraft. Surface analyses reveal characteristic damage features: an inner-surface ‘valley’ with honeycomb-like craters and facets, contrasting with a single outer-surface perforation. The failure process involves progressive pit initiation, followed by the nucleation and multidirectional growth of fatigue cracks. Cavitation erosion is identified as the primary failure mode, whereby cumulative bubble collapse progressively reduces wall thickness. Simulations using AMESim and oil–gas two-phase flow models demonstrate that a sudden pressure drop creates low-pressure regions and promotes gas accumulation on the inner side of the pipe bend. These findings are consistent with the observed failure location and mode. Optimized design modifications are proposed and validated to enhance cavitation resistance of the pipe and prevent such failures.
Introduction
Hydraulic systems are critical for transferring fluid and energy within aircraft.1,2 Key components, such as the pressure pump and reservoir, are inter-connected by numerous metallic pipelines and a limited number of polytetrafluoroethylene (PTFE) flexible hoses. However, aviation hydraulic pipelines are susceptible to pre-mature failure, potentially leading to mid-air incidents, due to the combined effects of harsh environmental conditions, material properties, and structural configurations. Consequently, extensive research has focused on understanding the underlying damage mechanisms and dynamic behaviours to enhance aircraft safety and reliability.3–7
During operation, the dominant failure modes of aircraft hydraulic systems are seepage and leakage, typically caused by joint deformation, fractures, or cracks.8–10 While spatial constraints often require multiple bends in metallic pipes, fatigue fractures frequently originate at the tubular joints rather than at the bends. These failures arise from the complex interplay of various factors. Contributing factors include material properties, pipe geometry, residual stresses induced during manufacturing and assembly, internal and external loading conditions, as well as the operating environment.11–15
Cavitation erosion is another critical failure mechanism in hydraulic systems. It is a surface degradation process resulting from mechanical impact, chemical corrosion, or their synergistic combination. Prolonged cavitation erosion can induce progressive wall thinning, ultimately resulting in structural perforation, as well as increased vibration and elevated noise levels. This phenomenon commonly occurs in flow-passage components, such as pumps, valves, and reducers, that are subjected to significant pressure fluctuations.16–20 Limited cases have been reported in the connecting metallic pipes or hoses between these components. For instance, Chen et al. 21 reported severe cavitation erosion due to mechanical impact in several PTFE hoses on a specific aircraft. The damage was observed on the side of the PTFE hose nearest to the hydraulic pump. Their analysis revealed that a local low-pressure zone near the suction port causes the pressure to fall below the oil and gas separation pressure, and bubbles then precipitate out from the fluid.22,23 Subsequently, when an instantaneous high-flow demand occurs at the load end, the hydraulic pump swash plate adjustment quickly increases suction, imploding these bubbles and causing mechanical impact on the hose wall.
This paper identifies the dominant degradation mechanism as cavitation erosion leading to recurrent leakage failures in a specific 1Cr18Ni9Ti hydraulic pipe for aircraft by surface damage evaluation. Previous studies have extensively investigated cavitation erosion mechanisms across various materials, as well as the efficacy of surface treatment improvements, through laboratory-scale cavitation testing.24–30 In addition, computational simulation methods have been investigated to reveal the multi-bubble cavitation mechanisms and to predict and control the cavitation erosion.31,32 A systematic analysis was conducted on a high-pressure ball valve to explore the link between cavitation behaviour and the erosion failure. 33 Ochiai et al. proposed a numerical prediction method of cavitation erosion intensity by using two-dimensional (2D) cavitating flow around the Clark Y 11.7% hydrofoil. 34 However, the inherent structural risk of cavitation along the hydraulic suction pipelines under real-world operating conditions remains inadequately understood within the aviation industry. Consequently, it is difficult to predict and prevent cavitation erosion and the leakage failures it causes, as exemplified by the case investigated in this work.
The purpose of this study is to elucidate the underlying causes of localised oil pressure drops that initiate cavitation in the specific 1Cr18Ni9Ti hydraulic suction pipe utilising flow simulations, and to subsequently propose design modifications to mitigate cavitation-induced damage and enhance the durability of the hydraulic pipeline.
Materials and methods
The failed pipe and materials
Recurrent leakage failures occurred at nearly identical locations within a specific hydraulic suction pipeline across multiple aircraft of the same model. The pipeline failed by perforation after approximately 200 service hours, which is less than one-tenth of its designed service life. As shown in Figure 1, the suction line extends from the pressurised reservoir to the hydraulic pump, comprising multiple serially connected stainless steel pipes with bends followed by a flexible hose, with joints at each interface. During operation, the rotating pump creates suction that draws hydraulic fluid from the reservoir through the suction line. The working pressure of the suction line is relatively low, at approximately 0.35–0.4 MPa. Further details regarding the geometric parameters of the suction pipeline can be found in the ‘Calculation method’ section.
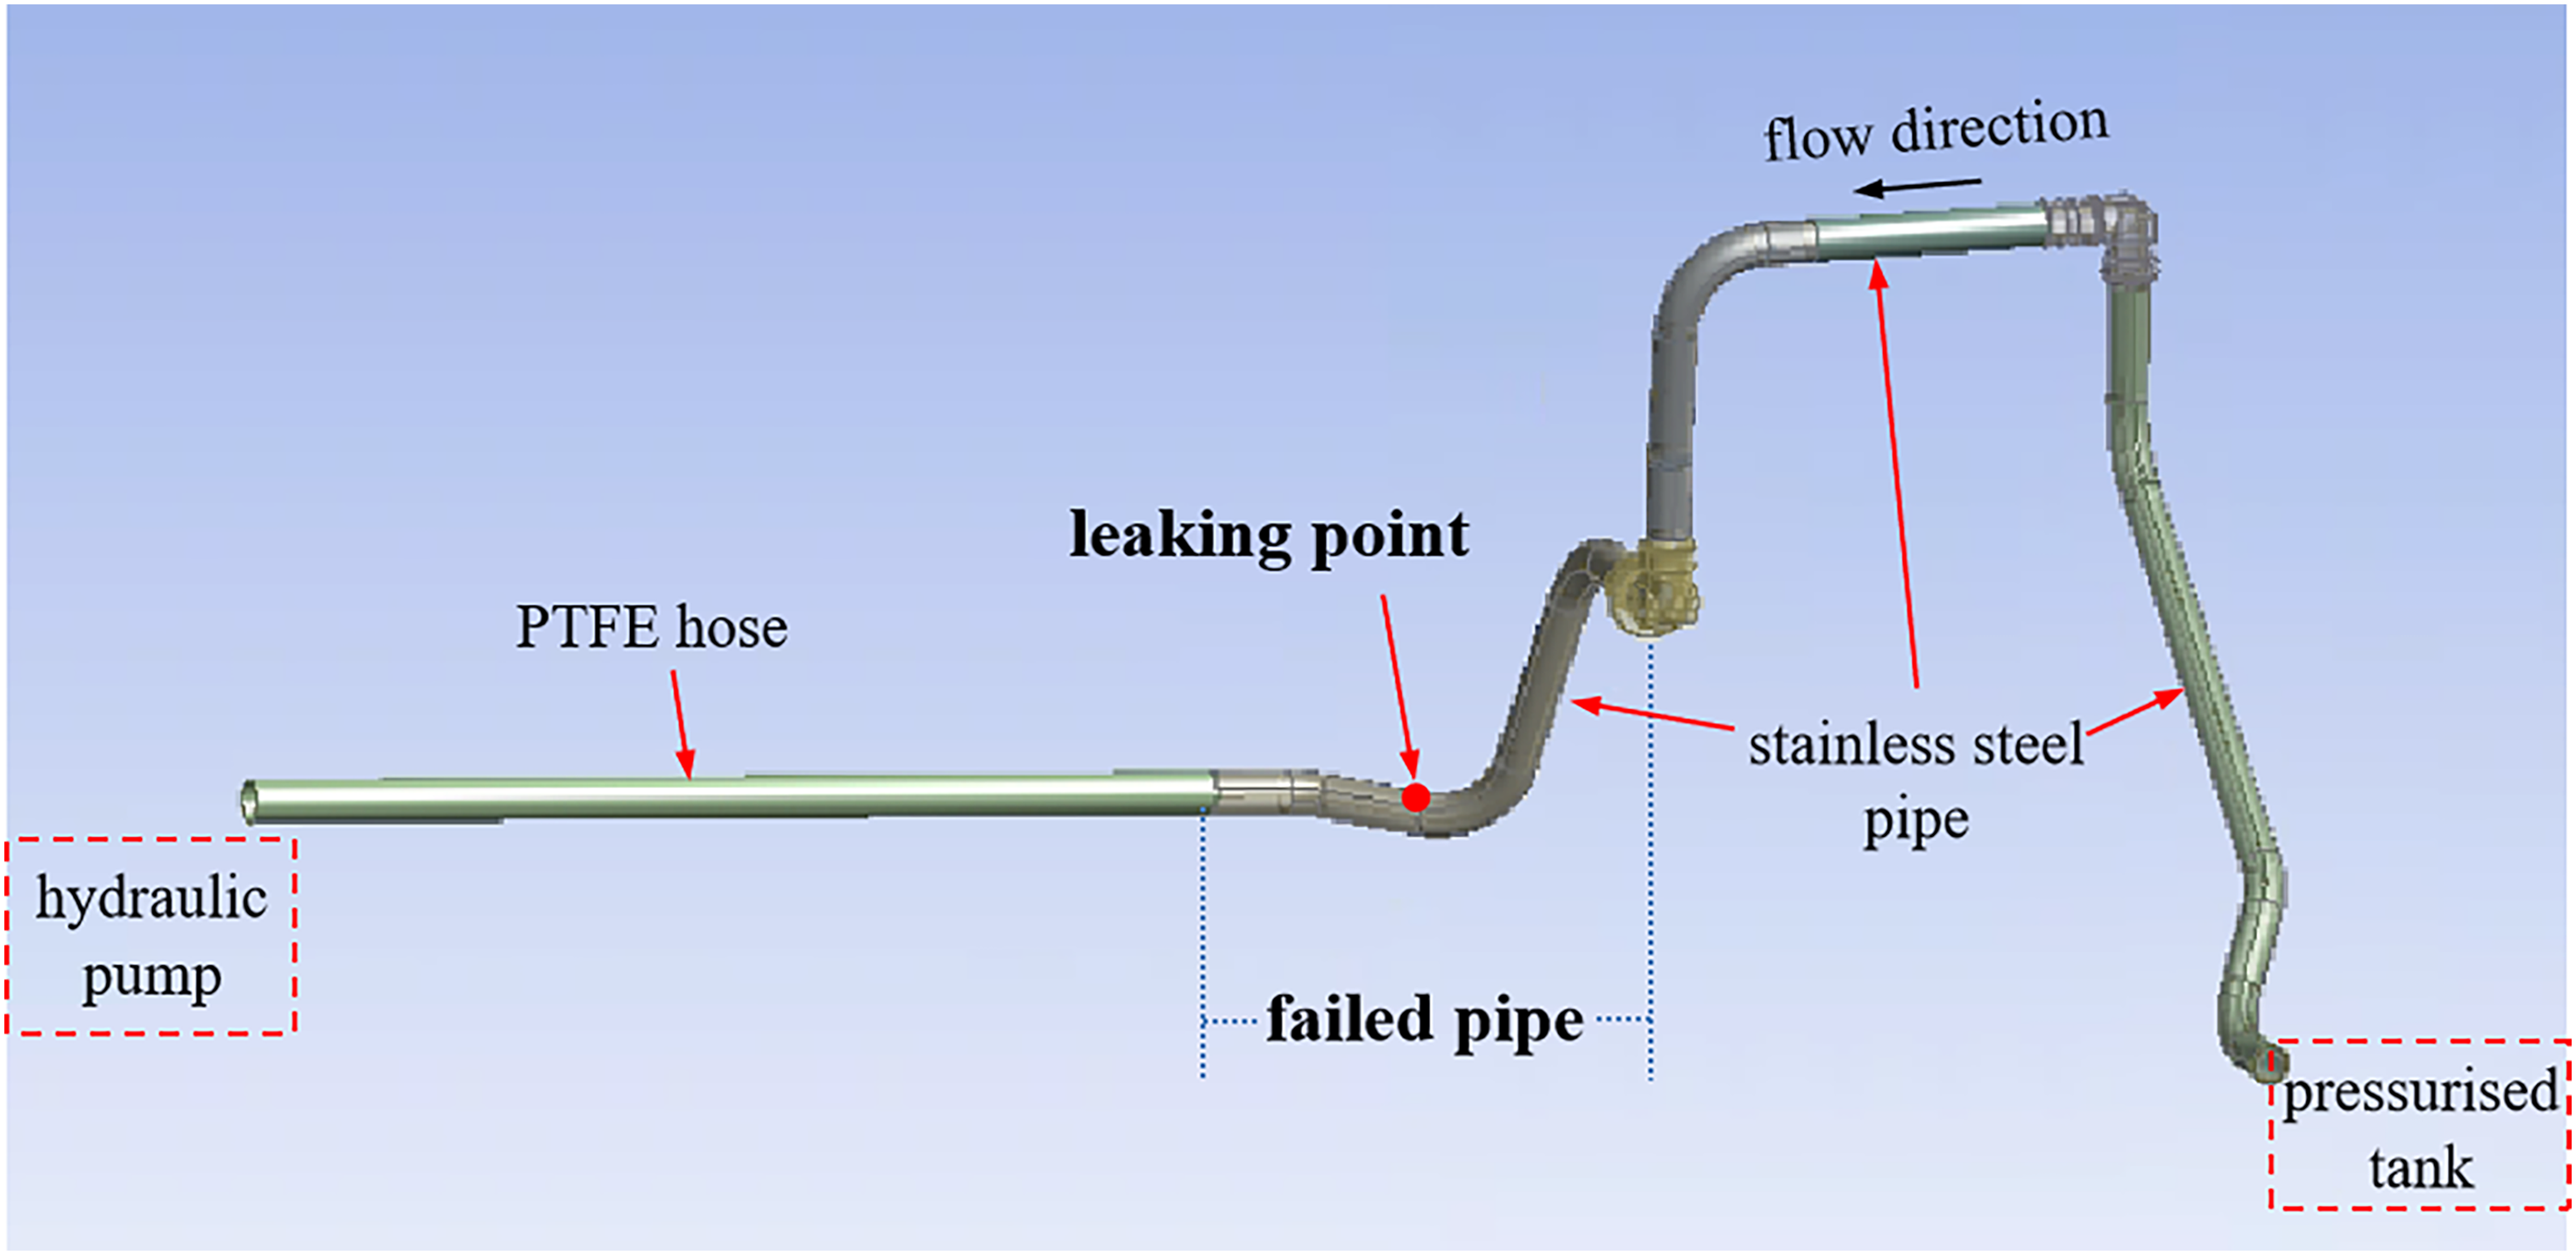
Schematic of the failed pipe along the hydraulic flow line.
Besides the failed pipe, all other pipes and hoses in the same hydraulic line, along with those in other hydraulic lines in the same aircraft, were thoroughly examined using a borescope. The inspection revealed that this specific damage was confined to the failed component and its position. All failed pipes exhibited the same failure mode at approximately the same location, with inner damage severity and depth positively correlated with service time. Accordingly, pipes representing different service durations were selected for detailed investigation.
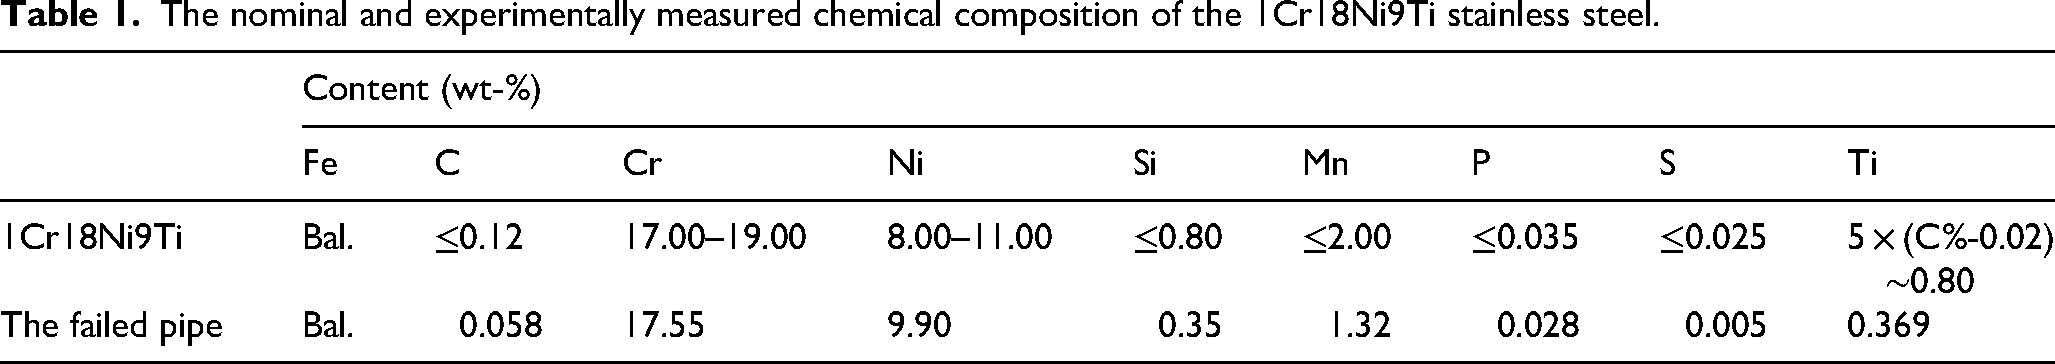
The failed component was manufactured from 1Cr18Ni9Ti austenitic stainless steel, because of its high strength at elevated pressures, excellent erosion resistance, and good plastic formability. As the failed pipes were manufactured from distinct material batches, defects in the raw material, such as inclusions or shrinkage cavities, can be reasonably excluded as the root cause. The nominal and experimentally measured chemical compositions of the 1Cr18Ni9Ti stainless steel are listed in Table 1. The failed pipe has an outer diameter of 30 mm and a wall thickness of 1 mm.
The nominal and experimentally measured chemical composition of the 1Cr18Ni9Ti stainless steel.
Experimental method
The macroscopic morphology of the failed pipe was observed using optical microscopy (OM). Scanning electron microscopy (SEM, Zeiss Sigma 300) was employed to characterise the microscopic features of the damaged surfaces, while an energy-dispersive spectrometer (EDS, Oxford Instruments) was used to detect the presence of foreign elements. X-ray computed tomography (CT, NanoVoxel-5000) was also performed to reconstruct the three-dimensional (3D) morphology of the leakage path.
Calculation method
The suction line of the hydraulic system was modelled using one-dimensional (1D) simulation in AMESim and 3D computational fluid dynamics (CFD) in Fluent.
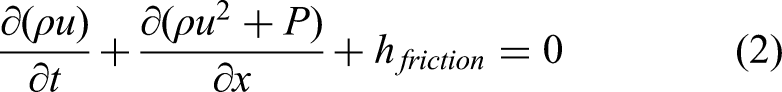
The pipeline model in AMESim is based on the HLG0020D ‘hydraulic line CFD 1D Lax–Wendroff’ with the following model equations: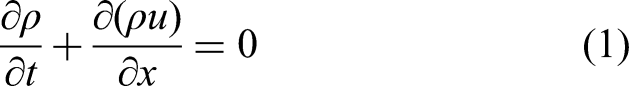
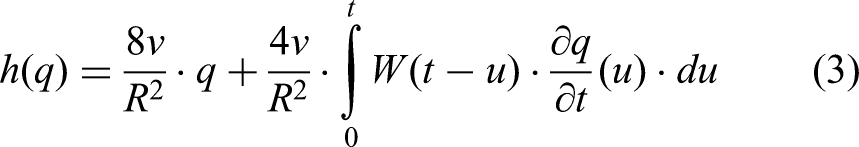
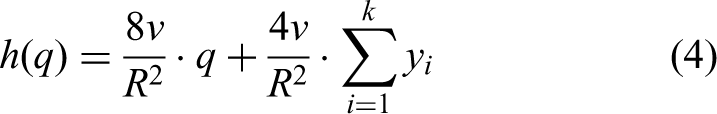
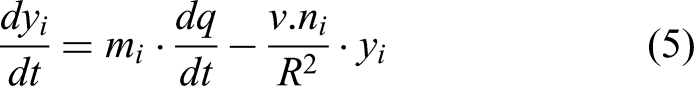
The total length of the hydraulic system suction line is 3 m. The hydraulic oil's properties are as follows: fluid density = 850 kg m−3, bulk modulus of elasticity = 1300 MPa, kinematic viscosity = 1 × 10⁻⁵ m2 s−1, and operating pressure = 0.35 MPa. The resulting AMESim simulation model is shown in Figure 2. The notation ‘Pipe 0.1 m φ27 × 1’ in Figure 2 denotes a pipe with a length of 0.1 m, an outer diameter of mpa##8197;27 mm, with wall thickness of 1 mm. These pipes are connected using joints with different angles.
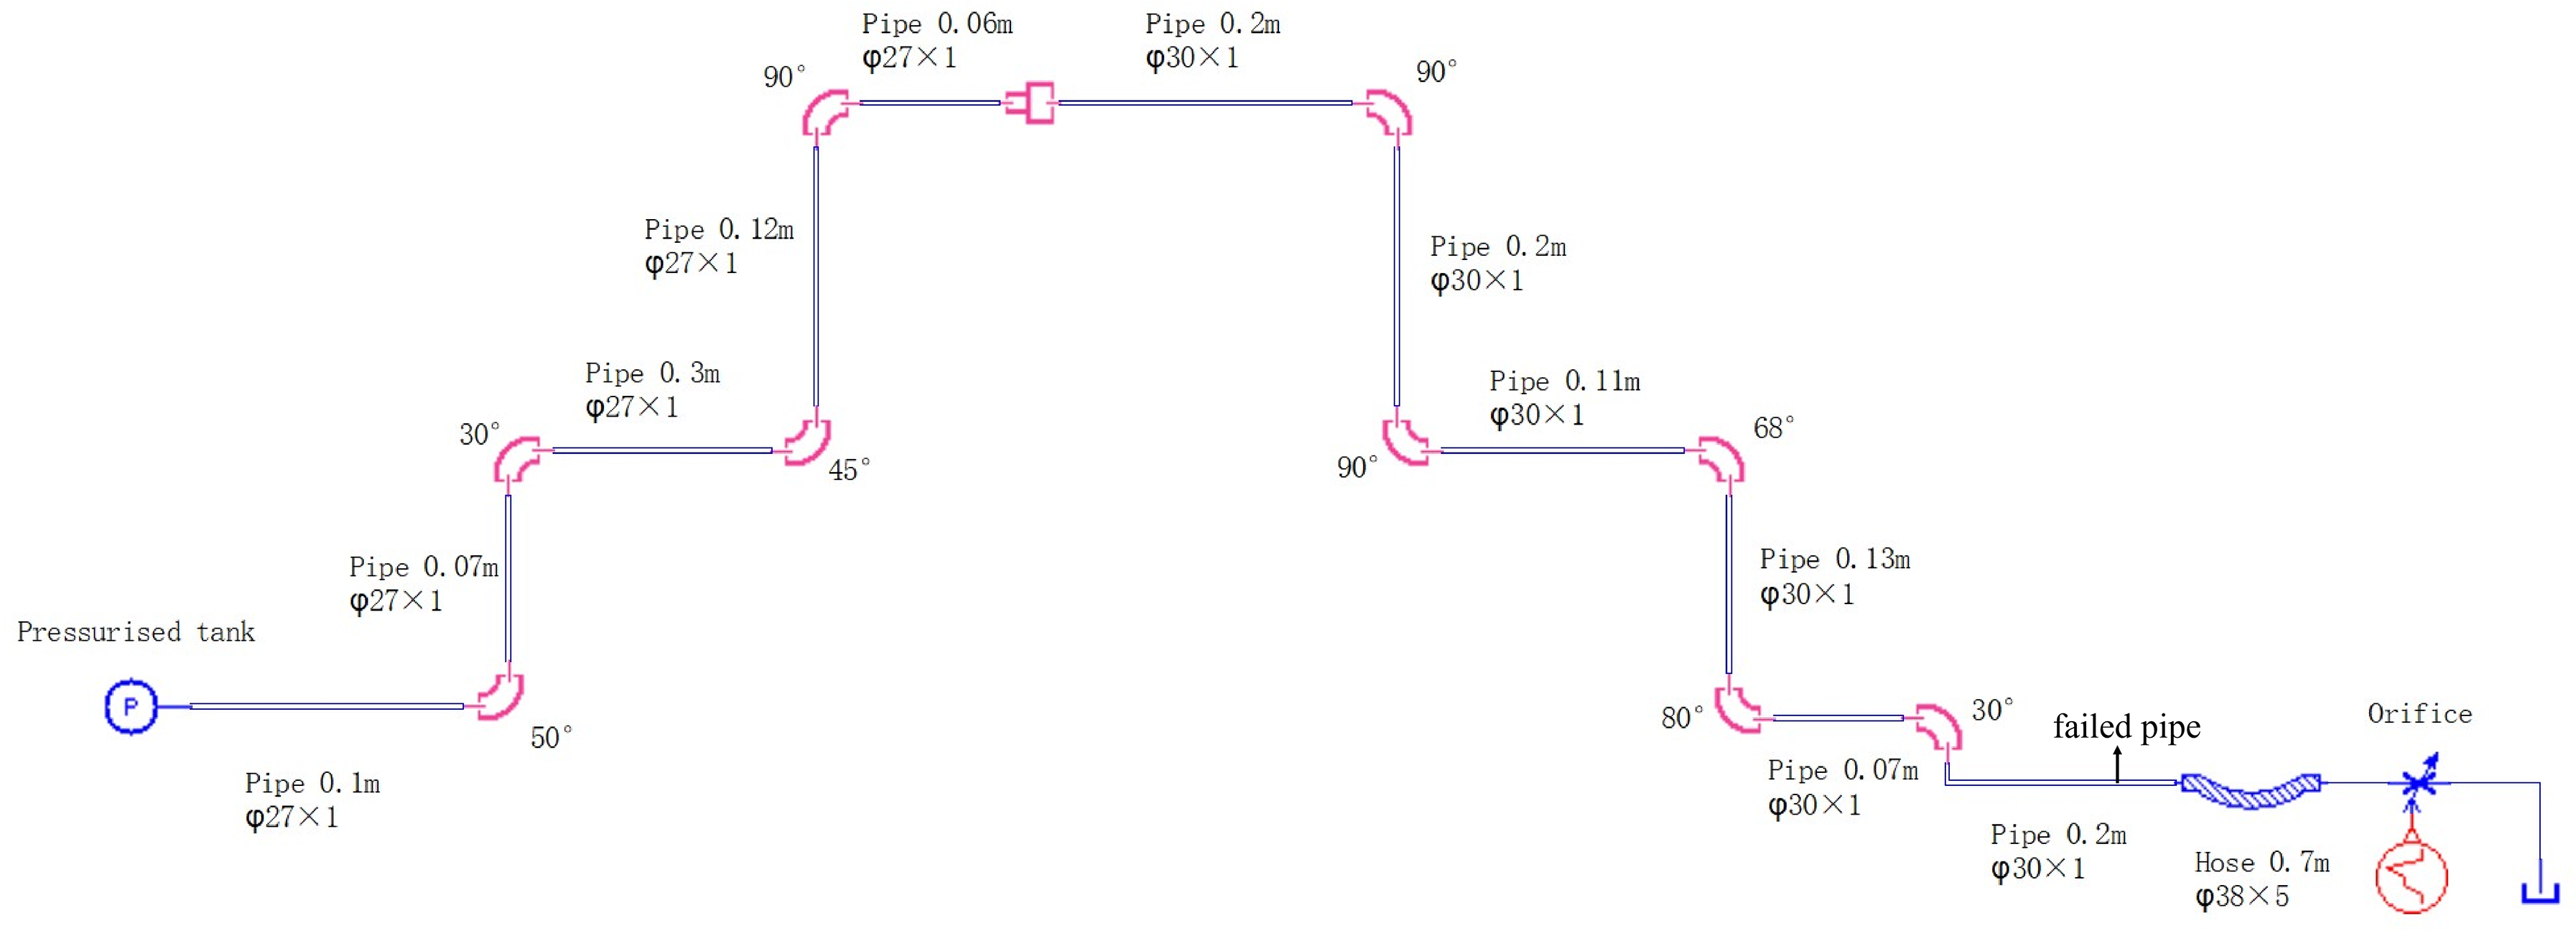
AMESim simulation model of the suction line.
The simulation begins with a stable, low-flow rate. The flow rate increases instantaneously as the opening of the load valve is suddenly increased, enabling real-time analysis of the resulting pressure transients within the pipeline. This method models the sudden flow change at the suction port of the hydraulic pump by dynamically adjusting the valve's opening size. The response time of the pump is simulated by controlling the time interval over which the valve opening is changed.
The 3D simulation employed the mixture model in Fluent to model the oil–gas two-phase mixture flow. The governing equations for the fluid are the continuity equation and the momentum equation. Additional turbulence equations are also required for turbulent flow conditions.
Continuity equation: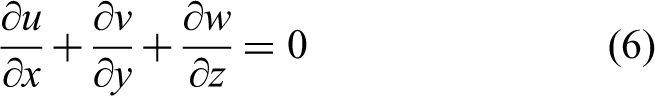
Momentum equation: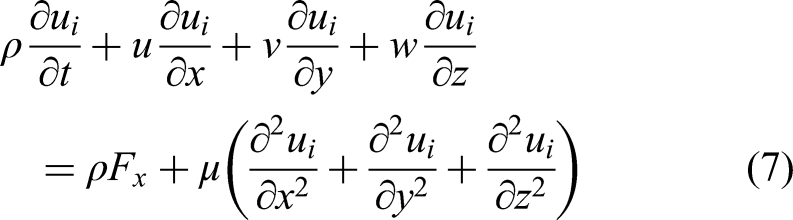
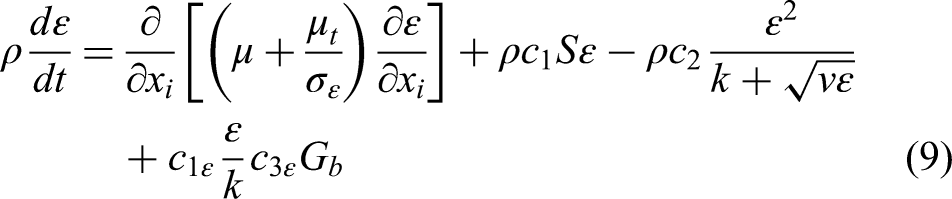
Turbulence equation: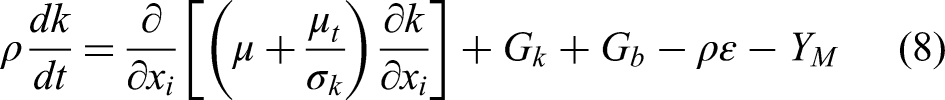
The suction line geometry was created using the DesignModeler (DM) module in ANSYS and subsequently meshed for the flow field analysis in Fluent, as shown in Figure 3. The two phases were defined as hydraulic oil and air. Simulations were conducted with air volume fractions of 20% and 30%. The operating temperature was set to 333 K. The boundary conditions were given as a constant pressure of 0.35 MPa at the inlet and 0.25 MPa at the outlet. The air volume fraction and pressure distribution within the suction line were simulated and calculated separately for each condition.
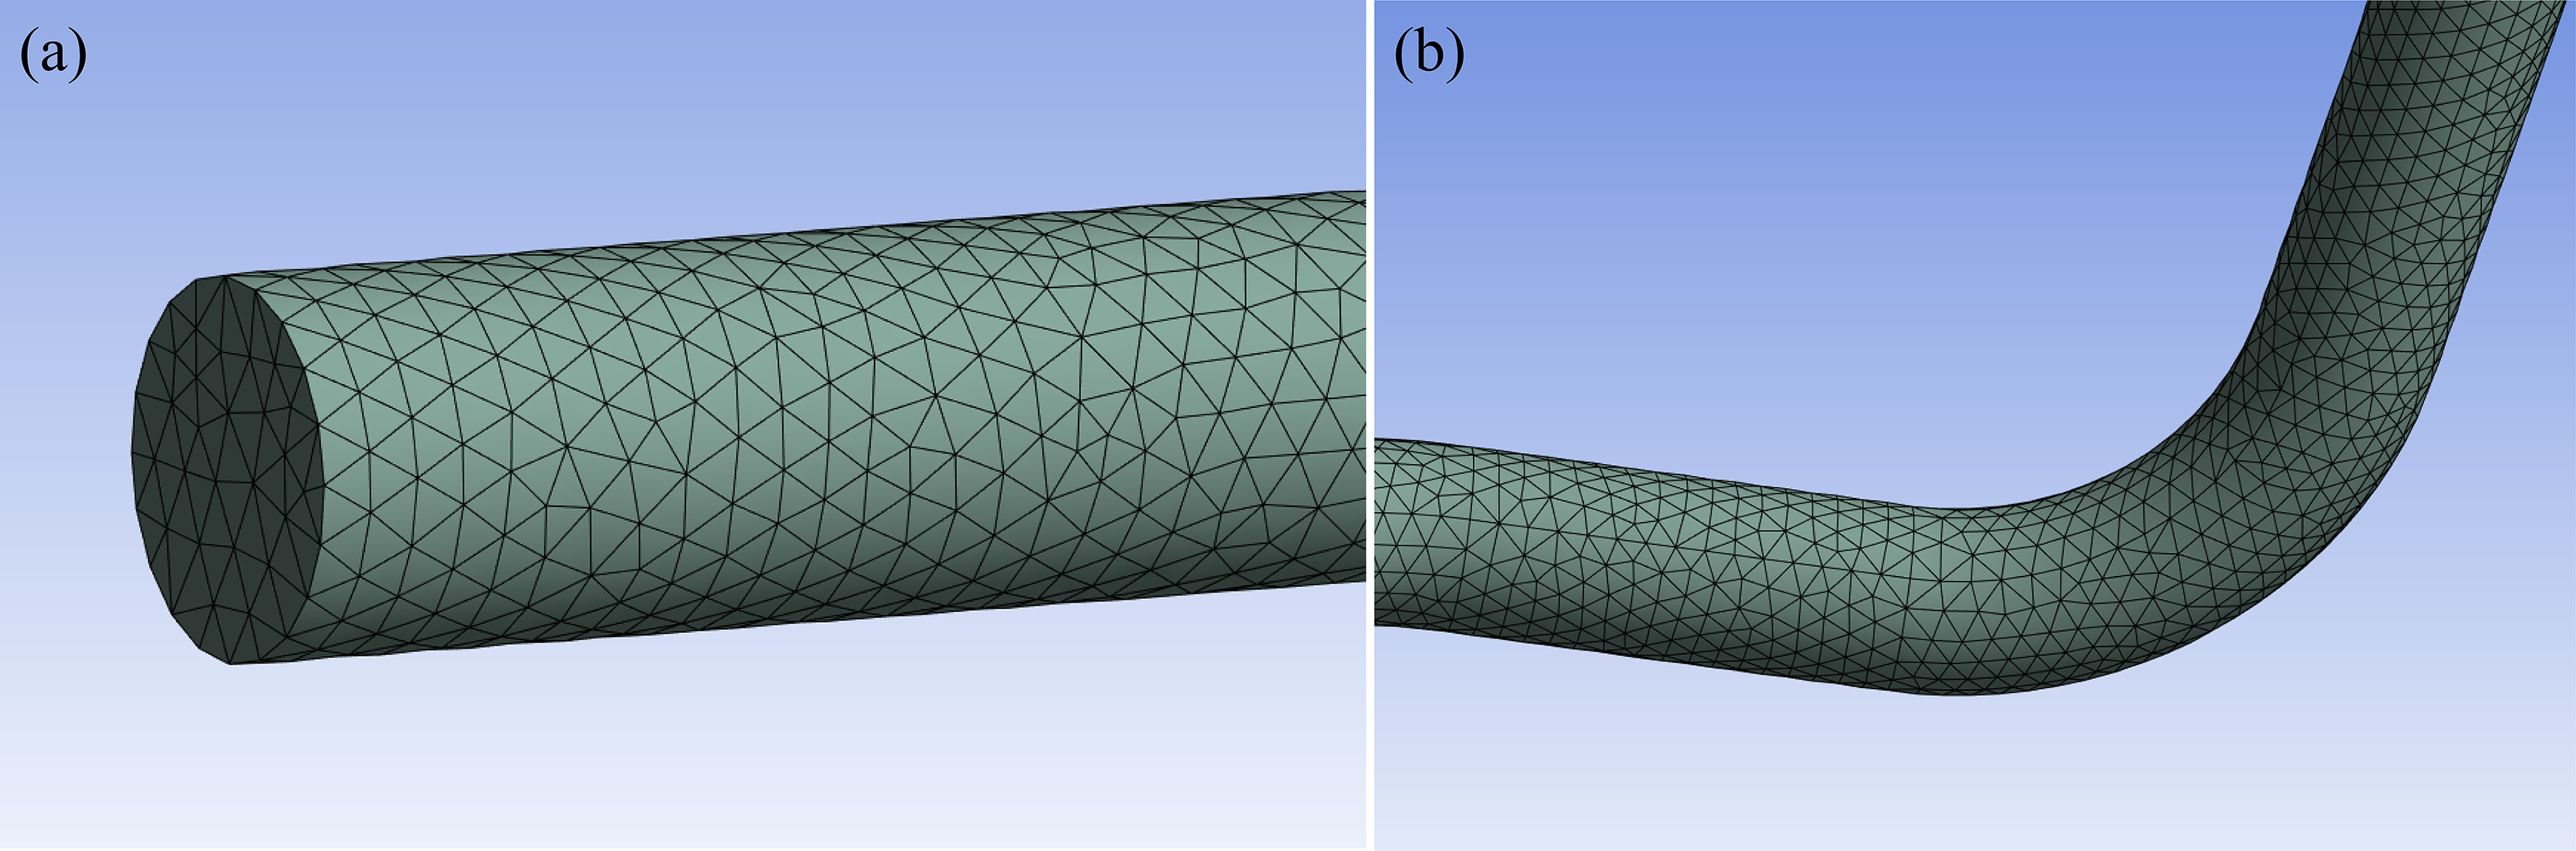
Computational mesh for the hydraulic pipe flow field: (a) straight section and (b) bend section.
Results
Experimental results
Macroscopic examination
Since it is difficult to confirm the precise leakage position visually, the failed pipe with about 240 h of service time was first inspected using a borescope and an air-tight test. The leak was identified on the inner side of the second bend, near the hydraulic pump, as pointed in Figure 1 and circled in Figure 4. Figure 5(a) and (b) shows the surface morphologies of the damaged region's inner and outer surfaces, respectively. It can be seen that the outer surface shows only a tiny hole approximately 0.06 mm in length, while the inner surface features a ‘valley’ about 12 mm long and 1 mm wide, exhibiting honeycomb-like characteristics. The ‘valley’ extends along the oil flow direction towards the second bend, forming a white halo with a total length of approximately 57 mm. This suggests that the internal damage is considerably more extensive than the external damage.
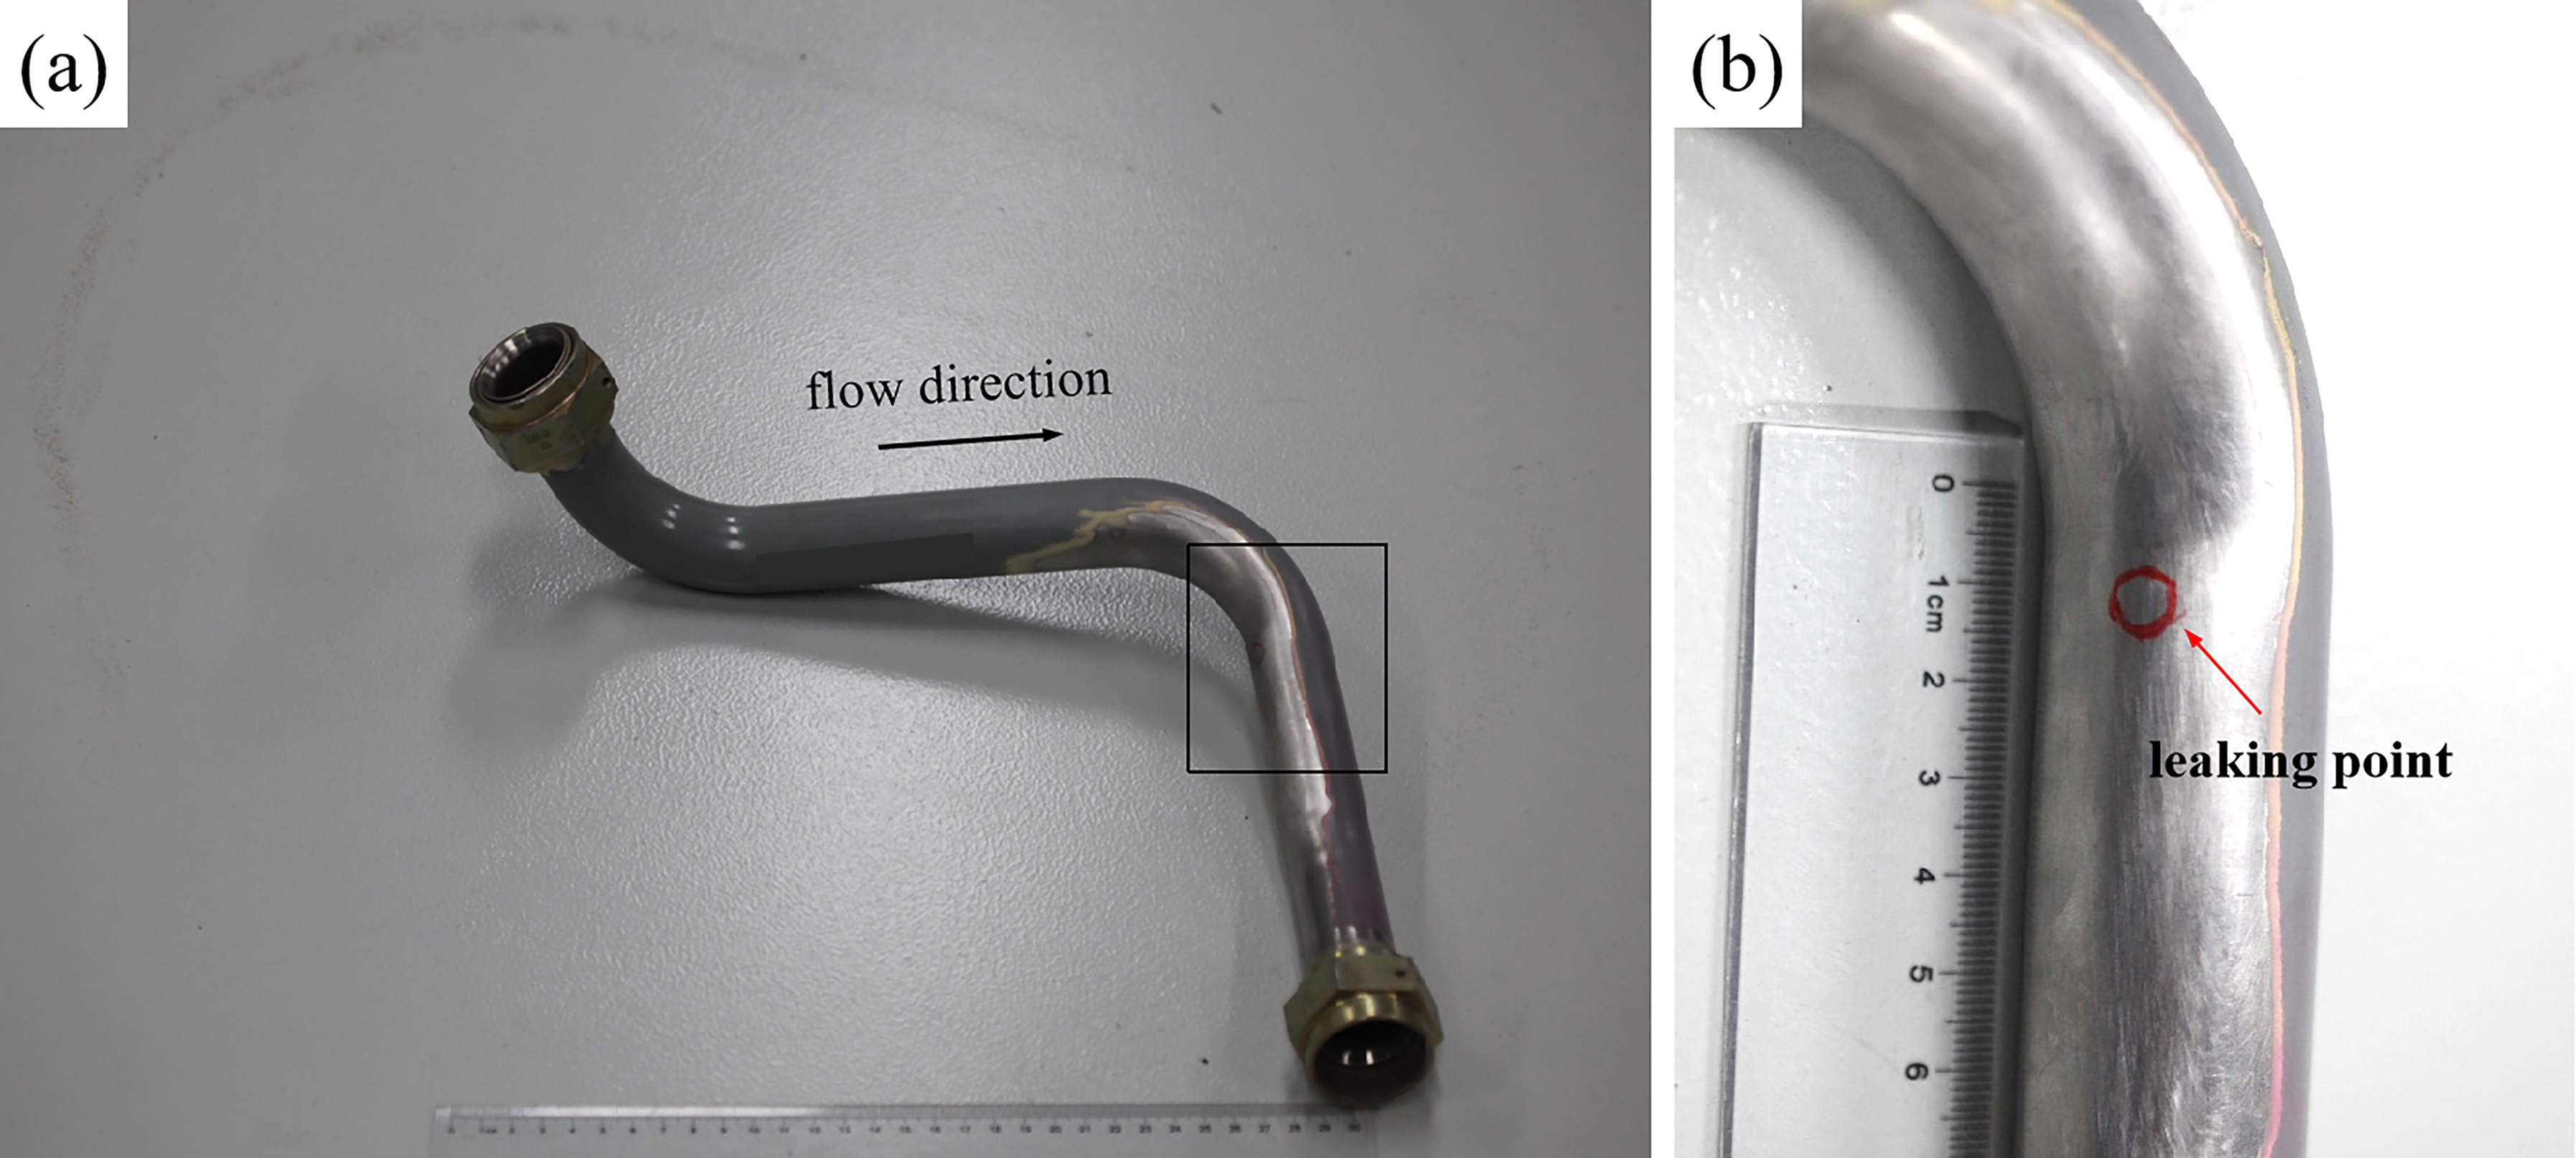
(a) The failed pipe with the leak marked by a rectangle and (b) enlargement of the rectangle in (a).
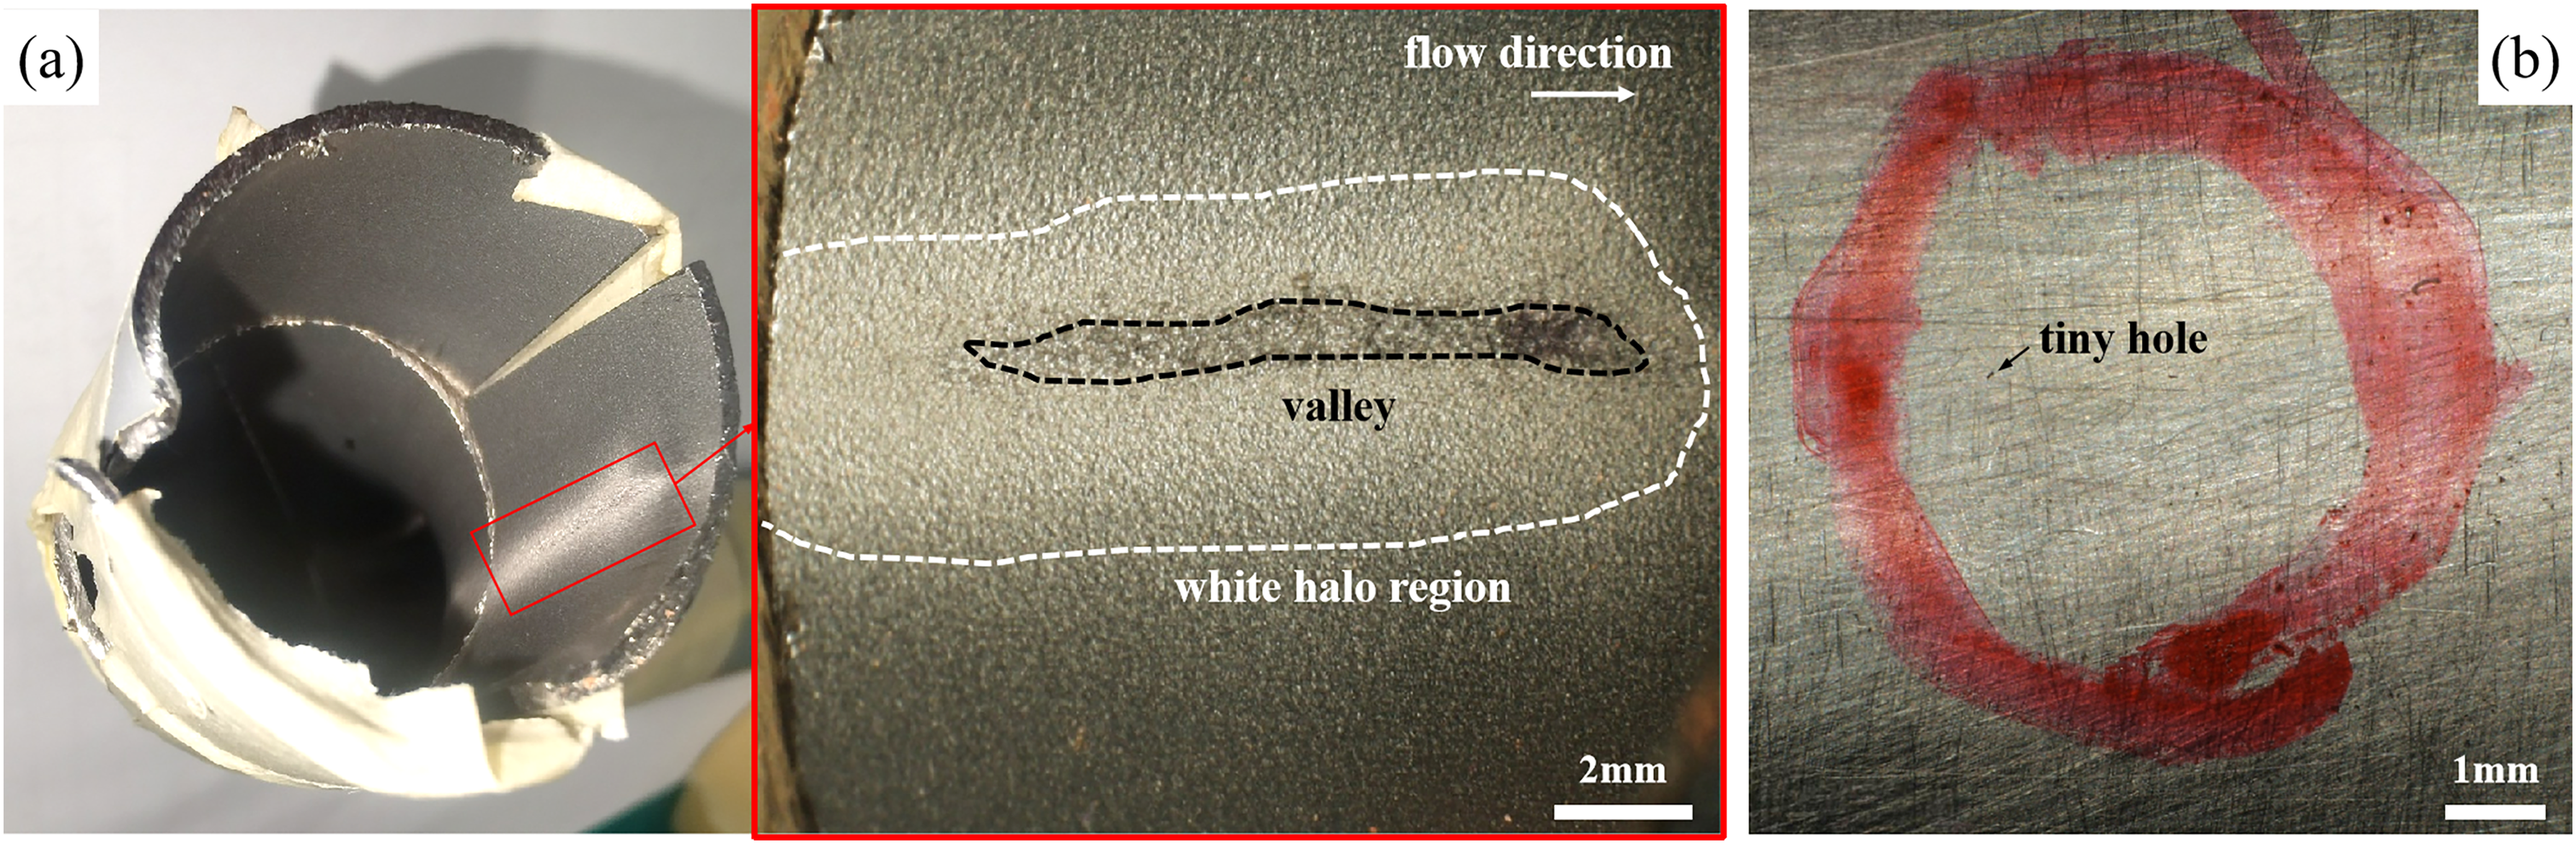
Macroscopic morphology of the failed pipe's (a) inner damaged surface and (b) outer surface with a tiny hole.
Identical pipes with shorter service duration (around 120 h) from other aircraft were also removed and checked to assess the risk of similar failure. As shown in Figure 6, the internal surface of these pipes exhibits roughness at a location similar to that of the failed pipe. The surface roughness also features a white halo morphology, similar to that shown in Figure 5(a). This observation corresponds to the initial stage of the failure mechanism, before significant depth develops.
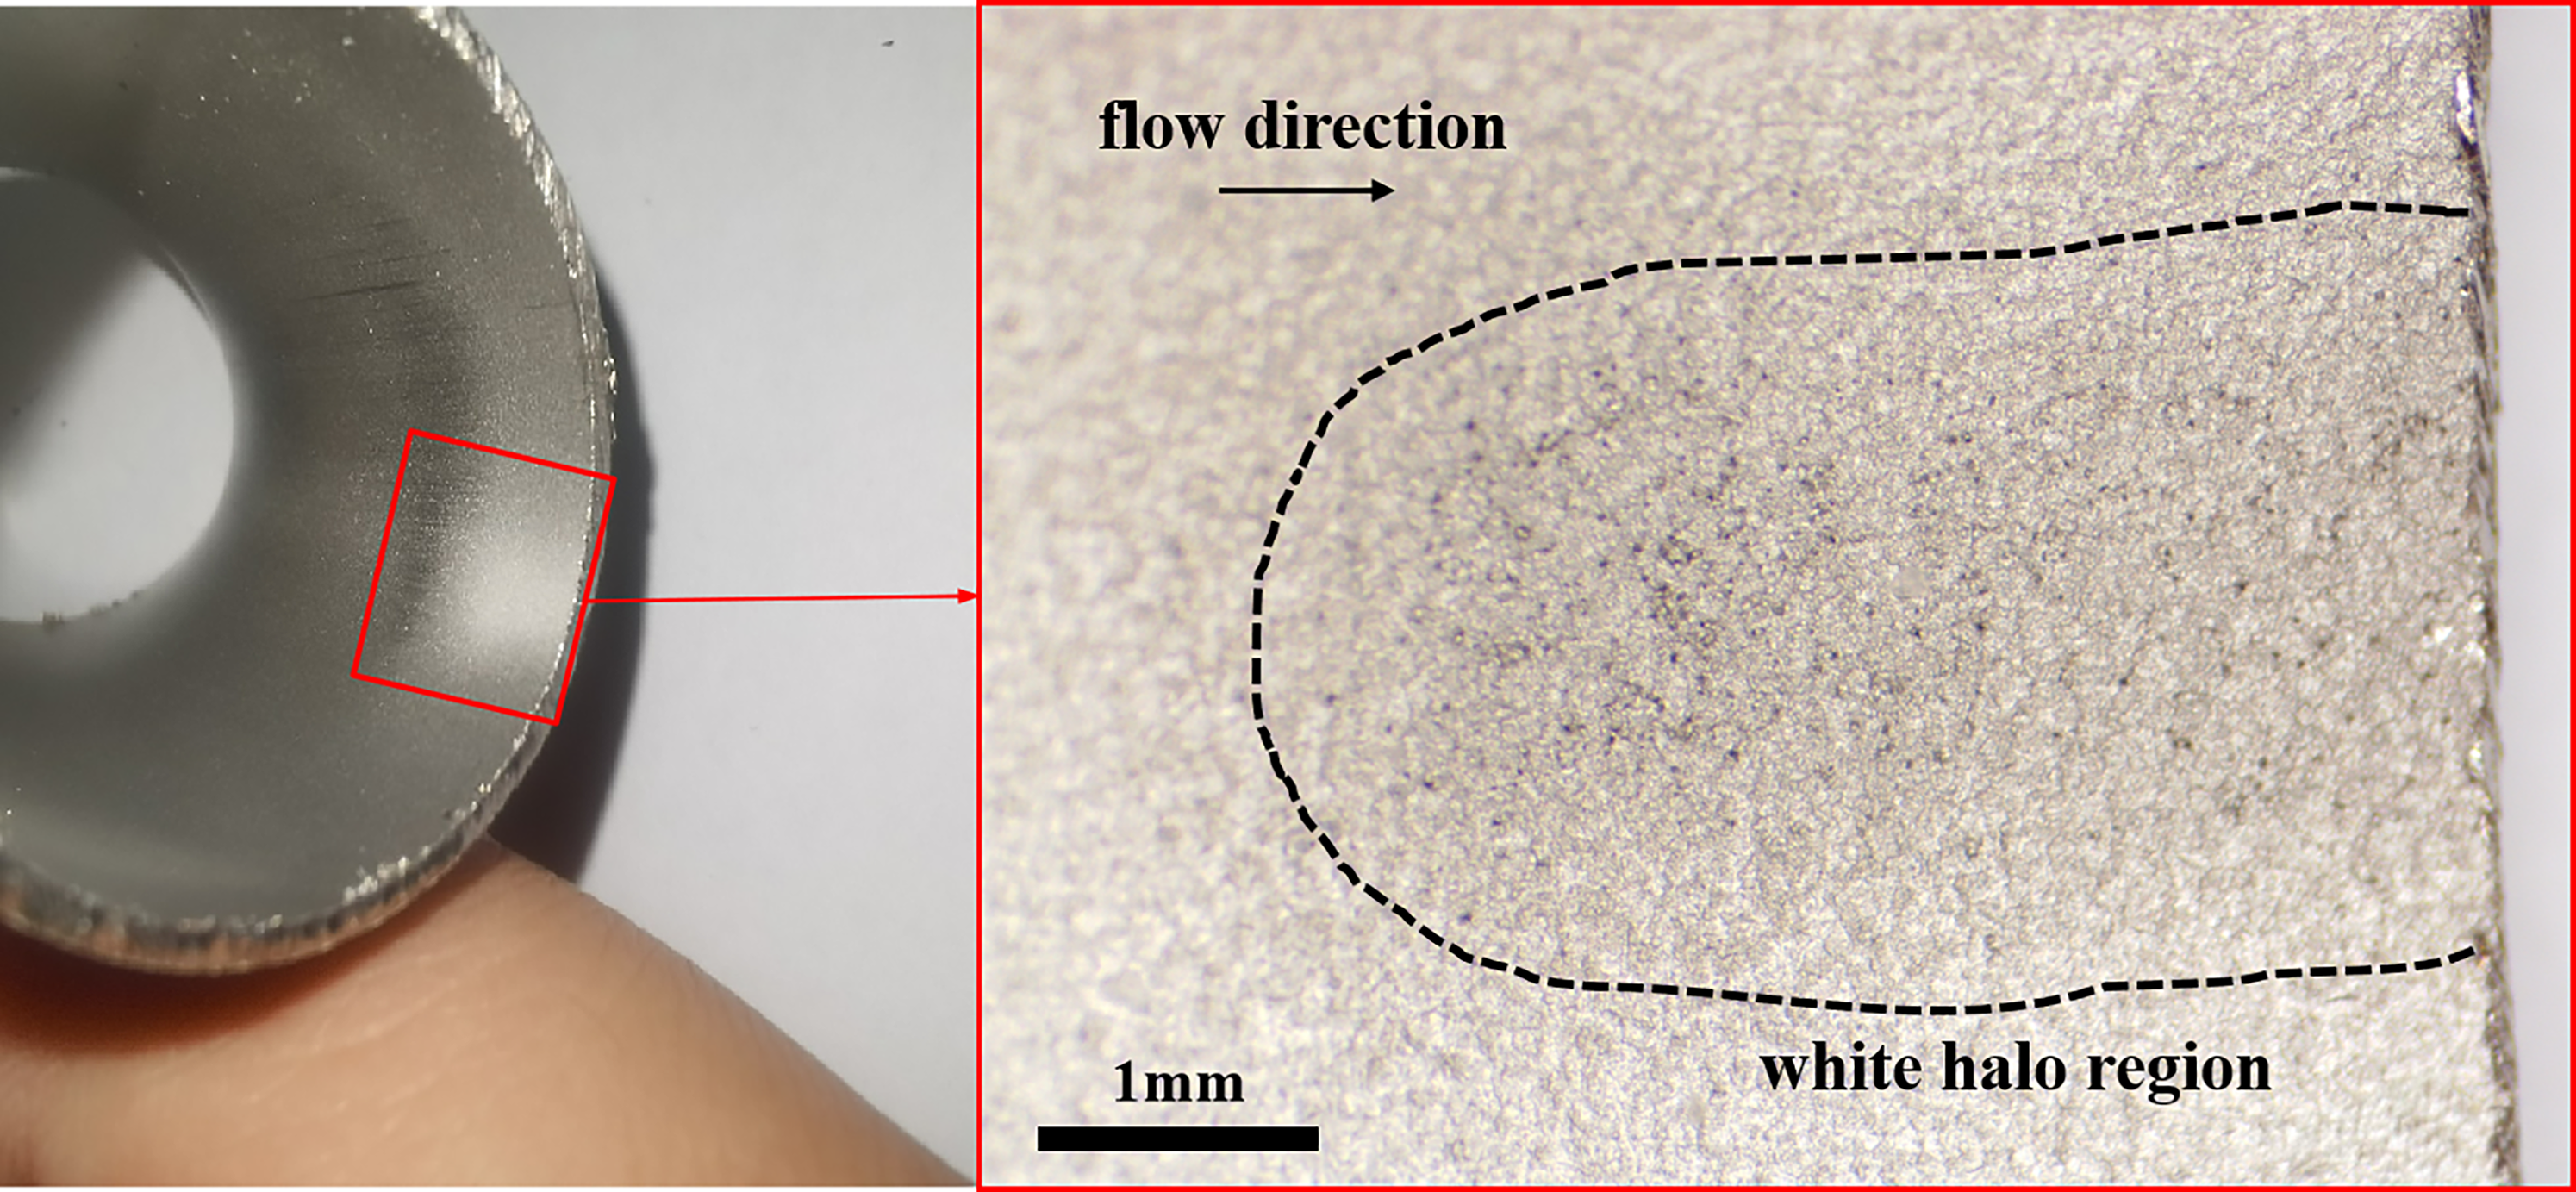
Rough internal surface of the same pipe with less service duration.
CT was used to characterise the 3D morphology of the leakage path, as seen in Figure 7. It can be seen from Figure 7(c) that the leakage path shows a bell-shaped morphology in cross-section. The morphology is similar to the failure pattern reported by Chen et al. 21 in a PTFE hose, but with a larger damaged area on the inner surface. This observation further indicates that the damage initiates from the pipe's inner wall and propagates progressively through the wall thickness.
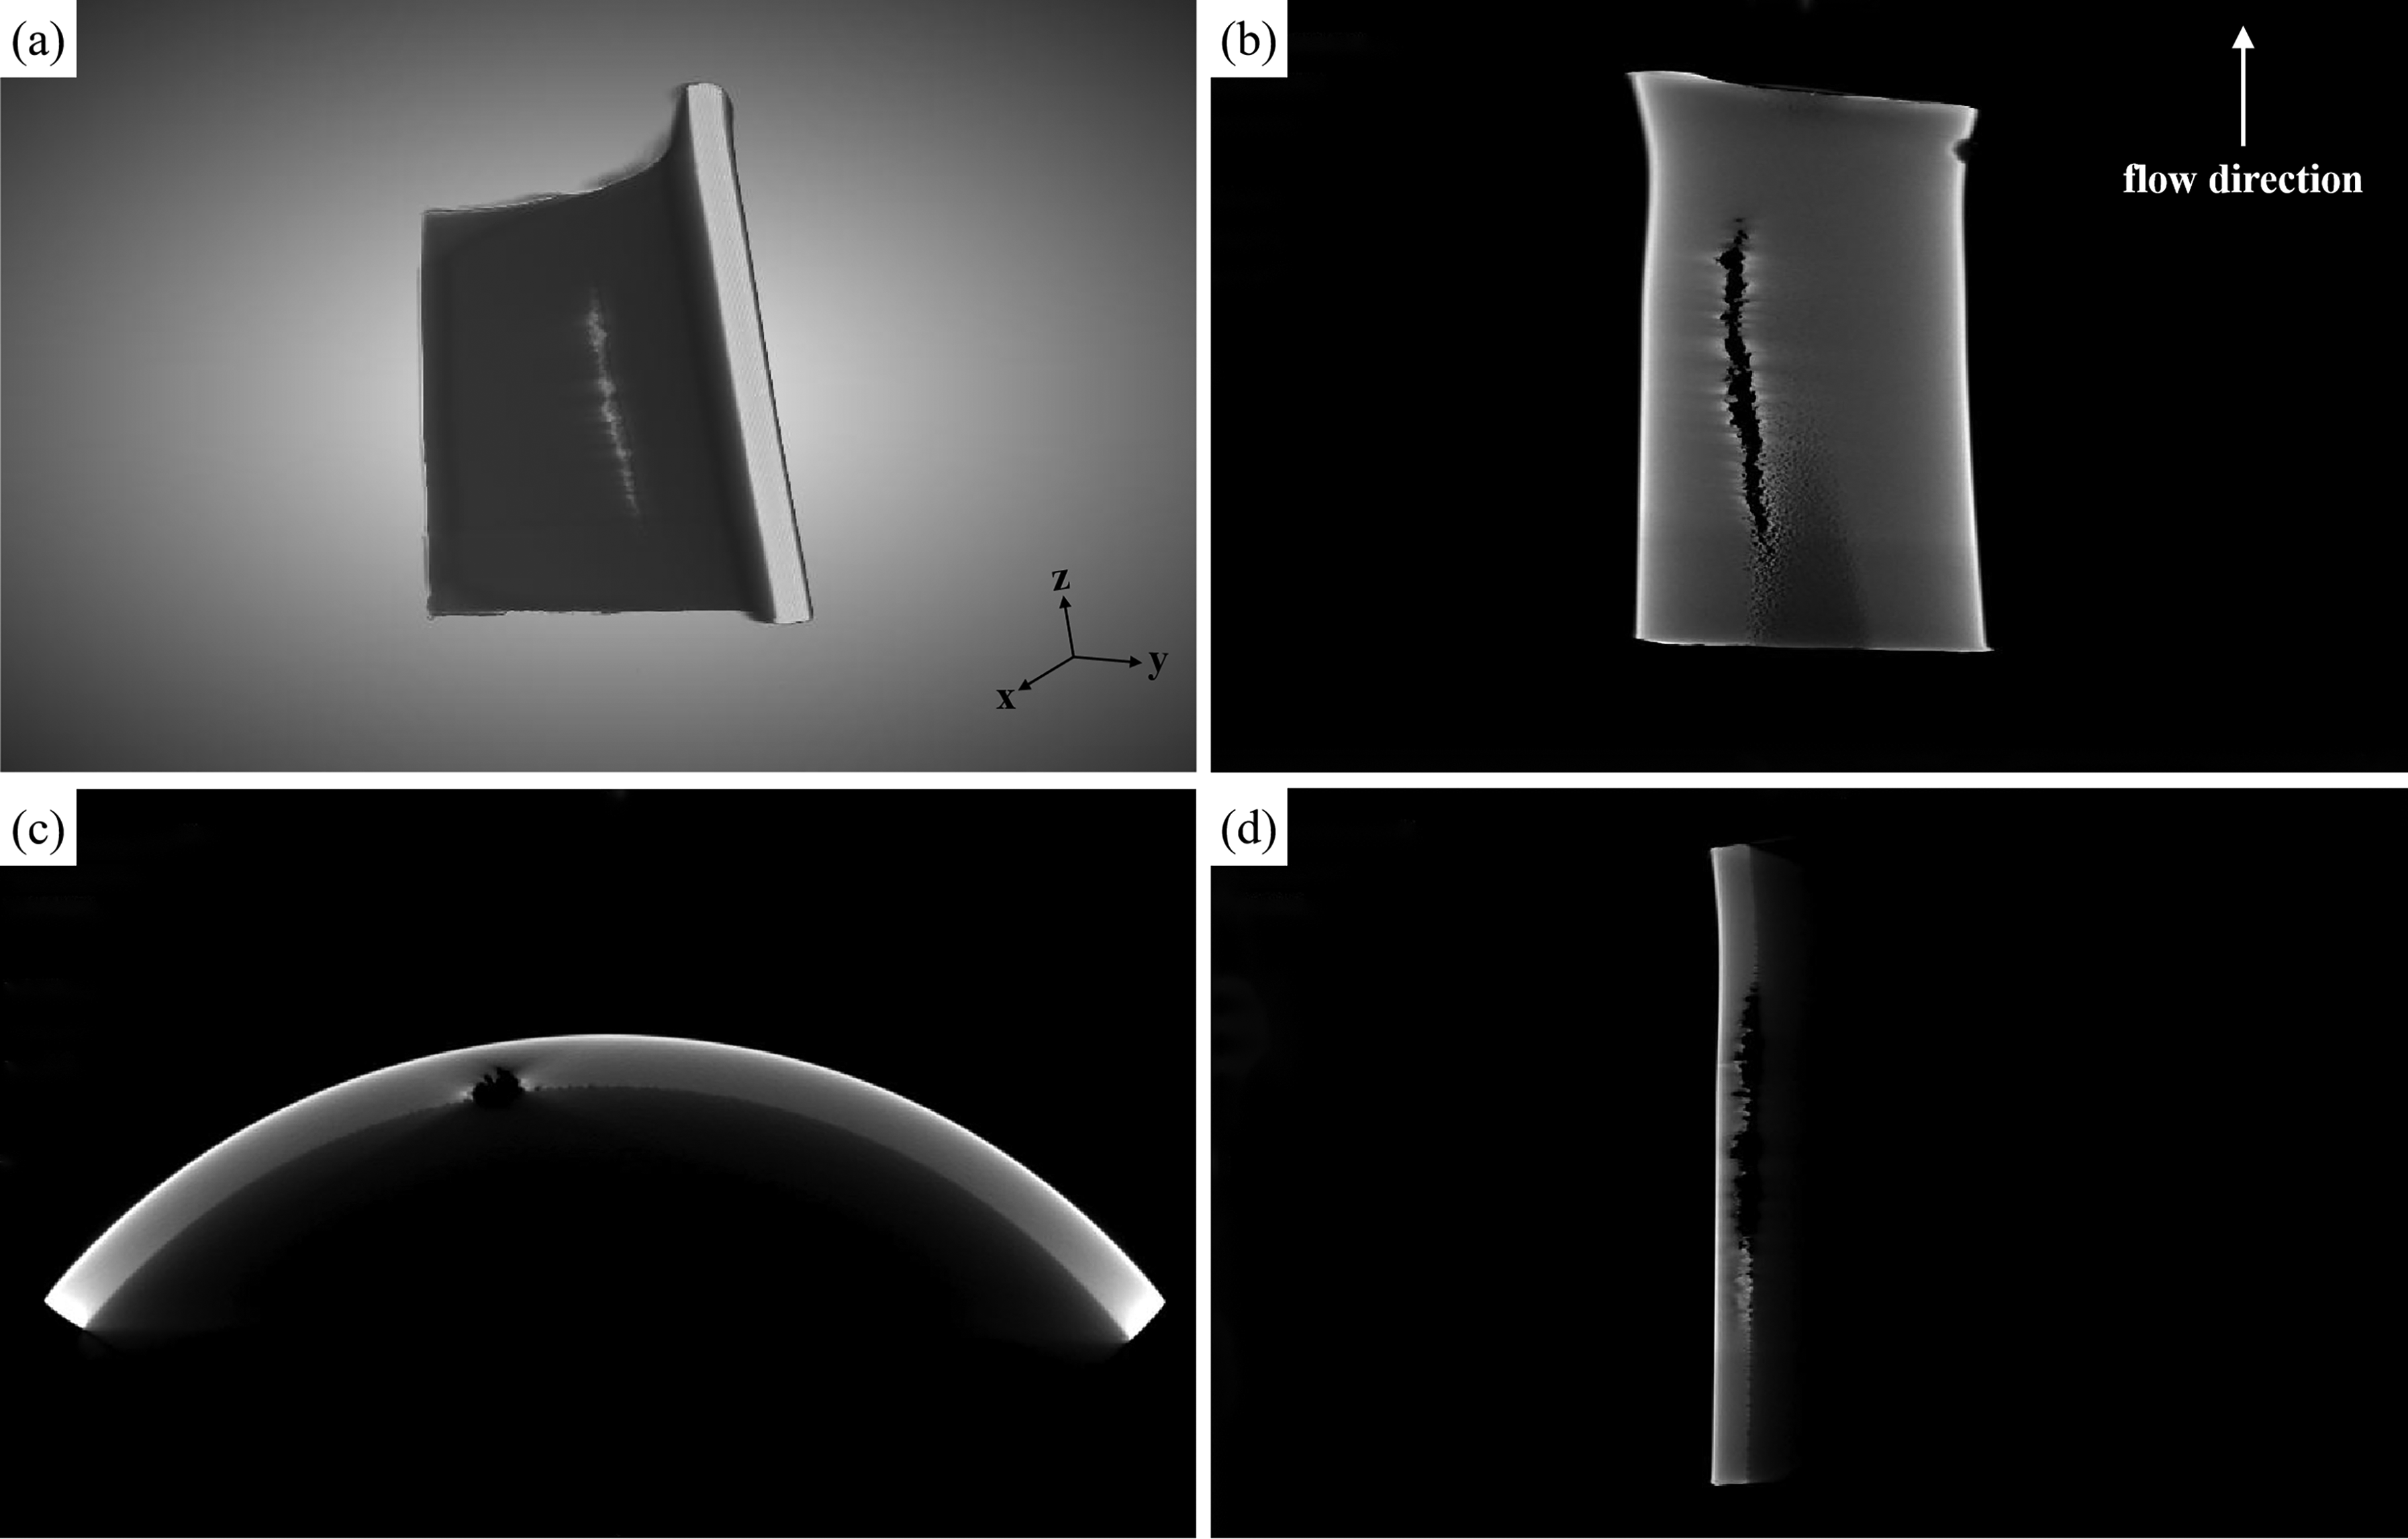
3D morphology of the damaged region of the failed pipe: (a) 3D morphology, (b) perpendicular to the x-axis, (c) perpendicular to the z-axis, and (d) perpendicular to the y-axis.
Microscopic examination
The degradation process can be divided into two distinct stages, each with a dominant failure mode. This progression is consistent with the well-established characteristics of cavitation erosion. At the initial failure stage, corresponding to a shorter service time, there are mainly two different kinds of micro-pits: shallow pits and deep pits, as shown in Figure 8(a) to (d). The shallow indentations, approximately 10 μm in diameter, have flat bases and often overlap with each other. The edges and bottoms of these pits and the surrounding surface undulations exhibit large plastic deformations. Some shallow pits display a circular pattern surrounded by rims, characteristic of a shock wave origin (see Figure 8(d)). Slip bands and twin bands, confined to one or two grains, are evident and are attributed to shock wave impact resulting from the collapse of massive small bubbles, as shown in Figure 8(e). In certain regions, delamination of the surface material from the substrate has occurred, exposing original austenitic grain boundary-like features (see Figure 8(c) to (e)). It is important to note that these exposed features are consistent with the intact original surface observed in undamaged areas. Since the raw tube material underwent acid pickling during manufacturing, the grain boundaries were preferentially etched, resulting in the observed morphology. In contrast, individual deep pits, approximately 20 μm in diameter and larger than the shallow pits, are distributed among the shallow indentations. These deep pits nucleate and increase in number, but not significantly in size, within the centre of the damaged area. Figure 8(e) and (f) shows that the deep pits are surrounded by the zones of extensive plastic deformation. Fatigue crack initiation and propagation are observed at the edges of deep pits (Figure 8(f)). The features of deep pits are consistent with the damage caused by micro-jet impact. 36 Torus bubbles, which possess a characteristic central dent, are known to produce highly erosive micro-jets upon collapse.

The morphologies of the inner damaged surface at the initial stage: (a) distribution of micro-pits, (b) deep pits, (c) shallow pits, (d) circular pits surrounded by rims, (e) slipping bands and twin bands, and (f) fatigue cracks.
The morphologies observed above indicate that the shallow pits and deep pits are caused by massive small bubbles and individual torus bubbles, respectively. This reveals the presence of a non-uniform bubble cloud, with a concentration of intense torus bubble collapse at the centre. The results further indicate that the high shock pressures from the collective collapse of numerous bubbles acted successively on the pipe wall.
With prolonged service time, the exposed surface of the undulations and pits becomes rougher and deeper, leading to greater mass removal. Once the work hardening capacity of the surface reaches a critical level, fatigue cracks will nucleate and propagate from discontinuities on the damaged surface. Figure 9 shows a significant increase in the number of pits, craters and cracks, especially in the centre of the damaged region, ultimately forming a valley-like rupture. The depth and density of these features decrease with increasing distance from the centre of the ‘valley’. The central region of the ‘valley’ contains randomly distributed craters. The facets of these craters show fatigue striations and discontinuities in plastically deformed materials, as seen from Figure 9(b). Fatigue cracks nucleate at various sites on the inner surface and propagate along different directions. Micro-cracks are observed to initiate and propagate at various angles relative to the primary fatigue facets (as shown in Figure 9(b) and (c)). This behaviour differs from the findings of Ahmed et al., 37 who reported that fatigue cracks in SUS 304 stainless steel first propagate at an angle to the test surface in the laboratory cavitation test, before subsequently propagating parallel to the surface. We propose that bubbles are captured with pre-existing craters and then collapse in various directions. These observations suggest that massive small bubble clouds and torus bubbles work synergistically to remove dislodged particles until penetration of the pipe wall. Both types of bubble collapse act as potent nuclei for severe erosion. The cumulative effect of repeated cavitation stresses on the pipe's inner surface results in perforation.

The morphology of the inner damaged surface at the second stage: (a) ‘valley’, (b) fatigue fracture, and (c) fatigue striations and dimples.
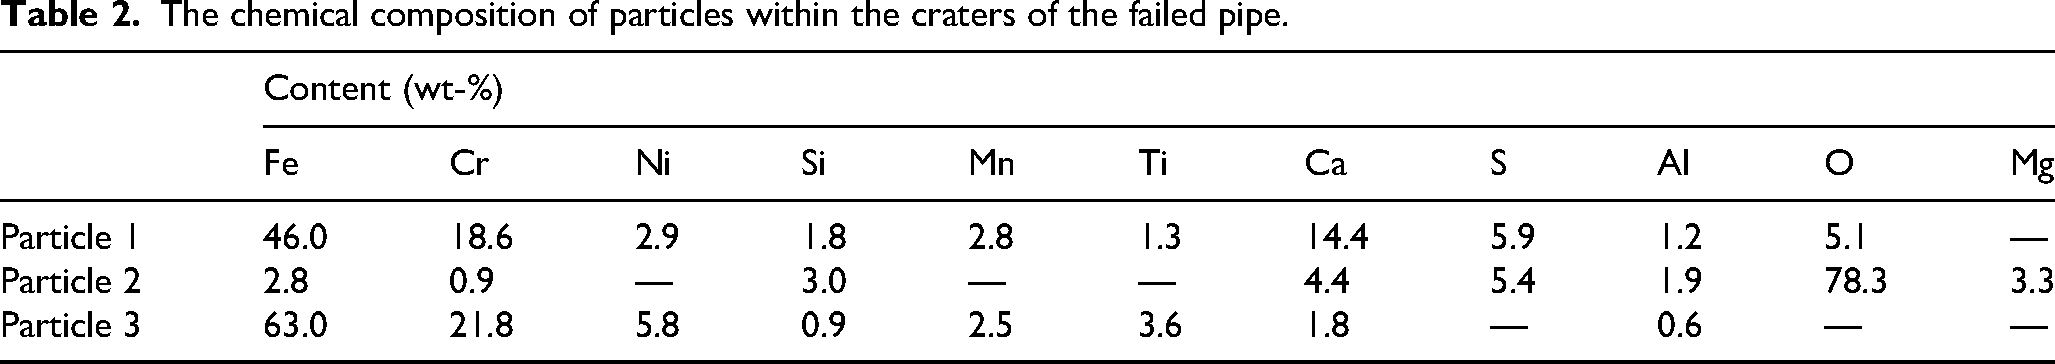
SEM–EDS analysis was performed on multiple poorly conductive particles observed within the craters (see Figure 9(b)). The results, presented in Table 2 (with carbon excluded), indicate that these particles are probably composed of oil-borne contaminants, detached material chunks, and oxides of 1Cr18Ni9Ti, based on comparison with the nominal composition of 1Cr18Ni9Ti steel.
The chemical composition of particles within the craters of the failed pipe.
Simulation results
Simulation results based on AMESim
The hydraulic pump suction flow rate increases abruptly from 60 to 270 L min−1 within 100 ms, as shown in Figure 10(a). This rapid change induces a local transient low-pressure zone near the pump suction port, where the pressure falls below 0.07 MPa, reaching a minimum of 0.043 MPa (Figure 10(b)). As detailed in section ‘Simulation results based on Fluent’, simulations show a high gas volume fraction in this specific region. Consequently, the transient low pressure causes the dissolved gas to separate, generating a large number of bubbles. When the pressure subsequently recovers, these bubbles collapse implosively, causing cavitation erosion that damages the pipe surface.
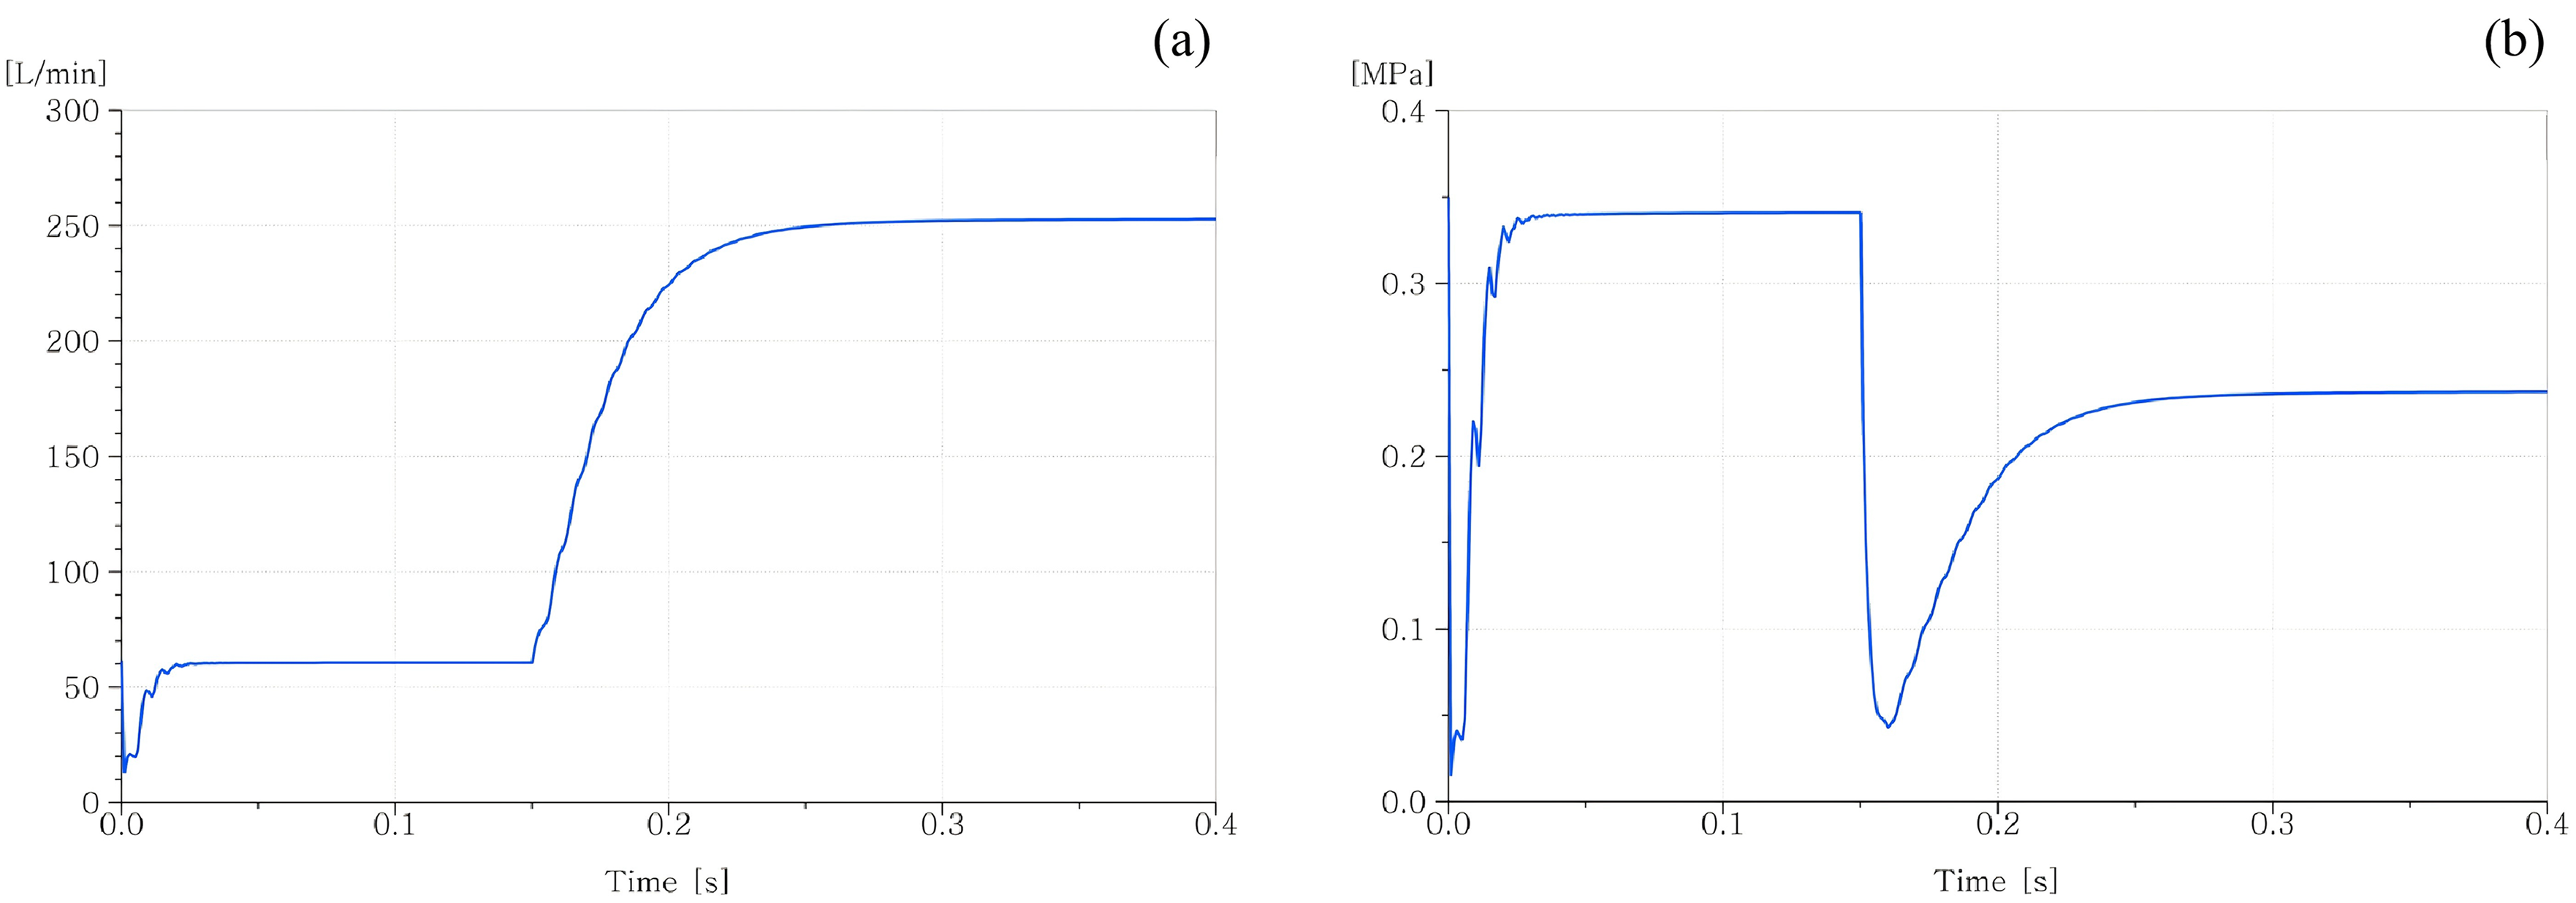
Simulation results of fluid transient in suction line: (a) pump suction port flow and (b) pump suction port pressure.
Simulation results based on Fluent
CFD simulations were conducted using ANSYS Fluent with a pressure-based transient solver. A mixture multi-phase model was employed to describe the two-phase flow, with hydraulic oil as the liquid phase and ideal gas as the gas phase. The initial air volume fractions (V) were set to 20% and 30% in the oil–gas two-phase fluid at a constant temperature of 333 K, respectively. Phase interaction was modelled through a cavitation mass-transfer mechanism implemented in Fluent. The viscous flow was simulated using the realisable k–ε turbulence model with standard wall functions for near-wall treatment, and pressure–velocity coupling was set. The mesh diagnostics in Fluent indicated a minimum orthogonal quality of 0.203 and a maximum aspect ratio of 15.7, indicating acceptable mesh quality with no severely distorted cells detected by the built-in mesh check. The resulting gas volume fraction and pressure distribution within the suction line were simulated in Fluent. The contour plots of gas volume fraction and pressure distribution in the 1Cr18Ni9Ti pipe are presented in Figures 11 and 12, respectively.
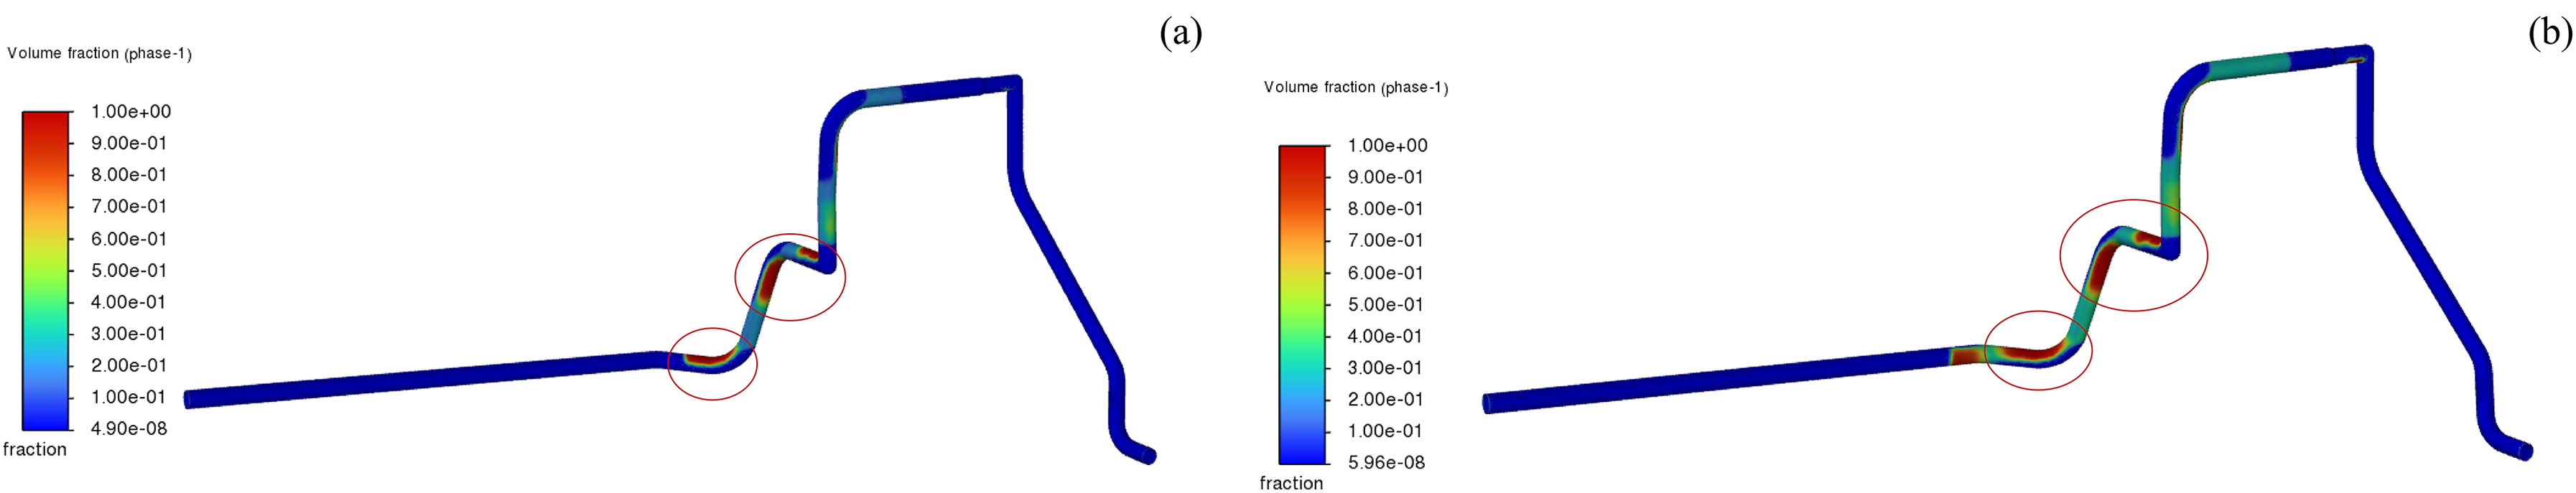
CFD results of gas volume fraction in suction line: (a) initial air volume fraction V = 20% and (b) V = 30%. CFD: computational fluid dynamics.
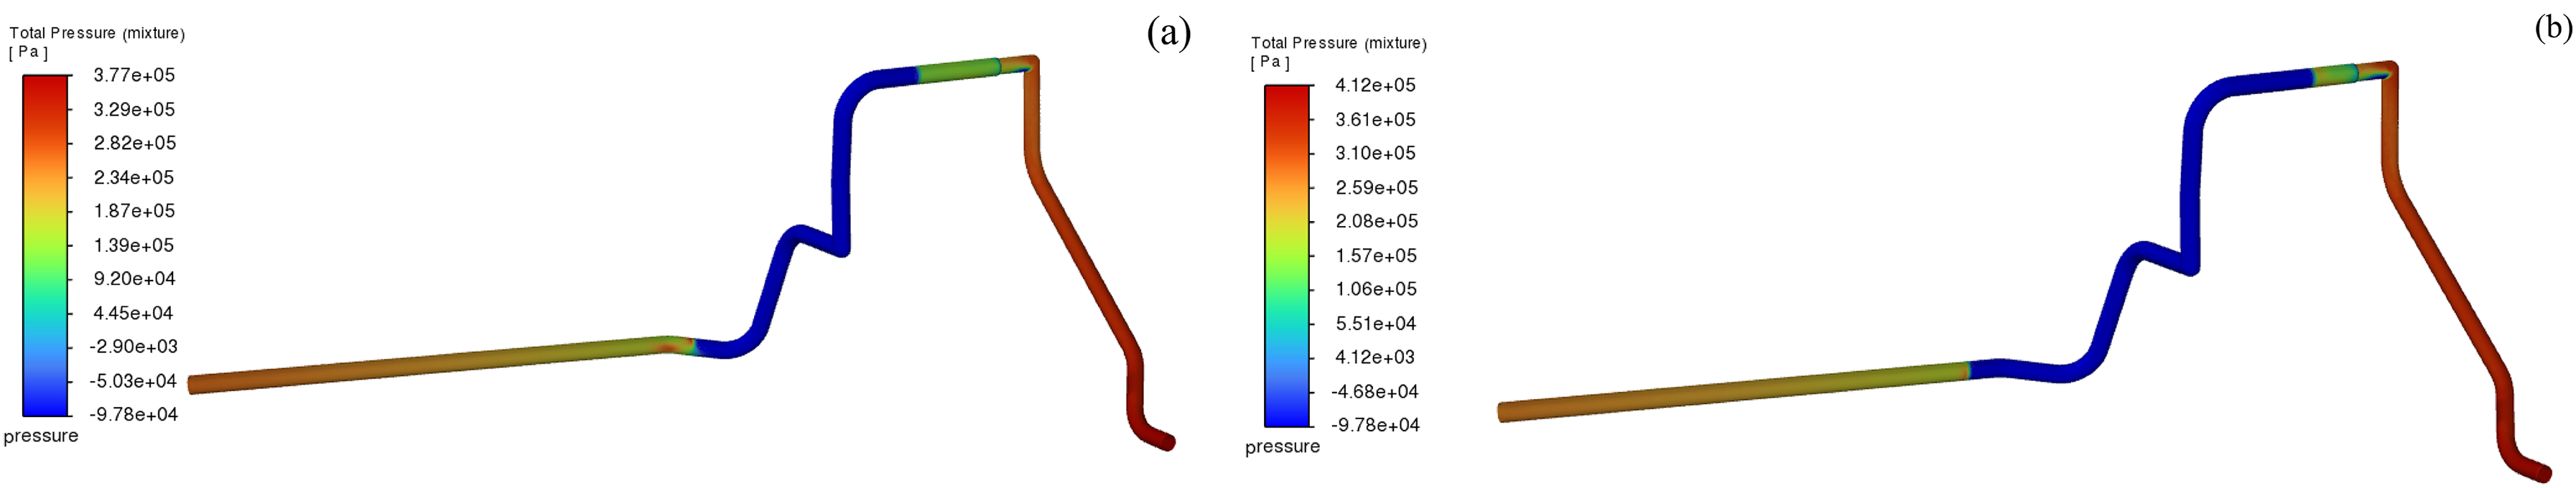
CFD results of fluid pressure contour in suction line: (a) initial air volume fraction V = 20% and (b) V = 30%. CFD: computational fluid dynamics.
The simulations indicate a higher gas volume fraction near the hydraulic pump suction port under the given conditions. The pressure contour plot confirms a relation between the low-pressure zone and high gas volume fraction. It can be found that gas tends to gather near the inside wall of the pipe bends, which is the low-pressure zone caused by the secondary flow effect in the curved section. The combination of low pressure and a smaller pipeline bending radius at this location promotes gas accumulation. Consequently, the pressure distribution obtained from the 3D Fluent simulation provides spatial information on where cavitation is most likely to occur, complementing the system-level transient pressure prediction obtained from the AMESim model.
One may also find that the gas gathering as well as low pressure occurs closer to the pipe inlet, when the initial air volume fraction increases, indicating that the cavitation will be more significant along the pipeline. Regardless of the initial air volume, cavitation erosion is most likely to occur at the second bend in the failed pipe, as shown in Figure 11(a), where upstream nucleated bubbles may also be transported to this position and collapse.
The effectiveness of Fluent simulations can be further demonstrated by analysing the velocity, pressure, and gas volume fraction at the bend of the failed pipe (see Figure 13). The flow direction is from right to left. The results indicate that the flow is significantly accelerated in the curved section and near the second bend, where a pronounced local low-pressure zone is observed. In the same region, the gas volume fraction increases locally, indicating that gas tends to accumulate in the low-pressure zone. Additionally, the curved pipe geometry induces a non-uniform velocity distribution, and the gas volume fraction contour shows that gas preferentially accumulates in this region. This spatial correspondence between flow acceleration, pressure reduction, and gas enrichment supports the conclusion that cavitation damage is closely associated with the bend-induced local flow structure.
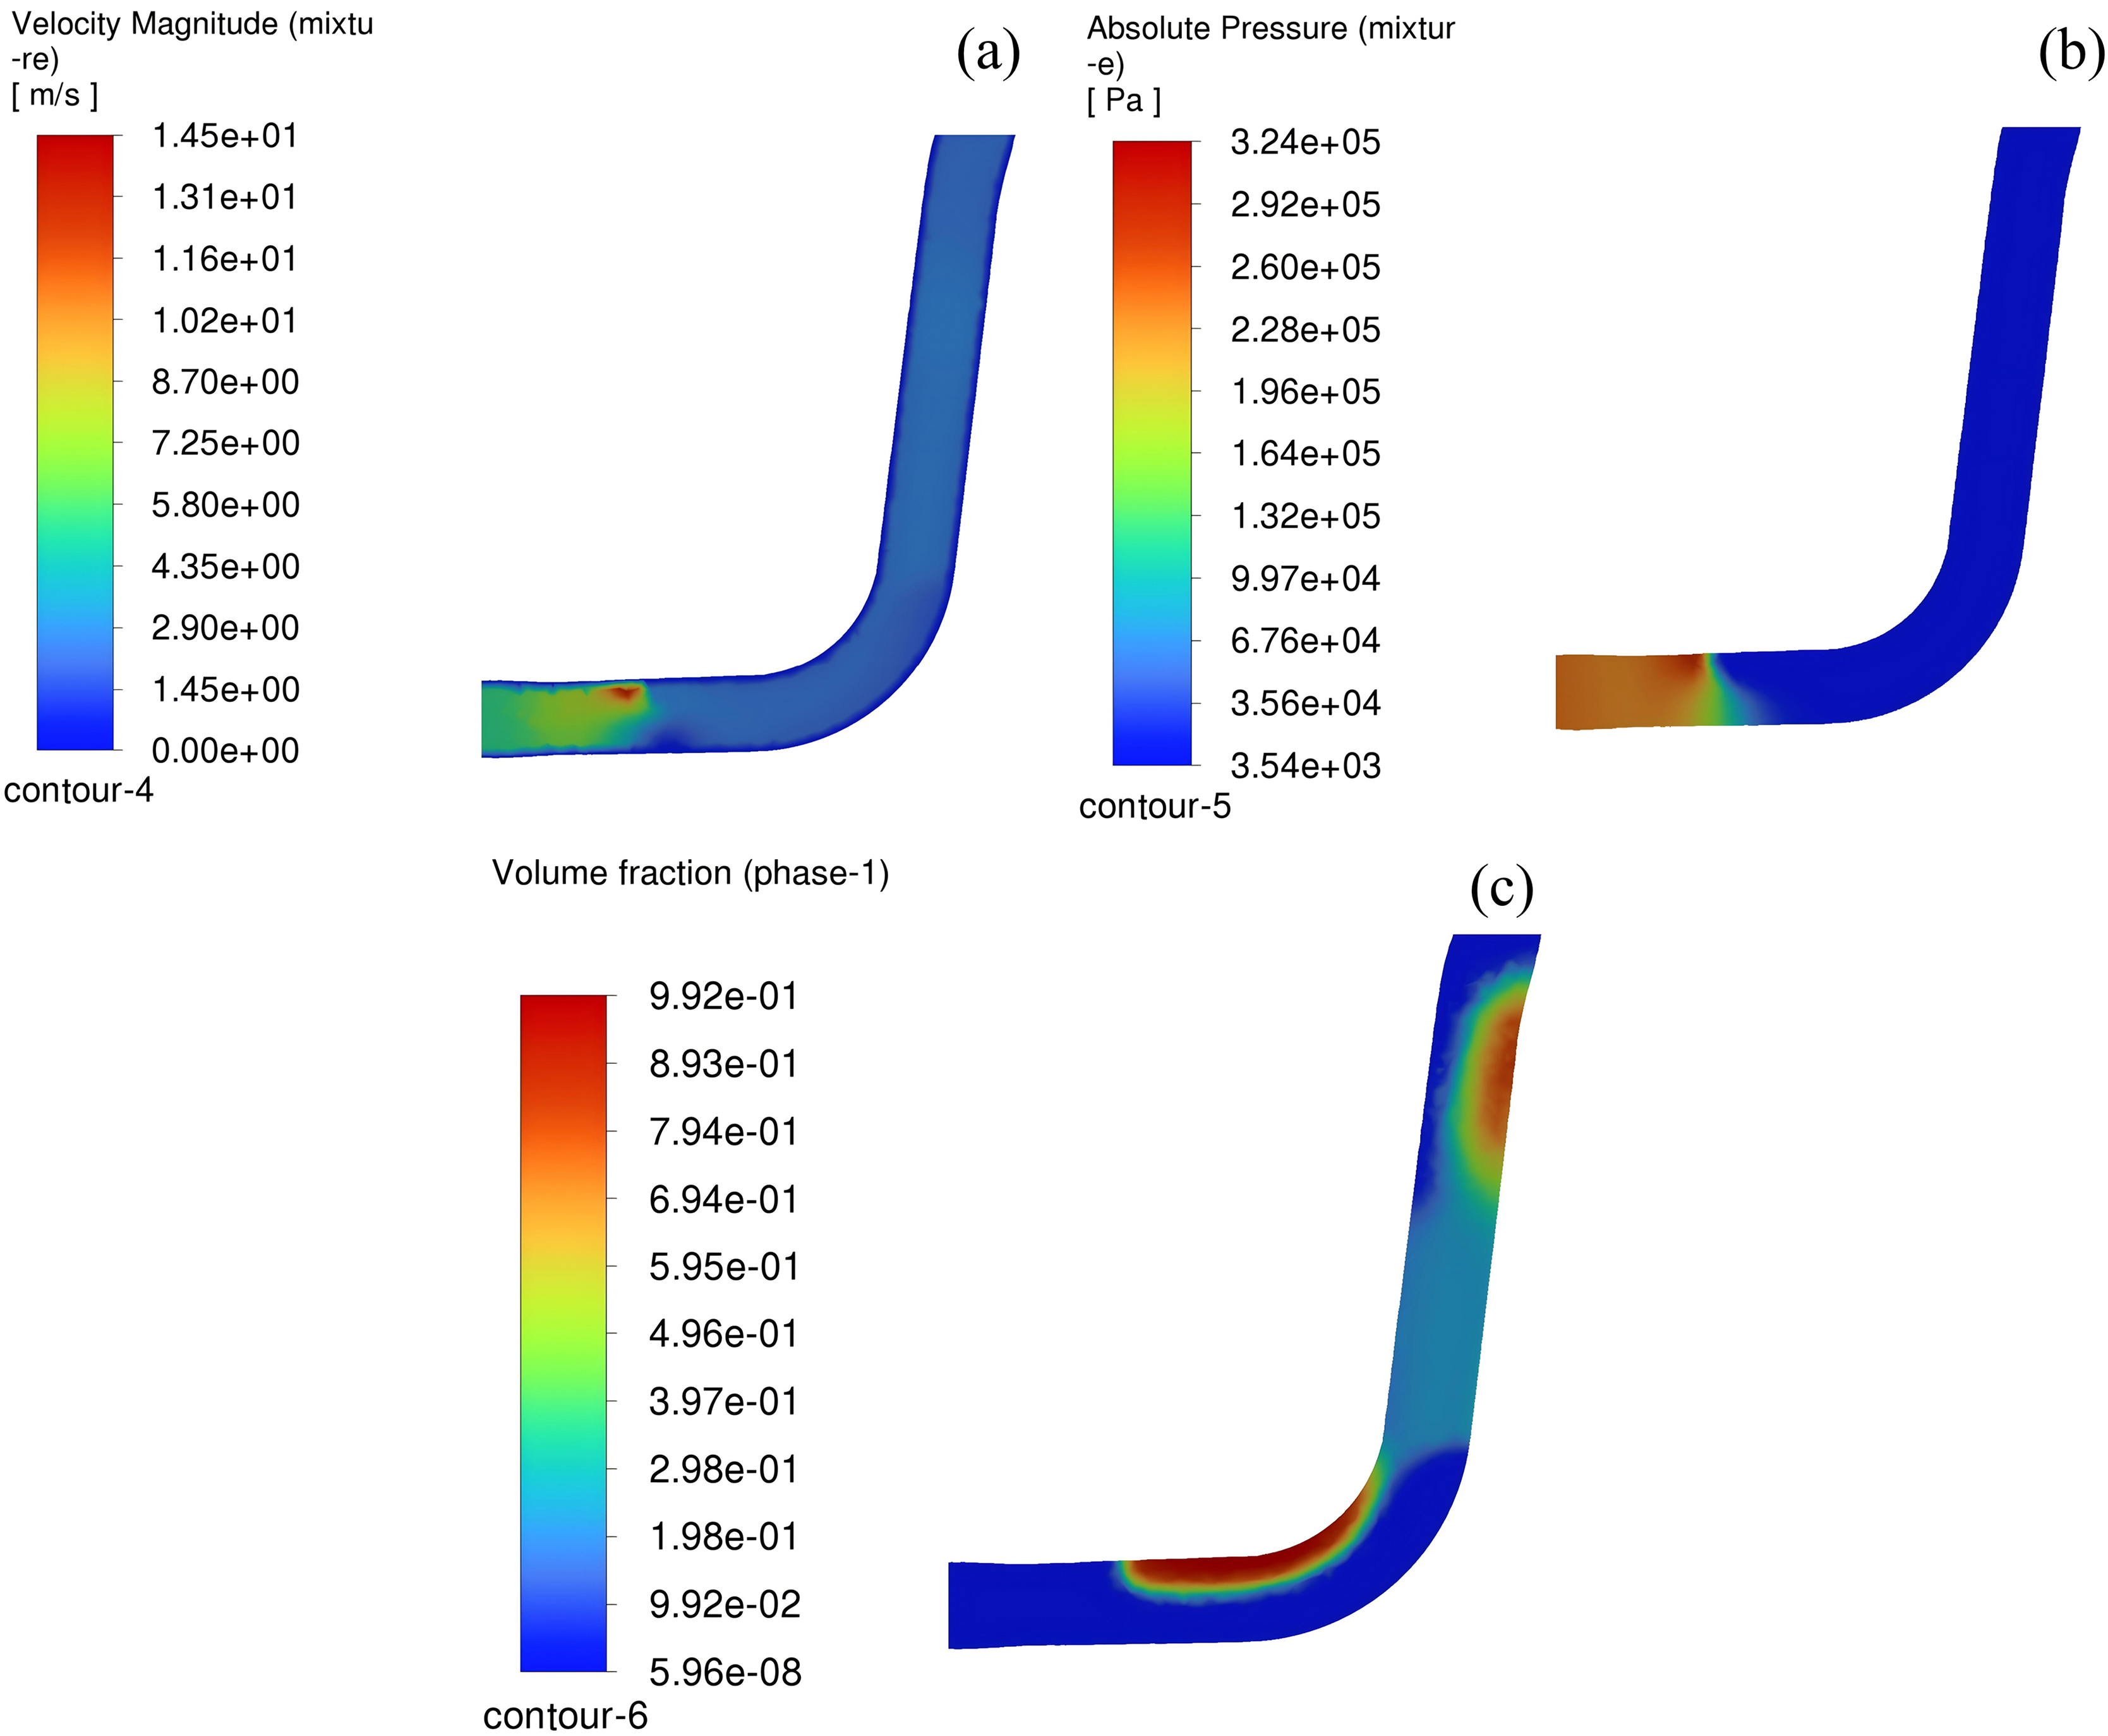
(a) Velocity, (b) pressure, and (c) gas volume fraction contour at the second bend in the failed pipe.
Discussion
Based on the experimental and simulation analysis, the primary failure mechanism of the 1Cr18Ni9Ti hydraulic pipe is cavitation erosion dominated by mechanical impact. This failure occurs through the following sequence due to the combination effect of the materials’ properties, the pipe geometry, and working environments: the high transient suction rate of the oil creates a low-pressure region in the inner side of specialised bends, leading to the separation of an oil–gas two-phase fluid. Nucleated bubbles collapse on the inner wall when the pressure recovers in the failed position, generating mechanical impacts that destroy the surface and lead to the detachment and flaking of the metal substrate.
Since hardness plays a key role in resistance to cavitation erosion, increasing the hardness of bulk materials, applying coatings, and employing surface hardening techniques to modify the property of the surface are effective approaches and have been widely studied.38–42 However, these methods are currently impractical for the reasons outlined below. First, coatings are not permitted on the inner surface of hydraulic suction lines to avoid the risk of particle contamination in the oil. Second, mechanical surface treatments, such as shot peening and cold working, are difficult to implement because the pipe undergoes plastic deformation to form multiple bends with varying radii and angles. Third, thermal–chemical treatment is also challenging to apply: if performed before pipe bending, they hinder subsequent deformation; if conducted after bending, it becomes difficult to maintain the required geometric tolerances. Selecting a more cavitation erosion-resistant material offers another potential solution. However, material substitution is currently impractical due to the extensive validation required for new materials and compatible joining techniques. Consequently, material modification is not considered a viable solution for the failed pipe at this stage. The practical means to reduce the pressure drop and then cavitation must therefore lie in the optimisation of the pipe geometry and working conditions.
The following structural design optimisations are proposed to mitigate cavitation in the 1Cr18Ni9Ti suction line of the aircraft hydraulic system: first, increase the pipe diameter to reduce flow resistance, thereby raising the transient minimum pressure at the suction line outlet. Second, increase the reservoir boost pressure to elevate the baseline pressure at the pipe inlet. Third, optimise the pipe shape to relocate potential gas accumulation zones away from critical areas and reduce the initial gas content in the hydraulic fluid.
Pipe diameter
To evaluate a potential mitigation strategy, the inner diameter of all suction pipes and hoses in the AMESim model is increased to mpa##8197;32 mm. The simulation results are shown in Figure 14. The results demonstrate that increasing the pipe diameter reduces the line resistance. Consequently, the minimum pressure at the pump suction port increases from 0.043 to 0.068 MPa, effectively suppressing bubble precipitation. It can also be observed that the stable pressure at large flow rates differs, as the pressure drop along the pipeline decreases when the inner diameter increases.
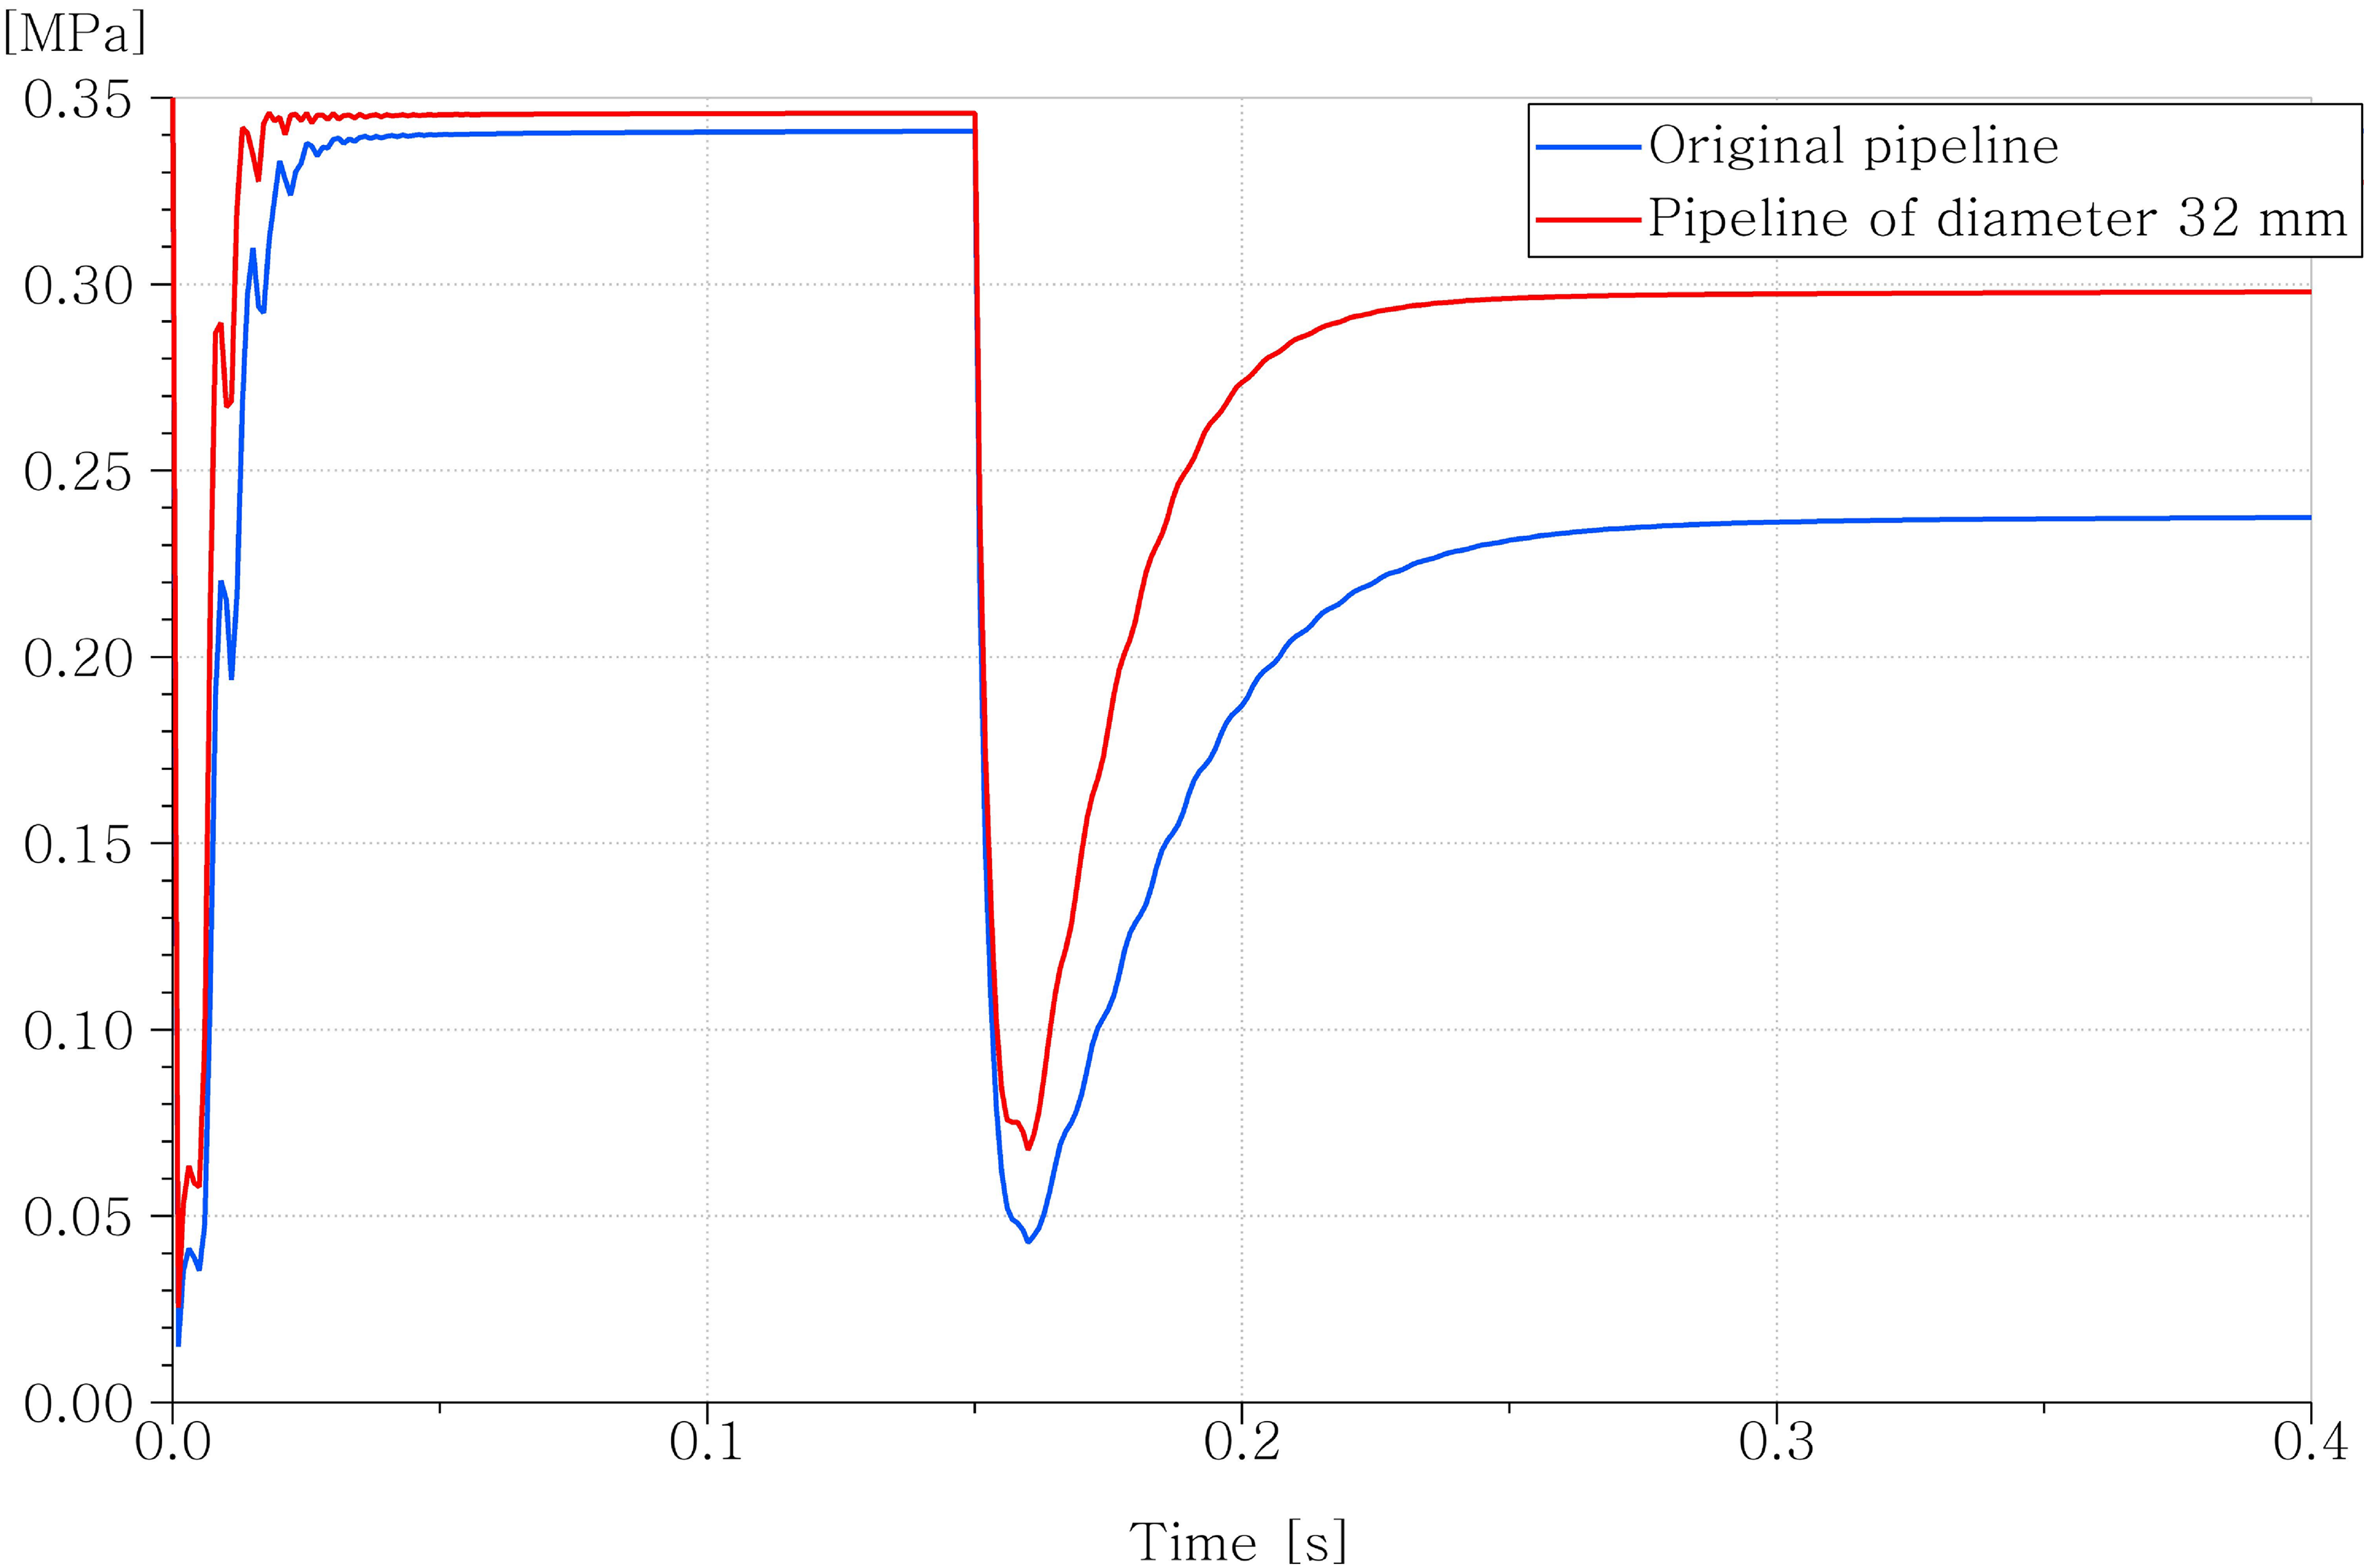
Comparison of pump suction port pressure with different pipe diameters.
Tank pressure
The reservoir boost pressure is increased from a baseline of 0.35 to 0.45 MPa and 0.55 MPa. Simulations show that this increase raised the minimum pressure at the pump suction port from 0.043 to 0.072 MPa and 0.128 MPa, respectively, as shown in Figure 15.
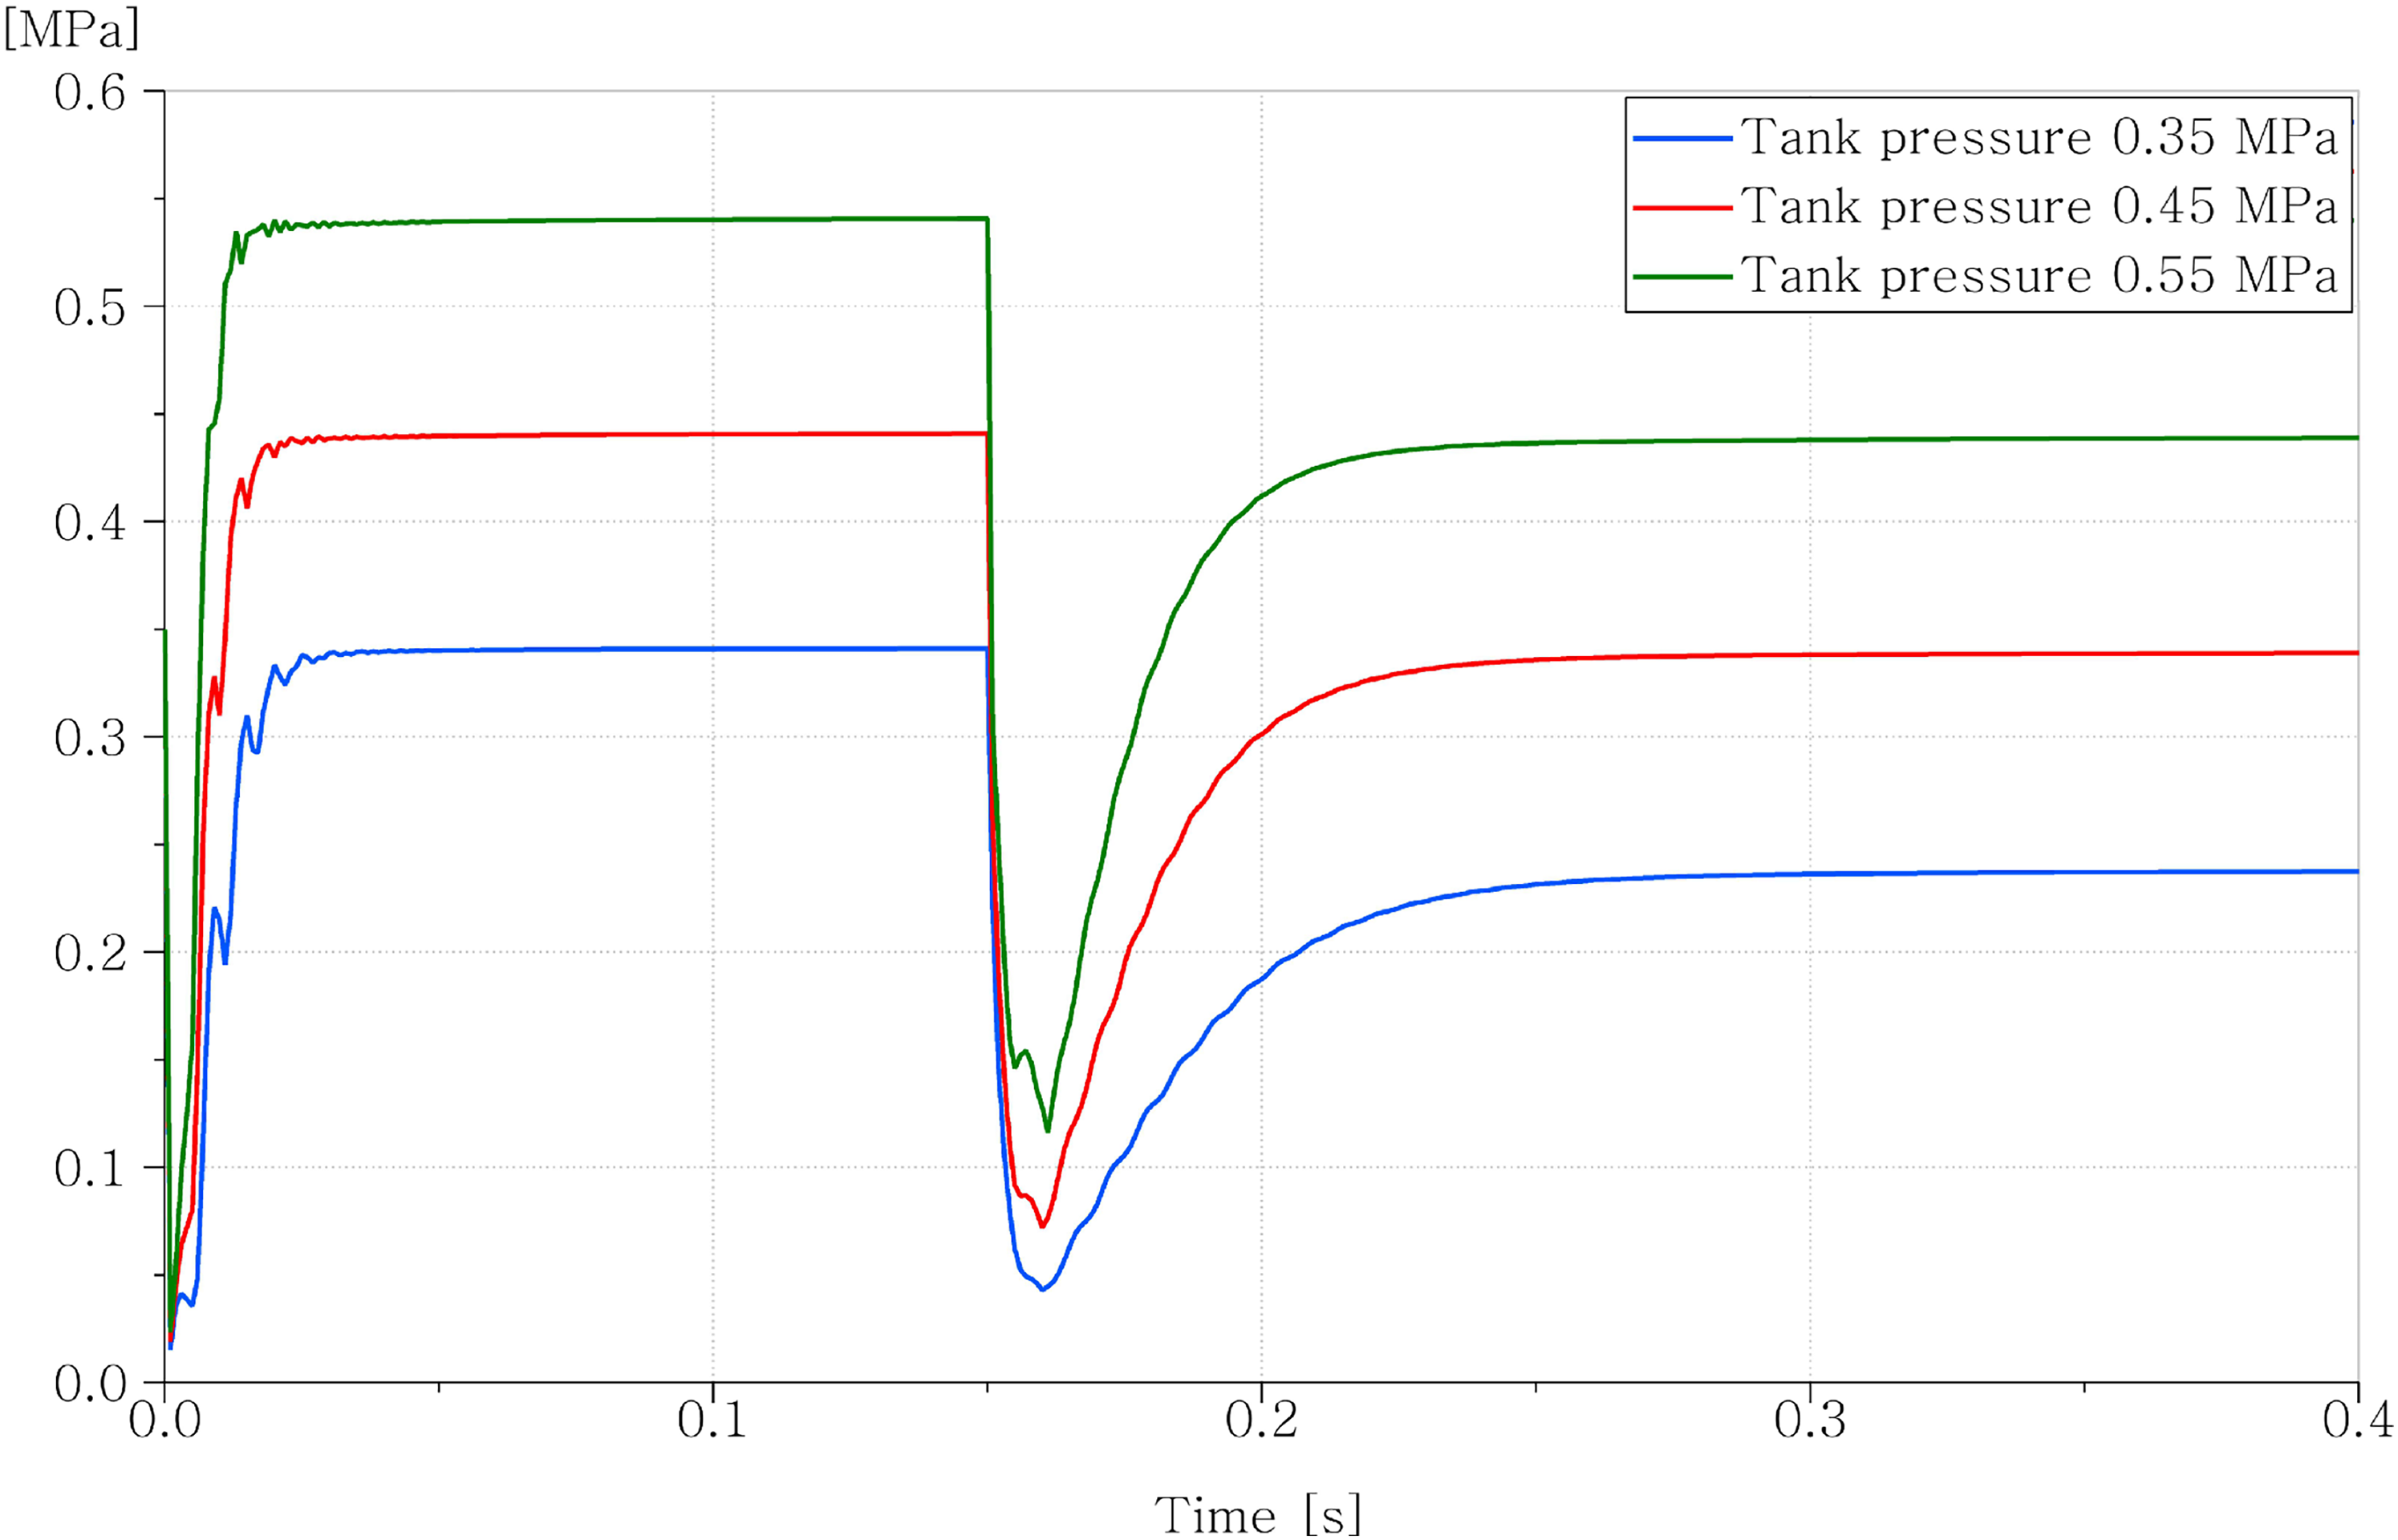
Comparison of pump suction port pressure with different tank pressures.
Pipe shape and gas content
The crucial cause of cavitation is the presence of dissolved and mixed gases in the oil, combined with a local low-pressure region associated with the pipe geometry, particularly at pipe bends. Although degassing the oil is the most direct solution, it is difficult to implement and monitor during aircraft operation. Therefore, a more feasible approach is to optimise the pipe geometry. Here, pipe geometry optimisation mainly involves two key parameters: (1) increasing the bending radius to reduce flow separation and pressure drop, and (2) adjusting the bend angle to minimise gas accumulation at vulnerable locations. These modifications must be carefully designed to ensure effectiveness without compromising the piping system's functional requirements. The geometric modification of increased bending radius from 2D to 3D at the location prone to cavitation erosion of the failed pipe has proven effective on the improved pipes, which have accumulated service time exceeding 10% of their design life without any cavitation erosion.
Conclusions
This case study investigates the root cause of recurrent leakage failures in a 1Cr18Ni9Ti hydraulic suction pipeline at a specific location. The damaged surface was examined at both macro- and microscales using OM, SEM, and 3D CT. To understand the underlying flow dynamics, CFD and a 1D characteristic line method were employed to simulate gas volume fraction and pressure distribution. Based on the results, the key conclusions are as follows:
Surface analysis reveals characteristic features of cavitation erosion as the failure mechanism, evidenced by shallow pits and deep pits at the initial stage, and multi-directional fatigue cracks with craters at the acceleration stage. Simulation analysis elucidates the underlying cause: during instantaneous high-flow conditions, the pressure at the specific bend falls below a critical threshold in gas accumulation zones, triggering dissolved gas precipitation and subsequent bubble implosion. This mechanism confirms an inherent structural risk of cavitation in the hydraulic suction line. Based on these findings, three practical improvement strategies are proposed: increasing reservoir boost pressure, enlarging the pipe diameter, and optimising pipe geometry by increasing the bending radius at the susceptible location.
Footnotes
Acknowledgements
Constructive comments on this article by Prof. Changkui Liu (AECC Beijing Institute of Aeronautical Materials) are gratefully acknowledged.
Funding
The authors received no financial support for the research, authorship, and/or publication of this article.
Declaration of conflicting interests
The authors declared no potential conflicts of interest with respect to the research, authorship, and/or publication of this article.