
Abstract
We analyzed data from 2253 veterans with type 1 (34%) or type 2 (66%) diabetes who initiated Dexcom continuous glucose monitoring (CGM) between 2015 and 2022, all with ≥10 days of data over a 6-month landmark period. CGM data were merged with electronic health records (EHR). Diabetic retinopathy (DR) was defined from EHR diagnoses. Incident DR was assessed up to 4 years from CGM initiation. Cox models evaluated associations between CGM metrics (mean glucose [MG], time in range [TIR], time above range [TAR], glycemia risk index [GRI], coefficient of variation, and week-to-week average real variability [ARV]) and DR. There were 99 incident DR events. In separate multivariable models, higher MG, TAR, GRI, and ARV, and lower TIR were associated with DR risk; these associations (except ARV) remained significant after landmark HbA1c adjustment and were stronger than for landmark HbA1c itself, suggesting that CGM metrics provide more informative risk stratification than HbA1c alone.
This is a visual representation of the abstract.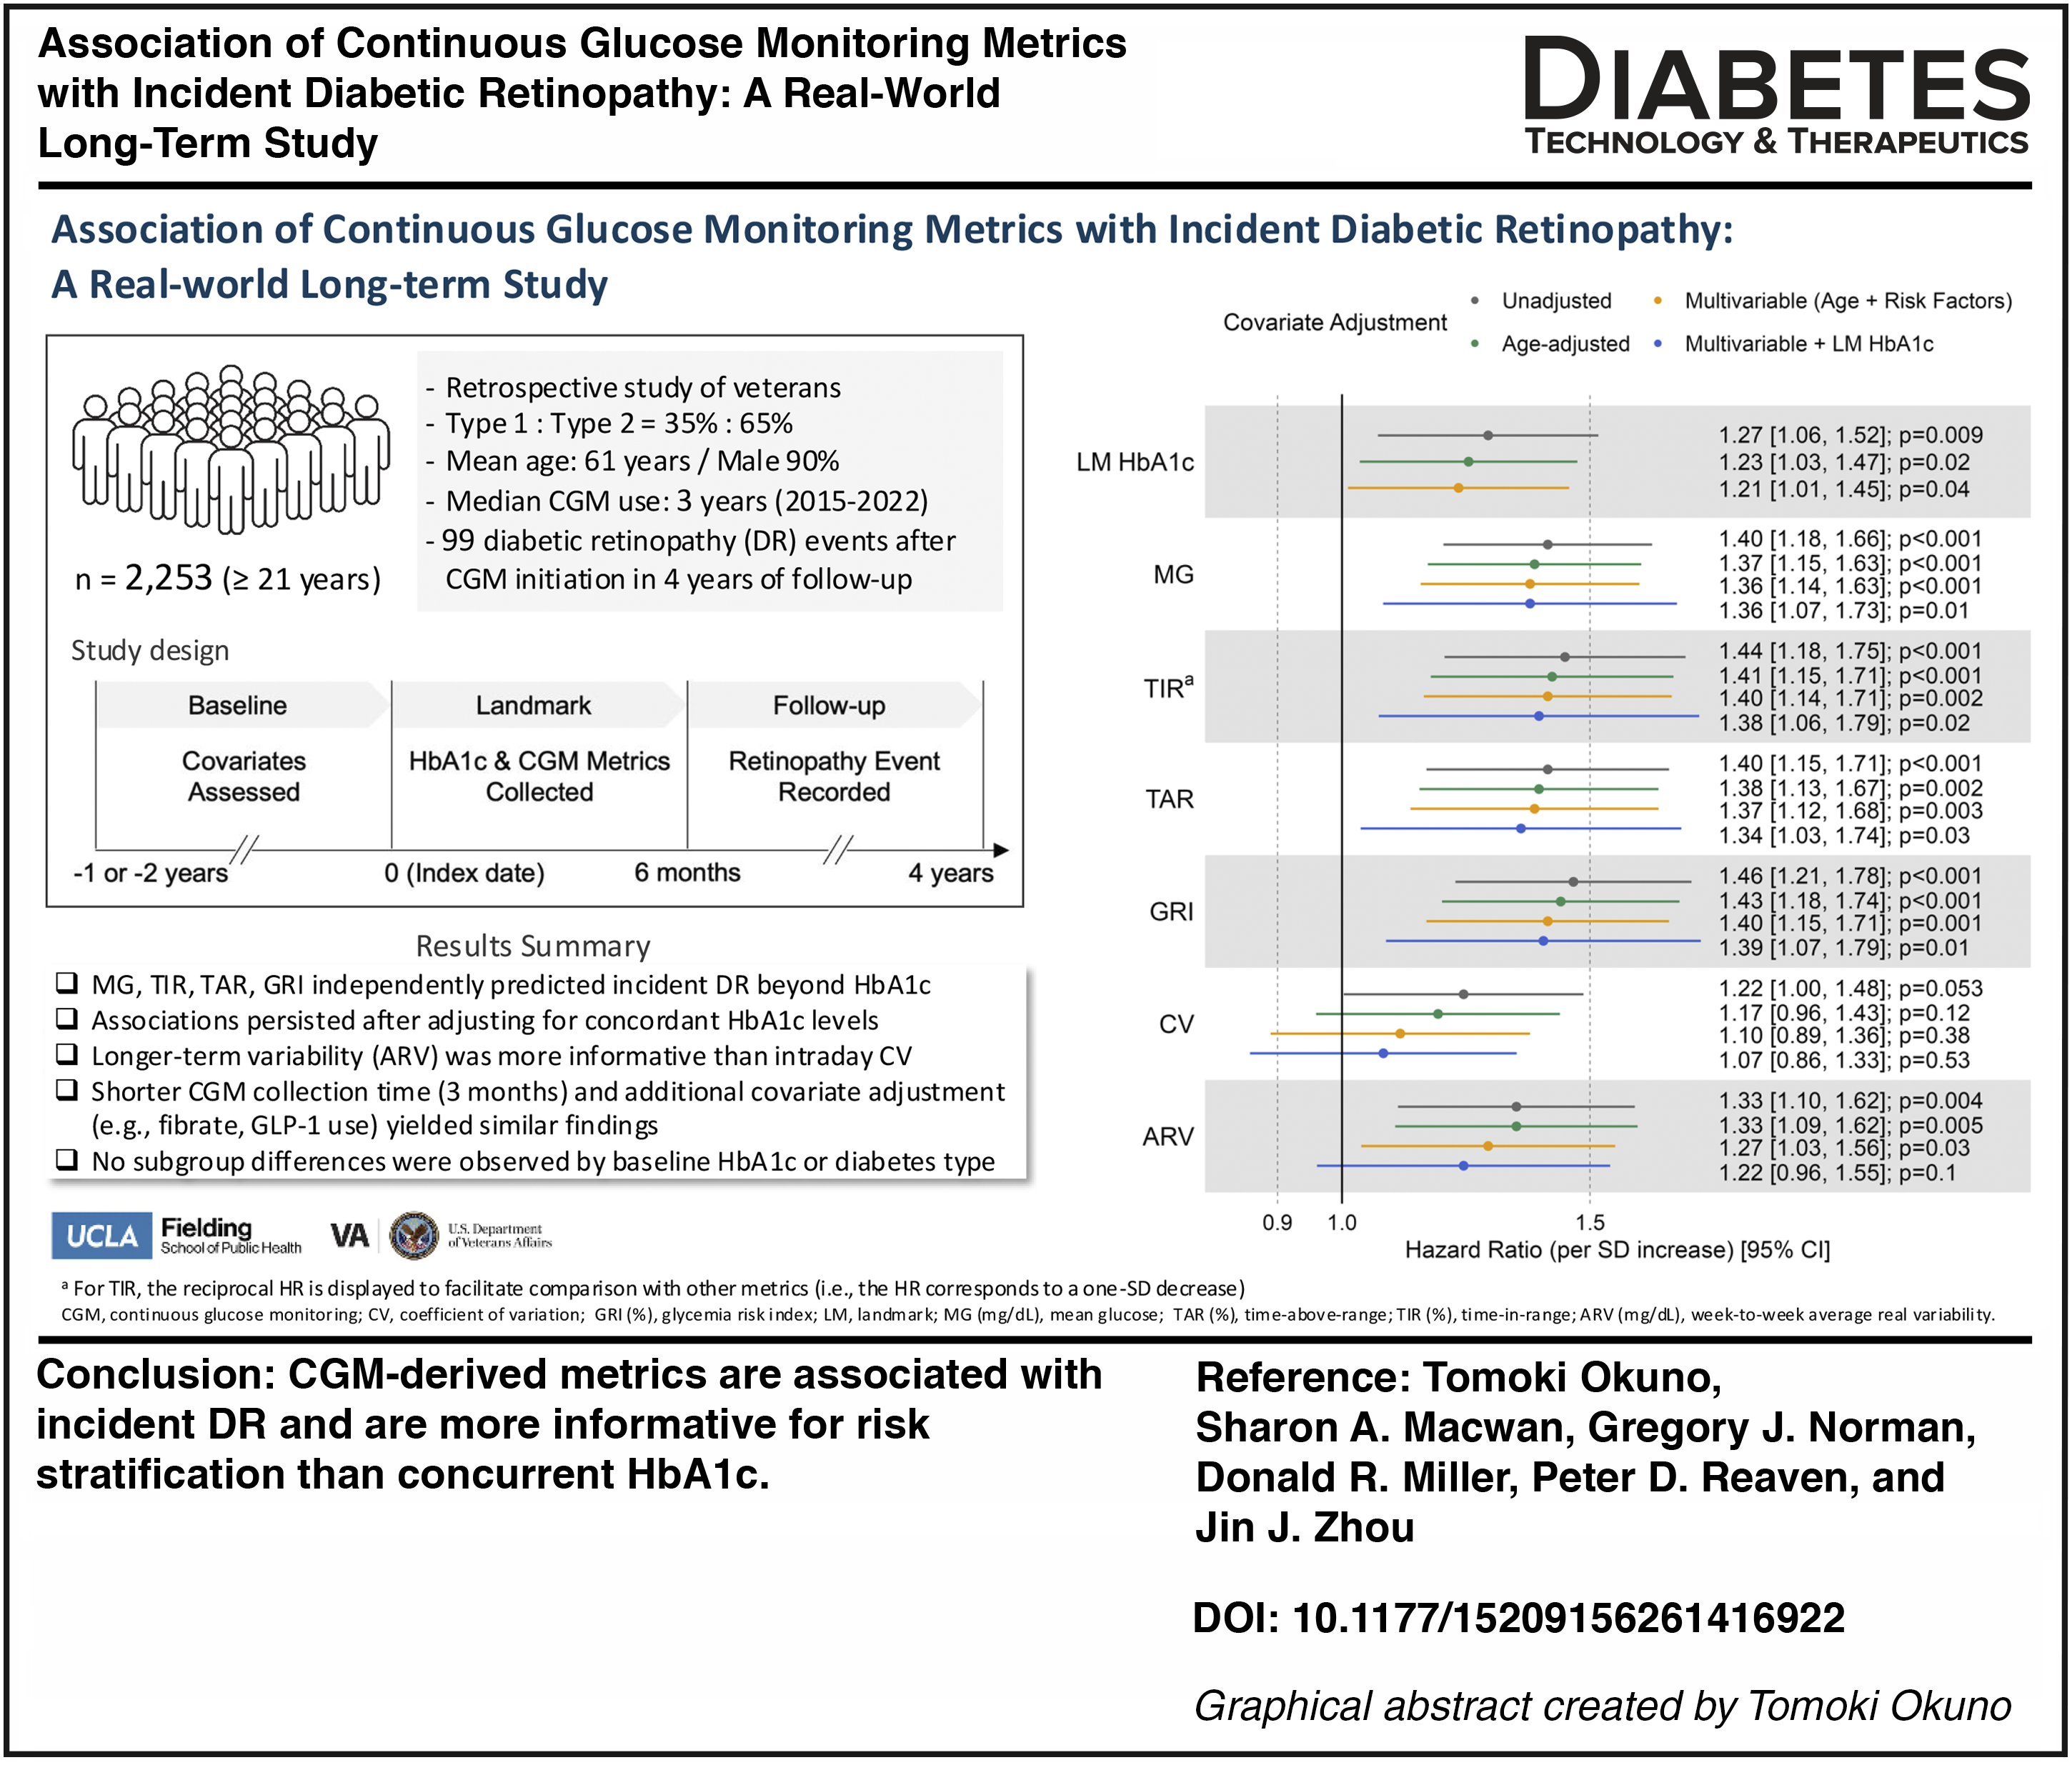
Keywords
Introduction
Diabetic retinopathy (DR) is a leading cause of vision loss among adults with diabetes. 1 HbA1c has long served as the primary marker of glycemic control, and its level and long-term variability are associated with DR risk in type 1 diabetes (T1D)2–4 and type 2 diabetes (T2D).5–7 However, HbA1c reflects average glycemia over 3 months, and does not capture broader patterns of glucose exposure or short-term glycemic variability that may contribute to microvascular risk.8,9
Continuous glucose monitoring (CGM) provides high-frequency glucose data that may capture disease risk from hyperglycemia and glycemic variability not reflected by HbA1c. Although CGM-derived metrics have been increasingly investigated as predictors of microvascular complications, including DR,10,11 most studies collected CGM data for a few days and/or examined prevalent DR.12–17 Two studies evaluated CGM predictors of incident DR; a small case–control outpatient study of T1D (n = 71) 18 and a large outpatient T2D cohort (n = 2518). 19 Despite strong correlations between HbA1c and CGM metrics such as time in range (TIR), 20 neither incident-DR study adjusted for baseline or follow-up HbA1c levels, and both had limited CGM collection (2–4 days) and a narrow set of CGM metrics.
To extend and complement these prior studies, we used a large US Veterans Affairs (VA) outpatient cohort of 2752 T1D and T2D patients, with linked CGM and electronic health record (EHR) data and up to 7 years of follow-up. We evaluated whether a broad array of CGM metrics was associated with incident DR, and whether these associations persisted after accounting for concordant HbA1c values.
Methods
We used a retrospective, longitudinal cohort study design linking EHR from the VA Healthcare System (VAHCS) with Dexcom CGM device data, using previously described linkage and quality control procedures. 21 The index date was the first day Dexcom CGM data were available. The baseline (12 or 24 months, depending on the baseline variable), landmark (LM) period (6 months for CGM data collection), and follow-up (up to 3.5 years after the end of the LM period) are illustrated in Supplementary Figure S1. Details on baseline variables and ascertainment windows are provided in the Supplementary Methods. CGM metrics were computed over the LM period. Follow-up ended at the earliest of incident DR, the patient’s last VA encounter, or the maximum follow-up.
The protocol was approved by the Phoenix VAHCS Institutional Review Board (IRB), and Dexcom, Inc. received an external IRB exemption to share CGM data with the VA.
The cohort included veterans aged ≥21 years with at least one ICD code for T1D or T2D between 2002 and 2020 who initiated CGM from 2015 to 2022. Diabetes type was defined using a modified Klompas algorithm, as previously described 22 ; median duration of CGM use was 3.0 years in T1D and 2.8 years in T2D.
Incident DR was defined as previously described, 23 that is, requiring either (i) ≥2 unique DR-coded days (ICD9/ICD10 or DR health-factor codes) or (ii) ≥1 DR code or health factor within 24 h of an ophthalmical exam (fundus-photography CPT, teleretinal evidence, or a general CPT with a 408-stop code). The first occurrence during follow-up was classified as incident DR. Patients were excluded for any evidence of DR in the 2 years preceding the index date, defined as ≥1 unique DR-coded day or meeting definition (ii). In the source cohort (n = 2752), 99% of patients had at least one encounter more than 2 years before the index date, supporting adequate ascertainment of preexisting DR.
Excluding patients with prior DR, lost to follow-up, or <10 total days of CGM wear (not necessarily consecutive) during the LM period, yielded a final sample size of 2253 (771 T1D and 1482 T2D).
CGM measurements examined included: mean glucose (MG, mg/dL), time above range (TAR, % time > 180 mg/dL), glycemia risk index (GRI), 24 a published composite CGM risk index, coefficient of variation (CV), and week-to-week average real variability (ARV).25,26 Patients without sufficient data within or across weekly intervals were excluded from analyses examining ARV (see Supplementary Table S1 for detailed calculations). Given the very low hypoglycemia burden in this cohort, time below range (% time < 70 mg/dL) was not included.
LM HbA1c (%) from EHR was defined as the average of HbA1c measurements during the LM period plus the following 6 weeks (as detailed in Okuno et al. 27 ).
We used Cox proportional hazards models to model the incidence of DR. Stepwise covariate adjustment approaches included a univariable model with single glycemic measures only; an age-adjusted model adding baseline age; a multivariable model adding clinically relevant DR risk factors (sex, body mass index [BMI], low-density lipoprotein [LDL] cholesterol, high-density lipoprotein [HDL] cholesterol, triglycerides [TG], systolic blood pressure [SBP], smoking status, and estimated glomerular filtration rate [eGFR]) 19 ; and a multivariable model with LM HbA1c added.
Preliminary spline analyses, following Okuno et al., 27 showed that the associations of LM HbA1c and CGM metrics with incident DR were adequately captured by linear terms, outperforming polynomial alternatives. Accordingly, both LM HbA1c and CGM metrics were modeled linearly.
Hazard ratios (HR) for glycemic exposures reflect the change in risk per 1-SD increase. Cox models for all primary exposures met the proportional hazard assumption based on Schoenfeld residuals. 28 For baseline HbA1c and other baseline risk factors with missing values, multiple imputation by chained equations 29 was performed. 27
Sensitivity analyses included recalculating CGM metrics over 3 months (instead of 6), adjusting for additional covariates, including GLP-1 receptor agonist use, and repeating models in a newly diagnosed diabetes subset with adjustment for diabetes duration, and subgroup analyses by baseline HbA1c (≤8% vs. >8%) and diabetes type. Details are provided in the Supplementary Data.
Competing risk of death was assessed by comparing cumulative incidence functions for DR using Fine–Gray models. 30
A two-sided P value < 0.05 was considered significant.
Deidentified data, summary statistics, and code are available from the corresponding authors upon reasonable request, subject to VA privacy review.
Results
During the follow-up period, 99 of 2253 patients developed DR. Baseline characteristics of patients with and without DR are shown in Table 1. Patients with incident DR were similar in diabetes type and sex distribution but were younger and included fewer White, non-Hispanic individuals. They also had higher HDL cholesterol, HbA1c levels, and more hyperglycemia events and emergency room visits, and had lower rates of Medicare enrollment than those without DR. Missing ethnicity (4.4%), baseline BMI (4.8%), LDL cholesterol (14.5%), HDL cholesterol (14.2%), TG (13.9%), SBP (4.0%), and HbA1c (6.2%), and eGFR (10.7%) values were imputed for multivariable and sensitivity analyses. Days of CGM wear were consistently high (6-month [180-day] window: 169 [122–179] days; 3-month [90-day] window: 87 [72–90] days for median [IQR]).
Baseline Characteristics by Incident Diabetic Retinopathy Status (n = 2253)
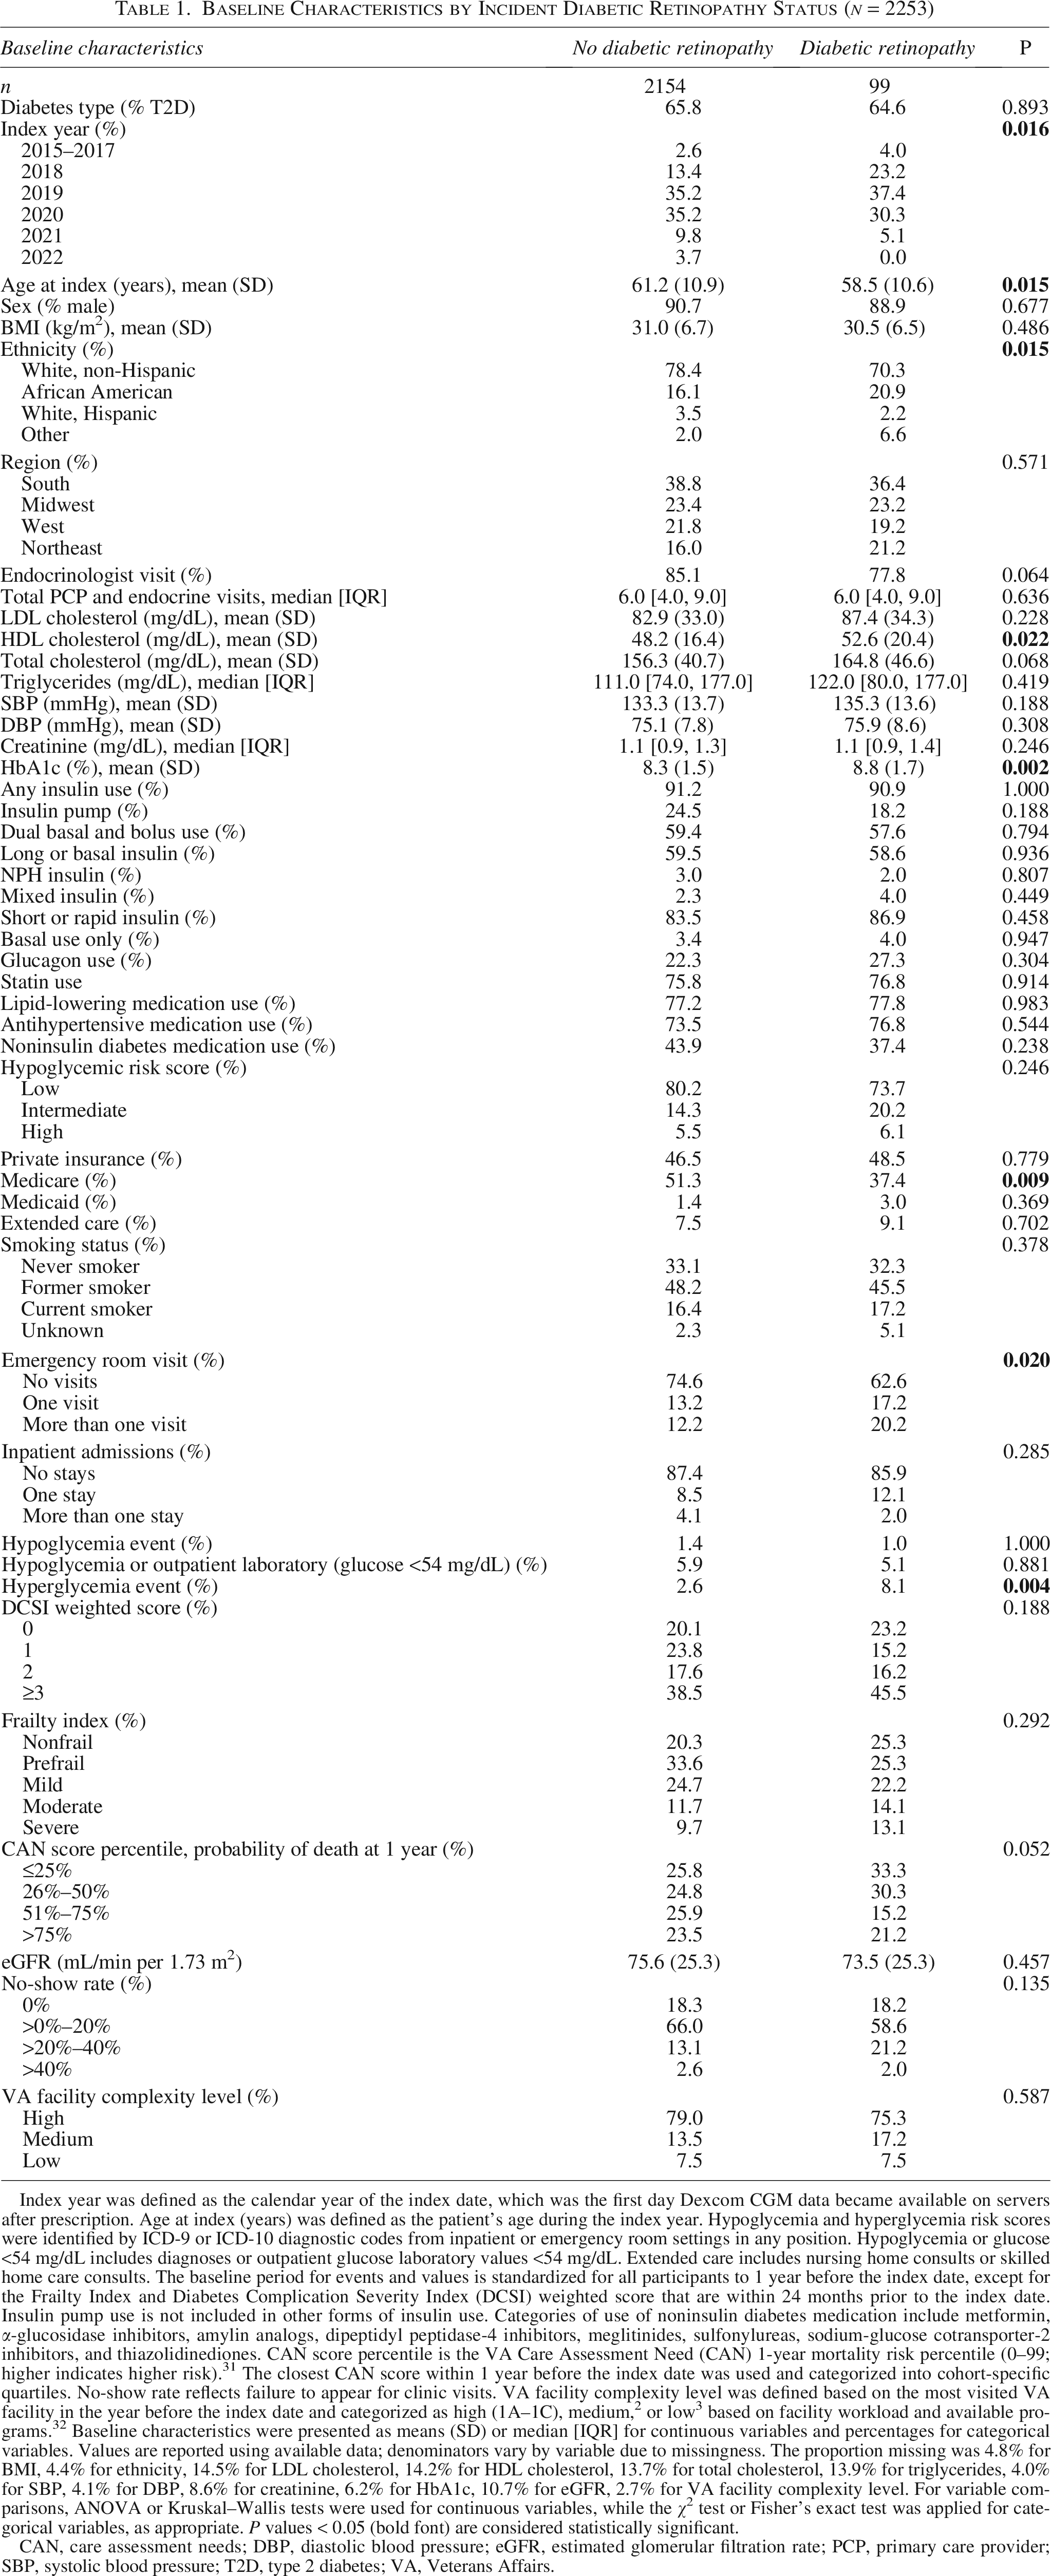
Index year was defined as the calendar year of the index date, which was the first day Dexcom CGM data became available on servers after prescription. Age at index (years) was defined as the patient’s age during the index year. Hypoglycemia and hyperglycemia risk scores were identified by ICD-9 or ICD-10 diagnostic codes from inpatient or emergency room settings in any position. Hypoglycemia or glucose <54 mg/dL includes diagnoses or outpatient glucose laboratory values <54 mg/dL. Extended care includes nursing home consults or skilled home care consults. The baseline period for events and values is standardized for all participants to 1 year before the index date, except for the Frailty Index and Diabetes Complication Severity Index (DCSI) weighted score that are within 24 months prior to the index date. Insulin pump use is not included in other forms of insulin use. Categories of use of noninsulin diabetes medication include metformin, α-glucosidase inhibitors, amylin analogs, dipeptidyl peptidase-4 inhibitors, meglitinides, sulfonylureas, sodium-glucose cotransporter-2 inhibitors, and thiazolidinediones. CAN score percentile is the VA Care Assessment Need (CAN) 1-year mortality risk percentile (0–99; higher indicates higher risk). 31 The closest CAN score within 1 year before the index date was used and categorized into cohort-specific quartiles. No-show rate reflects failure to appear for clinic visits. VA facility complexity level was defined based on the most visited VA facility in the year before the index date and categorized as high (1A–1C), medium, 2 or low 3 based on facility workload and available programs. 32 Baseline characteristics were presented as means (SD) or median [IQR] for continuous variables and percentages for categorical variables. Values are reported using available data; denominators vary by variable due to missingness. The proportion missing was 4.8% for BMI, 4.4% for ethnicity, 14.5% for LDL cholesterol, 14.2% for HDL cholesterol, 13.7% for total cholesterol, 13.9% for triglycerides, 4.0% for SBP, 4.1% for DBP, 8.6% for creatinine, 6.2% for HbA1c, 10.7% for eGFR, 2.7% for VA facility complexity level. For variable comparisons, ANOVA or Kruskal–Wallis tests were used for continuous variables, while the χ2 test or Fisher’s exact test was applied for categorical variables, as appropriate. P values < 0.05 (bold font) are considered statistically significant.
CAN, care assessment needs; DBP, diastolic blood pressure; eGFR, estimated glomerular filtration rate; PCP, primary care provider; SBP, systolic blood pressure; T2D, type 2 diabetes; VA, Veterans Affairs.
Figure 1 shows the estimated HRs for glycemic exposures per one-SD increase in increasingly adjusted Cox models. For easier comparison across metrics (in the figure), TIR results are presented as reciprocal HRs. In the univariable (unadjusted) model, LM HbA1c, MG, TAR, GRI, and ARV were associated with increased DR risk, and TIR was protective. Associations were slightly attenuated after age adjustment. After adjusting for known retinopathy risk factors, MG, TAR, GRI, and ARV remained associated with increased DR (HR: [95% CI]: 1.36 [1.14–1.63]; 1.37 [1.12–1.68]; 1.40 [1.15–1.71]; 1.27 [1.03–1.56], respectively). TIR remained protective (HR: 0.72 [0.58–0.88]); for each absolute 10% increase in TIR, DR risk decreased by 16% (HR: 0.84 [0.75–0.93]). LM HbA1c was also associated with DR but less strongly than these CGM metrics. Intraday CV showed no association. Even after adjusting for LM HbA1c, MG, TAR, GRI, and TIR remained associated with DR, while the association for ARV was no longer evident. Results were generally similar when using 3-month rather than 6-month CGM metrics.
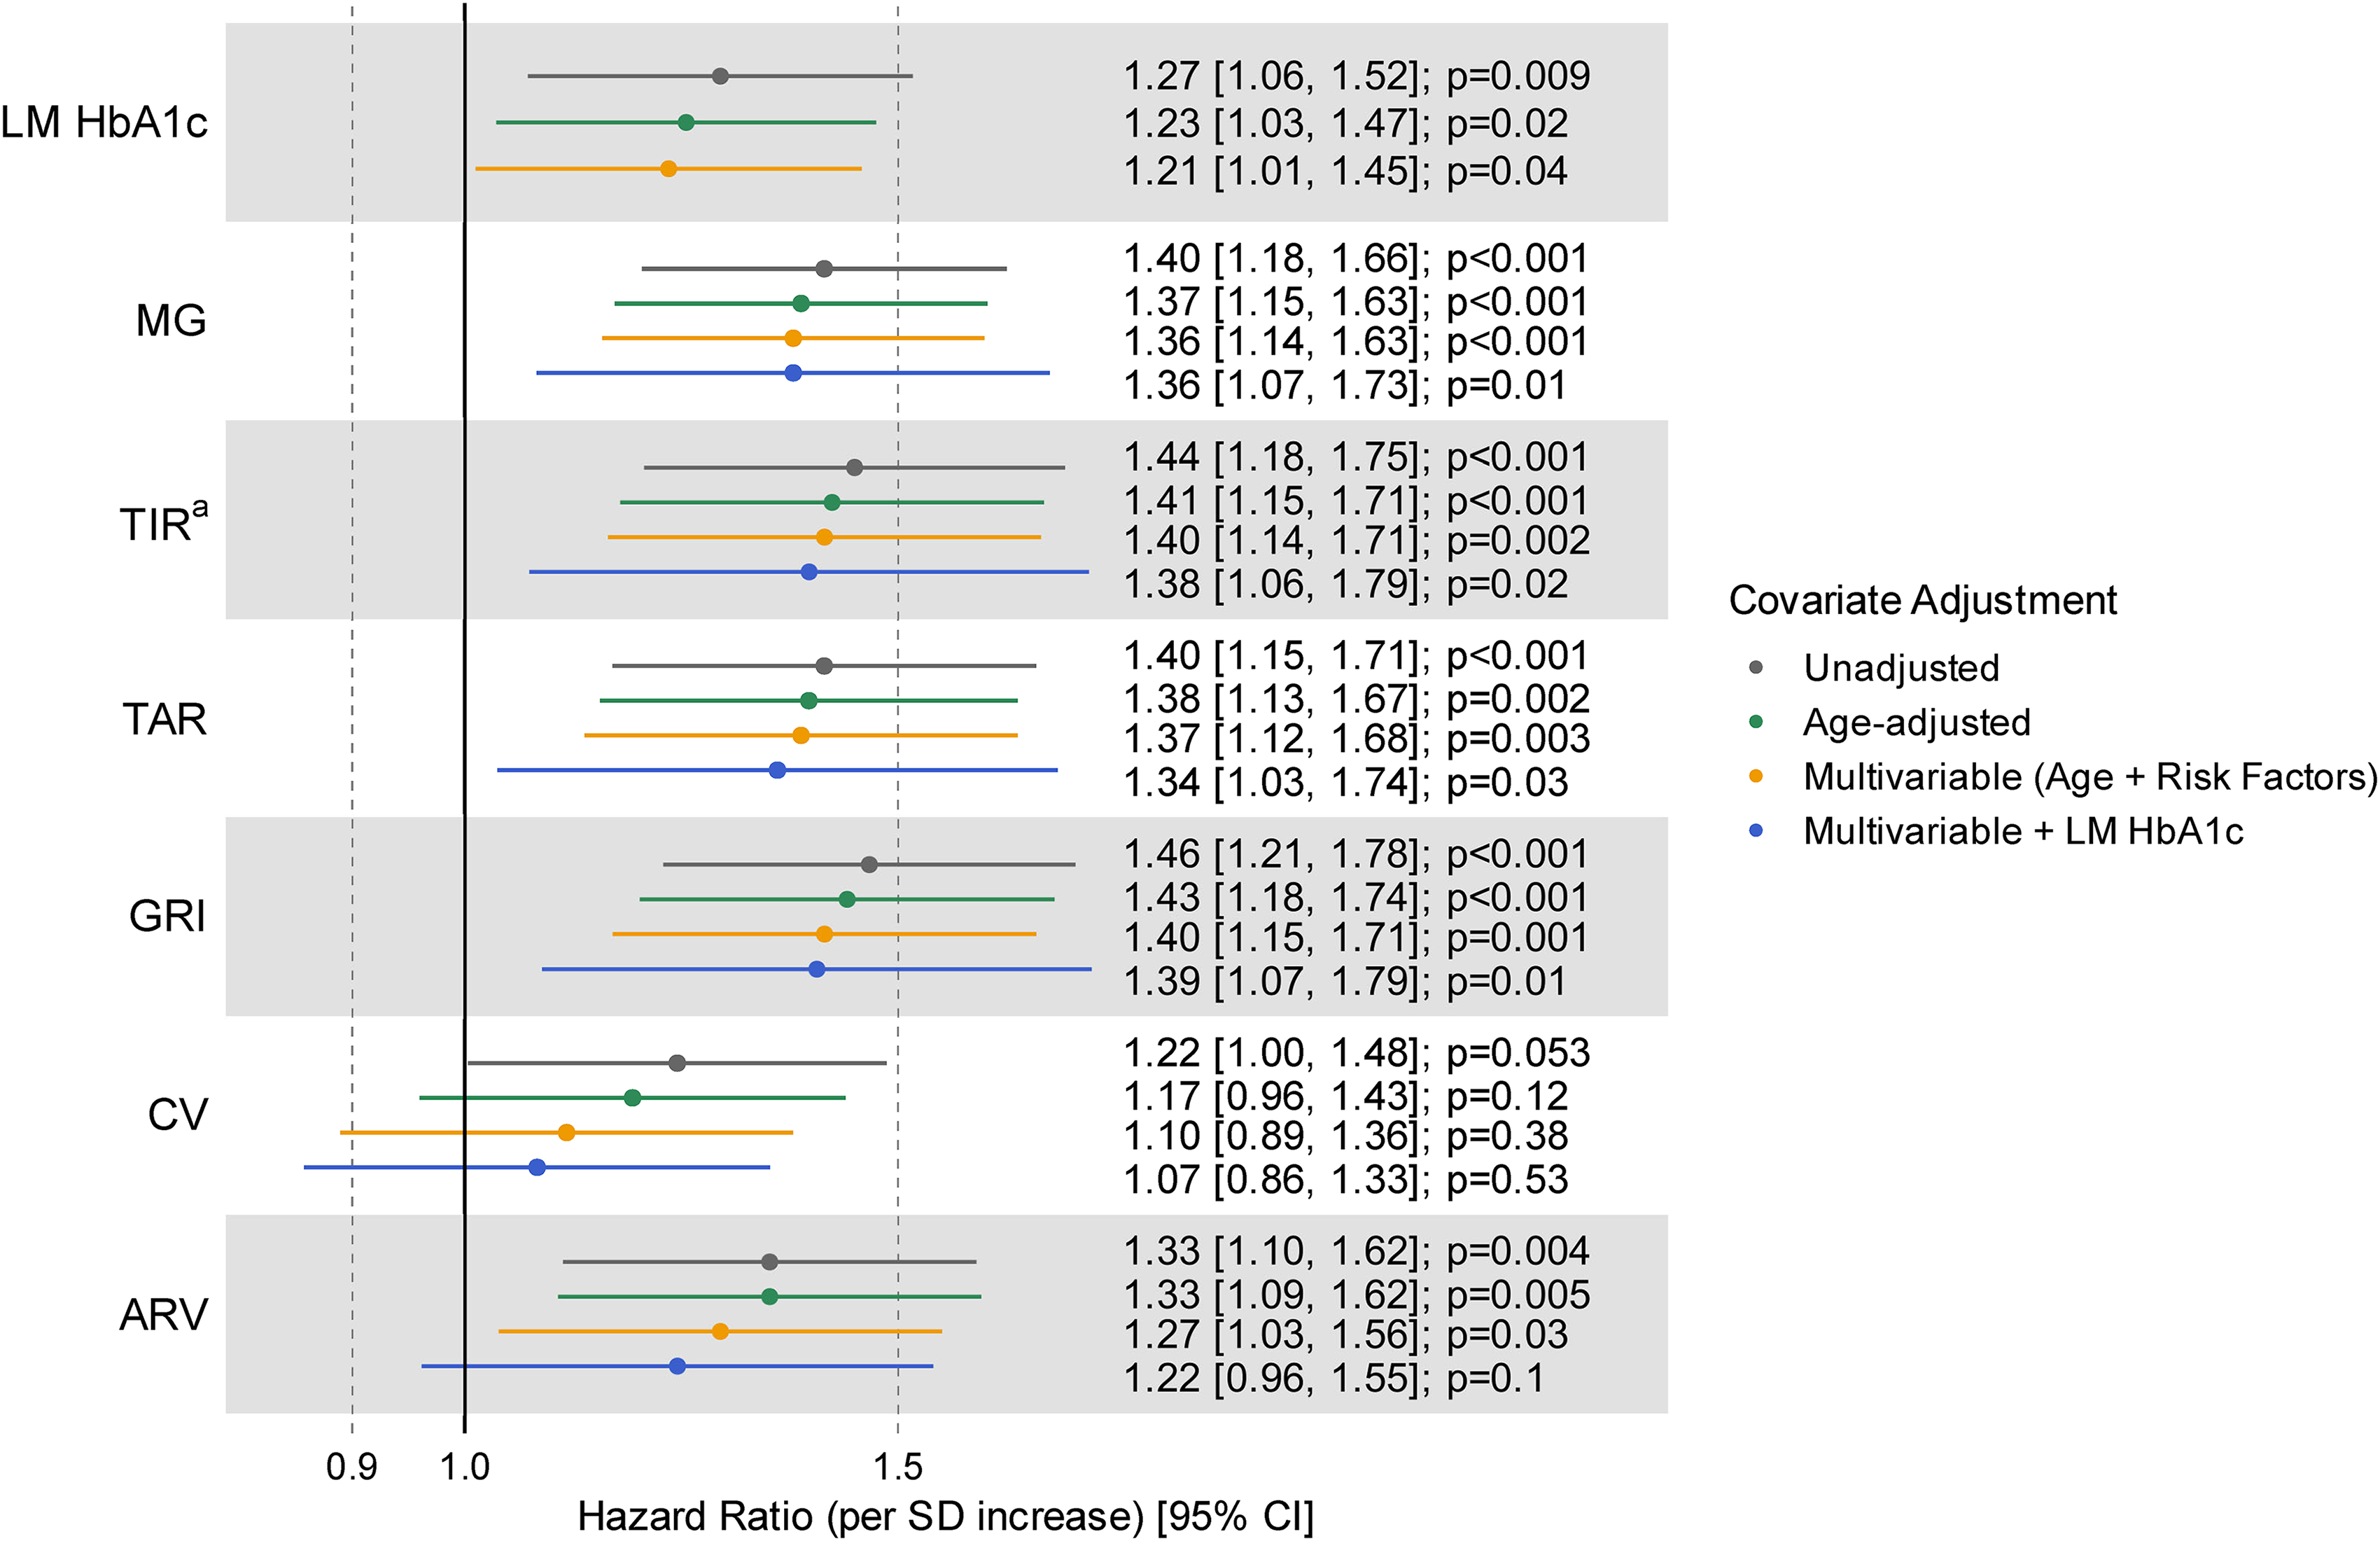
Hazard ratios (95% CI) for key glycemic exposures and incident diabetic retinopathy estimated using Cox proportional hazards models. Hazard ratios for glycemic exposures present the change in risk associated with a one-SD increase. aFor TIR, the reciprocal of the hazard ratio is displayed to facilitate comparison with other metrics (i.e., the HR corresponds to a 1-SD decrease in TIR), because lower TIR is associated with increased DR risk. Each point estimate (and CI) represents a separate model, with each model including only the corresponding glycemic exposure. There were 99 events in 2253 patients for exposures other than ARV, and 74 events in 1563 patients for ARV. Risk factors refer to the clinically relevant retinopathy risk factors (sex, body mass index, low-density lipoprotein cholesterol, high-density lipoprotein cholesterol, triglycerides, systolic blood pressure, smoking status, and estimated glomerular filtration rate). ARV (mg/dL), week-to-week average real variability; CV, coefficient of variation; GRI (%), glycemia risk index; LM HbA1c (%), landmark HbA1c; MG (mg/dL), mean glucose; SD, standard deviation; TAR (%), time above range; TIR (%), time in range.
Supplementary Figure S2 presents the sensitivity analysis results, which include adjustment for additional baseline factors that differed between patients with and without incident DR (Table 1). Associations for MG, TAR, GRI, and TIR were attenuated but remained significant. When LM HbA1c was further added to the model, associations for MG, GRI, and TIR persisted, whereas the association for TAR was no longer observed. Adjusting individually for baseline fibrate or GLP-1 use (medications with potential DR effects) did not attenuate the associations with or without LM HbA1c adjustment (not shown). When we restricted the cohort to veterans with newly diagnosed diabetes (60 of 1275 patients developed DR) and additionally adjusted for diabetes duration, MG showed a similar and still significant association with DR, whereas TIR, TAR, GRI, and ARV were directionally consistent but attenuated and no longer significant, consistent with reduced power in this subset; CV again showed no association (Supplementary Table S2).
We also evaluated DR risk by baseline HbA1c (>8% vs. ≤8%) and diabetes type (T1D vs. T2D) (Supplementary Table S3). Both analyses showed associations consistent with the total cohort with no meaningful effect modification (interaction P > 0.4 for HbA1c strata; interaction P > 0.3 for diabetes type).
Results remained essentially unchanged when accounting for the competing risk of death (not shown).
Discussion
In this national VA CGM–EHR cohort with long-term follow-up (median ∼3 years), time-to-event analyses showed that several CGM-derived metrics (MG, TIR, TAR, GRI, and ARV) during the 6-month observation window were associated with incident DR even after accounting for retinopathy-related risk factors. A shorter collection time (3 months) demonstrated similar findings. Our findings extend prior work—often cross-sectional or with shorter CGM collection windows—by providing long-term prospective data supporting the prognostic relevance of MG, TAR,15,18 and TIR.13,15,16,18,19 Mechanistically, these metrics capture greater hyperglycemic exposure and glycemic excursions that may drive retinal microvascular injury through oxidative stress, inflammatory activation, and endothelial dysfunction.33–35 Importantly, these associations (except ARV) persisted after adjustment for LM HbA1c and were stronger than the association for LM HbA1c itself, underscoring the additional prognostic value of CGM metrics. By contrast, CV showed no clear relationship with DR, consistent with prior work.14,15 In our analysis, CV primarily reflected within-day dispersion of glucose values, whereas ARV captured week-to-week fluctuations in MG; thus, these metrics characterize distinct dimensions of glycemic variability and may reflect different underlying pathophysiologic processes or identify subgroups of individuals with differing risk profiles. Our findings extend prior work on outpatient CGM metrics and incident DR by delivering the first large-scale, long-term real-world evaluation and demonstrating that these CGM-derived risk signals persist even among patients with comparable HbA1c.
Multiple sensitivity analyses, including adjusting for additional clinical covariates and diabetes medications known to affect retinopathy, testing CGM metrics at high and low HbA1c values, and accounting for the competing risk of death, yielded similar results. Additionally, using CGM metrics derived from only 3 months of data produced comparable results. This suggests that improved prediction of outcomes can be achieved without requiring extended CGM metric collection. In a sensitivity analysis restricted to veterans with newly diagnosed diabetes, adjusting for diabetes duration yielded effect estimates similar to the main results, suggesting that diabetes duration is unlikely to explain the CGM–DR associations.
Study limitations include reduced generalizability to younger individuals, women, and other demographic groups; reliance on an EHR-based DR definition, which may misclassify some cases; and limited availability of diabetes duration (only for a newly diagnosed subset) and unavailability of CGM device generation information, which precluded their inclusion as covariates. Finally, fibrate and GLP-1 receptor agonist use were modeled as baseline covariates; we could not distinguish recent initiation from long-term use or account for postindex treatment changes, limiting our ability to separate short- versus long-term medication effects.
These findings indicate that CGM-derived metrics—especially those capturing sustained hyperglycemia (e.g., MG, TIR, and TAR)—are associated with incident DR and are more informative for risk stratification than concurrent HbA1c. This supports the clinical relevance of more granular assessments of dysglycemia patterns and suggests that CGM metrics may represent superior endpoints to HbA1c when evaluating therapeutic effectiveness in clinical trials and regulatory settings. Pragmatic studies are needed to evaluate whether strategies that improve CGM metrics, particularly TIR, reduce incident DR risk and validate actionable CGM metric targets in independent cohorts.
Authors’ Contributions
T.O.: Conducted the analysis and drafted the initial manuscript. S.A.M.: Supported cohort creation. G.J.N.: Provided CGM-measured glucose data and revised manuscript. D.R.M.: Helped interpret the results and revised the manuscript. P.D.R.: Conceptualized the project, supervised it throughout, and revised the manuscript. J.J.Z.: Conceptualized the project, supervised it throughout, revised the manuscript, and was responsible for overall project oversight.
Footnotes
Author Disclosure Statement
G.J.N. is an employee of Dexcom, Inc. No other potential conflicts of interest relevant to this article were reported.
Funding Information
Funding for this study was received from Biomedical Laboratory Research and Development, VA Office of Research and Development (grant I01BX006126-01); the National Institutes of Health (grant R01HG006139); and the National Science Foundation (grants DMS-2054253 and IIS-2205441).
Supplemental Material
References
Supplementary Material
Please find the following supplemental material available below.
For Open Access articles published under a Creative Commons License, all supplemental material carries the same license as the article it is associated with.
For non-Open Access articles published, all supplemental material carries a non-exclusive license, and permission requests for re-use of supplemental material or any part of supplemental material shall be sent directly to the copyright owner as specified in the copyright notice associated with the article.