






Abstract
This article explores the conditions and assumptions under which it is possible to use National Incident-Based Reporting System (NIBRS) in lifetime crime computations, particularly for nonfatal violent crimes. We describe methods for using NIBRS to study lifetime risk for a variety of crimes and show how researchers and policy makers can apply these methods using readily available software such as Microsoft Excel. Finally, we demonstrate in two different studies how NIBRS can be used to estimate lifetime risk at the state and national levels. In doing so, we introduce the concept of the “average person” in each age–sex–race grouping to calculate the risk of victimization for this hypothetical person only.
Keywords
Introduction
Lifetime risk estimations are important tools in the field of public health. They provide assessments of risk at various points along the life course based on age, race, and sex for particular diseases such as cancer, schizophrenia, and heart disease, among many others. Lifetime risk computations help policy makers better understand the nature and extent of diseases and how best to respond to them. They also provide ways to quantify the success or failures of public policy aimed at reducing risk for everyone in a population or for subgroups in the population which experience risk disproportionate to their representation. Groups like the National Cancer Institute (NCI) regularly publish reports that reflect disparity in risk for diseases across age, race, and sex groupings. For example, a recent NCI report indicates that although African Americans are 6% less likely than White Americans to develop cancer over their lifetime, they are more likely than Whites to develop stomach and prostate cancer by 39% and 38%, respectively (Howlader et al., 2014). Clearly, this is important information for public policy makers whose goal is to help reduce this risk.
Crime victimization is another form of health risk that affects the population differently, especially by age, sex, and race. But the limitations of the existing national crime data often prevent this type of analysis. Lifetime likelihood computations are possible via the National Crime Victimization Survey (NCVS), the Summary Uniform Crime Reporting (UCR) Program, 1 and the National Incident-Based Reporting System (NIBRS) but with qualifications and specific limitations. The NCVS lifetime likelihood computations are only national in scope and do not include children under 12 or victims of murder. Summary UCR data can be used to compute the likelihood of murder victimization over a lifetime for all ages and age groupings. But this is not possible for any other UCR index crime category because information about the age, sex, and race of the victim is not captured. Since NIBRS does collect age, sex, and race data from the victims of violent crime, it is now possible to compute the lifetime risk of violent crime victimization. Using the methods we describe in this article, estimates of risk can be made from birth to a specific age, such as 18 or 25 or for any other age over a lifetime. Risk estimates can also be established from a specific age, say 45, through the rest of a person’s life.
The purpose of this article is to explore the conditions and assumptions under which it is possible to use NIBRS in lifetime crime computations, particularly for nonfatal violent crimes such as intimate partner violence and aggravated assault. Just as assessing risk is an important tool for health research, understanding lifetime risk is relevant to crime research and policy.
In the pages that follow, we briefly outline findings from the few lifetime risk studies conducted using NCVS and summary UCR data. We then describe methods for using NIBRS to study lifetime risk for a variety of crimes and also show how researchers and policy makers can apply these methods using readily available software such as Microsoft Excel. Finally, we demonstrate in two different studies how NIBRS can be used to estimate lifetime risk at the state and national levels. In doing so, we introduce the concept of the “average person” in each age–sex–race grouping to calculate the risk of victimization for this hypothetical person.
Lifetime Risk Estimates With National Crime Victimization Data
In 1987, the Bureau of Justice Statistics (BJS) published Lifetime Likelihood of Victimization which reported estimates of the likelihood of victimization in the United States over a lifetime. The study was based on data from the National Crime Survey (NCS) 2 and the National Center for Health Statistics between 1975 and 1984 (Koppel, 1987). In this report, the probability that a person would be the victim of a crime at a particular age was based on rates of survival and victimization for specific age, sex, and race categories. Table 1 depicts the lifetime likelihood of violent crime victimization by race and sex based on NCS victimization rates from 1975 to 1984. 3 The report predicted that the vast majority of citizens (i.e., five of six) would become victims of violent crime in their lifetime. According to the data, Black men have the highest risk of victimization over their lifetime (92%). In addition, Table 1 presents the total risk of violent crime victimization to a more fine-grained risk estimate, that is, one, two, or three or more violent crime victimizations by race and sex.
Lifetime Likelihood of Violent Crime Victimization (Based on NCS Victimization Rates From 1975 to 1984).a,b
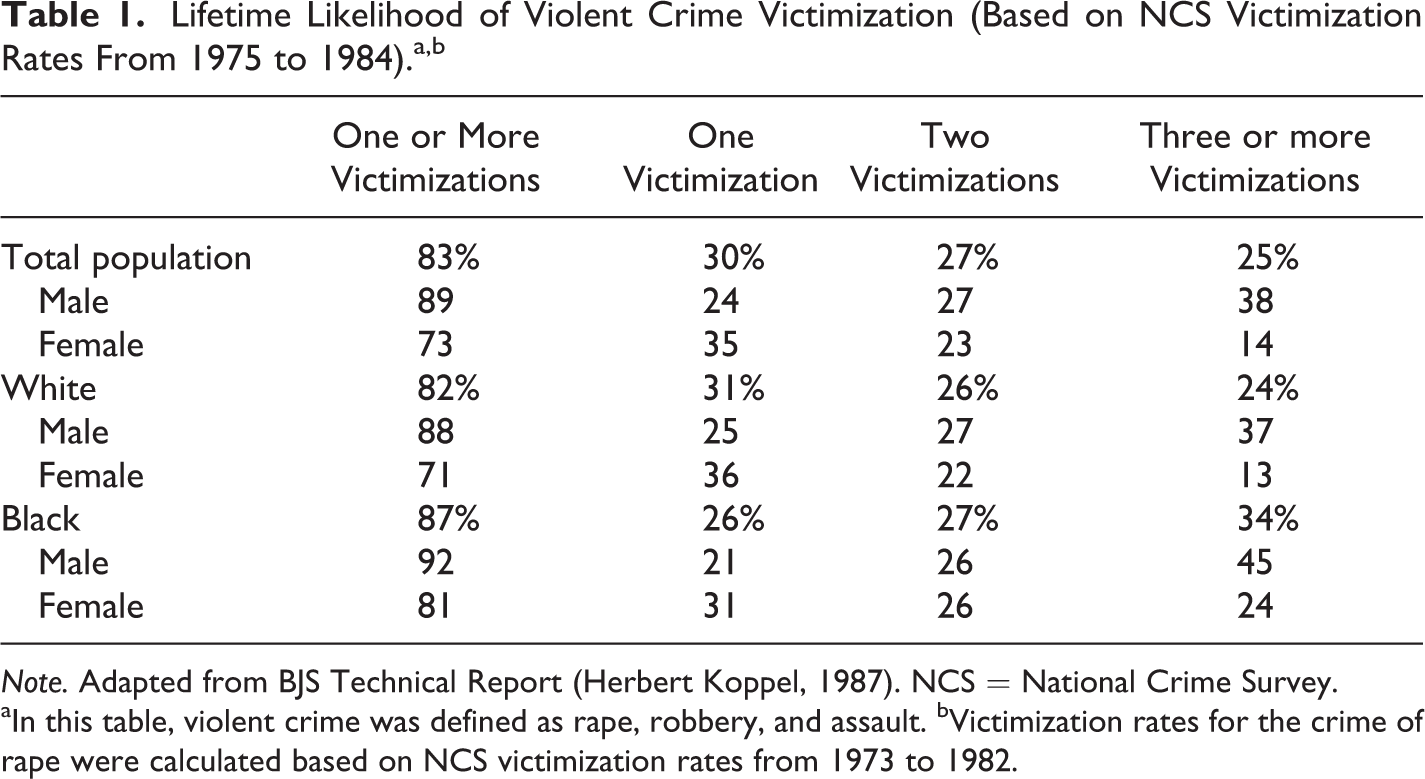
Note. Adapted from BJS Technical Report (Herbert Koppel, 1987). NCS = National Crime Survey.
aIn this table, violent crime was defined as rape, robbery, and assault. bVictimization rates for the crime of rape were calculated based on NCS victimization rates from 1973 to 1982.
Using data from the same study, Table 2 presents the risk of violent crime victimization starting at various ages and continuing over a lifetime. For example, from age 12 through 70, people in the United States have an 83% chance of being the victim of a violent crime. As the table indicates, the risk drops off as people age. By the time individuals in the United States reach the age of 50, their risk drops to 22% for the rest of their lives (assuming they live to the average age). If they live to 60, the risk for the remainder of a normal life drops to 14%.
Lifetime Likelihood of Violent Crime Victimization From Current Age to Rest of Life.
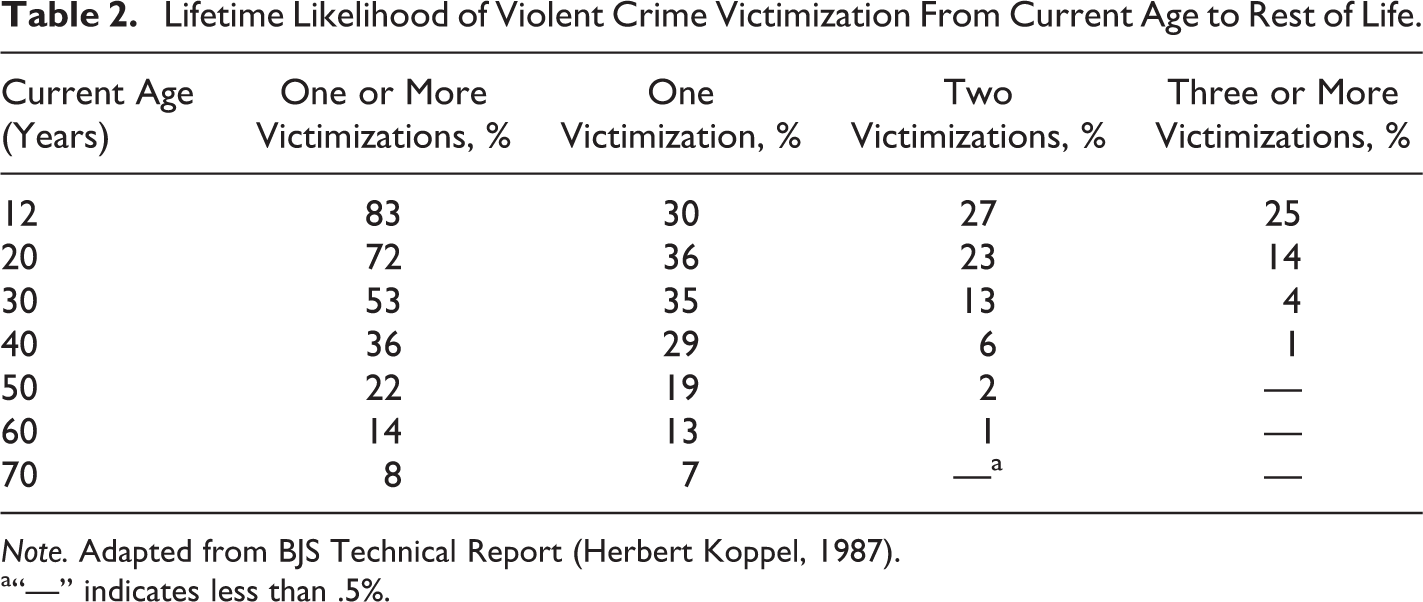
Note. Adapted from BJS Technical Report (Herbert Koppel, 1987).
a“—” indicates less than .5%.
Some researchers have been critical of the methodology used in the BJS report, stating that the estimates are “implausibly high” due to the inclusion of repeat victimization for nonfatal violent crimes and property crimes (Lynch, 1989, p. 263). Lynch argues that the NCS was not designed with lifetime computations in mind and that only a longitudinal survey of persons could allow for accurate lifetime victimization estimates. The NCS study was also challenged on its basic assumptions that victimization rates remain constant from year to year and that the risk of victimization is equally likely for all members of the age, race, and sex groupings. The author of the BJS study (Koppel, 1987) acknowledges these limitations in the publication. In addition, the NCS (now NCVS) is limited in other ways too; for example, it does not include children under the age of 12, highly mobile populations, and incarcerated people (Addington, 2008).
Lifetime Victimization Studies With UCR
In recent years, the FBI conducted two studies of the two lifetime risk of murder victimization one conducted in 1978 and the other in 1997 (Federal Bureau of Investigation [FBI], 1999). Using homicide data from the FBI’s Supplemental Homicide Reports, population data from the U.S. Bureau of Census, and survival data from the National Center for Health Statistics, the FBI researchers calculated homicide rates by age, sex, and race. When the number of survivors 4 in a particular age category was divided by the total number of murders for each age category, the resulting number was the reciprocal odds ratio for victimization likelihood. For example, based on the number of murders reported in 1978, individuals born alive that year would have a 1 in 157 chance of being the victim of a homicide over their lifetime. Based on the number of homicides in 1997, the lifetime chance for homicide victimization starting at age 0 was 1 in 240 (see Table 3).
Lifetime Risk for Murder Victimization in 1978 and 1997.
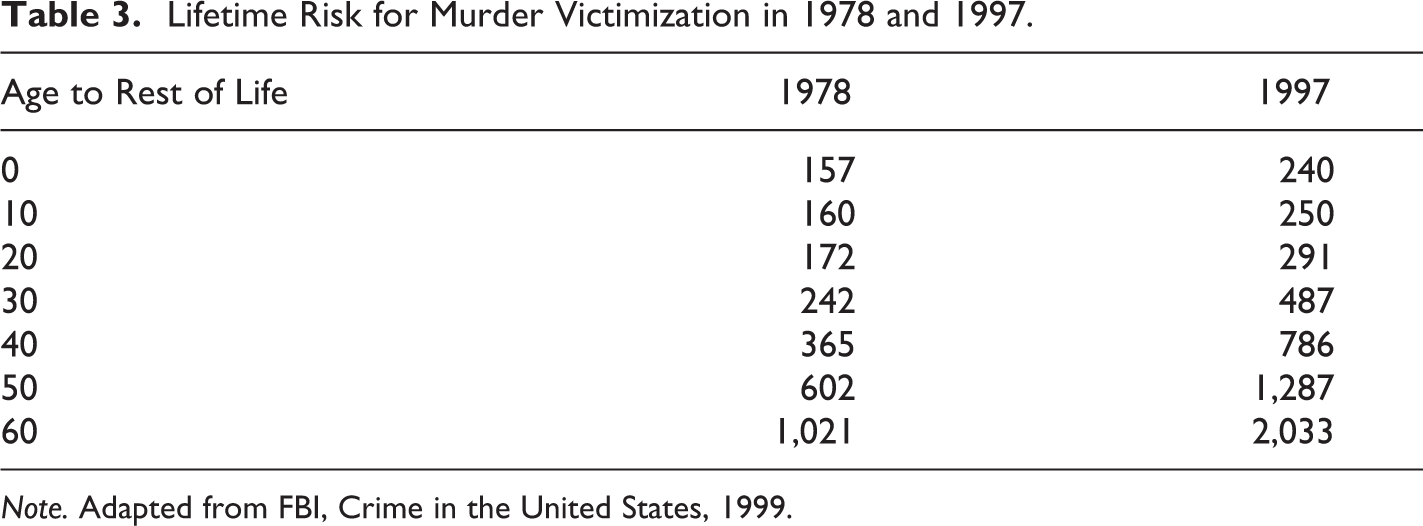
Note. Adapted from FBI, Crime in the United States, 1999.
In both of these studies, the researchers applied a single year’s murder rate into a lifetime frame. As shown in Table 3, the lifetime risk of homicide victimization changed dramatically from 1978 to 1997 which exposes the limitations of using a single year experience for making lifetime projections. For example, a person born in 1978, whose lifetime risk was assessed according to the 1978 experience, turned 19 years of age in 1997. Because conditions were different in 1997, his or her chances of homicide around age 20 changed from 1 in 172 to 1 in 291, a 41% lower risk than originally estimated. Notwithstanding this limitation, lifetime risk computations for the crime of murder can be useful in conveying what a single year experience will mean over a lifetime if conditions remain the same. This is true in public health studies too. As conditions affecting health problems such as heart disease change, so do the estimates of risk over the lifetime.
Lifetime Computations Using the NIBRS
Where the summary UCR program enables researchers to examine lifetime risk for only the crime of homicide, NIBRS provides data to make estimates for a variety of nonfatal violent crimes in a variety of contexts at both national and subnational levels. NIBRS provides an opportunity to extend the lifetime risk of violent crime victimization in the United States as a whole, or in smaller jurisdictions such as cities and states, beyond homicides to include nonfatal violent crimes such as aggravated assault. 5 Similar to the analytical methods used in the BJS and UCR studies mentioned above, our computations using NIBRS consider how the crime/victimization rate in a given period of time (i.e., 1 year) translates into a lifetime frame. Of course, we understand that NIBRS data are generated by police reports which are notoriously undercounted. Therefore, our model is limited to estimating the risk of being a victim of a crime that gets reported to and recorded by the police. Unlike the BJS study, we do not assume that all individuals in a particular age–sex–race group share the same risk, which of course they do not. Clearly, there are those individuals whose routine activities put them at higher (or lower) risk than others. Therefore, we introduce the concept of the average person in each age–sex–race grouping and calculate the risk of victimization for this hypothetical person only.
Poisson Distributions and the Average Person
In order to use NIBRS for lifetime victimization computations, we introduce the concept of the average person. 6 We must do this because we cannot determine the number of people who were repeat victims and, therefore, we cannot treat the crime rate (No. of victimizations/population) as the probability of victimization. The average person—as we describe in this article—is a hypothetical person whose risk of victimization is determined by the per person crime rate. By identifying this statistically average person, we are able to compute his or her risk of violent crime victimization over a lifetime using methods described below.
Our model assumes that the number of violent crime victimizations for an individual person is Poisson distributed with a parameter greater than 0. The average person at age a (again, a hypothetical person) has a Poisson parameter, λ, which is equal to the per person crime rate for that particular age. Since the violent crime rate is an averaged number, an average person is a “standardized” or “averaged” existence. The number of violent crime victimizations for an average person at age a has a Poisson density function given by
where x = the number of victimizations (e.g., 0, 1, 2, 3) and λ = R(a) (the per person crime rate at age a).
Since Poisson is a single parameter distribution, the mean and the variance are the same and equal to R(a). This implies that the per person crime rate R(a) is a measure of the annually expected number of victimizations for the average person at age a. This crime rate is not a measure of the probability of victimization, although it is often misinterpreted as such. Instead, the probability of violent crime victimization is 1—probability that x = 0 or 1 − f(0). From Equation 1, we can compute the probability of 0 victimizations as f(0) = e −λ and the probability of one or more victimizations as 1 − f(0) = 1 − e −λ. Moreover, the probability that a person will be victimized 1 or more times is smaller than the crime rate due to the fact that some citizens are victimized more than once and counted as separate victims for each reported incident (λ = R(a) > 1 − e −λ).
The Independence Assumption
The model assumes that the annual Poisson victimization variables for an individual are independent. In other words, if the average person lives to age a, he or she is cumulatively exposed to the Poisson victimization process with the parameter:
Equation 2 is based on the following theorem: Poisson distribution is “reproductive,” that is, the sum of k independent Poisson distributions is a Poisson distribution with its parameter being equal to the sum of k parameters (Stuart & Ord, 1987). Therefore, under the independence assumption, if the average person lives to age a, then the probability of his or her facing violent crime victimization x times is described by the Poisson density function with the parameter λ = T(a).
This computational method for estimating the lifetime risk of violent crime victimization can be interpreted from two main perspectives: (1) from age a through the rest of life (see Figure 1) and (2) from birth to age a (see Figures 2 and 3). Lifetime computations provides an estimate of the total amount of risk an average person would have if he or she lives an average lifetime. For example, if you select a certain age, say 30, our estimates will show how much risk this person has remaining in his or her life (the first perspective) and how much he or she has already endured (the second perspective).
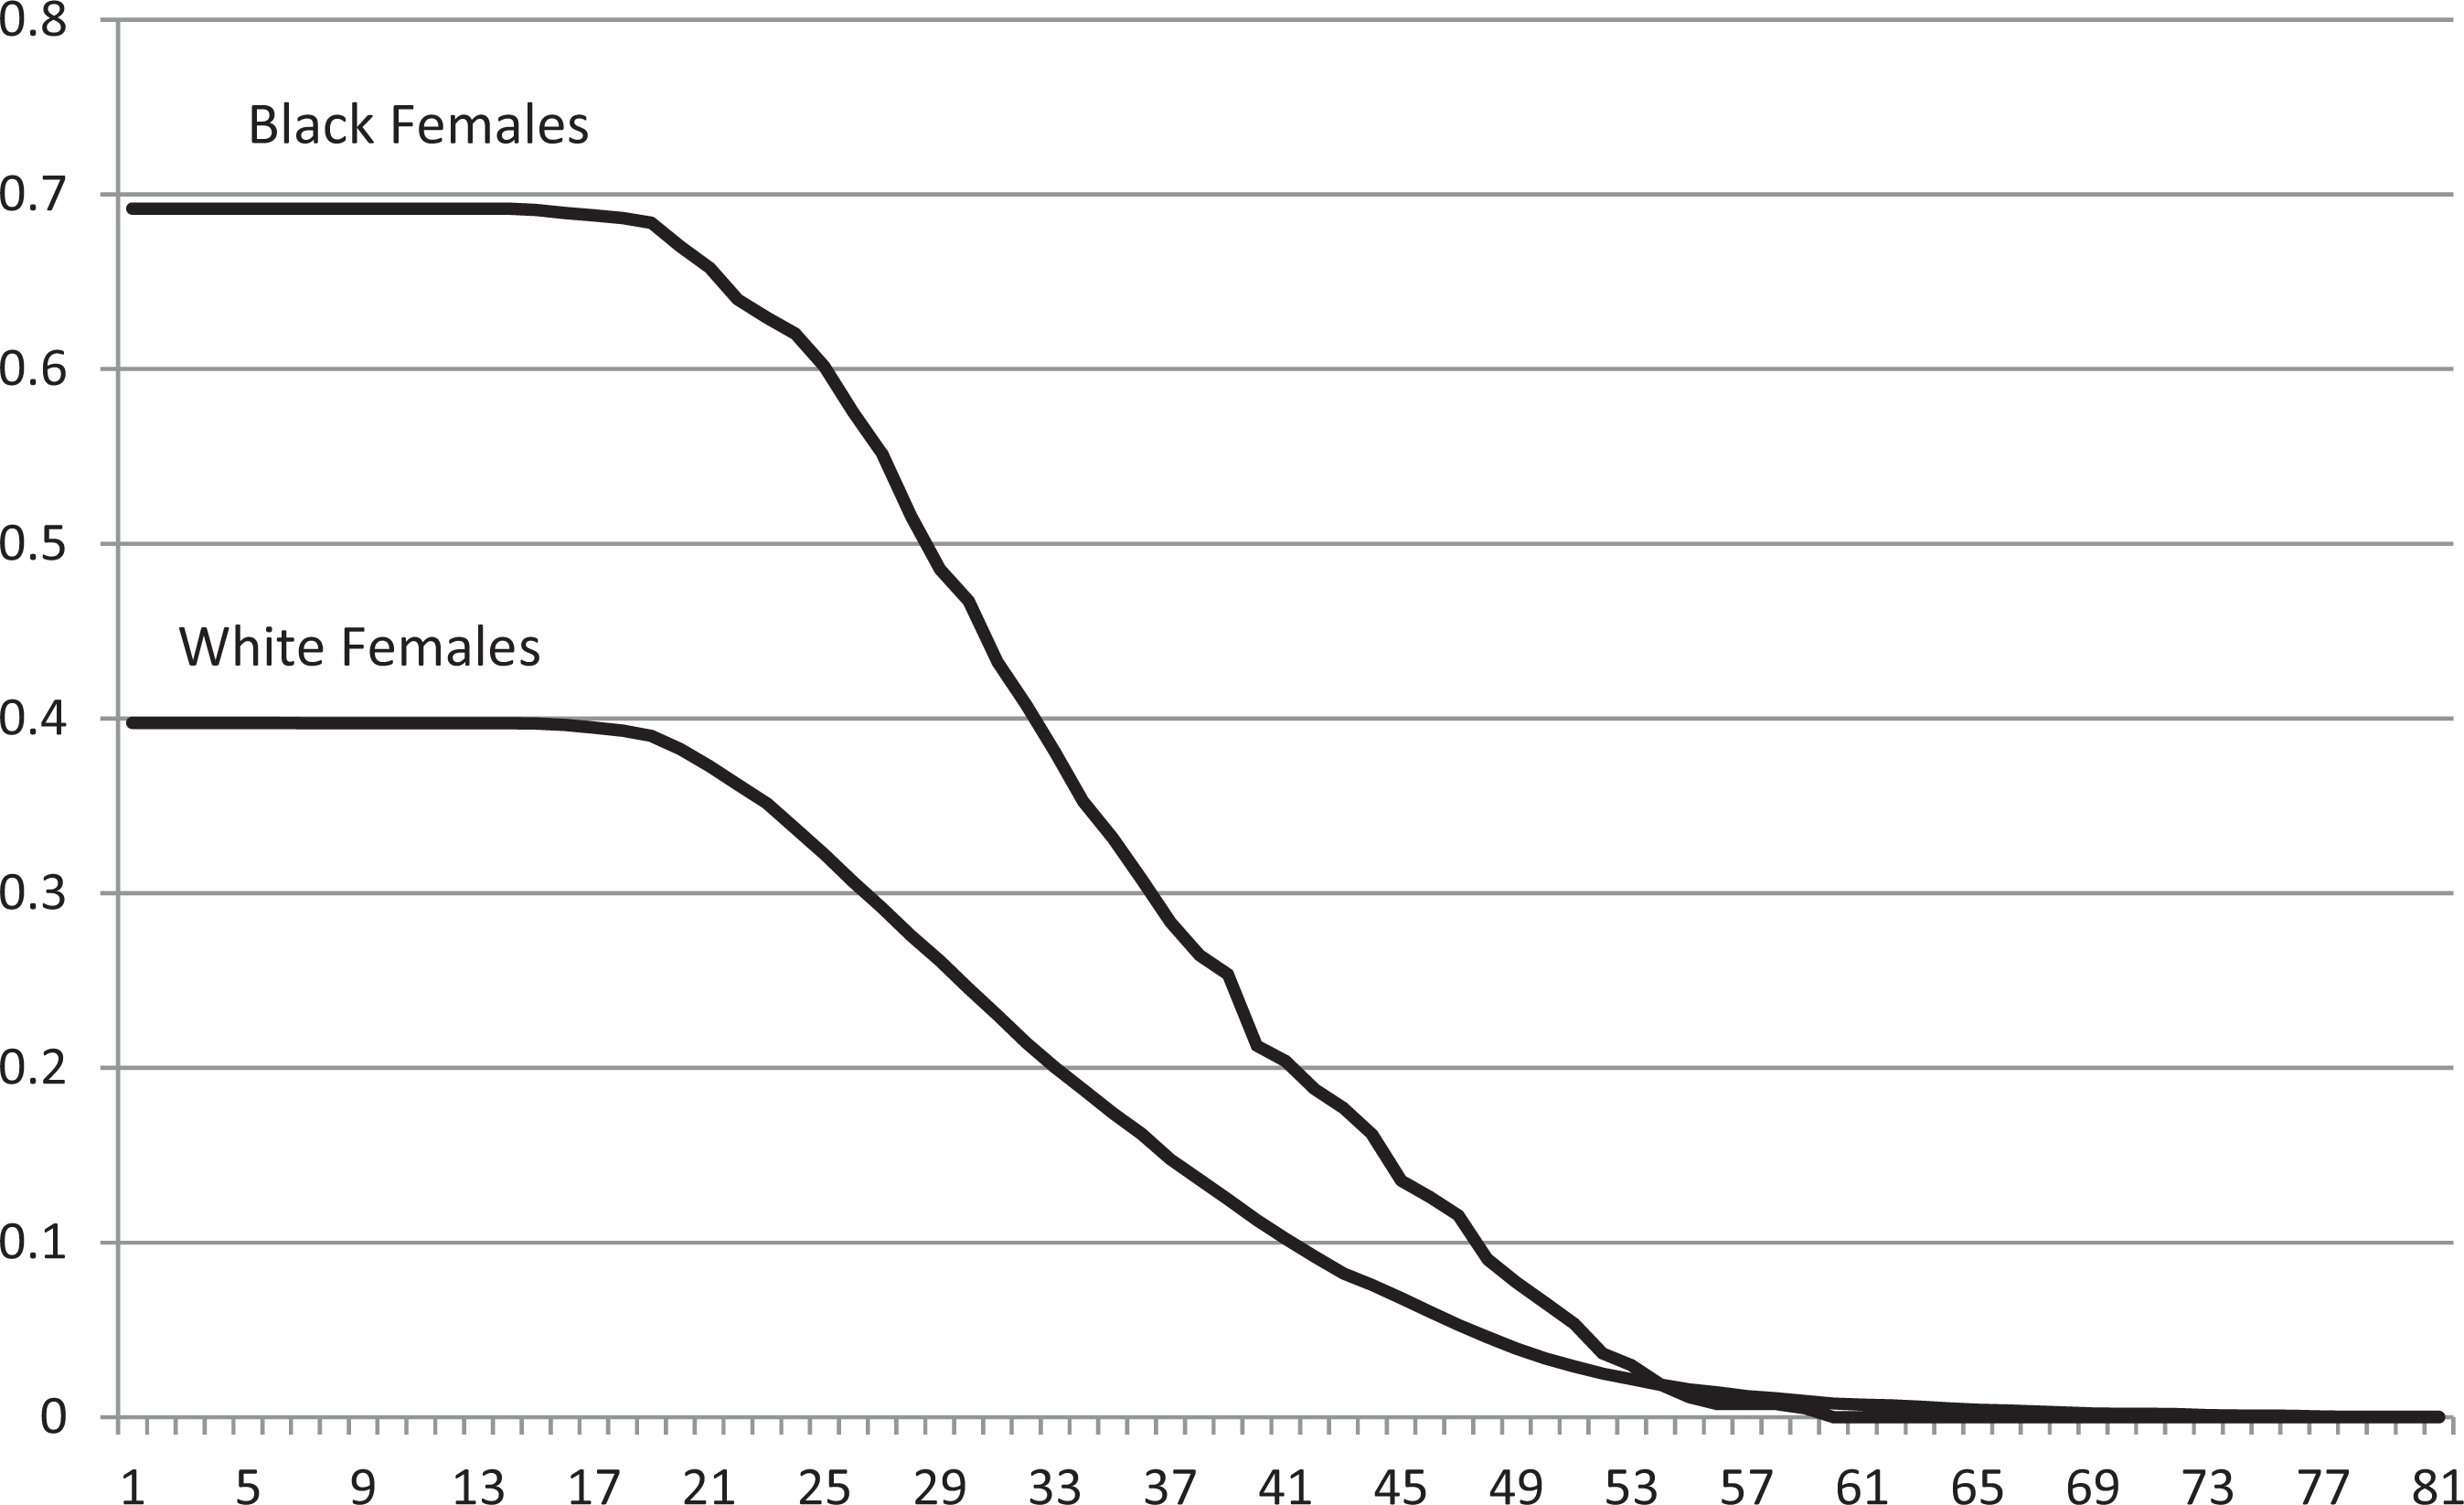
Lifetime risk of violent crime victimization for the Average female by race where the offender is an intimate partner (presented as risk from age a through the rest of life).
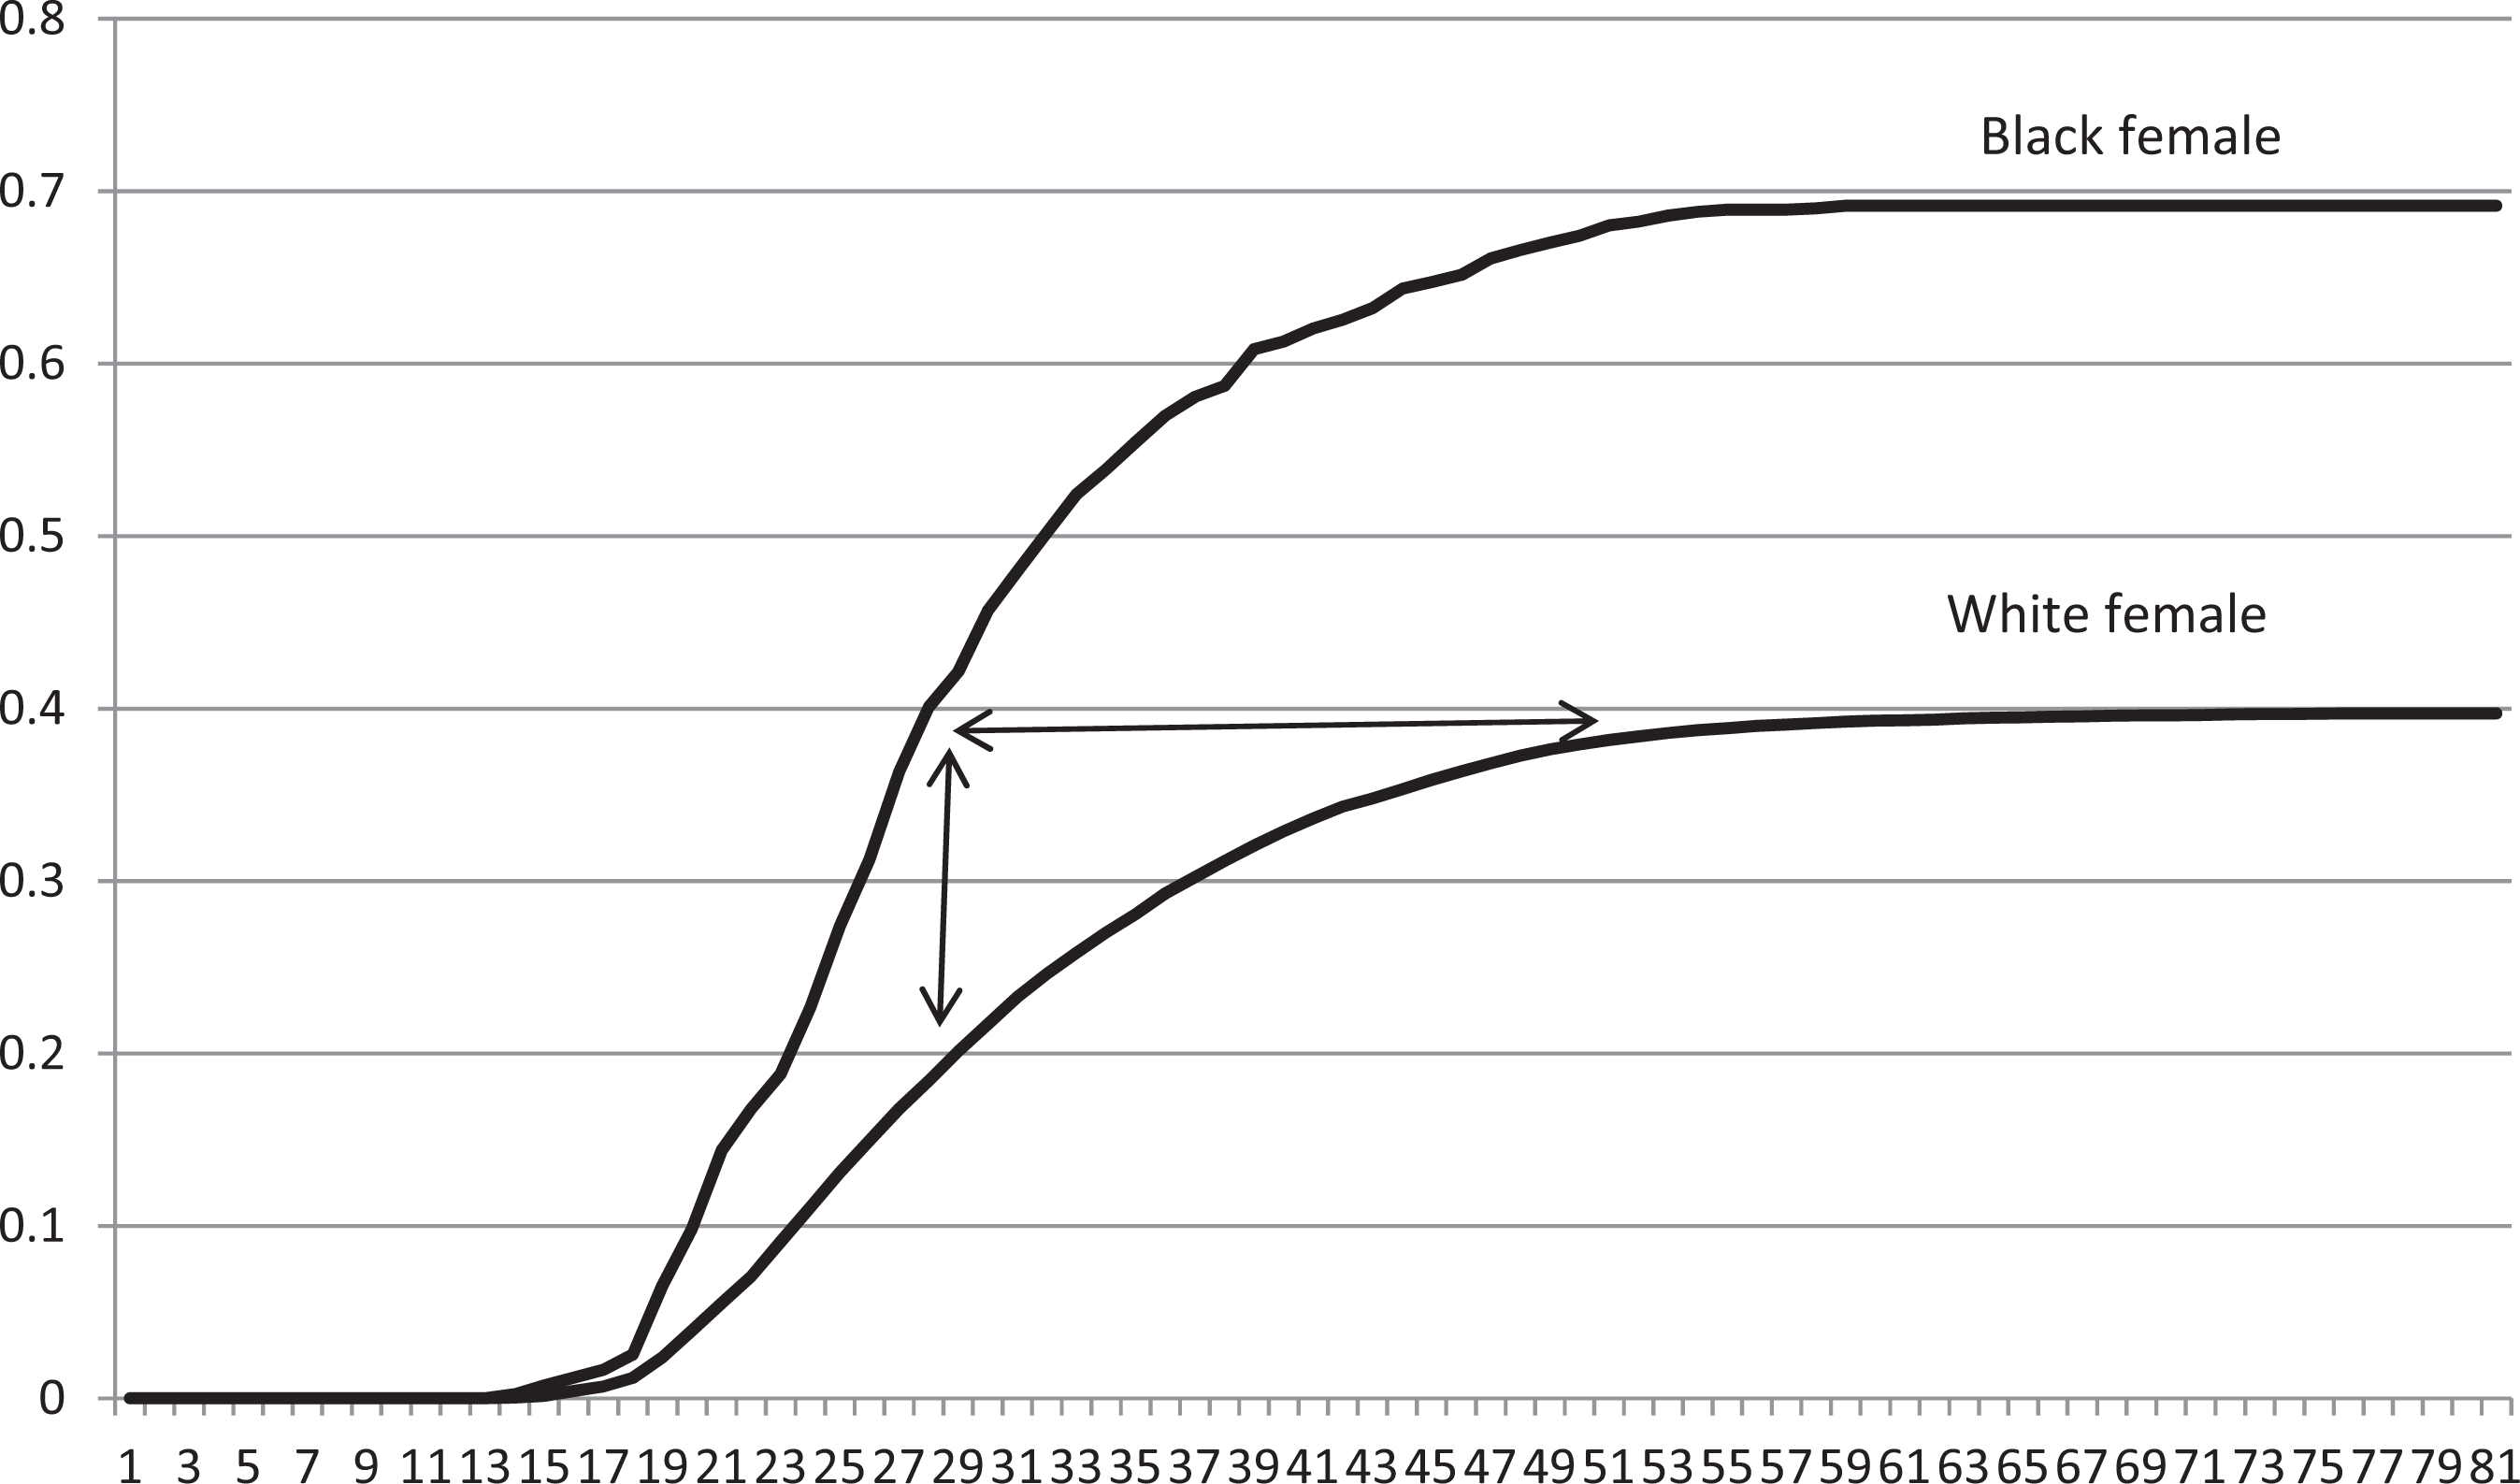
Lifetime risk of violent crime victimization for the Average female by race where the offender is an intimate partner (presented as risk from birth to age a).
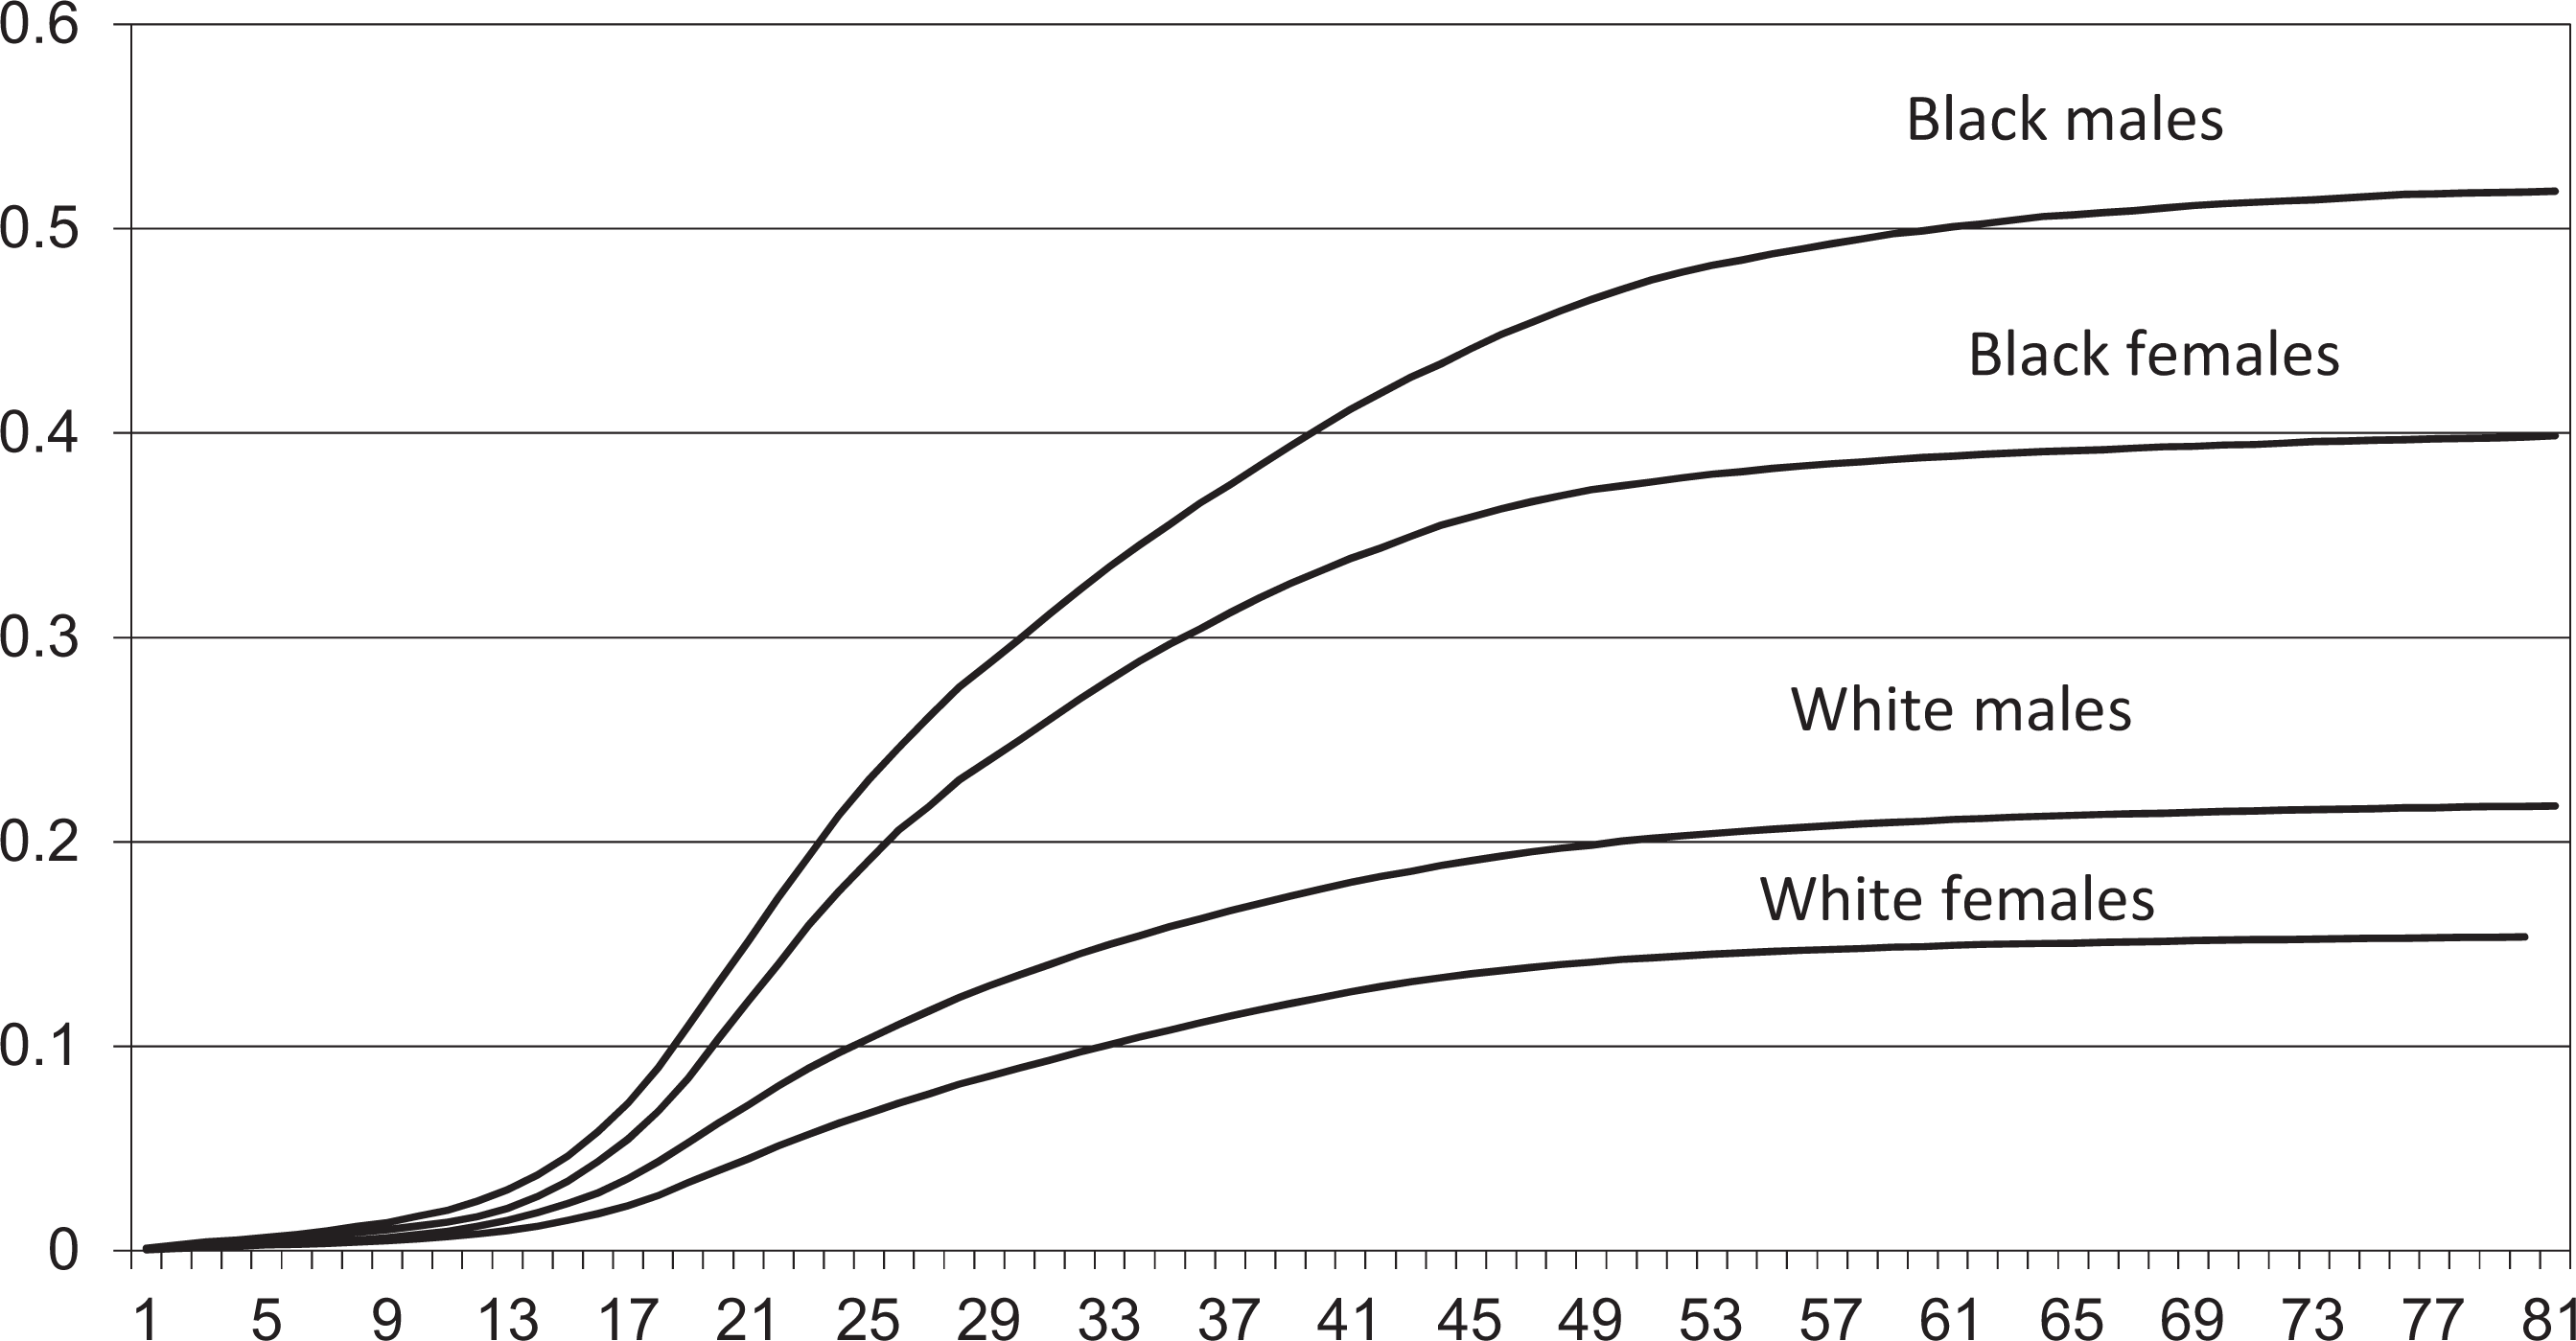
The “average person’s” risk of aggravated assault victimization over a lifetime by age, sex, and race (presented as risk from birth to age a).
Calculating Lifetime Risk With Microsoft Excel
In this section, we demonstrate how to use readily available, off-the-shelf software like Microsoft Excel to compute lifetime violent crime risk with NIBRS. We provide this section to help researchers and policy makers replicate these methods.
Figure 4 is a screenshot of a Microsoft Excel spreadsheet intended to show how to calculate lifetime risk estimates with NIBRS. In this example, we show how to calculate age-specific risk estimates and an age-group risk estimate using Equations 1 and 2 described above. Due to space limitations, we show only columns A through O and rows 1 through 19. In column A, we list all possible ages from 0 to 98 (stopping at age 17 in this example). In column B, we list the total number of people in the population for each age. The population data were obtained from the U.S. Bureau of Census. In column C, we list the total number of victims in each age-group for a given year and calculate the age-specific victimization rate in column D. The victimization data in this example come from the 2011 West Virginia NIBRS. Column E is calculated according to Equation 2. Columns F through I are the probabilities of 0, 1, 2, and 3 victimizations for the average person at each age. They are calculated according to Equation 1.
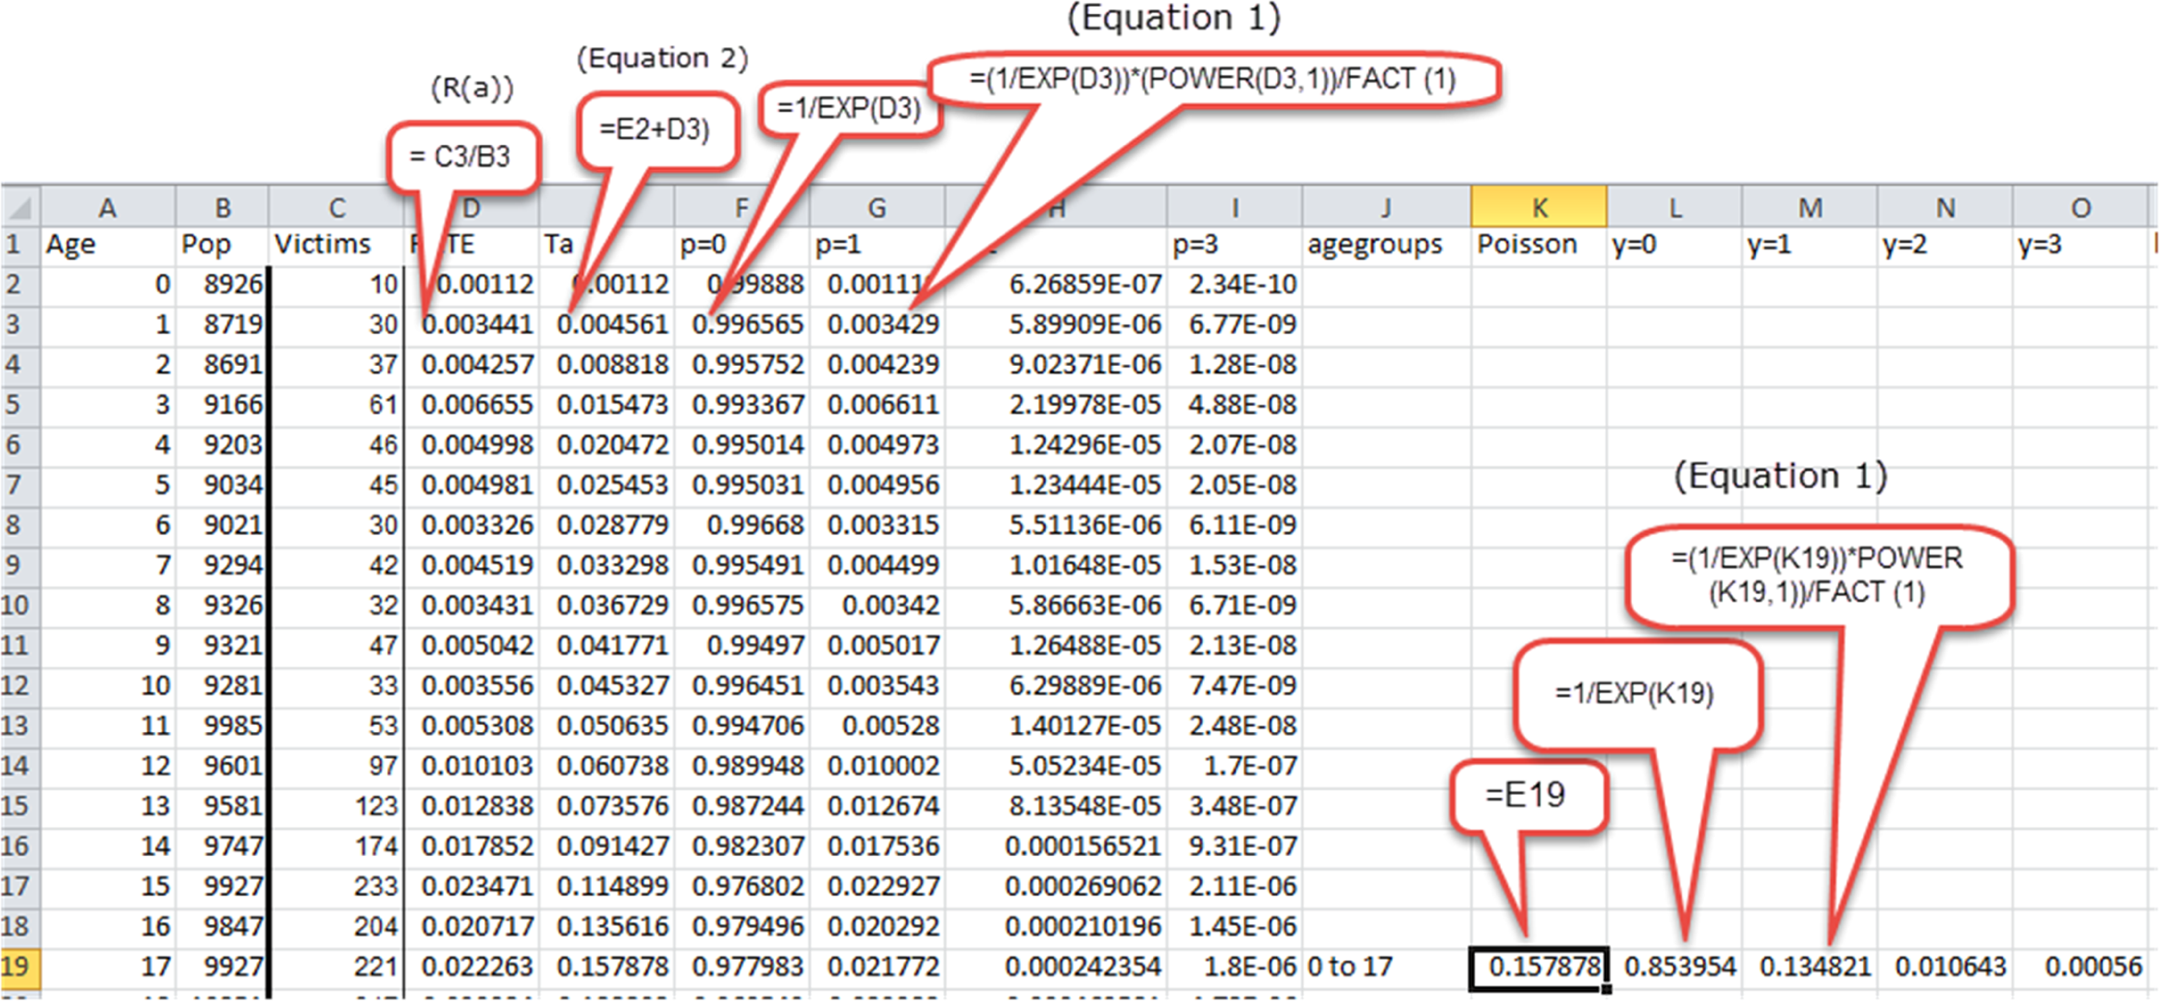
Lifetime Computations Using Microsoft Excel.
Similarly, columns L through O are the computed probabilities of 0, 1, 2, and 3 victimizations for the average persons in each age grouping in column J. Column K is the Poisson parameter for the average person in the 0–17 age-group and is computed via Equation 2.
Two Studies as Examples: Computing State and National Victimization Estimates
In this section, we present two studies of crime victimization applying our lifetime risk computations with NIBRS data. The purpose of these studies is to demonstrate how lifetime computations can be made and interpreted at the state level and at the national level. The first study is from the state of West Virginia and focuses on nonfatal intimate partner violence. We picked this state because all law enforcement agencies in West Virginia report crime data in NIBRS format and Intimate Partner Violence (IPV) is a serious problem in this state. This situation is optimal because there is no need to add “weights” to account for populations not covered by NIBRS reporting agencies. The second study is intended to demonstrate how to compute lifetime risk estimates when only a part of the data comes from NIBRS. We use the national NIBRS data from the FBI along with national estimates of crime volume provided by summary UCR to make and interpret these computations.
In both studies presented below, all calculations are made for the average person in each age, sex, and race group. In presenting our findings, statements such as “ …Black males are the most at-risk group” are sometimes made. This may be misleading since we are not really talking about “Black males” per se but are referring to the average Black male and the crimes that are reported to and recorded by the police. It is true, however, that the average person in each group indirectly reflects the group’s risk, since the group with the most at-risk average person is also the group with the highest risk overall.
Study 1: Computing State Estimates of Intimate Partner Violent Crime Victimization
In this first lifetime risk study, using NIBRS, we apply the methods described above to a full NIBRS reporting state, West Virginia, to demonstrate how these estimates can be computed and interpreted. We did this both to demonstrate the flexibility of NIBRS for computing lifetime risk for a variety of crime types and to focus on a crime of interest in a state that is known to have a high rate of domestic crime. The computations were made using Microsoft Excel as described in Figure 4.
Data and method
We obtained a single year (2011) of NIBRS violent crime data from the state UCR program in West Virginia. The data include female victims and include the following offenses: forcible rape, 7 forcible sodomy, sexual assault with an object, forcible fondling, aggravated assault, simple assault, and intimidation. We selected only female victims for this study, who were assaulted by an intimate partner. There were 5,420 White female victims and 468 Black female victims included in this study. The per person rates for intimate partner violence at each age in each of these groups were calculated using U.S. Census population estimates for 2011. Although NIBRS allows for the reporting of victim ages up to 98, we included calculations only to age 80. The impact of lifetime computations of violent crime victimization on ages above 80 are negligible since victimization rates above the age of 80 approximate 0. It is important to remember that only crimes that are reported to and recorded by the police make it into the NIBRS data. This is clearly a limitation of using NIBRS for lifetime risk computations, suggesting that the estimates may actually be higher especially for crimes such as rape and other sexual assaults.
Findings
In Figure 1, we depict the lifetime risk of violent crime victimization for the average Black and White females where the offender was a boyfriend, husband, or same-sex partner. The way to read the figure is from age a to the rest of the person’s life. For example, at birth, the average Black female has a 69% chance of being the victim of one of the violent crimes listed above during her lifetime. In contrast, the average White female has a 40% chance of victimization over her lifetime—that is, a 42% lower risk than the average newborn Black female. Although the risk drops for both groups each decade as they advance in age, a similar disparity exists though the 20s, 30s, and 40s and up to the 50s. From age 20 through the rest of her life, the average Black female has a 75% greater risk of this type of violent victimization than the average White female. At age 30 and at age 40, the risk for Black females is still 91% higher than for White females. Even at age 50, when the risk is low for both groups, the average Black female still has an 81% greater risk of victimization than the average White female. However, by age 55, the average Black female and White female share the same low risk of this form of violent crime victimization over the rest of their lives.
Using the same data, but plotted from birth to age a, one can easily compare the trajectory of victimization risk between White and Black females in West Virginia (see Figure 2). In Figure 2, the vertical arrow indicates the different levels of risk at the same age of 28. By the age of 28, the average Black female has already experienced a 40% risk for violent crime victimization (as indicated by the vertical arrow). This level of accumulated risk (i.e., 40%) does not occur for an average White female until three decades later, at the age of 58 (see the horizontal arrow).
Study 2: Computing National Estimates of Lifetime Risk of Aggravated Assault Victimization
Data and method
In this section, we demonstrate how to compute national estimates of violent crime victimization with NIBRS when only a proportion of police agencies submit data in NIBRS format. 8 The data used in this example come from three sources, all in the year 2000. The 2000 NIBRS file obtained from the FBI 9 contains information about the age, sex, and race of aggravated assault victims. The annual UCR crime report, Crime in the United States, 2000, provides the national estimates of aggravated assault victims, 10 and the U.S. Bureau of Census provides the population totals by age, sex, and race for the year 2000. The same methods used in this example apply to any given year where complete data from all three sources are available.
In the year 2000 NIBRS data, there were 111,751 victims of aggravated assault. These aggravated assault victims were distributed by sex and race at each age from 0 to 98. This distribution of NIBRS aggravated assaults by age, sex, and race was then applied to the estimated number of aggravated assault offenses in Crime in the United States (FBI, 2001). According to UCR counting rules, the number of offenses for these crimes against persons is equal to the number of victims (see Notes 5 and 10). The age-specific rates for each race/sex group are calculated using the 2000 National Census population as the denominator.
The number of NIBRS violent crime victims distributed by age, sex, and race categories is denoted here by V(a, s, r). 11
Let Equation 3 represents the total number of aggravated assault victims reported in NIBRS. V is smaller than the national UCR estimate of aggravated assault, denoted as
The national estimate of the number of violent crime victims is calculated by:
The annual per person crime rate, R(a s, r), is defined as follows:
where the denominator in Equation 5 is the 2000 National Census population for a given age, sex, and race. 12
Findings for aggravated assault
Aggravated assault is defined by the UCR Program as an unlawful attack by one person upon another wherein the offender uses a weapon or displays it in a threatening manner, or the victim suffers obvious severe or aggravated bodily injury involving apparent broken bones, loss of teeth, possible internal injuries, severe laceration, or loss of consciousness. We chose this crime because it is the most frequent type of violent crime against person reported to the FBI as an index crime.
In Table 4, we show the estimated risk for aggravated assault victimization by age, sex, and race grouping. The most vulnerable age-group is 21–30 years (see Table 4). At this age, Black males have the highest risk, that is, a 19% chance of one or more aggravated assault victimizations (1–0.8112). Black females are the second most vulnerable group with a 16% chance of one or more aggravated assault victimizations. In this same age-group, White males are more at risk for being victimized than are White females (7% and 5%, respectively). The risk of one or more victimizations subsides for all groups by age 50.
National Estimates for Aggravated Assault Victimization Risk by Age, Sex, and Race Using NIBRS.
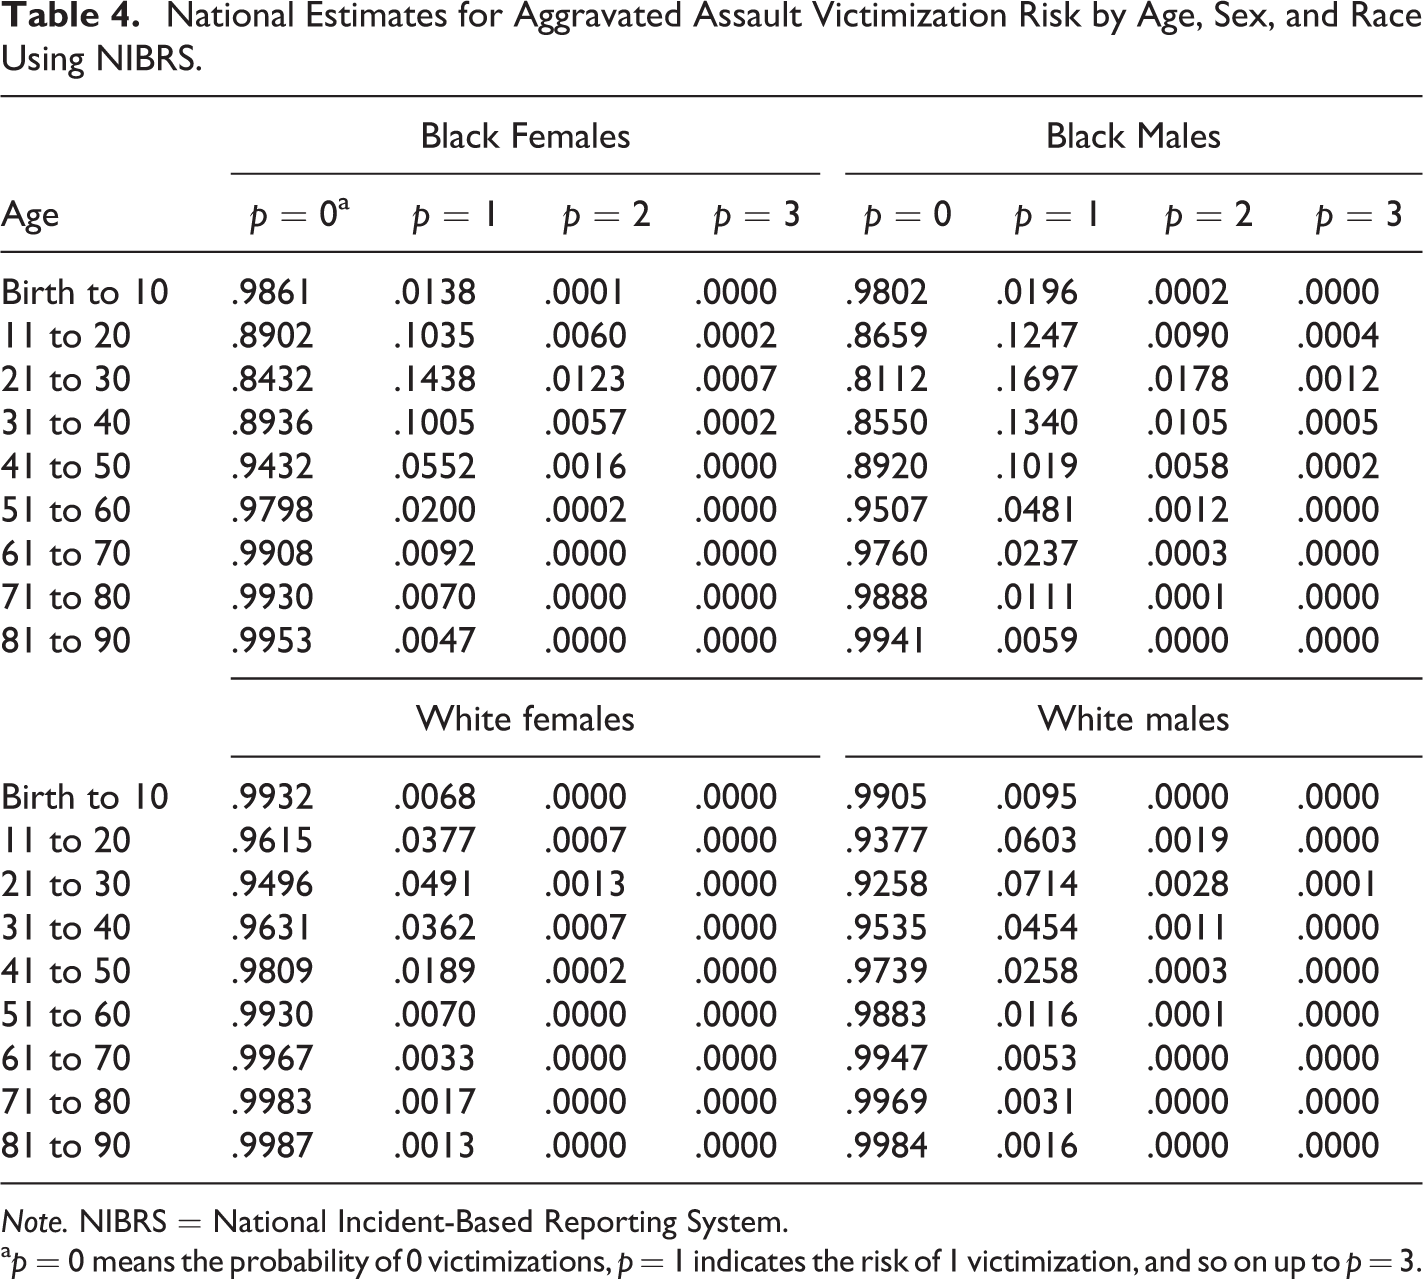
Note. NIBRS = National Incident-Based Reporting System.
a p = 0 means the probability of 0 victimizations, p = 1 indicates the risk of 1 victimization, and so on up to p = 3.
In Figure 3, we plot the results of this study from birth through the rest of life. Over the life course, Black males have the highest probability of aggravated assault victimization. If the average Black male lives to age 80, he has a 51% chance of being the victim of one or more aggravated assaults. Black females are the second most vulnerable group with a 40% chance of aggravated assault victimization. Over the life course, the risk of aggravated assault victimization for White males is 21% and for White females 15%.
The risk for aggravated assault victimization begins earlier for Black men than for the other race/sex groups. For example, from birth to age 25, Black males have a 23% chance of one or more aggravated assault victimizations. Compare this with the risk in the other groups: Black females (19%), White males (10%), and White females (6%). In fact, Black males are more at risk in this time frame (birth to 25) than White males and White females are from birth through the rest of their lives.
Discussion
In both studies described above, we demonstrate a method for using NIBRS to compute the risk of violent crime victimization over a lifetime. Since there are no unique victim identifiers in NIBRS, it is impossible to know the number of people in a population who are victimized more than once. For this reason, we cannot treat the crime rate as the probability of crime victimization and so we have introduced the concept of the average person. As indicated above, the average person is a hypothetical person whose victimization experience—in quantifiable terms—is the average per person crime rate. Using methods described in this article, the risk of victimization over a lifetime for the average person can be computed with NIBRS data for a variety of age–sex–race groupings. This type of analysis enables researchers and policy makers to compare the risk of crime victimization across demographic groups and across places with varying structural conditions, such as levels of poverty, home ownership, unemployment, teen pregnancy, or single-parent homes. Examining lifetime computations from birth to age a (i.e., Figures 2 and 3) enables researchers and policy makers to clearly see the onset and trajectory of risk as it begins at a young age, plateaus at midlife, and trails off to near zero toward the end of life. From the reverse direction—from age a through the rest of life (i.e., Figure 1)—one can see how risk slowly diminishes as we age and how vast disparities in risk between groups (e.g., race and sex) in early ages of life can shrink later in life such as in middle age or later.
The methods presented in this article may be of particular interest to researchers and policy makers in states that report all crime data in NIBRS format. As of 2013, there were 15 such states. In these states, the risk of lifetime victimization for certain crimes can be computed with NIBRS similar to our approach in Study 1. When all crime data come from NIBRS (rather than a mix of summary UCR and NIBRS), there is no need to adjust estimates for the non-NIBRS places. However, at the national level, where only a portion of the crime data is in NIBRS format, we need an additional step in our methods. Our second study (using Equations 3–5) demonstrates how to weight the estimates to 100%. In applying the distribution of NIBRS crimes by age, sex, and race to the summary UCR offense counts for crimes against persons (excluding murder), we assume that NIBRS places are similar to non-NIBRS places which may not be the case. According to an FBI report in 2013, 6,328 law enforcement agencies, representing coverage for nearly 93 million U.S. inhabitants, submitted crime data in NIBRS format. The same study reports that about 34.4% of all law enforcement agencies that participate in UCR submit their data via NIBRS (FBI, 2014). This is a large number of NIBRS reporters, but it is still not considered a probability sample, and therefore national estimates of lifetime risk by age, sex, and race may not be valid. As mentioned previously (Note 8), the FBI and the BJS have recently initiated the National Crime Statistics Exchange (NCS-X), a program designed to generate nationally representative incident-based data on crimes reported to law enforcement agencies. This will add validity to estimates of lifetime risk that may not exist at the present time.
In addition, although the concept of the average person enables us to compute lifetime victimization risk with NIBRS data, it is important to note that the average person’s risk is not the community’s risk. To estimate the community’s risk, one would need to know the number of people in the populations who have experienced 0, 1, 2, 3, …, k victimizations. This is not possible with NIBRS, but with NCVS, it is. Perhaps future studies can utilize the methods presented in this article to examine NCVS to see how its estimates of lifetime victimization risk compare with NIBRS.
Policy Applications/Implications
In the field of public health, risk assessments are commonplace and offer opportunities to assess the overall health risks in a community at particular stages of life, tailor policies and interventions to the right times and to the right groups, and to assess progress along the way. Within certain limits, NIBRS provides the same opportunities for government officials and public policy makers concerned with the lifetime risk of harm due to violent crime. As we have demonstrated, NIBRS can help identify the age at which members of certain sex and racial groups begin experiencing risk for violent crime victimization and compute projections of risk over a lifetime—given that social, economic, and other structural conditions remain the same. In our first study, we demonstrate that Black females in West Virginia are twice as likely as White females to experience intimate partner violence in the period between ages 18 and 28 (see Figure 4). This is significant and could be used to direct policy and educational support to this vulnerable group.
NIBRS is adaptable to many different types of risk assessments based on crime type (e.g., aggravated and sexual assault), location types (e.g., at home, school, or public places), victim–offender relationship (e.g., intimate partner, family member, acquaintance, stranger, and friend), or any combination of the above. Further, lifetime computations can be used to compare the risk of violent crime for different age–sex–race groups in a variety of geographic areas—within or across cities, counties, states, or regions of the United States. These analyses may add new insights about the relationship between crime and place.
In addition, lifetime risk computations may be a useful addition to information provided by government officials for public awareness campaigns, particularly those aimed at mobilizing people to help prevent violent crime. The information provided by lifetime risk assessments with NIBRS may also aid in community dialogue and action focusing on protecting the most vulnerable groups in a community or neighborhood. Further, they may be useful for public officials developing training programs and implementing and assessing the effectiveness of anti-violence programs.
Conclusions
In presenting the methods and examples described in this article, we imagine that they can be used by researchers especially interested in studying crime victimization from a life course or routine activities perspective. We provided the section “Calculating Lifetime Risk with Excel” to show researchers and policy makers how to use these statistical methods for data analysis. The methods may also be useful to criminologists or sociologists who study social inequality and its impact on crime victimization. Policy makers and government officials may also find these methods useful for identifying risk patterns by age, sex, and race over time in the same way public health officials examine health risks over time.
Footnotes
Declaration of Conflicting Interests
The author(s) declared no potential conflicts of interest with respect to the research, authorship, and/or publication of this article.
Funding
The author(s) received no financial support for the research, authorship, and/or publication of this article.