
Abstract
Purpose:
To illustrate dynamic, time-resolved CTA (d-CTA) imaging technique in characterizing aortic endoleak type/inflow using quantitative parameters and its value in providing image guidance for targeted treatment approach.
Technique:
Dedicated endoleak protocol involved acquiring multiple time-resolved contrast enhanced scans using third-generation CT scanner (Somatom Force®, Siemens Healthineers). Parameters such as scan field of view (FOV), kV, number/timing of scans were customized based on patient’s body-mass-index, timing bolus, and prior imaging findings. D-CTA image datasets were evaluated qualitatively and quantitatively using time-attenuation curves (TAC) analysis after motion correction using a dedicated software (syngo.via®, Siemens). D-CTA findings from 4 illustrative cases demonstrating type I, type II (inferior mesenteric and lumbar artery inflow), and type III endoleak were illustrated. TAC analysis with time to peak parameter enabled better characterization of endoleak type and inflow. During endoleak intervention, target vessels from d-CTA images were electronically annotated and overlaid on fluoroscopy using 2D−3D image fusion to provide image guidance for targeted treatment.
Conclusion:
D-CTA imaging with TAC analysis characterizes aortic endoleak type and inflow, in addition to providing image guidance for targeted endoleak treatment. Such dynamic, time-resolved imaging techniques may provide further insights into understanding aortic endoleak that remains an Achilles heel for endovascular aortic aneurysm repair.
Keywords
Introduction
Endovascular aortic aneurysm repair (EVAR) and, recently, fenestrated/branched EVAR have been offered as a treatment option for infrarenal and juxta-renal aortic aneurysms respectively. Endoleaks, reportedly occurring in 20% to 50% of the patients, remains the most common complication after EVAR carrying the risk of aneurysm sac expansion and/or rupture, often requiring multiple secondary interventions for treatment.1,2 Contrast-enhanced ultrasound and/or computed tomography angiography (CTA) imaging is recommended during EVAR follow-up. 3 Triphasic CTA imaging (t-CTA), routinely performed for EVAR surveillance to rule-out endoleaks, involves acquisition of non-contrast, arterial, and delayed phase scans after 1 to 2 minutes of contrast injection. However, with only 2 time points, t-CTA technique is often limited in accurately characterizing the type of endoleak and direction of inflow/outflow vessels to/from the aneurysm sac.
Dynamic-CTA (d-CTA) is a relatively novel imaging technique that has been applied to characterize aortic endoleak after EVAR, leveraging faster image acquisition, and lower radiation protocols in third-generation CT scanners.4–7 Prior studies have demonstrated the high diagnostic yield and accuracy of d-CTA imaging, as compared to conventional t-CTA imaging.4–7 In addition to accurate diagnosis and categorization of aortic endoleaks, d-CTA can also be used to provide image guidance as an overlay on 2D fluoroscopy for targeted treatment. The added value of such image fusion techniques during targeted therapy can reduce the amount of radiation exposure and contrast volume usage during diagnostic angiography and interventional procedure.8,9
Our goal here is to describe d-CTA imaging technique in characterizing aortic endoleak type/inflow using quantitative parameters and to illustrate its value in providing image guidance for targeted treatment approach.
Technique
Dynamic CTA Imaging Technique
Image Acquisition
A customized endoleak d-CTA protocol (Table 1) was performed using third-generation CT scanner Somatom Force CT® (Siemens Healthineers). This technique involved fast spiral acquisition in a limited scan field of view (FOV) covering the stent graft after contrast timing bolus, creating multiple, time-resolved contrast-enhanced scans during faster CT gantry rotations and bidirectional table movements, also called shuttle mode. The patient was positioned supine on the CT table, and a topogram was performed in frontal projection to visualize the abdominal aortic stent graft and estimate the longitudinal coverage needed (scan FOV). Non-contrast CT imaging was performed in the FOV of stent graft extending from celiac artery until ostia of both internal iliac arteries using a tin (Sn) filter (Sn 150 kV). Then a 2D timing bolus scan was performed after intravenous injection of 20 ml bolus of iodinated contrast (320 mg/ml Visipaque™ GE Healthcare) at a 4 ml/second flow rate, followed by 50 ml of saline to derive the timing of contrast arrival at the region of interest (ROI) marked above the stent graft in the visceral aorta (delay time). At this juncture, based on the findings from non-contrast scan, timing bolus, and any prior imaging, d-CTA scan FOV, kV, contrast volume, delay time, total number of scans, and cycle time for d-CTA was customized. A delayed scan (FLASH) was performed, if deemed necessary, at 60 seconds to rule-out any delayed endoleaks.
Parameters of a Customized d-CTA Endoleak Protocol.
A key factor of acquiring optimal d-CTA images is scan timing, and in our experience performing a timing bolus is critical to calculate the bolus arrival time, to minimize the impact of variation due to injection site, cardiac ejection fraction, etc. This can be customized based on prior imaging findings from previous scans; if the patient is suspected to have a type II endoleak, d-CTA imaging is timed for more scans at later phases and for a type I or III at earlier phases along the time-attenuation curve (TAC) derived from the timing bolus. If there is no available previous information about the suspected endoleak (intraoperative digital subtraction angiography (DSA) after EVAR or CTA after EVAR), equally distributed scans during both upslope and downslope along the TAC can be performed. If deemed necessary, an additional delayed scan can also be performed to visualize delayed contrast enhancement inside the aneurysm sac.
The radiation dose for d-CTA can be optimized based on imaging parameters such as tube voltage (kV), scan FOV, addition of tin filters, and so on. In our experience we typically used a range of 70 to 100 kV based on patient’s body-mass-index (BMI) (70 kV for low BMI and 100 kV for high BMI), and review of any prior CT imaging. Scan FOV length can be a limitation for d-CTA based on scanner hardware as reported in a previous study. 10 Our customized endoleak protocol involved a “short” and a “long” FOV protocol that enabled a coverage of 23 to 33 cm based on the length and type of stent grafts such as fenestrated, branched, or standard infrarenal EVAR. The mean(±SD) dose-length product for d-CTA imaging in the 4 patients described in this paper, amounted to 900.1 ± 126 mGy cm, as opposed to 1123.8 ± 384.1 mGy cm for t-CTA protocol acquired at 110 kV.
After acquisition, d-CTA images were reconstructed using dedicated reconstruction parameters (Bv36 convolution kernel, CT angio window, 0.7 to 1 mm slice thickness), and an iterative (ADMIRE® Strength level 3) reconstruction was performed.
Image Analysis
In addition to qualitative image review, this d-CTA technique also enables quantitative data analysis based on temporal Hounsfield unit (HU) changes in a selected ROI across multiple contrast-enhanced scans (TACs). 6 Time-resolved, reconstructed images were then sent to a dedicated image processing workstation and reviewed (CT dynamic angio workflow, syngo.via®, VB30, Siemens Healthineers). After motion correction to align the time-resolved scans accounting for patient/respiratory movements, the time-resolved images were reviewed in dynamic cine-mode using multiplanar and volume rendered (VRT) reconstructions. TAC analysis was performed to characterize and evaluate the enhancement patterns in aorta and endoleak in the aneurysm sac. This involved manual placement of ROI inside the aorta above/inside the stent graft (ROIaorta), endoleak in the aneurysm sac (ROIsac), and if available, target vessel (ROItarget) closer to the region of endoleak. After TAC analysis, the curves were qualitatively assessed, and the data was exported for further quantitative analysis. Time to reach peak HU was noted for each ROI and analyzed. Time to peak difference between ROIaorta and ROIendoleak was calculated for better characterizing type of endoleak, and time to peak difference between ROIaorta and ROItarget was calculated for better assessing inflow vessel that could serve as a potential target for future embolization.
Image Guidance
In addition to qualitative and quantitative evaluations, d-CTA images were used for planning and guiding the endoleak treatment procedure in the hybrid operating room (Artis Pheno®, VE10B, Siemens). In the case of endovascular embolization, appropriate time-resolved d-CTA volume was selected for image fusion guidance. First, upon loading the d-CTA dataset, the endoleak inside the aneurysm sac was segmented using commercially available segmentation tools in a post-processing workstation. Ostia and centerlines of target vessels (such as IMA, lumbar arteries) were electronically annotated using a polyline tool in the d-CTA dataset. In endoleak cases, due to the presence of prior stent graft, image fusion was performed using a 2D–3D image fusion approach, that involves acquiring 2 fluoroscopic images at AP and LAO 50–60 projection. Then, the stent graft from 3D VRT reconstruction of d-CTA images was semi-automatically aligned with stent graft from 2D fluoroscopic images. After 2D–3D image fusion, the segmented endoleak, target vessel ostia, and centerlines from d-CTA were overlaid on 2D fluoroscopy for interventional guidance (eg, cannulation of iliolumbar vessels from internal iliac artery).
Illustrative Cases
Type Ia Endoleak
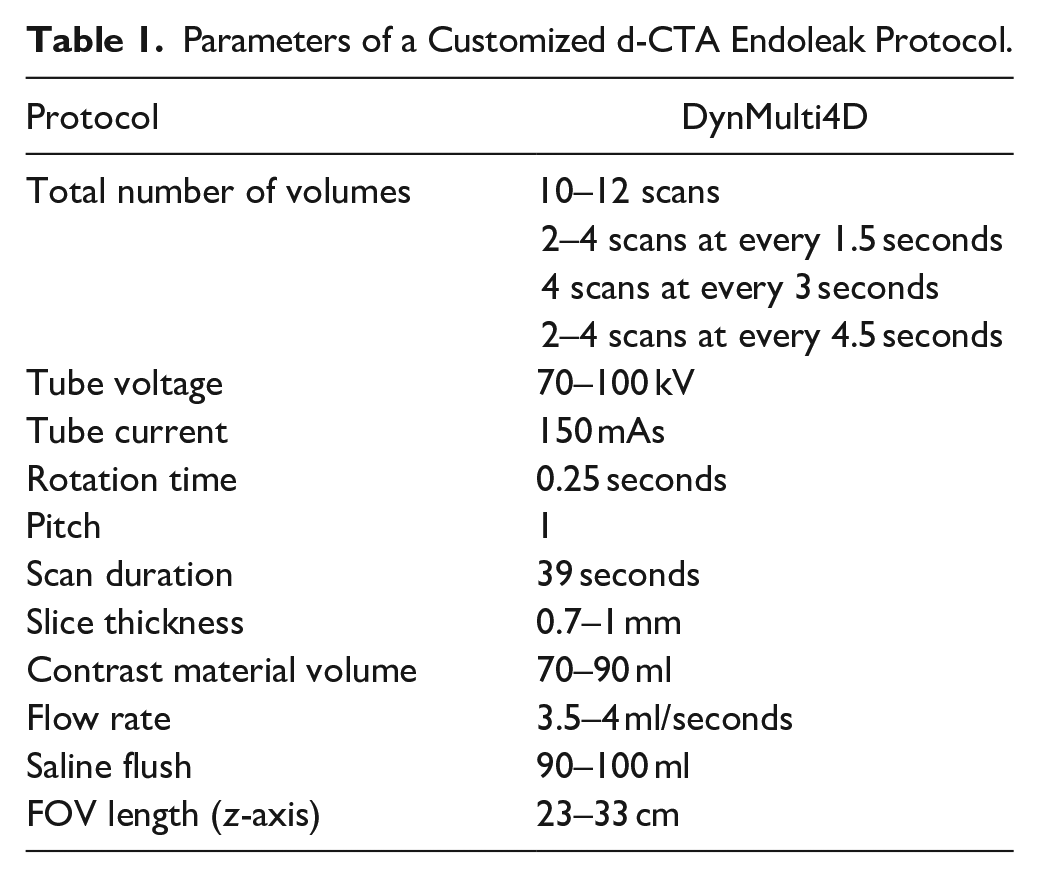
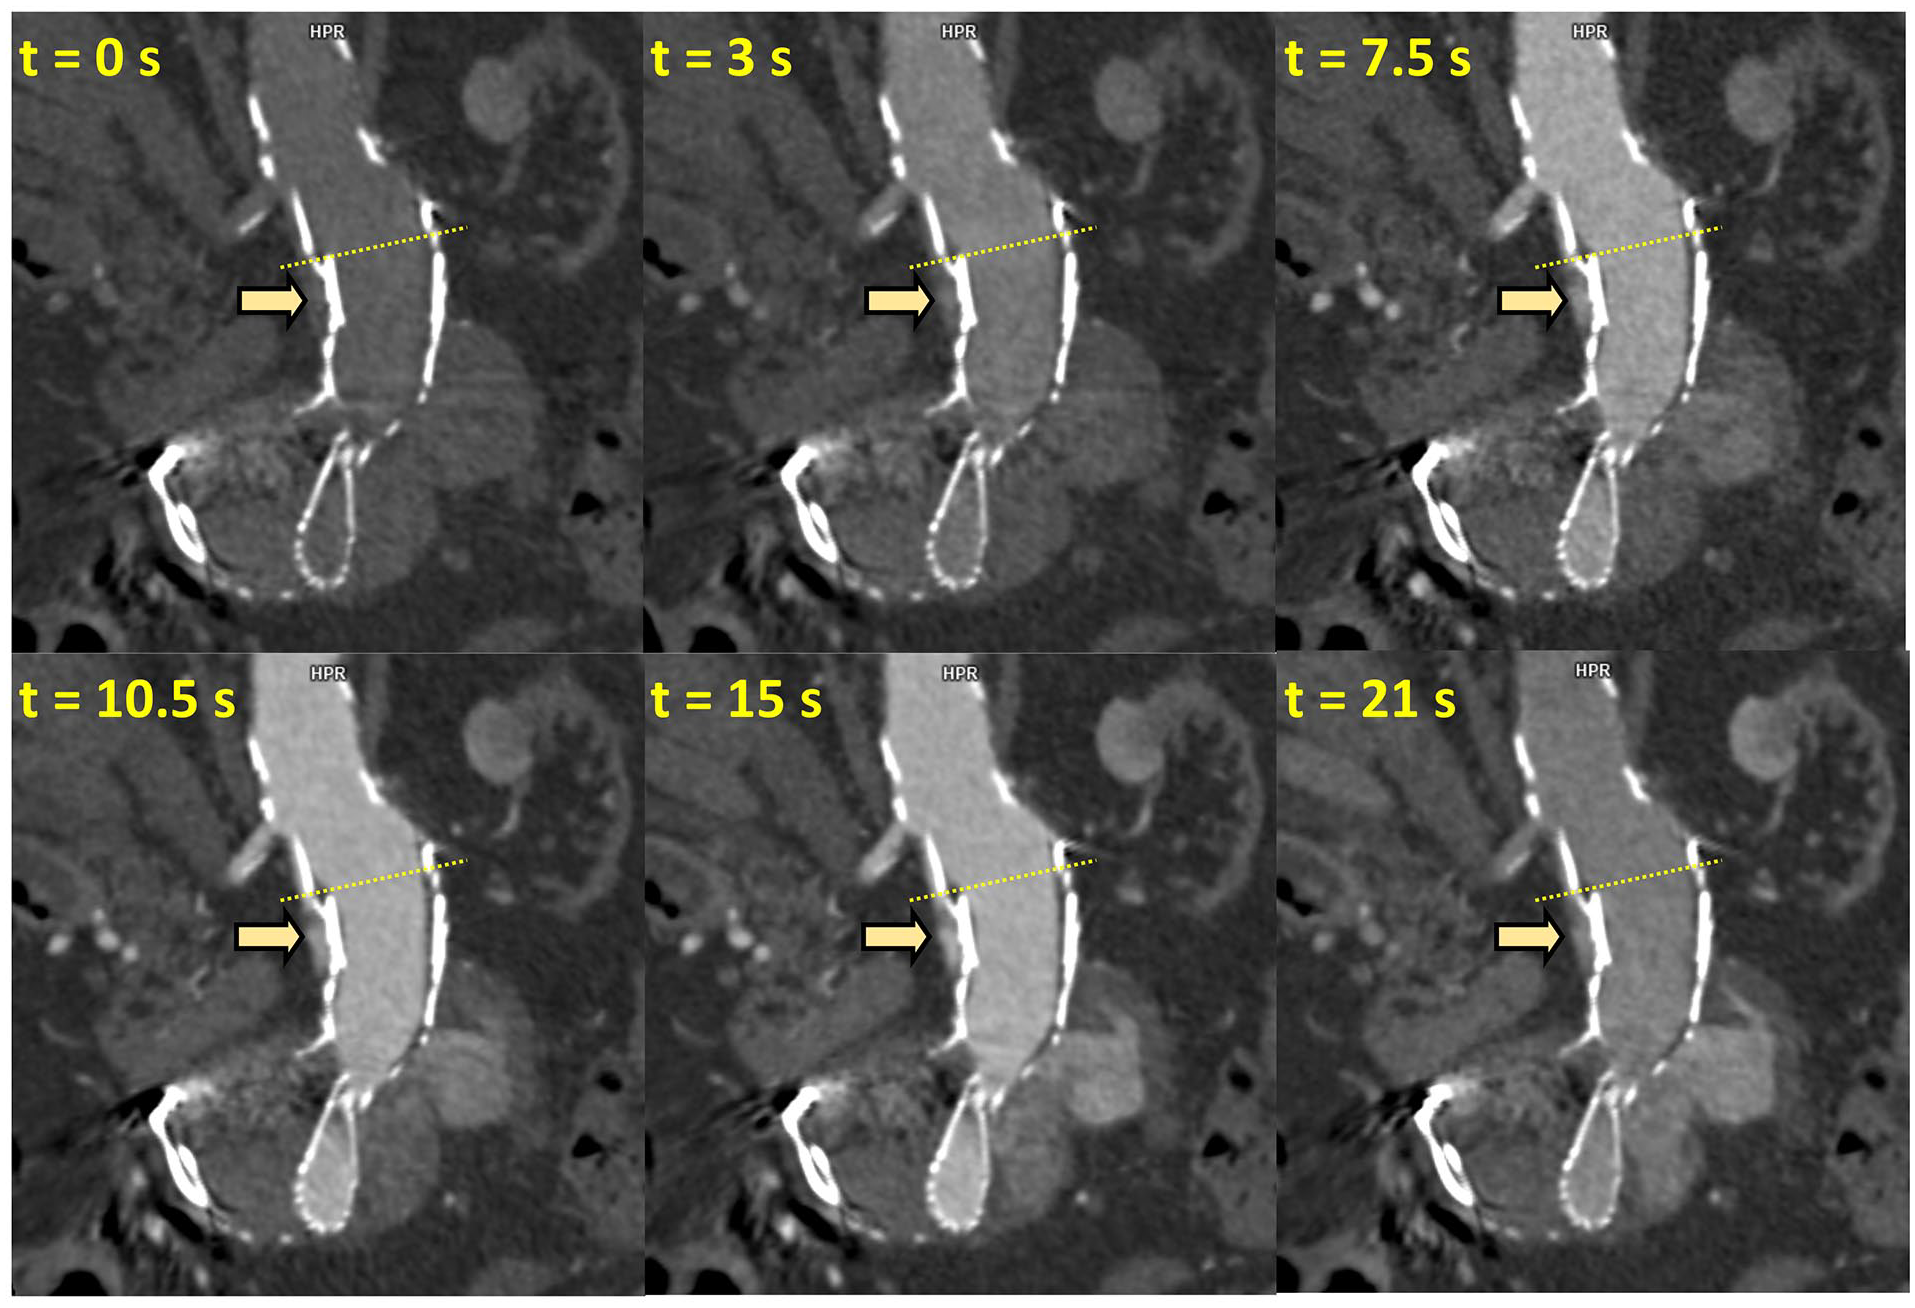
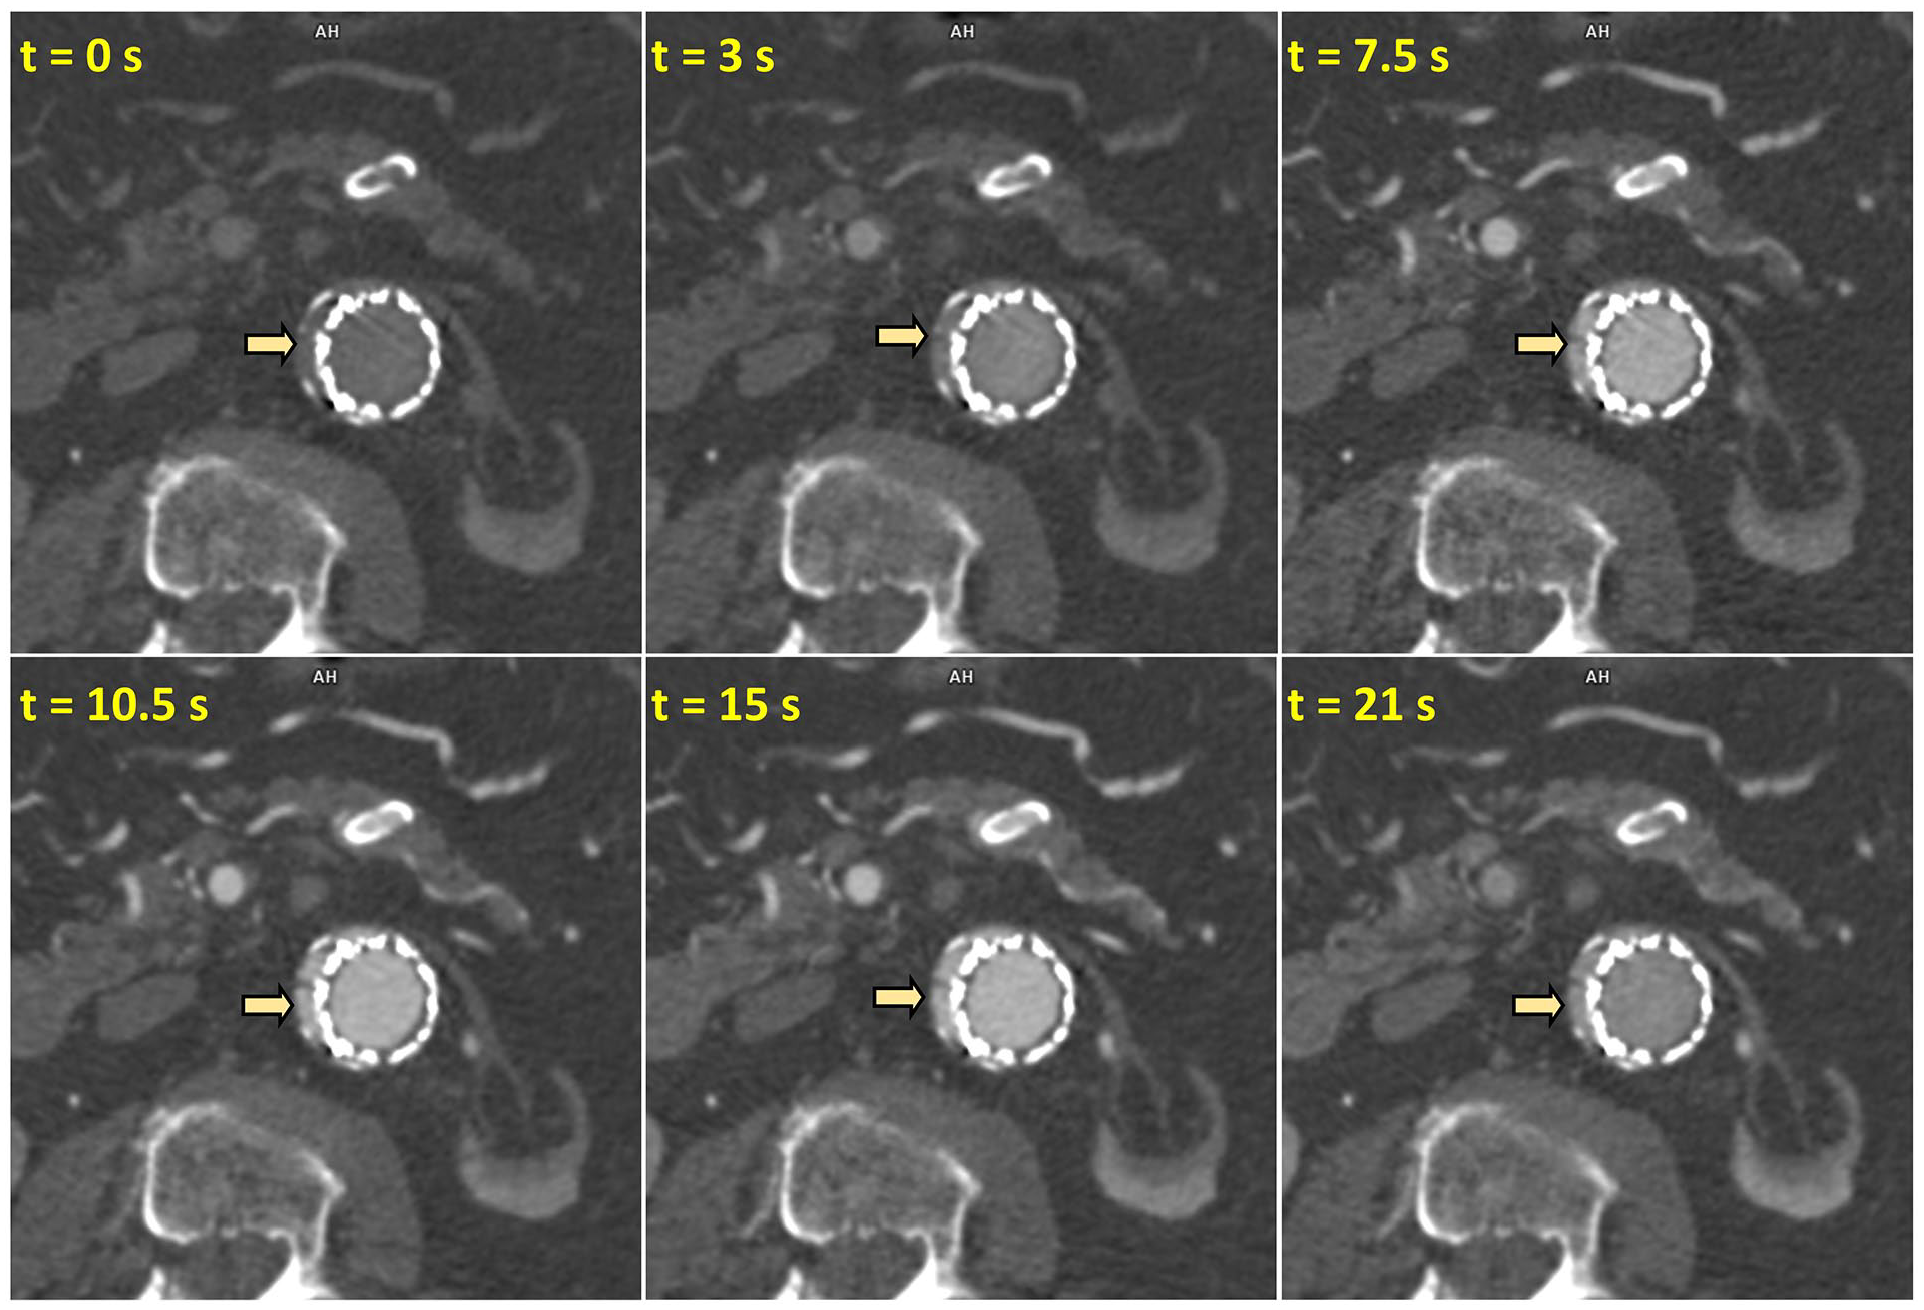
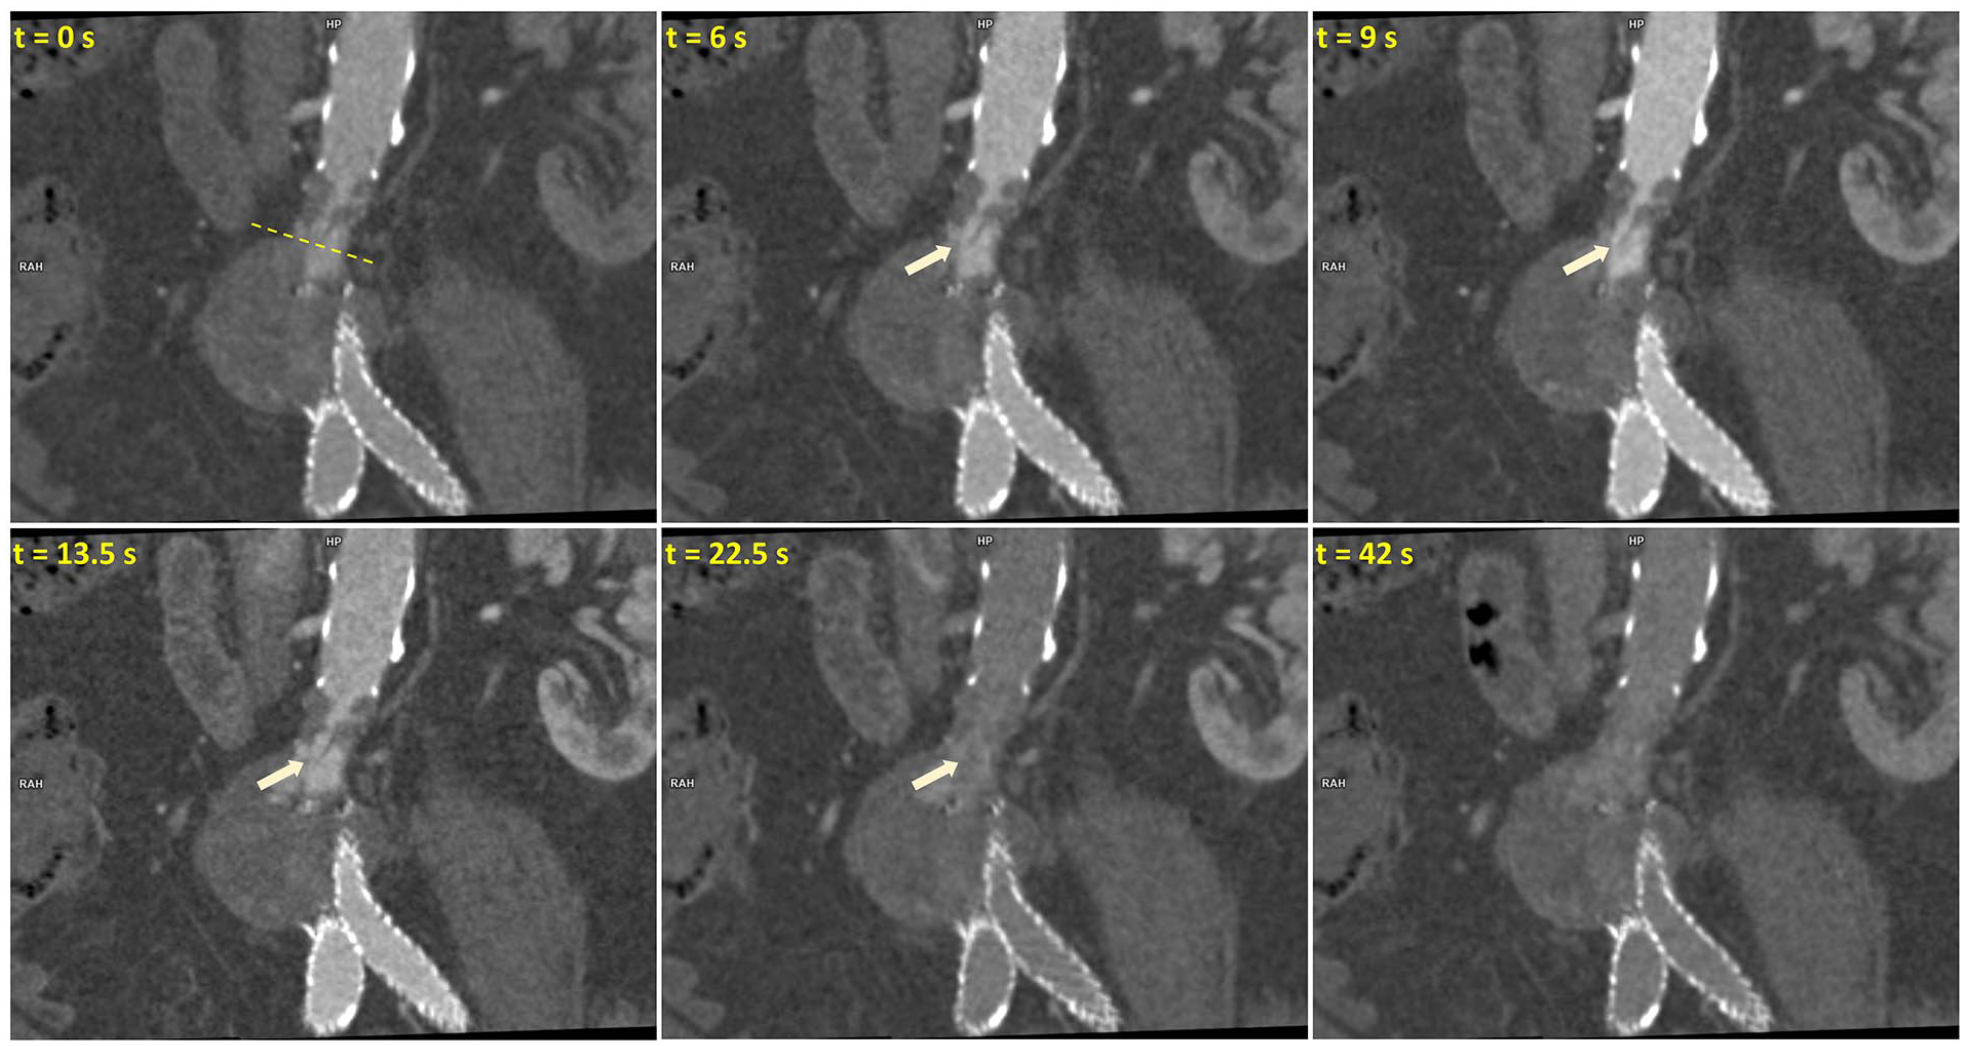
An 81-year-old male with history of chronic obstructive pulmonary disease and hypertension underwent previous infrarenal EVAR (Gore Excluder, W.L. Gore & Associates) in 2016. Patient had prior history of coil embolization possibly for type II endoleak and cuff placement at infrarenal aortic neck. Patient was referred from an outside hospital where CTA imaging showed ambiguous type I and/or possible type II endoleak post coil embolization with sac expansion. D-CTA was performed in the region of stent graft with 11 scans for a total scan time of 21 seconds using 90 kV after injecting 70 ml contrast volume. The d-CTA images showed maximal contrast opacification in the right lateral wall of the infrarenal aortic neck during the early phases of time-resolved CTA that also extends into the aneurysm sac pointing toward type I endoleak (Figures 1 and 2, Supplemental Video 1). Quantitative analysis showed an early peak of TAC from aneurysm sac ROI, as compared to TAC from the aorta (ROI drawn above the level of renal arteries) confirming type I endoleak. Time to peak value for the aortic ROI was 14.39 and 18.09 seconds for the endoleak ROI, creating a 3.7-second Δtime to peak value (Figure 3).
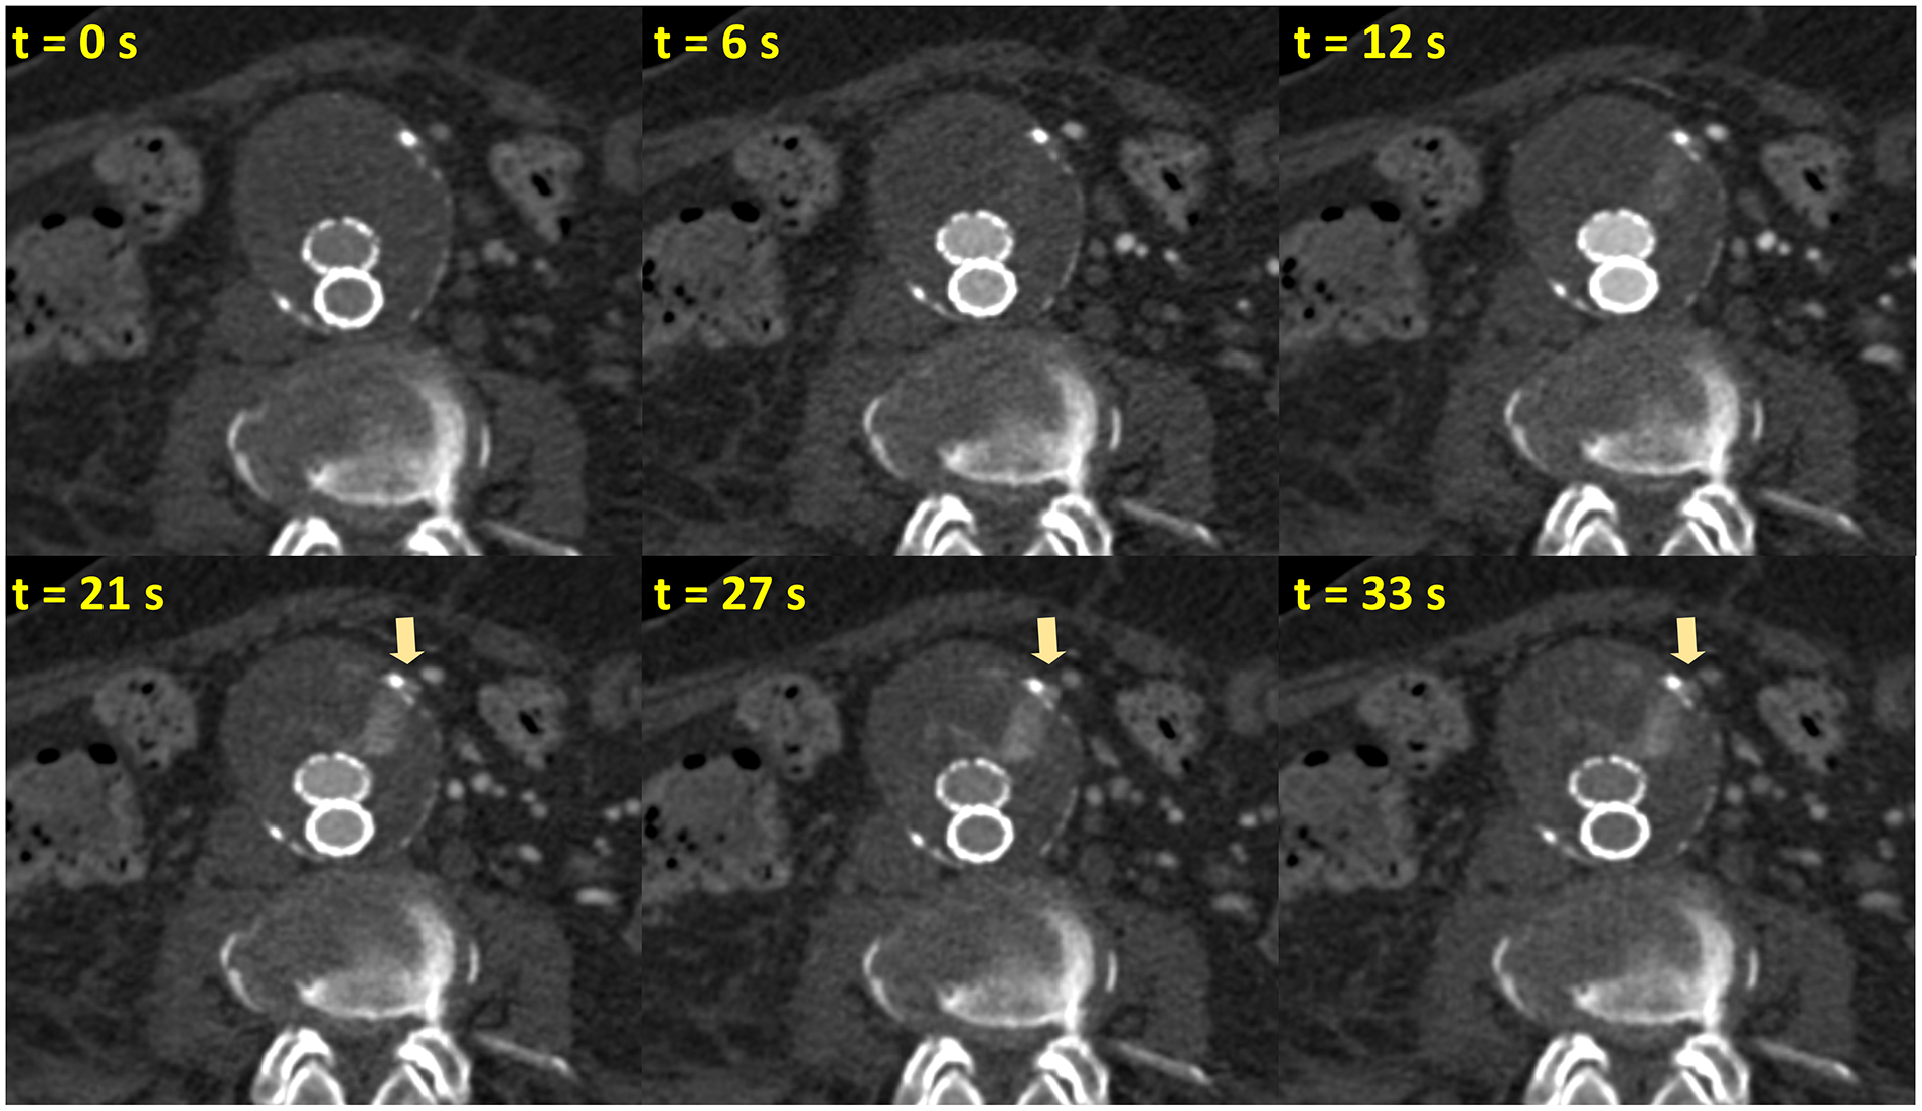
Time-resolved coronal view of d-CTA images in an 81-year-old patient after infrarenal EVAR and coil embolization. During the early phases of d-CTA, contrast opacification was noted between aortic wall and right lateral stent graft margin (yellow arrow) that was contiguous with contrast enhancement of aneurysm sac depicting type Ia endoleak. The yellow dotted line denotes the level of the axial views illustrated in Figure 2.
Time-resolved axial views of d-CTA images showing early contrast opacification between aortic wall and right lateral stent graft margin (yellow arrow) that was contiguous with contrast enhancement of aneurysm sac depicting type Ia endoleak.
Quantitative TAC analysis of d-CTA images demonstrating type I endoleak. (A) TAC showing relative contrast enhancement in aorta (ROIaorta in blue) and endoleak (ROIsac in red), with time to peak of 14.39 and 18.09 seconds respectively, creating a Δtime to peak value of 3.7 seconds. This demonstrates a relatively earlier peak of endoleak enhancement in the aneurysm sac, that when combined with contrast enhancement outside the stent graft in the aortic neck, confirms Type 1A endoleak. (B) Shows the locations of ROIaorta and ROIsac in a coronal reconstruction of d-CTA.
Patient was taken to the hybrid operating room for a fenestrated EVAR procedure to gain additional proximal seal zone. Type I endoleak was confirmed by 2D DSA performed at an optimal angle derived from d-CTA.
Type II Endoleak With Inferior Mesenteric Artery as Inflow
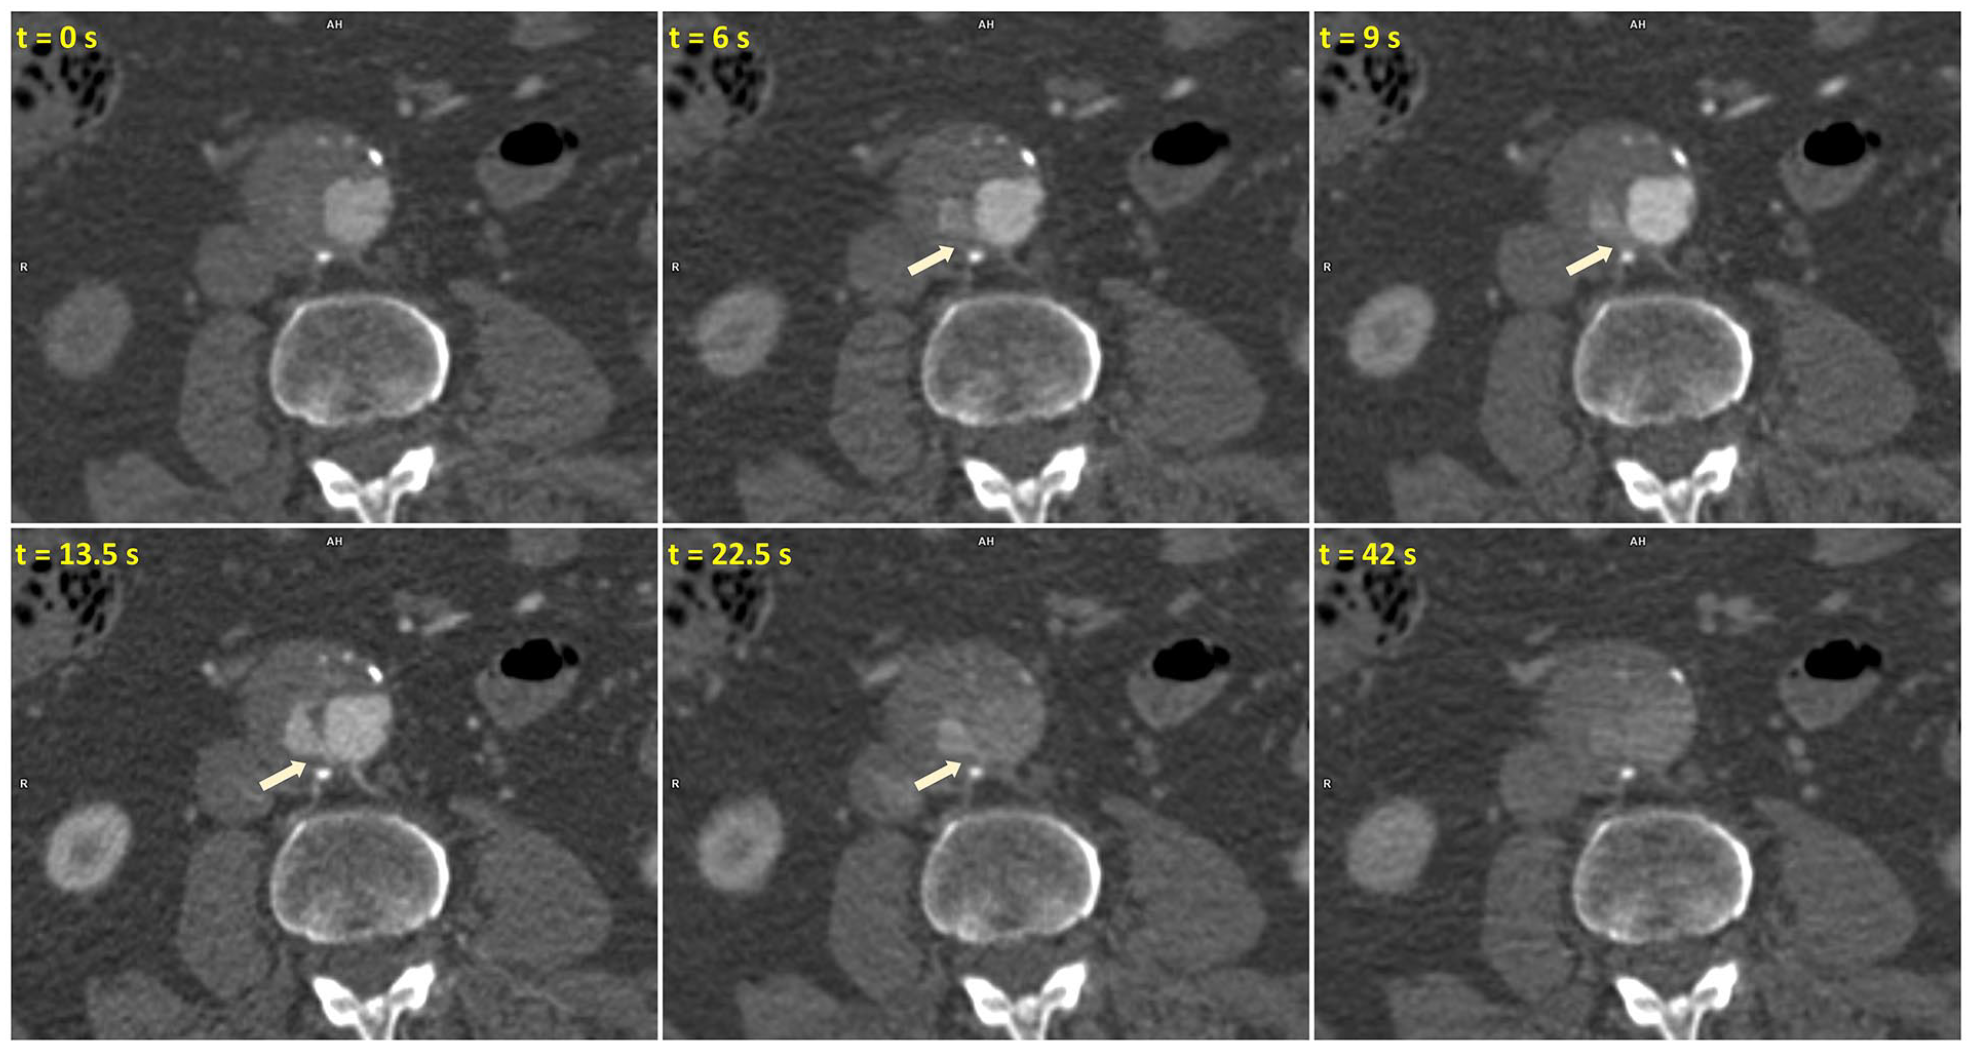
A 72-year-old male patient with history of hypertension, hyperlipidemia, and prior infrarenal EVAR (Gore Excluder, W.L. Gore & Associates) 3 years ago, was referred with a diagnosis of endoleak. The t-CTA from an outside hospital demonstrated a type II endoleak and sac enlargement. D-CTA was performed with 11 scans for a total duration of around 33 seconds using 80 kV after injection of 80 ml iodinated contrast agent. D-CTA images demonstrated a delayed enhancement in the anterior portion of aneurysm sac at the level of inferior mesenteric artery (IMA) origin (Figure 4). Time-resolved images illustrate the flow into the aneurysm sac from IMA (Figure 5, Supplemental Video 2). Quantitative analysis showed a longer time to peak value (21.59 seconds) for both ROIsac and IMA (ROItarget) as compared to ROIaorta (12.59 seconds) (Figure 6). The Δtime to peak value between ROIaorta and ROIsac was ~9 seconds (Figure 6).
Time-resolved axial d-CTA images of a 72-year-old patient demonstrating type II endoleak with IMA as inflow. Time-resolved d-CTA images highlight the delayed enhancement inside the anterior segment of the aneurysm sac, originating from IMA (yellow arrow).
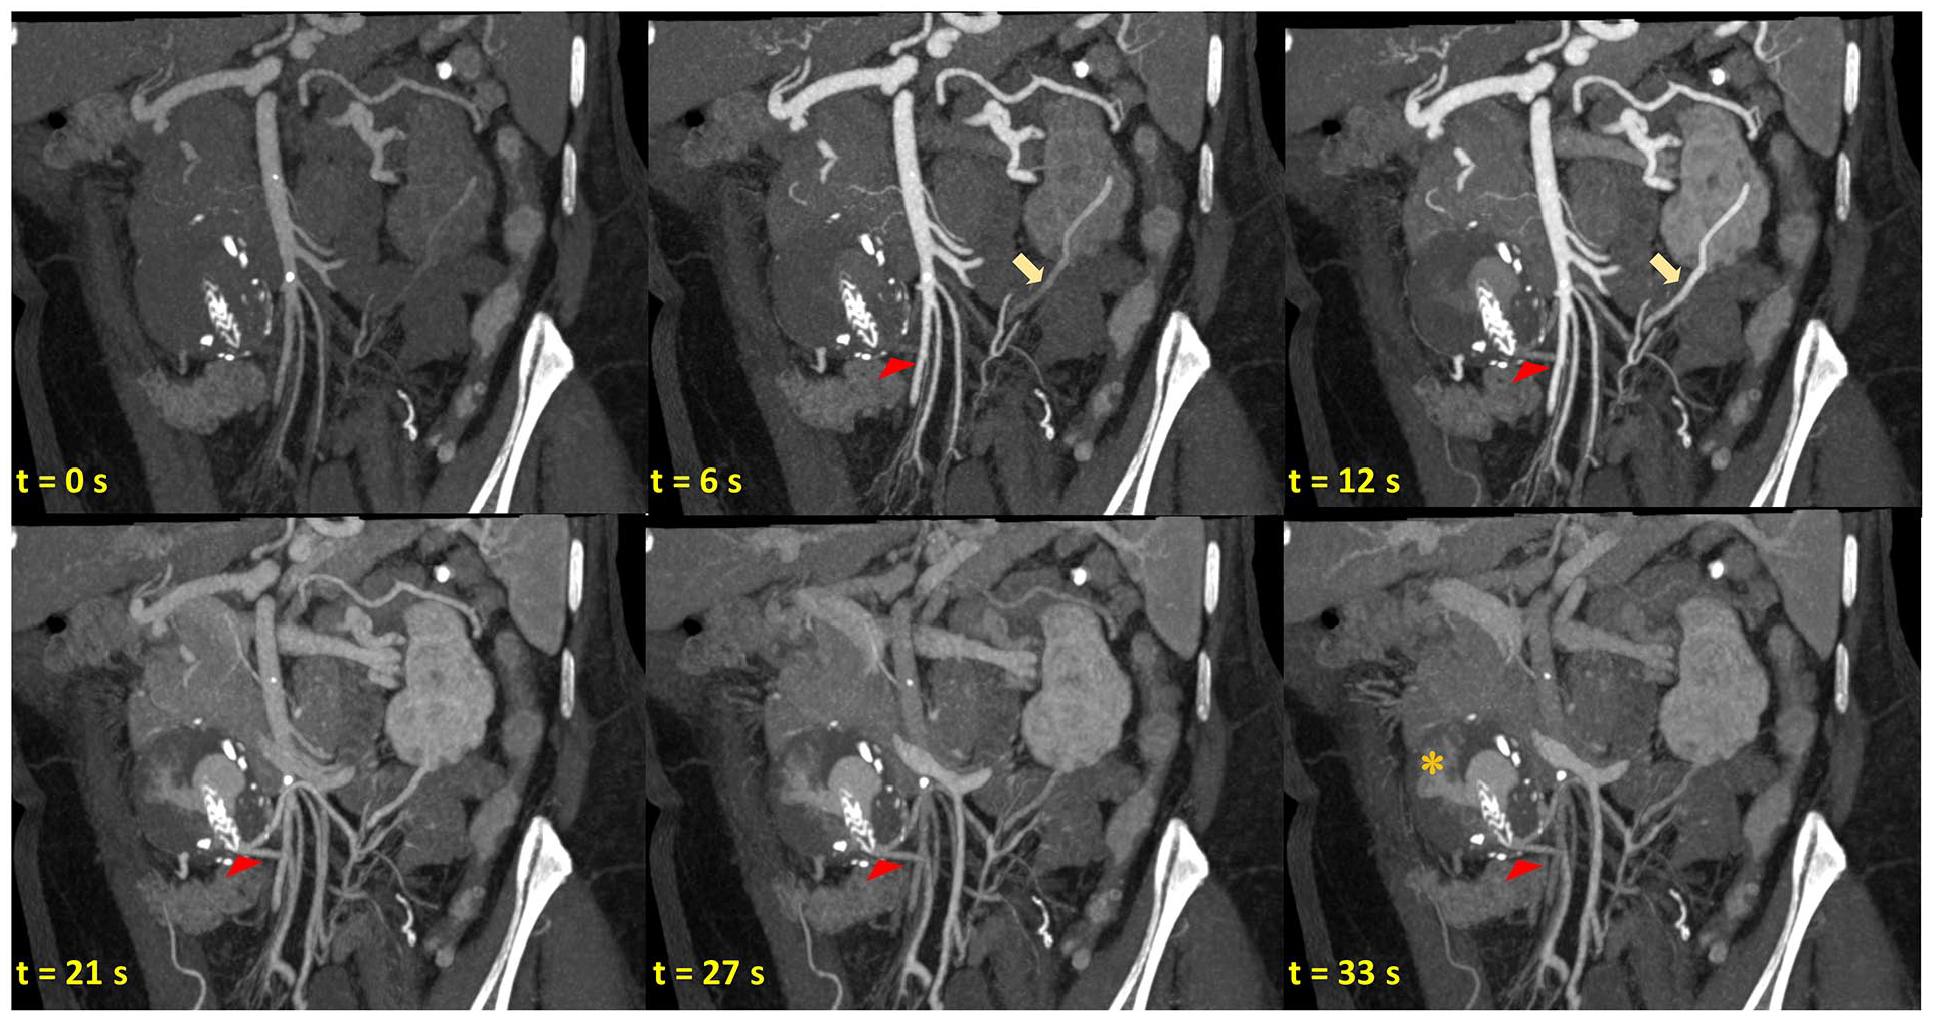
Time-resolved coronal d-CTA images illustrating the flow from the SMA to the IMA (yellow arrow) through the artery of Drummond. The entry point of IMA into the aneurysm sac is marked with a red arrowhead demonstrating a type II endoleak (orange asterisk).
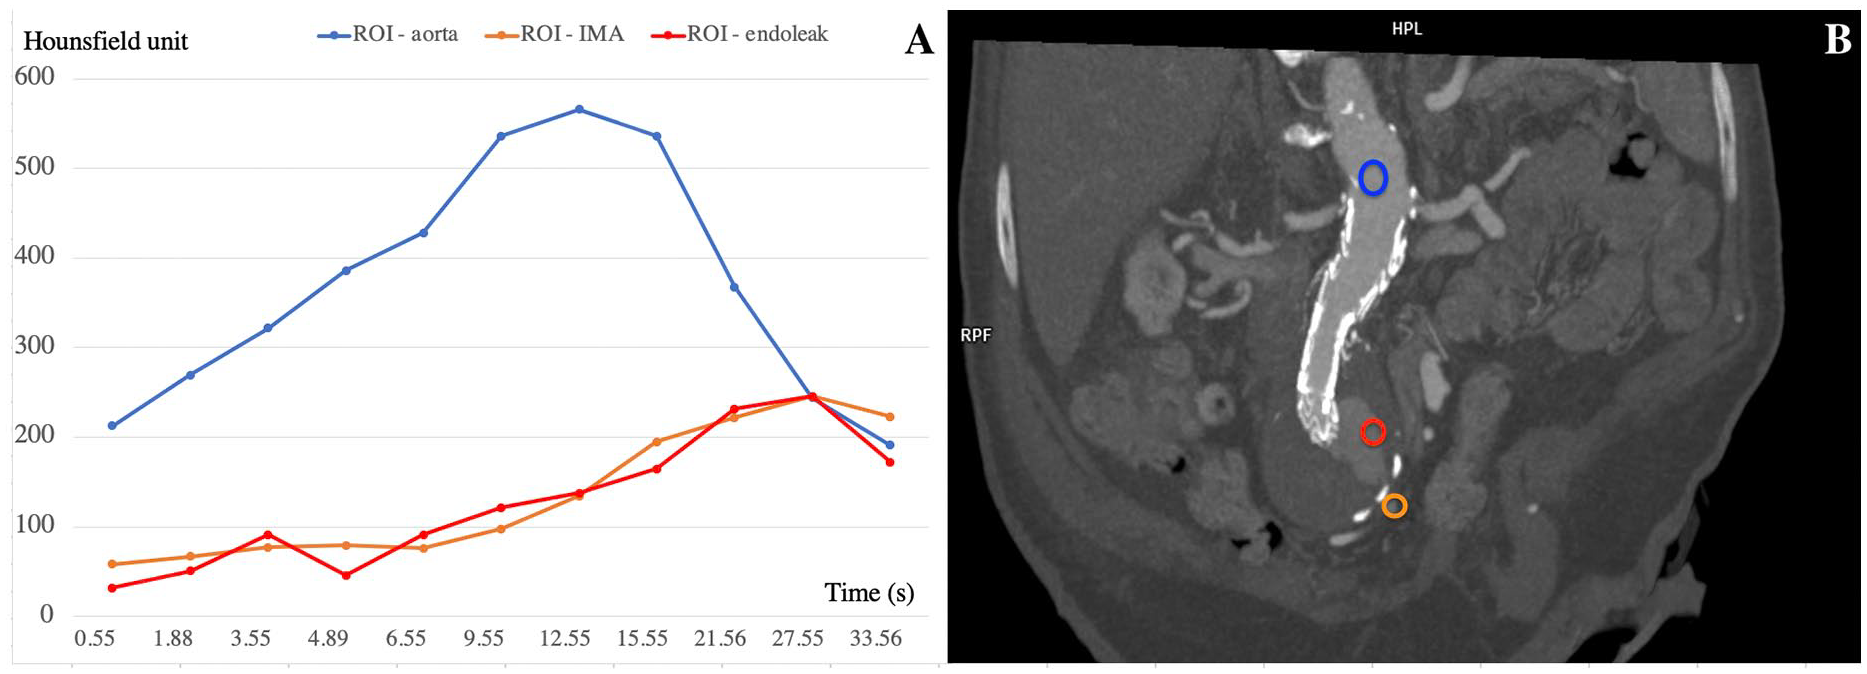
Quantitative TAC analysis of d-CTA images demonstrating type II endoleak. (A) TAC showing relative higher contrast enhancement in the aorta (ROIaorta in blue color), and a delayed peak of aneurysm sac (ROIsac in red color) and IMA curves (ROItarget in orange color). Time to peak in aorta ROIaorta was 12.59 seconds as compared to 27.55 seconds for aneurysm sac (red) and IMA (orange) curves, with a higher Δtime to peak value of 14.96 seconds, thereby confirming a delayed type II endoleak from IMA. (B) Shows the locations of corresponding ROIs in a coronal reconstruction of d-CTA.
Time resolved images from d-CTA were reviewed to identify the access pathway to the IMA and endoleak cavity from superior mesenteric artery through the artery of Drummond (Figure 7). During the interventional procedure, the optimal phase of d-CTA images showing the artery of Drummond and the endoleak was fused with 2D fluoroscopy using image fusion for guidance. Intraoperative DSA imaging confirmed the diagnosis of type II endoleak and the patient underwent transarterial embolization using liquid embolic agent (Onyx™, Medtronic).
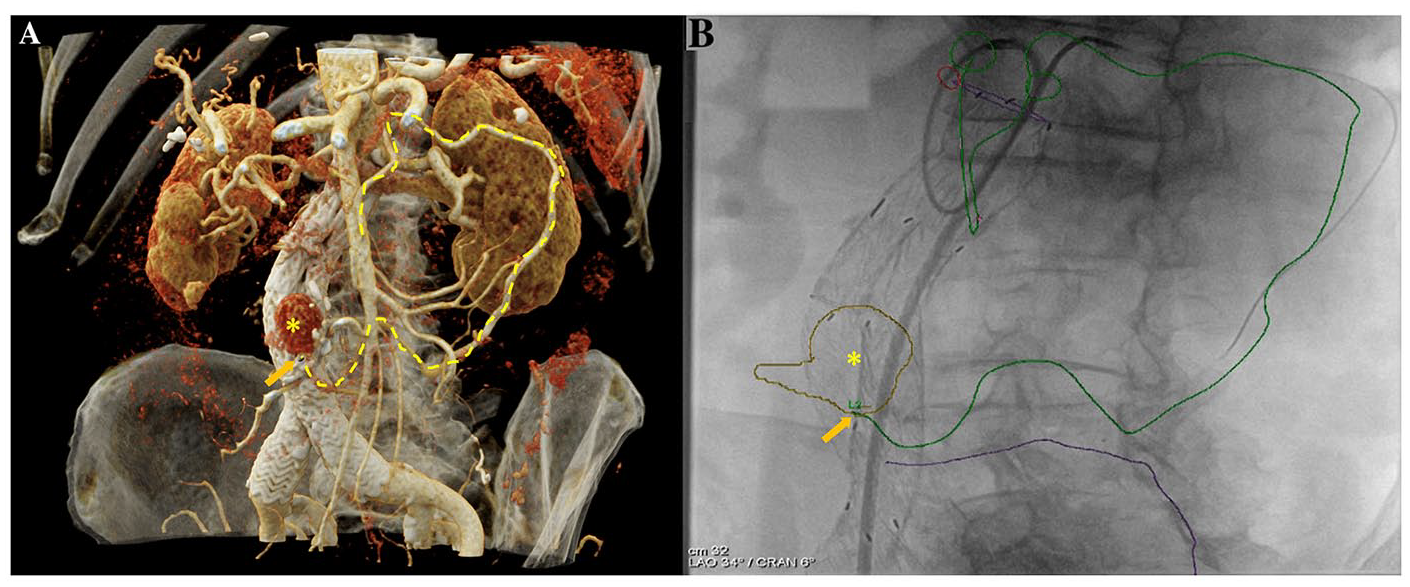
Image guidance for embolization using d-CTA images. (A) Cinematic rendered 3D reconstruction demonstrating the relationship of SMA, artery of Drummond, IMA, and endoleak in the anterior aspect of the aneurysm sac (yellow asterisk). The course of the access from SMA origin to endoleak in the aneurysm sac was highlighted (dashed-yellow line), and the entry point of IMA to the aneurysm was annotated (orange arrow). (B) After image fusion of d-CTA with fluoroscopy, the vessel ostia (green circle) and centerlines were overlaid for interventional guidance. A wire was advanced along the planned vessel trajectory (green line) from SMA to the aneurysm sac, using microcatheter and catheter support.
Type II Endoleak With Lumbar Artery as Inflow
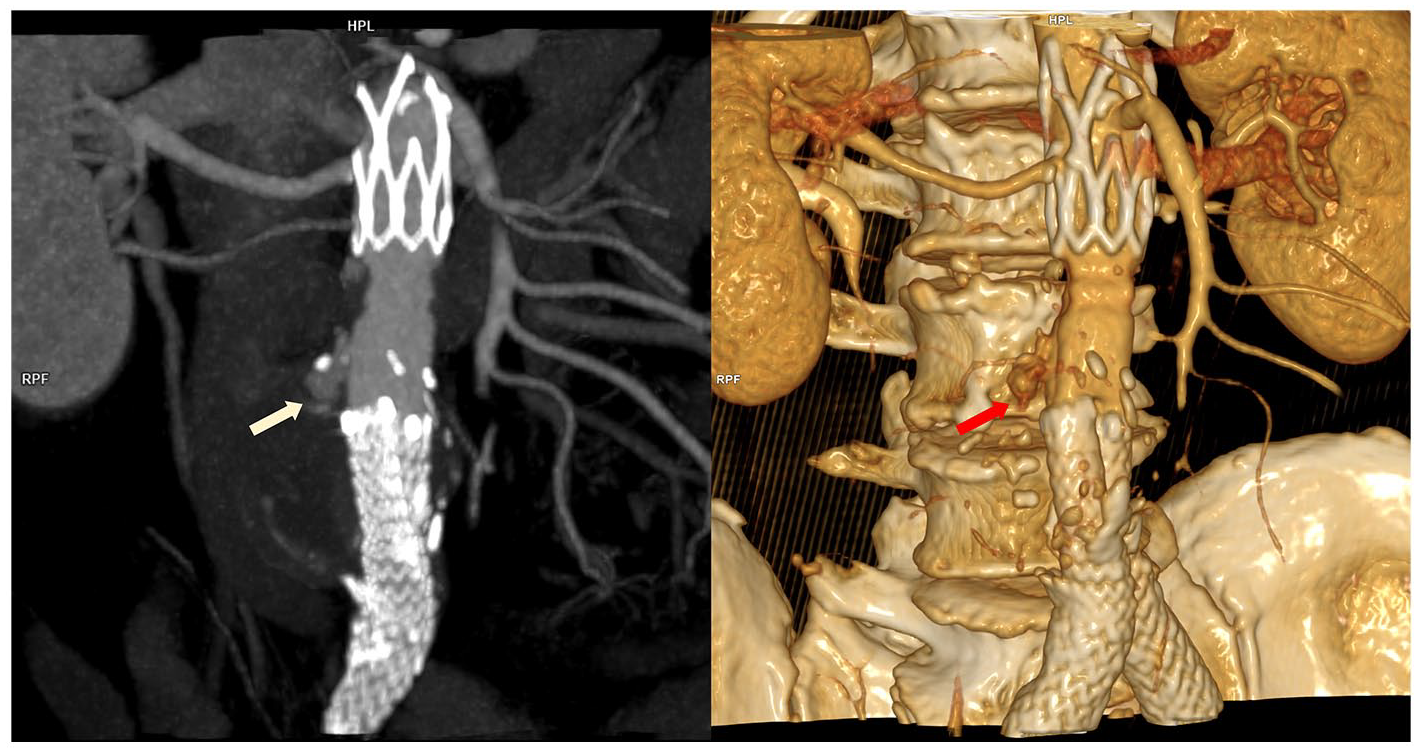
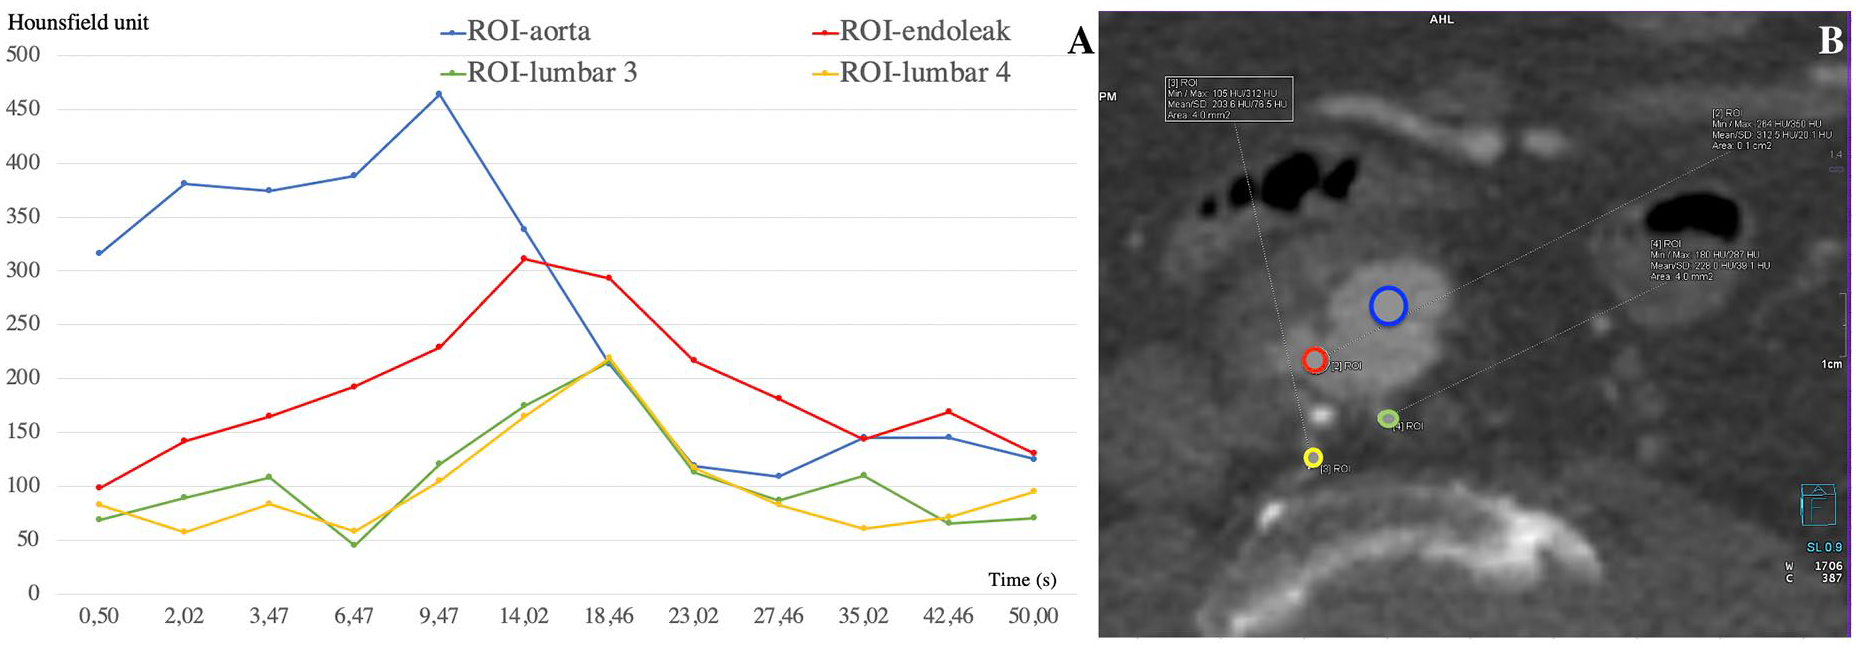
A 79-year-old patient history of previous stroke and hypertension underwent an infrarenal EVAR (Gore Excluder, W.L. Gore & Associates) 4 years ago at an outside hospital. Patient was referred for aneurysm sac enlargement that was noted as an incidental finding during imaging-workup for a general surgical procedure. D-CTA was performed in the region of stent graft, acquiring 11 scans over a total scan duration of 52 seconds using 80 kV after injection of 75 ml iodinated contrast agent. Time-resolved images demonstrated delayed opacification in the posterior segment of the aneurysm sac that corresponds to opacification of the lumbar artery at the level of the fourth lumbar vertebra (Figure 8). Quantitative analysis showed a longer time to peak value of 20.6 and 24.6 seconds for ROItarget and ROIsac respectively, as compared to 12.6 seconds for ROIaorta. The Δtime to peak value between ROIaorta and ROIsac was ~12 seconds (Figure 9).
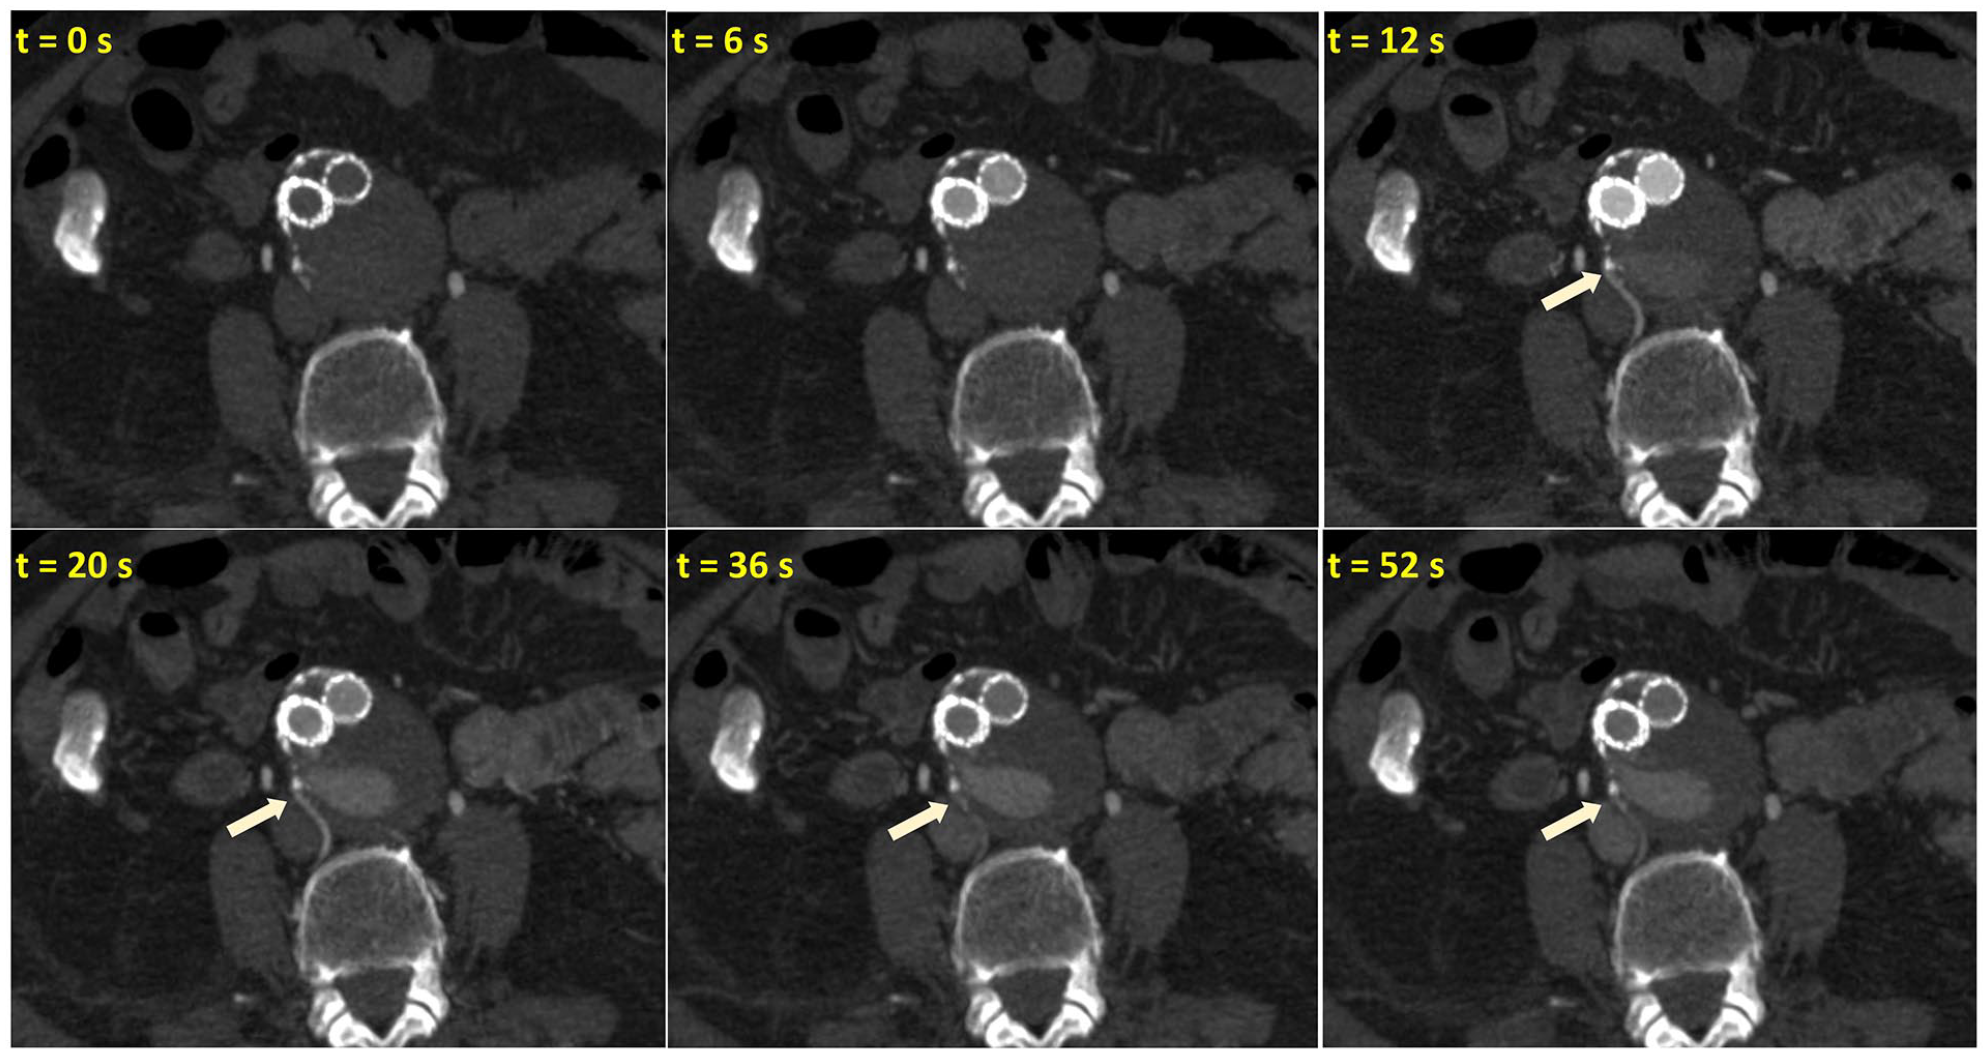
Time resolved axial d-CTA images in a 79-year-old patient who presented with aneurysm sac enlargement after an infrarenal EVAR 4 years ago. The d-CTA scan timing was optimized to cover a broader time range and detect delayed enhancement of aneurysm sac. Delayed opacification of L4 right lumbar artery followed by opacification of posterior aneurysm sac, demonstrates a type II endoleak.
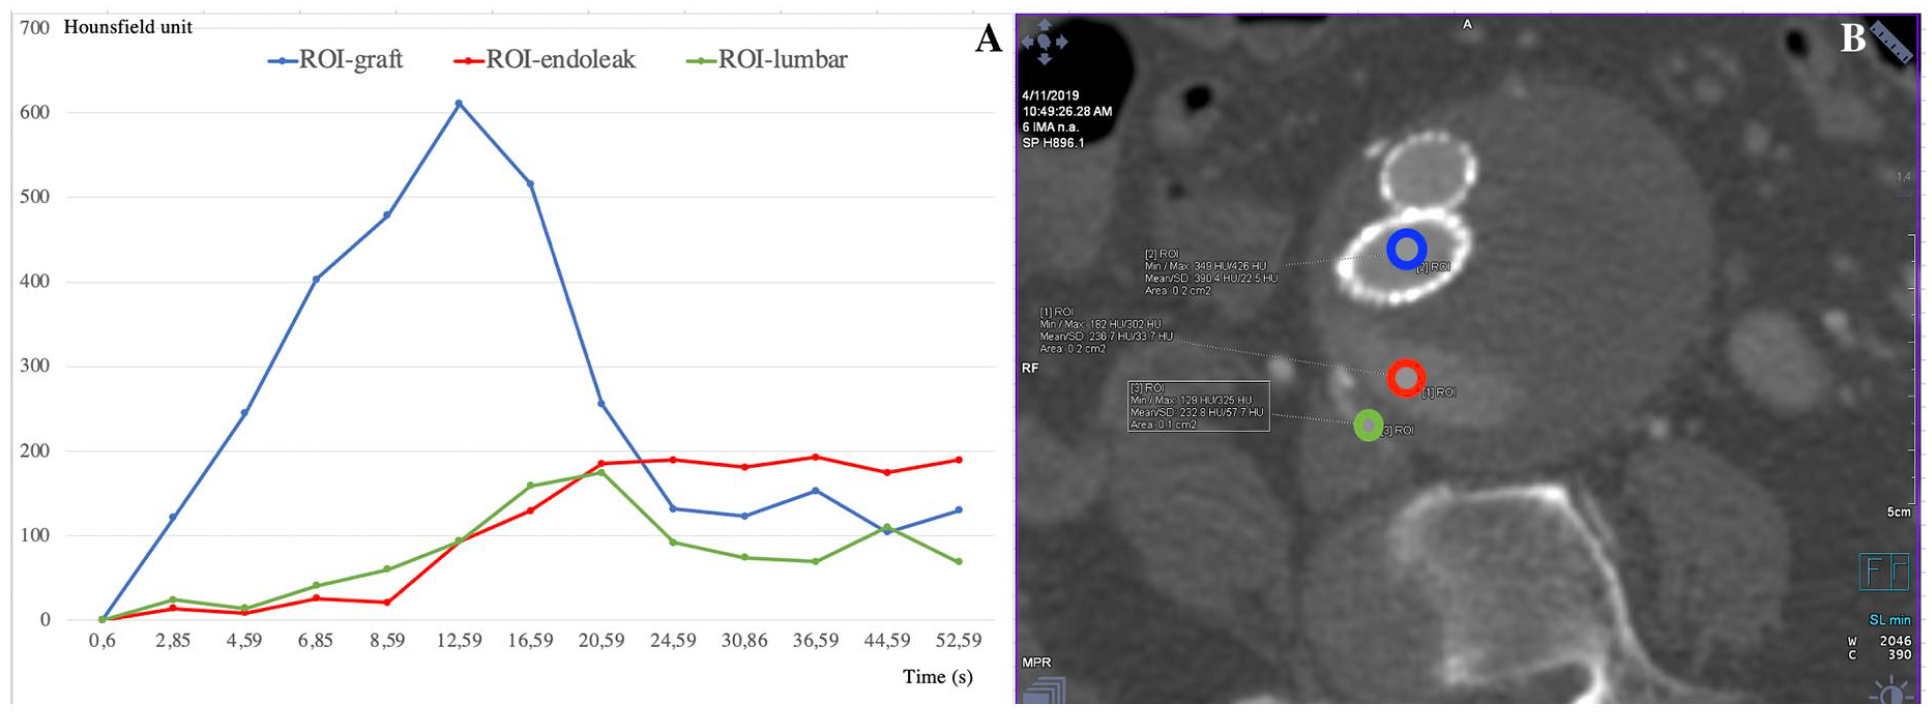
Quantitative TAC analysis of d-CTA images demonstrating type II endoleak from lumbar artery. (A) TAC showing relatively higher contrast enhancement in the aorta (ROIaorta in blue color), and a delayed peak of aneurysm sac (ROIsac in red color) and lumbar artery curves (ROItarget in green color). Time to peak in aorta ROIaorta was 12.6 seconds as compared to 20.6 seconds for lumbar artery (green) and 24.6 seconds for aneurysm sac (red), respectively, with a higher Δtime to peak value of 12 seconds, thereby confirming a delayed type II endoleak from lumbar artery. (B) Shows the locations of corresponding ROIs in an axial reconstruction of d-CTA.
The patient was taken to the hybrid operating room for transarterial embolization of endoleak. Time-resolved d-CTA images were reviewed; the scan that had optimal opacification of the right L4 lumbar artery was selected; and the vessel trajectory from the origin of right hypogastric artery was electronically annotated (Figure 10). The 2D–3D image fusion was performed to co-register the d-CTA with fluoroscopy. DSA imaging performed at an optimal C-arm projection derived from d-CTA confirmed type II endoleak from right iliolumbar and L4 lumbar artery opacifying the aneurysm sac. The patient underwent targeted transarterial embolization of using a liquid embolic agent (Onyx™, Medtronic).
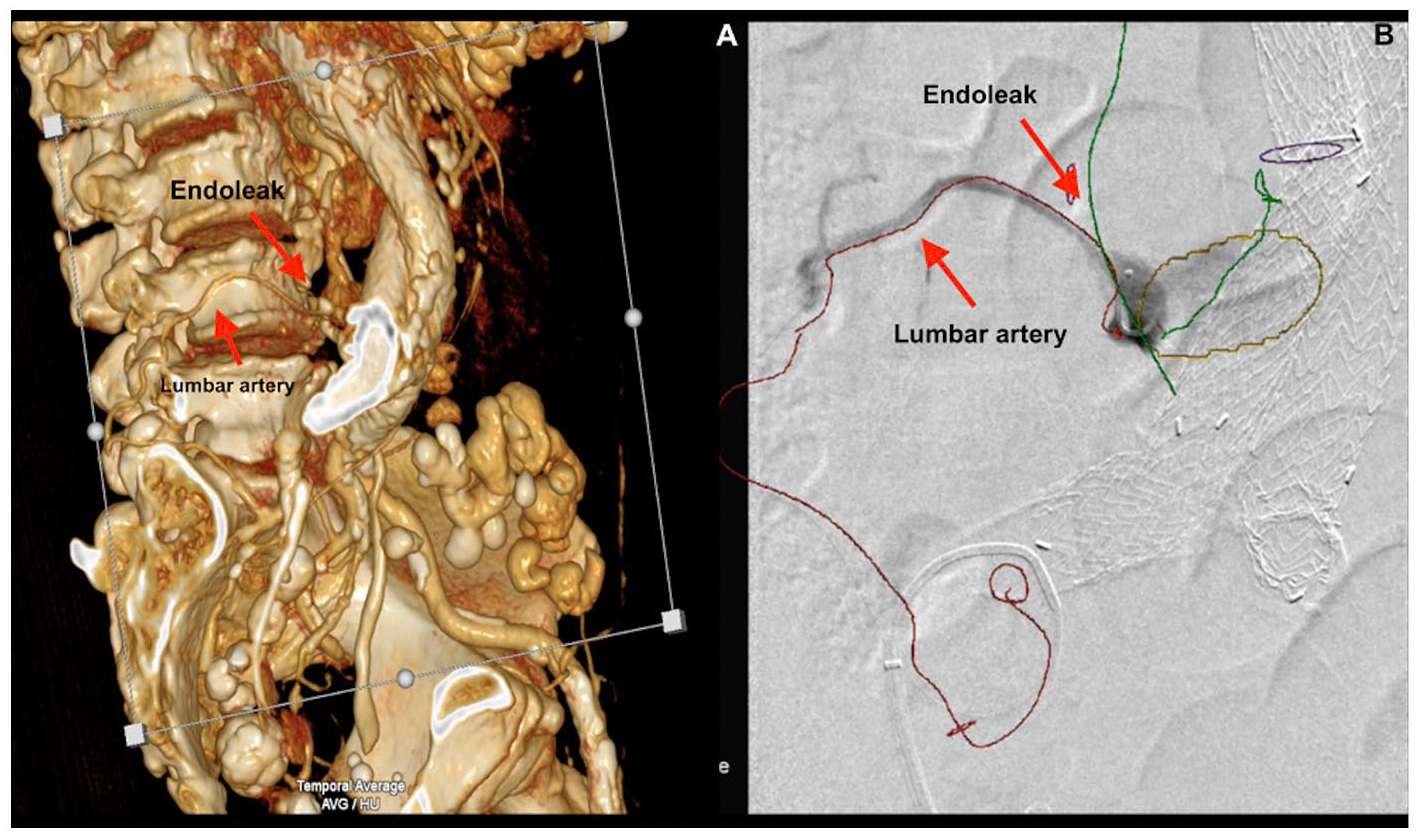
Image guidance from d-CTA for trans-arterial embolization of type II endoleak. (A) Volume rendered 3D reconstruction of d-CTA demonstrating type II endoleak from L4 lumbar artery arising from the right hypogastric artery (red arrow). (B) DSA image overlaid with electronic annotations of right iliolumbar artery (red line) from d-CTA images after 2D–3D image fusion. A microcatheter was advanced into the right L4 lumbar artery from a right femoral arterial access using d-CTA image fusion guidance, and a contrast injection was performed confirming type II endoleak.
Type III Endoleak
A 71-year-old male, with history of hypertension and an infrarenal EVAR (Ovation®, Endologix) was referred for management of a persistent type II endoleak with sac enlargement observed in multiple CTA studies over a 2-year follow-up period by different radiologists. D-CTA imaging was performed over the region of stent graft acquiring 12 scans over the total scan duration of 50 seconds, with 100 kV after injection of 90 ml iodinated contrast agent. D-CTA imaging showed progressive enhancement of the aneurysm sac on the right lateral aspect of the stent-graft just below the level of polymer sealing rings (Figures 11 and 12, Supplemental Videos 3 and 4) and opacification of bilateral L3 lumbar arteries (Figure 13). Qualitative review of time-resolved CTA images showed that aneurysm sac enhances first through the defect below the polymer sealing ring followed by filling of the lumbar arteries pointing toward type III endoleak (Figure 14). Quantitative TAC analysis showed time to peak value in the aorta (ROIaorta) to be 9.47 seconds as opposed to 14.02 seconds for aneurysm sac (ROIsac) and 18.46 seconds for L3 lumbar arteries (ROItarget). The Δtime to peak values between ROIaorta and ROIsac was 4.55 seconds, as compared to Δtime to peak values between ROIaorta and ROItarget that was 8.99 seconds, thereby confirming type III endoleak arising from a defect below the polymer sealing rings.
Coronal and volume rendered reconstructions from d-CTA in a 71-year-old patient with persistent endoleak after EVAR (Ovation®, Endologix). Enhancement of the aneurysm sac (red and yellow arrows) below the level of non-radiopaque polymer sealing rings was observed pointing to type III endoleak.
Time-resolved coronal images illustrating early opacification of aneurysm sac filling via a defect (yellow arrow) at the level of polymer sealing rings. Yellow dotted line indicates the level of the axial images presented in Figure 13.
Time-resolved axial images below the level of polymer sealing rings illustrating early opacification of aneurysm sac followed by filling of L3 lumbar arteries in the later phases.
Quantitative TAC analysis of d-CTA images demonstrating type III endoleak from a defect in the polymer sealing ring (as illustrated in Figure 12). (A) TAC showing relatively earlier peak of contrast enhancement in the aneurysm sac (ROIsac in red) as compared to lumbar arteries (ROItarget in yellow and green). The Δtime to peak values between ROIaorta (blue) and ROIsac was 4.55 seconds, as compared to Δtime to peak values between ROIaorta and ROItarget that was 8.99 seconds, thereby confirming type III endoleak and not a persistent type II endoleak as diagnosed by prior imaging. (B) Shows the locations of corresponding ROIs in an axial reconstruction of d-CTA.
Patient underwent endovascular treatment to reline the stent-graft to treat type III endoleak. Optimal phase of time-resolved d-CTA image was selected and endoleak sac, polymer rings were electronically marked to provide image guidance. After 2D–3D image fusion, landing zone and non-radiopaque polymer rings from d-CTA were overlaid on fluoroscopy. Two aortic cuffs (Gore Excluder, W.L. Gore & Associates®), of sizes 28.5 mm × 3.3 cm and 26 mm × 3.3 cm, were deployed at the level of type III endoleak and below the renal arteries.
Discussion
Unlike type I or III endoleaks, clinical relevance and management of type II endoleaks especially in the absence of aneurysm sac growth remains a matter of debate, as investigated in recent systematic reviews.11–13 Previous studies have shown that percutaneous endovascular attempts to treat type II endoleak results in poor clinical outcome with a majority of patients presenting with persistent/recurrent endoleak upon follow-up. 14 Failure of type II endoleak treatment in the presence of aneurysm sac growth or delayed rupture has been attributed to incomplete embolization of target vessels, occult type I or III endoleak that was not initially diagnosed by imaging.14,15 This highlights the current need for robust, non-invasive, dynamic imaging techniques during EVAR surveillance to diagnose and accurately classify the type and source of endoleak. This is even more relevant in the context of recent expansion of endovascular aortic therapies to juxta-renal and supra-renal aortic aneurysms, in the form of fenestrated/branched endografts. While CT remains the primary imaging modality for EVAR follow-up, herewith, we describe d-CTA imaging technique and highlight its additional value in characterizing endoleaks and targeted treatment. This can be achieved with equivalent contrast load and radiation exposure as conventional t-CTA.4,7 Overall radiation exposure can be further reduced using optimized CT acquisition protocols (lower kV, lower number of scans, shorter scan FOV) and advanced iterative image reconstruction algorithms.
Lehmkuhl et al. 6 published data on aortic and endoleak specific enhancements in dynamic CT imaging, concluding that there is a significant difference in peak enhancement between the 2 enabling better endoleak detection rate as compared to conventional CT. 6 Hou et al. 4 demonstrated in their prospective trial that diagnostic accuracy with d-CTA was superior to t-CTA and the additional information from d-CTA can be used to achieve dose reduction during endoleak treatment. In this pilot study, d-CTA showed 100% accuracy in diagnosing endoleak, while other studies have shown 90.5% sensitivity and 100% specificity as compared to conventional t-CT imaging.4,16 The value of d-CTA imaging, as highlighted in 4 illustrative cases here, is evident in quantitatively characterizing aortic endoleak type and inflow vessels, thereby integrating diagnostic imaging with interventional treatment followed by objective assessment during follow-up.
Accurate characterization of endoleak depends not only on correlating contrast enhancement in arterial and delayed phase scans but also requires identification of flow direction inside the aneurysm sac and/or target vessel in a quantitative manner. Based on our preliminary experience with d-CTA imaging, we focused on evaluating quantitative parameters such as time to peak and Δtime to peak between ROIaorta and ROIsac rather than using CT Hounsfield unit enhancements that may vary due to contrast dilution, scan timing and patient’s hemodynamic function. The Δtime to peak between ROIaorta and ROIsac can help in differentiating type I or III endoleak from a delayed type II endoleak.
In this report, we described 4 illustrative cases to describe the value of dynamic CTA in characterizing aortic endoleaks using both qualitative and quantitative analyses. In addition to accurately characterizing endoleaks, appropriate time-resolved d-CTA dataset can provide better visualization of target vessels and guide interventional treatment after image fusion. D-CTA based image guidance is more valuable in the context of type II endoleaks where cannulating and embolizing the lumbar or inferior mesenteric vessels typically requires angiography at multiple projections, and longer fluoroscopy time.
The d-CTA technique has few practical limitations such as the availability of a third-generation CT scanner with required software and need for technical expertise in configuring endoleak protocols. This involves the need for patient specific optimization of scan parameters such as timing bolus, kV, FOV, scan timing, and number of scans. In addition, d-CTA imaging requires dedicated tools for image review and quantitative analysis.
Further dedicated studies are required to evaluate the diagnostic accuracy of d-CTA as compared to t-CTA, conventional angiography and to assess the impact of d-CTA-based image fusion on endoleak treatment. Such dynamic CT imaging techniques may also have a potential application in better imaging other dynamic pathologies such as aortic dissection, peripheral arterial disease, arterio-venous malformations.
Conclusion
D-CTA imaging with TAC analysis characterizes aortic endoleak type and inflow and provides image guidance for targeted treatment. Such a dynamic, time-resolved imaging technique may provide further insights into understanding aortic endoleak that remains an Achilles heel for EVAR.
Footnotes
Declaration of Conflicting Interests
The authors declared the following potential conflicts of interest with respect to the research, authorship, and/or publication of this article: ABL receives research support from Siemens Medical Solutions USA Inc., Malvern, PA. PC is a senior staff scientist at Siemens Medical Solutions USA Inc., Malvern, PA.
Funding
The authors disclosed receipt of the following financial support for the research, authorship, and/or publication of this article: Marton Berczeli is supported by Semmelweis University’s scholarship: “Kiegészítő Kutatási Kiválósági Ösztöndíj” EFOP-3.6.3-VEKOP-16-2017-00009.
Supplemental Material
Supplemental material for this article is available online.
References
Supplementary Material
Please find the following supplemental material available below.
For Open Access articles published under a Creative Commons License, all supplemental material carries the same license as the article it is associated with.
For non-Open Access articles published, all supplemental material carries a non-exclusive license, and permission requests for re-use of supplemental material or any part of supplemental material shall be sent directly to the copyright owner as specified in the copyright notice associated with the article.