






Abstract
Purpose:
This study aimed to develop and internally validate nomograms for predicting restenosis after endovascular treatment of lower extremity arterial diseases.
Materials and Methods:
A total of 181 hospitalized patients with lower extremity arterial disease diagnosed for the first time between 2018 and 2019 were retrospectively collected. Patients were randomly divided into a primary cohort (n=127) and a validation cohort (n=54) at a ratio of 7:3. The least absolute shrinkage and selection operator (LASSO) regression was used to optimize the feature selection of the prediction model. Combined with the best characteristics of LASSO regression, the prediction model was established by multivariate Cox regression analysis. The predictive models’ identification, calibration, and clinical practicability were evaluated by the C index, calibration curve, and decision curve. The prognosis of patients with different grades was compared by survival analysis. Internal validation of the model used data from the validation cohort.
Results:
The predictive factors included in the nomogram were lesion site, use of antiplatelet drugs, application of drug coating technology, calibration, coronary heart disease, and international normalized ratio (INR). The prediction model demonstrated good calibration ability, and the C index was 0.762 (95% confidence interval: 0.691-0.823). The C index of the validation cohort was 0.864 (95% confidence interval: 0.801-0.927), which also showed good calibration ability. The decision curve shows that when the threshold probability of the prediction model is more significant than 2.5%, the patients benefit significantly from our prediction model, and the maximum net benefit rate is 30.9%. Patients were graded according to the nomogram. Survival analysis found that there was a significant difference in the postoperative primary patency rate between patients of different classifications (log-rank p<0.001) in both the primary cohort and the validation cohort.
Conclusion:
We developed a nomogram to predict the risk of target vessel restenosis after endovascular treatment by considering information on lesion site, postoperative antiplatelet drugs, calcification, coronary heart disease, drug coating technology, and INR.
Clinical Impact
Clinicians can grade patients after endovascular procedure according to the scores of the nomograms and apply intervention measures of different intensities for people at different risk levels. During the follow-up process, an individualized follow-up plan can be further formulated according to the risk classification. Identifying and analyzing risk factors is essential for making appropriate clinical decisions to prevent restenosis.
Introduction
Lower extremity arterial disease (LEAD) is a common form of peripheral arterial disease (PAD), an atherosclerotic occlusive disease of the lower extremities. A study 1 showed that approximately 200 million people worldwide are affected by PAD. The common symptoms of affected individuals are decreased skin temperature, local sensory numbness, pain, intermittent claudication, and even ulceration or necrosis of the toes. Patients with severe conditions can gradually progress to critical limb ischemia (CLI). These patients require bypass surgery or amputation.
Endovascular treatment (EVT) is the most widely used and promising treatment for LEAD. However, postoperative restenosis and in-stent restenosis (ISR) are essential factors restricting the curative effect of surgery. The occurrence of postoperative restenosis is related to many factors, not only related to the risk factors 2 of PAD itself (eg, hypertension, diabetes, chronic kidney disease, hyperlipidemia, smoking)2,3 but also related to the selection of EVT devices4,5 (eg, drug-coated balloon [DCB], drug-eluting stent [DES], and debulking strategy). Considering the related risk factors, accurate prediction of restenosis after interventional surgery and early intervention may be the most effective measure for restenosis prevention. The previous studies6–8 have analyzed potential predictors associated with restenosis based on patient and procedure-related factors. However, most researchers focus on identifying such prediction factors or developing prediction models, ignoring the ease of use for clinicians and patients in clinical decision-making. Thus, an accurate, effective, easy-to-use prediction model is needed for patients receiving EVT.
Nomogram9,10 can visually present a statistical prediction model for prognosis. Recent research studies have shown that nomograms can be used in incident peritoneal dialysis patients to predict cardiovascular events.11,12 Besides, researchers have used nomogram in LEAD patients with type 2 diabetes to evaluate the incident risk. 13 Compared with the traditional risk factor analysis, a nomogram has the advantages of visualization and accuracy, which can assist in making clinical decisions.
The purpose of this study was to develop a valid prediction tool to analyze the risk factors of PAD-related postoperative patency rate after EVT, so as to more comprehensively and effectively predict the effectiveness of EVT in PAD population.
Patients and Methods
Patients
This research was approved by the ethics committee of the First Affiliated Hospital of Xi’an Jiaotong University. Information about patients was retrospectively collected from the electronic medical records of the First Affiliated Hospital of Xi’an JiaoTong University from January 2018 to December 2019. Patients were included if they (1) were diagnosed with LEAD and no endovascular or open reconstruction had been performed before, (2) were hospitalized for EVT, (3) had no other lower extremity vascular diseases, (4) had only single lesion in single limb (lesions were limited to femoropopliteal or infrapopliteal, the aorto-iliac diseases were not included), and (5) underwent a standardized interventional procedure, which was completed by 2 senior vascular surgeons. The collected patients were randomly divided into groups at a ratio of 7:3 to establish the primary cohort and validation cohort.
Diagnosis and Treatment
After a detailed medical history and comprehensive physical examination, blood was taken from the patients for coagulation, biochemistry, blood lipid, and other laboratory tests. Other investigations included chest X-ray, computed tomography angiography (CTA), and lower extremity vascular ultrasound. A preoperative diagnosis of LEAD was based on clinical and radiological results.
EVT is performed according to the location, scope, and stenosis of vascular lesions. Patients received a standard procedure; briefly, lower extremity arteriography was used to confirm the lesion, and then the blood vessels of the diseased segment were dilated with different balloon gradients for more than 60 seconds. The diameter and length of the balloon were selected by the vascular surgeon on the basis of angiography of the local lesion. The effect of balloon dilation in the lesion area was observed by angiography again. According to the residual stenosis of the lesion and the presence of flow limiting dissection, the surgeon selected whether a DCB or bare metal stent (BMS) was needed. All patients were given dual antiplatelet therapy (aspirin [100 mg/day] and clopidogrel [75 mg/day]) after the operation. Antiplatelet therapy was carried out for at least 1 month whether in hospital or after discharge.
Follow-Up
Patients were followed up by telephone or through the outpatient service. If ABI < 0.9 or intermittent claudication, resting pain, ulcer, nonhealing wound, or gangrene of the limb on the operation side were found again, an appointment was made for the patient to have the condition of the lower limb observed in our hospital by lower limb ultrasound or CTA. Regular outpatient follow-up patients underwent scheduled lower extremity ultrasound or CTA examinations. Restenosis was defined as the imaging results showing lumen stenosis in the operation area of more than 50%.
Statistical Analysis
The data included demographics, disease conditions, treatment characteristics, serological characteristics, and so on. The counting data are expressed as the median and the measurement data are expressed as the rate (%). Statistical analysis was performed using Rstudio software (version 1.3.1093, https://rstudio.com/).
The least absolute shrinkage and selection operator (LASSO), which can screen variables in high-dimensional data to reduce overfitting of data,14,15 was used to select the best predictive risk factors from the LEAD patients. Then, using Cox regression analysis, the prediction model was established by combining the characteristics selected with LASSO. The concordance index (C index), first proposed in the 1990s, was used to test the prediction model constructed by Cox regression. It showed the prediction efficiency between the prediction results and the observed values by calculating 1000 bootstrap resamples. 16 A calibration curve was also used to evaluate the stability of the model, which could reflect whether the model overestimates or underestimates the corresponding outcome risk. A decision curve was used to obtain the clinical net benefit of the nomogram with different probabilities. 17 This process needs to remove all false-positives from the true-positive patients and balance the consequences of abandoning the intervention with the consequences of an unnecessary intervention. 18 Survival curves were depicted using the Kaplan–Meier method and compared using the log-rank test.
In the above analysis, a 2-sided p<0.05 was considered, statistical significant, and the results of Cox regression were expressed as hazard ratios (HRs) and 95% confidence intervals (CIs).
Results
Patient Characteristics
A total of 263 patients diagnosed with LEAD from January 2018 to December 2019 were retrieved through the medical record system, of which 36 were hospitalized twice or had undergone relevant surgery in an external hospital, and 27 did not undergo intraluminal treatment. The records of 5 patients were incomplete, 14 patients were lost during follow-up, and 13 patients died (5 diabetes, 3 lung cancer, 3 kidney disease, 1 cardiovascular accident, and 1 traffic accident). Finally, a total of 181 patients and 181 diseased limbs were selected. The average follow-up time of the selected patients was 15.6 ± 7.9 months. Patients were randomly divided into a primary cohort and validation cohort at a ratio of 7:3. Table 1 gives the detailed data of the 2 groups of patients, including demographics, treatment characteristics, and serological indicators.
Demographics and Clinical Features of Patients With Lower Extremity Arterial Disease.

Abbreviations: ABI, ankle brachial index; APOA, apolipoprotein A; APOB, apolipoprotein B; APOE, apolipoprotein E; APTT, activated partial thromboplastin time; CHO1, cholesterol; D-D, D-Dimer; FDP, fibrin degradation products; FIB, fibrinogen; HCT, hematocrit; HDL, high-density lipoprotein; INR, international normalized ratio; K, potassium; LDL, low density lipoprotein; MONO, monocyte; Na, sodium; NEUT, neutrophil; PLT, platelet; RBC, red blood cell; TG, triglyceride; TT, thrombin time; WBC, white blood cell.
Feature Selection
All of the demographic characteristics, treatment methods of diseases, and serological indicators taken together resulted in 39 variables, which were simplified into 11 potential predictors after screening by LASSO regression. Optimal parameter (lambda) selection in the lasso model with the 1-SE criteria (dotted vertical lines, Figure 1A). A coefficient profile plot was produced against the log (lambda) sequence. Vertical line was drawn at the value selected, where optimal lambda resulted in 11 features with nonzero coefficients (Figure 1B).

Demographic and clinical features selection by the LASSO regression model. (A) The optimal parameter (lambda) in lasso model adopts 5 times cross validation and passes the minimum standard. The partial likelihood deviance curve of binomial deviance and log (lambda) was plotted. The dotted line indicates the range of the best value through the minimum standard and 1 standard error (SE) of the minimum standard (1- SE). (B) LASSO coefficient of 39 features. Five-fold cross validation was used to draw the relevant vertical lines. The best lambda results showed that 11 features had nonzero coefficients.
The variables selected by LASSO regression were lesion site, postoperative use of antiplatelet drugs, smoking, application of drug coating technology, calcification, coronary heart disease, percentage of erythrocytes, monocytes, international normalized ratio (INR), and apolipoprotein E (Table 2).
Multivariate Analysis of the Primary Cohort.

Abbreviations: APOE, apolipoprotein E; CI, confidence interval; HR, hazard ratio; INR, international normalized ratio; MONO, monocyte; RBC, red blood cell.
Development of the Prediction Model
Features selected from the lasso-penalized regression analysis were performed with the COX multivariate regression. The 6 factors of lesion site, postoperative antiplatelet drugs, calcification, coronary heart disease, drug coating technology, and INR were independent risk factors for restenosis (Table 2) (p<0.05). We then developed an individualized nomogram incorporating 6 significant factors based on the COX multivariate regression analysis (Figure 2).

Developed nomogram of primary patency after lower extremity arterial disease (LEAD). A nomogram of restenosis was developed in the primary cohort, with the lesion site, the postoperative antiplatelet drugs, the calcification, the coronary heart disease, the drug coating technology and INR incorporated. Abbreviation: INR, international normalized ratio.
Evaluation of the Nomogram
The nomogram was judged by the C index and calibration curve. The calibration curve of the nomogram for predicting the 1-year patency of patients with LEAD after intracavitary treatment showed good consistency in the primary cohort (Figure 3A). The calculated C index of the model was 0.762 (95% CI: 0.691–0.823). Through the internal verification method, we used the verification cohort of the same data source for model verification, calculated the C index of the verification cohort and drew the calibration curve. The C index of the validation cohort was 0.864 (95% CI: 0.801–0.927), and the calibration curve is shown in Figure 3B. These results demonstrate that the nomogram has good predictability, and the calibration curve shows that the predicted value of the model is in good agreement with the real value.
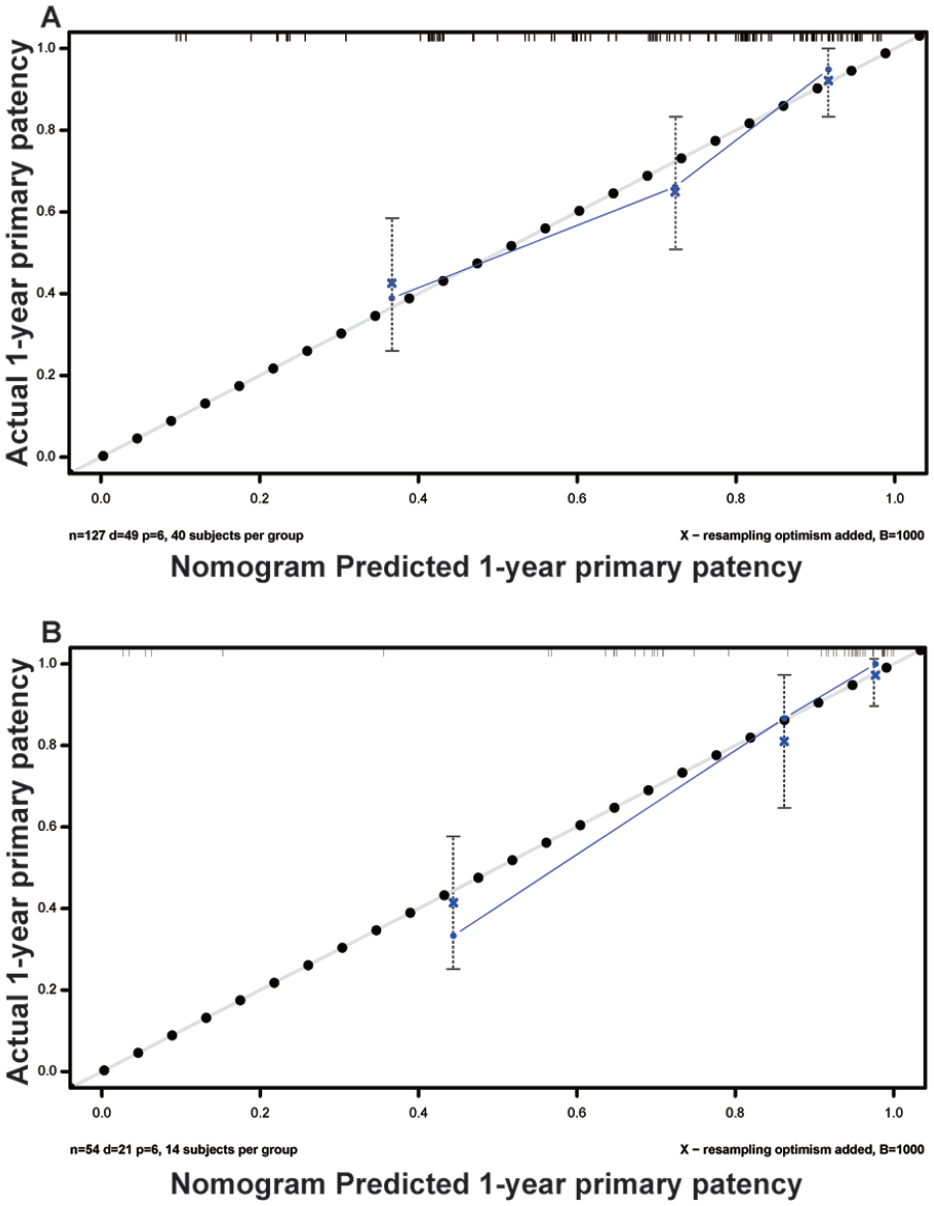
Calibration curve of the nomogram for predicting 1-year primary patency in (A) primary cohort and (B) validation cohort. The nomogram-predicted primary patency is plotted on the x-axis, and the actual primary patency is plotted on the y-axis. The dotted diagonal line represents the perfect prediction of the model, and the solid blue line represents the prediction of the nomogram.
Clinical Use
We plotted the decision curve analysis (DCA) for the nomogram in this study to evaluate its clinical use (Figure 4). Our DCA is mainly concentrated in the upper right of the 2 baselines, indicating that its clinical benefit is obvious. When the threshold probability was greater than 2.5%, patients benefited significantly from the nomogram, and the maximum benefit rate was 30.9%.
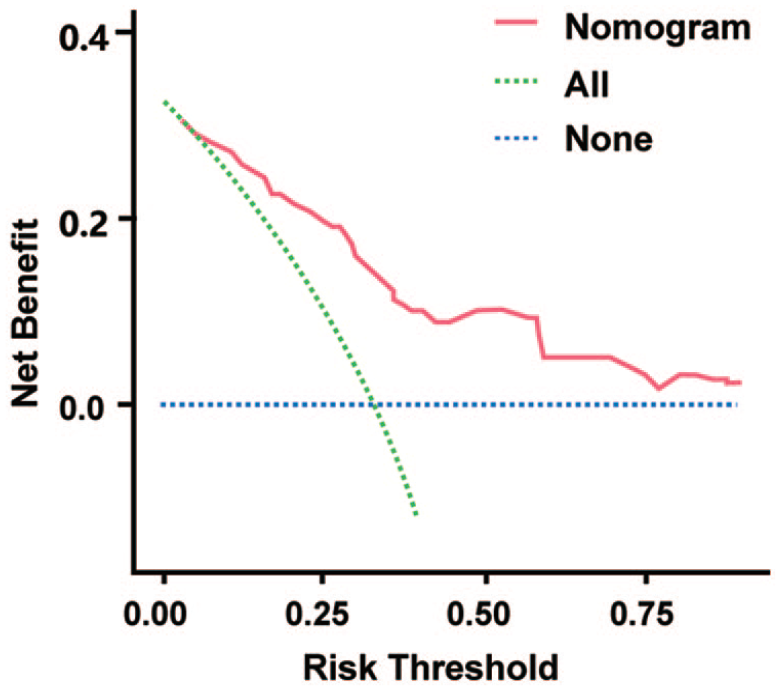
Decision curve analysis for the primary patency nomogram. The y-axis is the net benefit, and the xaxis is the threshold probability. The green dotted line indicates the hypothesis of primary patency in all patients, and the blue dotted line indicates the hypothesis of no primary patency in patients. Decision curve analysis showed that when the threshold probability was > 2.5%, using the nomogram of this study to predict primary patency increased more benefits than the scheme with and without patient intervention, and the maximum net benefit was 30.9%.
Kaplan-Meier Survival Analysis
To judge the performance of the prediction model in patients with different disease grades, the patients in the primary cohort were scored according to the score of each risk factor in the nomogram. After the final score was summarized, it was stratified by X-tile, and the critical value of grouping according to the different scores was determined. The results were divided into 3 groups, including low-risk group (score < 151), medium-risk group (score 151–213), and high-risk group (score≥213). Kaplan–Meier survival analysis showed that there was a significant difference in the primary patency rate among the low-risk, medium-risk, and high-risk groups (log rank p<0.001) in the primary cohort (Figure 5A). A similar conclusion was reached for the validation cohort (log rank p<0.001) (Figure 5B).
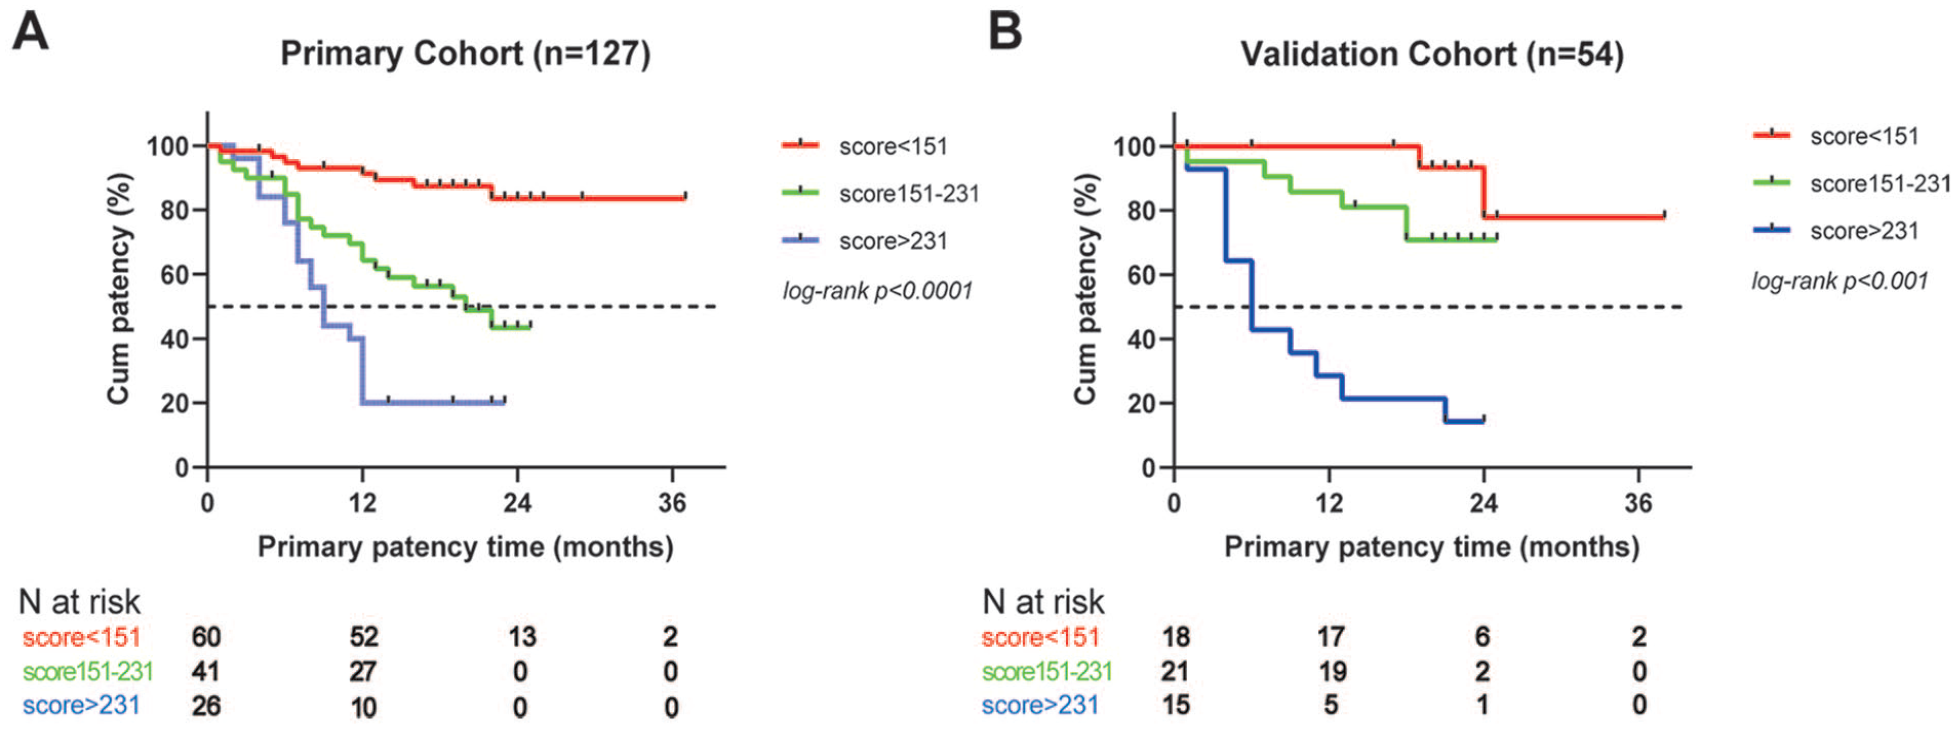
Kaplan-Meier curves of primary patency from (A) the primary cohort and (B) the validation cohort classified according to different scores of the nomogram. 80mm x 29 mm (300 x 300 DPI).
Discussion
Nomograms are widely used in tumor diseases to judge prognosis and postoperative recurrence, as this form is able to evaluate individualized risk according to patients and disease characteristics. In addition, nomograms provide a more accurate and simple understanding of prognosis through a friendly visual interface to assist in better clinical decision making.19–22 In our study, 6 characteristics, including lesion site, postoperative antiplatelet drugs, calcification, coronary heart disease, drug coating technology, and INR, were found to predict restenosis. Moreover, the nomogram based on these independent factors was developed and validated, which could provide a relatively accurate prediction tool for patients with LEAD after interventional surgery. Besides, visually and prospectively informing patients of the benefits of risk factor control may increase patients’ understanding, which is essential to reduce the occurrence of restenosis after EVT.
Restenosis after EVT is the main reason limiting the therapeutic effect. In cardiovascular, Kastrati A’s research shows vessel size and DES type are the most important predictors of angiographic and clinical restenosis after percutaneous coronary interventions (PCI). 23 Another publication demonstrates that diabetes mellitus, placement of multiple stents and minimal lumen diameter immediately after stenting were independent predictors of restenosis. 24 The recent study conducted a retrospective analysis of 398 patients with coronary heart disease undergoing PCI with sirolimus-eluting stent (SES) found that age, hypertension, diabetes mellitus, low-density lipoprotein cholesterol (LDL-C), high-sensitivity C-reactive protein (HsCRP), and target lesion at left circumflex artery (LCX) were independent predictive factors for raised restenosis risk. 25 In lower extremity arteries, Japanese research indicates that consistent predictors of restenosis were vessel diameter and severe frailty in the polymer-coated paclitaxel-eluting stents group and calcification, postdissection pattern, and vessel diameter in the DCB group. 26 Due to the complexity of patients and candidate variables, individual predictors in different studies may be inconsistent. Similar to previous studies, our study also indicates that lesion site, and calcification, are predictors of restenosis after EVT.
The femoral popliteal artery undergoes complex mechanical deformation during limb flexion and extension, which is one of the reasons for the high rate of restenosis after EVT. 27 Due to the relatively small diameter and low arterial pressure of the blood vessels in the lower part of the knee, the degree of stenosis is more severe than that in the upper part of the knee, and the inflow and outflow channels of local blood vessels can be damaged at the same time. Therefore, the primary patency rate is low, and the amputation rate and the disability rate are high.28,29 Coronary heart disease and calcification will increase the probability of restenosis, which may be related to the deposition of lipids and calcium salts in the vascular wall,30,31 and may also be related to the proliferation of smooth muscle cells. 32 Campo et al 33 compared the prognosis of patients receiving antiplatelet drugs in the long term (24 months) and short term (6 months), and found that patients receiving ISR revascularization may benefit from long-term administration of aspirin plus clopidogrel. Many studies34–36 have shown that using antiplatelet drugs after EVT can significantly improve the primary patency rate after the operation, which is consistent with our research. As for drug coating technology, a large number of literatures4,37–39 have reported that DCB and DES can significantly reduce the revascularization of patients compared with percutaneous transluminal angioplasty. However, the superiority between DCB and DES remains controversial.
Our study found that patients with increased INR had an increased risk of restenosis after EVT, which had not been reported consistently in the literature. International normalized ratio, as a preoperative evaluation item of surgical bleeding, is an indicator of prothrombin time. Tamim et al 40 showed that preoperative INR is significantly and independently associated with postoperative major bleeding and mortality. Another research indicated that INR remains an excellent predictor of postoperative mortality and bleeding after both open and laparoscopic cholecystectomies. 41 More evidences42,43 support that vascular inflammation is a key factor in the restenotic process. We hypothesize that there is an association between the preoperative INR and restenosis, which may be due to damage to the intima during EVT. If intimal injury causes bleeding and then it progresses to local inflammation, the inflammatory cells will act on the damaged site in the lumen, and the inflammatory damaged area can exist for a long time. As our study is a retrospective study, the patient’s medical record information does not include postoperative INR and inflammation indicators, so it is impossible to judge the occurrence of postoperative inflammation. Therefore, this hypothesis is still controversial, and more research is needed to verify the validity of this hypothesis in the future.
Identifying and analyzing risk factors is essential for making appropriate clinical decisions to prevent restenosis. A nomogram based on a large number of clinical data can quantify the risk of amputation in patients with diabetic foot ulcer. 44 More, the individualized prediction nomogram incorporating risk characteristics for patients undergoing PCI can be conveniently used to facilitate early identification and improved screening of patients at higher risk of ISR. 45 Besides, Zhao et al 13 developed a nomogram for evaluating the incident risk of moderate-to-severe LEAD in adults with type 2 diabetes. We analyzed the primary patency rate of patients in the dataset according to the scores converted by nomograms. The results showed significant differences between patients with postoperative restenosis under different score groups. Clinicians can grade patients after surgery according to the scores of the nomograms and apply intervention measures of different intensities for people at different risk levels. During the follow-up process, an individualized follow-up plan can be further formulated according to the risk classification. It is challenging to predict restenosis in individual patients accurately.
Limitations
There are still several limitations in our research. First, as a retrospective study, we collected as much data as possible, but we were still limited by the potential bias caused by a single center and small sample size. For example, the serological indices of patients are their baseline at admission, and there is a lack of postoperative serological indices for comparison, especially INR indices. Second, considering the influence of lesion location, we selected patients whose lesions were limited to 1 place (femoropopliteal or infrapopliteal). However, patients with LEAD in the real world often do not have simple single lesions, and patients can have above and below-the-knee lesions simultaneously, which means our model has some limitations in clinical applications. Therefore, there is still a certain gap between the conclusion of this study and the actual clinical situation. Third, although the robustness of the nomogram was examined extensively by internal validation, external validation could not be implemented, and the applicability was uncertain in other regions and countries. It needs to be evaluated in broader LEAD populations.
Conclusion
This study developed a nomogram to predict patency after endovascular treatment in LEAD patients through retrospective analysis. By estimating individual risk, clinicians and patients can take more measures on medical interventions and disease monitoring. The nomogram requires external validation to determine the model’s applicability, and further research is needed to demonstrate whether interventions based on the nomogram can reduce postoperative restenosis.
Footnotes
Acknowledgements
The authors gratefully acknowledge the colleagues in the Department of Vascular Surgery.
Declaration of Conflicting Interests
The author(s) declared no potential conflicts of interest with respect to the research, authorship, and/or publication of this article.
Funding
The author(s) disclosed receipt of the following financial support for the research, authorship, and/or publication of this article: This work was supported by the Key Research and Development Program of Shaanxi (No: 2021SF-136).
