
Abstract
Introduction
Medication errors, adverse events, and nonadherence in organ transplant recipients are common and can lead to suboptimal outcomes. A medication safety dashboard was developed to identify issues in medication therapy.
Research Questions
Can a multicenter bioinformatics dashboard accurately identify clinically relevant medication safety issues in US military Veteran transplant recipients?
Design
The dashboard was tested through a 24-month, prospective, cluster-randomized controlled multicenter study. Pharmacists used the dashboard to identify and address potential medication safety issues, which was compared with usual care.
Results
Across the 10 sites (5 control sites and 5 intervention sites), 2012 patients were enrolled (1197 intervention vs 831 control). The mean age was 65 (10) years, 95% male, and 27% Black. The dashboard produced 18 132 alerts at a rate of 0.61(0.32) alerts per patient-month, ranging from 0.44 to 0.72 across the 5 intervention sites. Lab-based issues were most common (83.4%), followed by nonadherence (9.4%) and transitions in care (6.4%); 56% of alerts were addressed, taking an average of 43 (29) days. Common responses to alerts included those already resolved by another provider (N = 4431, 44%), the alert not clinically relevant (N = 3131, 31%), scheduling of follow-up labs (N = 591, 6%), and providing medication reconciliation/education (N = 99, 1%). Inaccurate flags significantly decreased over the study by a mean of −0.6% per month (95% CI −0.1 to −1.0; P = .0265), starting at 13.4% and ending at 2.6%.
Conclusion
This multicenter cluster-randomized controlled trial demonstrated that a medication safety dashboard was feasibly deployable across the VA healthcare system, creating valid alerts.
Introduction
Over the past 40 years, significant advances in immunosuppressant medications and regimens used in organ transplantation have led to substantial reductions in one-year acute rejection rates.1‐5 As a result, one-year acute rejection rates have dropped from an average of 30% to 40% in the 1980s to current rates of < 10%.1‐5 Although long-term graft and patient survival have also improved, they have not kept pace with the reductions demonstrated for one-year outcomes. 6
Advances in immunosuppression have also led to unintended consequences that likely contribute to suboptimal long-term outcomes. 7 These include increased complexities in immunosuppression regimens and more intense monitoring leading to numerous titrations in doses and regimen alterations. 8 The resulting consequences are more medication errors and safety events leading to emergency department (ED) visits and hospitalizations.9‐11 Potent immunosuppressant regimens also induce more potential toxicities, including increased infections and cardiometabolic adverse events that can lead to graft loss and death. 7 Improvements in the monitoring and management of transplant recipients receiving these efficacious but complex and potentially toxic regimens are needed if optimal long-term outcomes are to be realized.
Pharmacists play an important role in helping to monitor and manage recipients as most meet the definition of polypharmacy. Therefore, transplant recipients are at high risk of medication errors, safety events, and adverse drug reactions. The current transplant pharmacist workforce is not able to provide one-on-one medication therapy management (MTM) for all transplant recipients.12‐14 Solutions are needed to help improve the monitoring and triaging of issues with immunosuppression regimens in transplant recipients. One such solution, a transplant-population monitoring dashboard, was developed and implemented across several Veterans Affairs (VA) health systems, demonstrating improved monitoring of immunosuppression regimens. 15 As part of a follow-up grant, this system's functionality was expanded and tested in a multicenter, randomized clinical trial. 16 This analysis sought to address if a multicenter bioinformatics dashboard was able to accurately identify potential medication safety issues in Veteran transplant recipients. This was assessed by measuring the number and type of medication-related alerts identified by pharmacists and assessed the use of the dashboard by measuring the percent of alerts addressed by pharmacists, the time to addressing the alert, and actions taken to address the alert.
Methods
Study Design
The full methodology used in this study has been previously published elsewhere. 16 In brief, this was a 24-month, multicenter, prospective, cluster-randomized, parallel-arm, pragmatic clinical trial (NCT03860818) entitled, “Improving Transplant Medication Safety Through a Technology and Pharmacist Intervention (ISTEP).” The study was reviewed and approved by the VA central institutional review board (cIRB). Informed written consent was obtained from the participating pharmacists at each study site. The cIRB waived transplant recipient-level written consent, allowing only verbal consent to participate in the study when contacted by study pharmacists.
Setting
The selected study sites included 10 VA healthcare systems across the United States. Participating pharmacists had a variety of primary practice sites, including intensive care, primary care, and transplant specialists. Each of the 10 participating VA medical center sites was randomized through computerized random number generation to standard care or standard care plus the technology-enabled intervention, stratified by estimated transplant patient volume (< 100 vs ≥ 100) to ensure an approximately equal number of patients per arm.
Population
The study was not approved to collect data on all VA transplant recipients and thus no data were available for the entire VA transplant population.
Sampling
Veteran solid organ transplant recipients were identified using the International Classification of Diseases (ICD), 9th and 10th revision codes from the VA electronic health record. To be included, patients must have had an active code stating they are recipients of a solid organ transplant and receiving at least one antirejection medication dispensed by the VA. At the transplant recipient level, all patients were included that met the criteria, and sampling did not occur beyond selecting the 10 sites. At the pharmacist level, sampling occurred by soliciting voluntary participation from VA-employed ambulatory clinical pharmacy specialists. Solicitation occurred through the use of email listservs and through direct communication through secondary referral.
Data Collection
Dashboard functionality was assessed by measuring the alert numbers, alert relevance, time to resolve alerts, and the actions taken regarding to the alert and the intervention magnitude. Alert and intervention information was entered by intervention pharmacists into the dashboard and then queried to produce the results. The number of potential immunosuppression safety issues that occurred was also assessed and compared between the 2 study arms (intervention sites vs control sites).
For the dashboard, data were collected through nightly updated data feeds from the VA corporate data warehouse (CDW) that stores all electronic medical record data from the VA system. From these data, queries were created based on criteria outlined in Supplemental Table 1 . Lab trajectories refer to the change in the lab from the previous value to the most recent value (slope). To assess the dashboard functionality and usability, alert numbers, types, and pharmacist actions were captured electronically directly from the bioinformatics dashboard.
Outcomes
Secondary outcomes of the clinical trial are presented in this manuscript, which include the dashboard functionality and usability. These were assessed by measuring the number and types of alerts produced, the rates alerts were addressed by study pharmacists, as well as the time taken to address alerts and actions documented from the alerts. The final secondary outcome was to determine if there were any significant predictors of dashboard use. Primary outcomes are yet to be assessed.
Data Analysis
Standard descriptive statistics were used to display results for baseline demographics and transplant characteristics and related to dashboard functionality and utilization. These include using mean with standard deviations (SD) for normally distributed continuous data, median with interquartile range [IQR] for nonnormal continuous data or ordinal data, and proportions (percentages) for categorical data; 95% confidence intervals (CI) are also used, where applicable. Univariate regression was used to assess trends in measures (alerts, alert types, addressed alerts) over time, accounting for potential time correlation using lag analyses. This was done using stepwise autoregression, setting the number of potential lags at 12, and using backward elimination with the Durbin-Watson statistic (P < .05) to determine if lag variables should be included in the final models. Multivariable logistic regression was used to determine predictors of dashboard use. All statistical comparisons were performed using SAS version 9.4 (SAS Institute, Cary, NC).
Dashboard Description, Training, and Intervention
The dashboard system was developed to track solid organ transplant recipients’ medications and laboratory results to facilitate pharmacist monitoring and medication therapy management. The dashboard system performed population-level surveillance of solid organ transplant recipients and identified those with potential drug-related problems. The system created the following alert types: immunosuppressant nonadherence through the tracking of refill activity and expiring medications; missing laboratory tests (not checked in 6-12 months, depending on the laboratory value and the specific immunosuppressants the patient is receiving); laboratory value trajectories and thresholds that are abnormal; recent ED visit or hospitalization; and potentially concerning drug-drug interactions. For laboratory values, the system assesses both absolute thresholds and trajectories (changes in values over time). One unique feature of this system is that external labs can be tracked by the system through manual entry of the labs conducted by site pharmacists using a VA system called Health Factors.
All intervention pharmacists completed an intense, face-to-face, 2-day training session on the components of the dashboard, how to use the system, and potential actions to take based on alert types. This included background training in solid organ transplantation and a detailed review of the standard operating procedure manual for the dashboard system. Sites randomized to the control carried on normal, usual care activities. Data for dashboard functionality were collected at control sites, but the pharmacists at these sites could not view or use the dashboard (control sites had the dashboard running in the background but were not visible to pharmacists).
The sites randomized to the intervention arm continued to use the current standard of care procedures at their respective sites while also highly encouraged to use the dashboard system to identify recipients with potential medication safety issues. The pharmacists were asked to review the dashboard at least several times per week and address alerts by determining their accuracy, clinical relevance, and whether the pharmacist or another provider had already addressed the alert. When necessary, the pharmacist would contact the patient and if applicable, providers, to order additional laboratory tests, acquire more data from outside systems, and/or adjust medications (ie, MTM).
Results
Study Transplant Recipients and Characteristics
Over the course of the 27-month study (planned 24-month, with a 3-month addition due to a COVID-19-induced hiatus), 2012 patients were identified and included in the study.
Baseline Demographics and Characteristics Compared by Intervention and Control Sites.
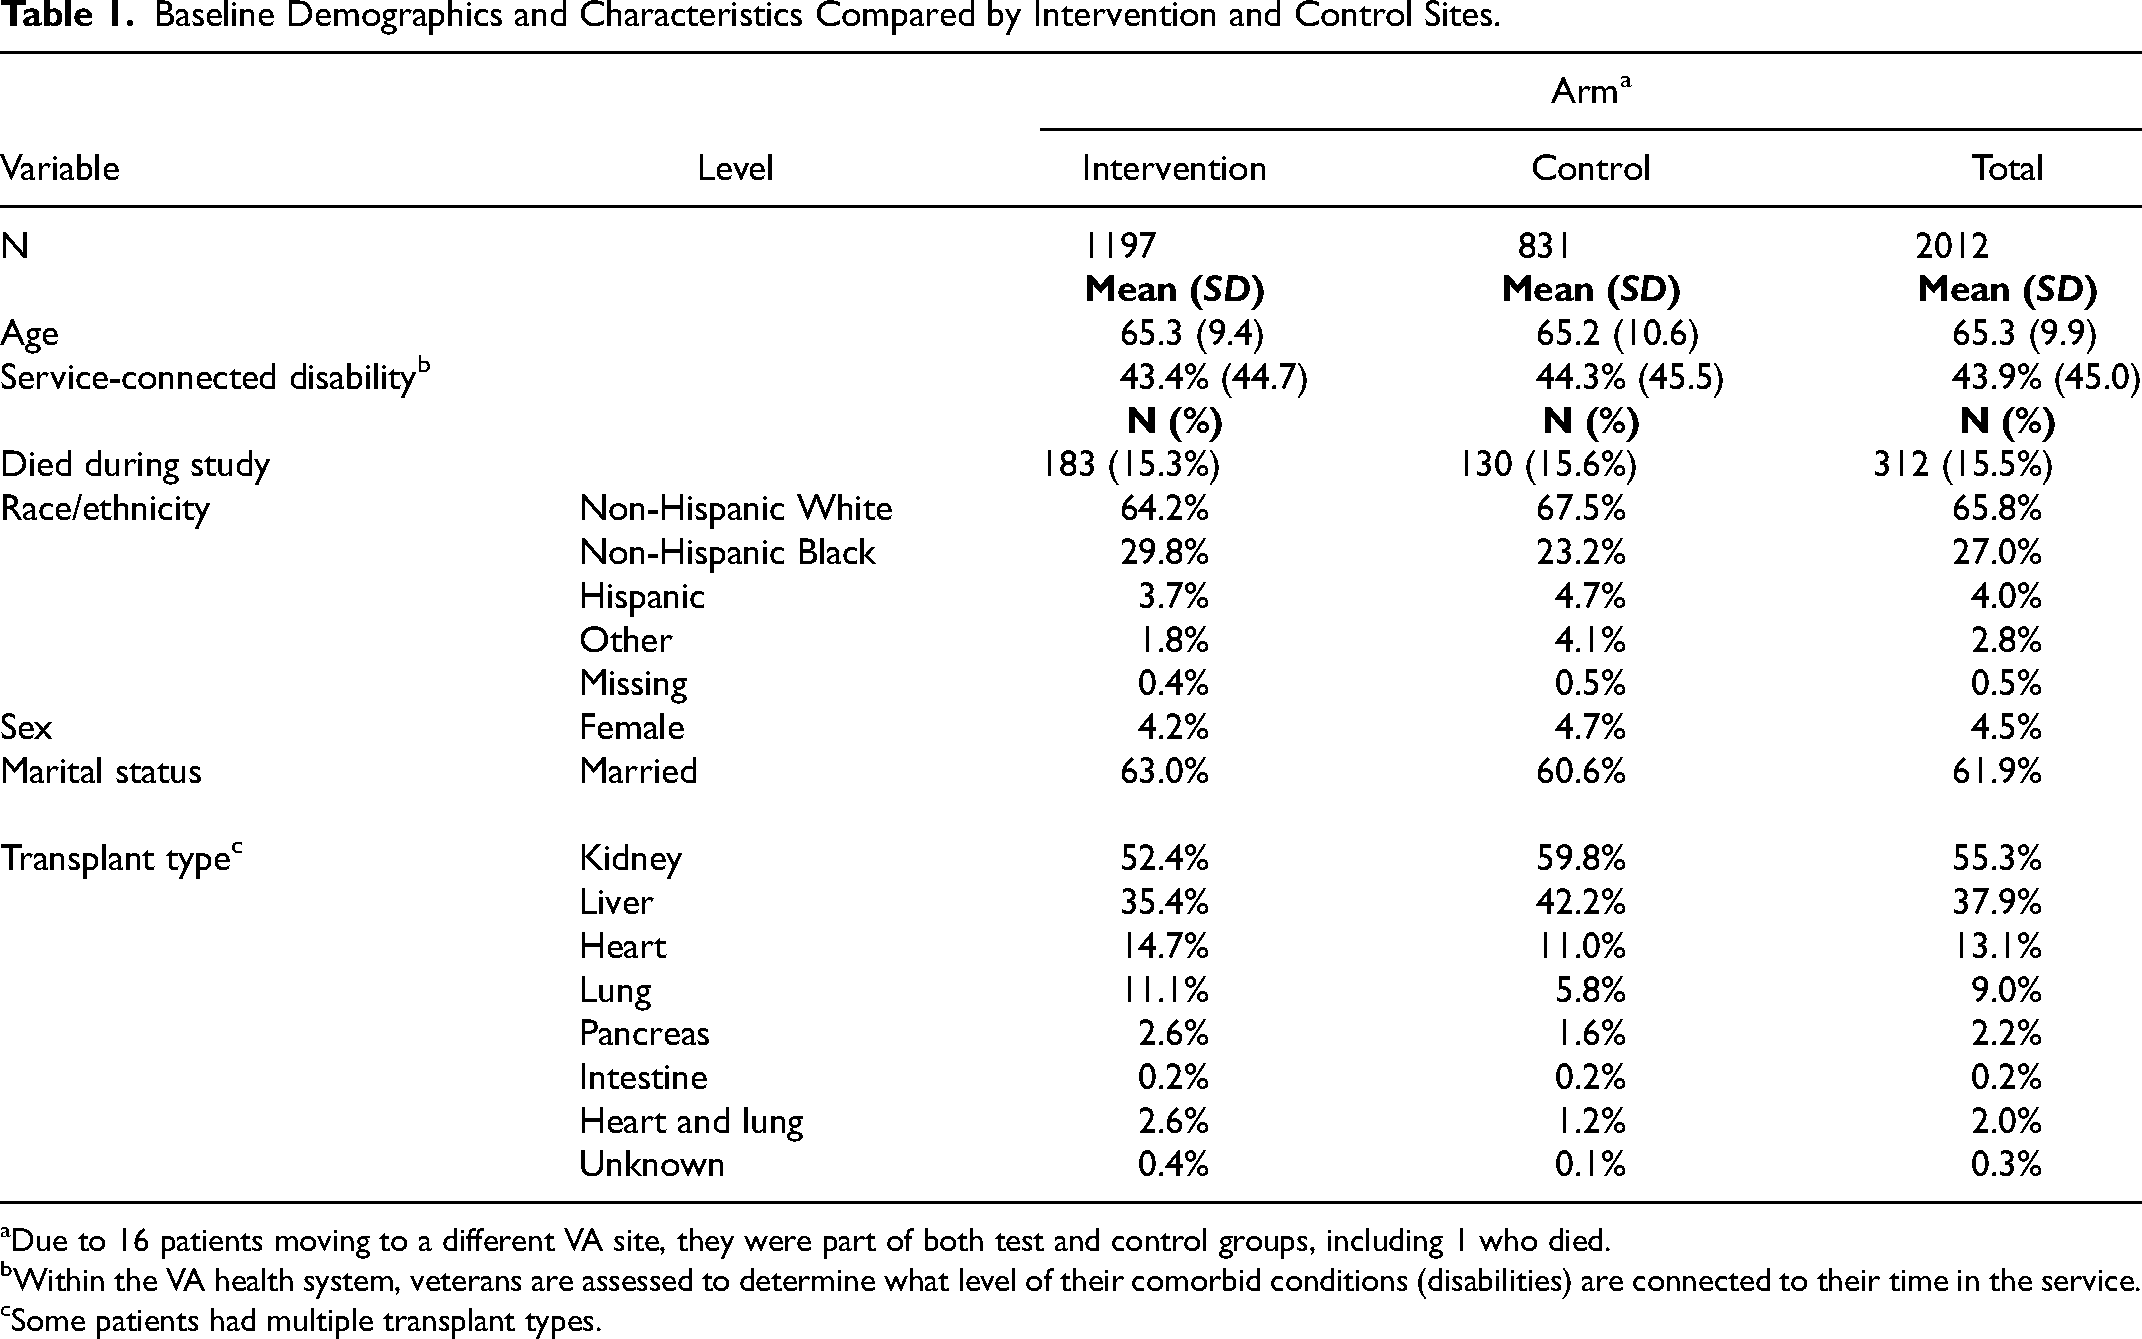
Due to 16 patients moving to a different VA site, they were part of both test and control groups, including 1 who died.
Within the VA health system, veterans are assessed to determine what level of their comorbid conditions (disabilities) are connected to their time in the service.
Some patients had multiple transplant types.
Number and Type of Medication Safety Alerts
Between August 2019 and June 2021, there were 18 131 alerts produced at the 5 intervention sites. Alert numbers ranged from 1971 to 5098, which correlated with the size of the transplant patient population, such that normalized alert rates were fairly consistent across the 5 sites, ranging from 0.44 to 0.72 alerts per patient-month, with an overall mean of 0.61 (0.32). Monthly alert rates for the study period are displayed in
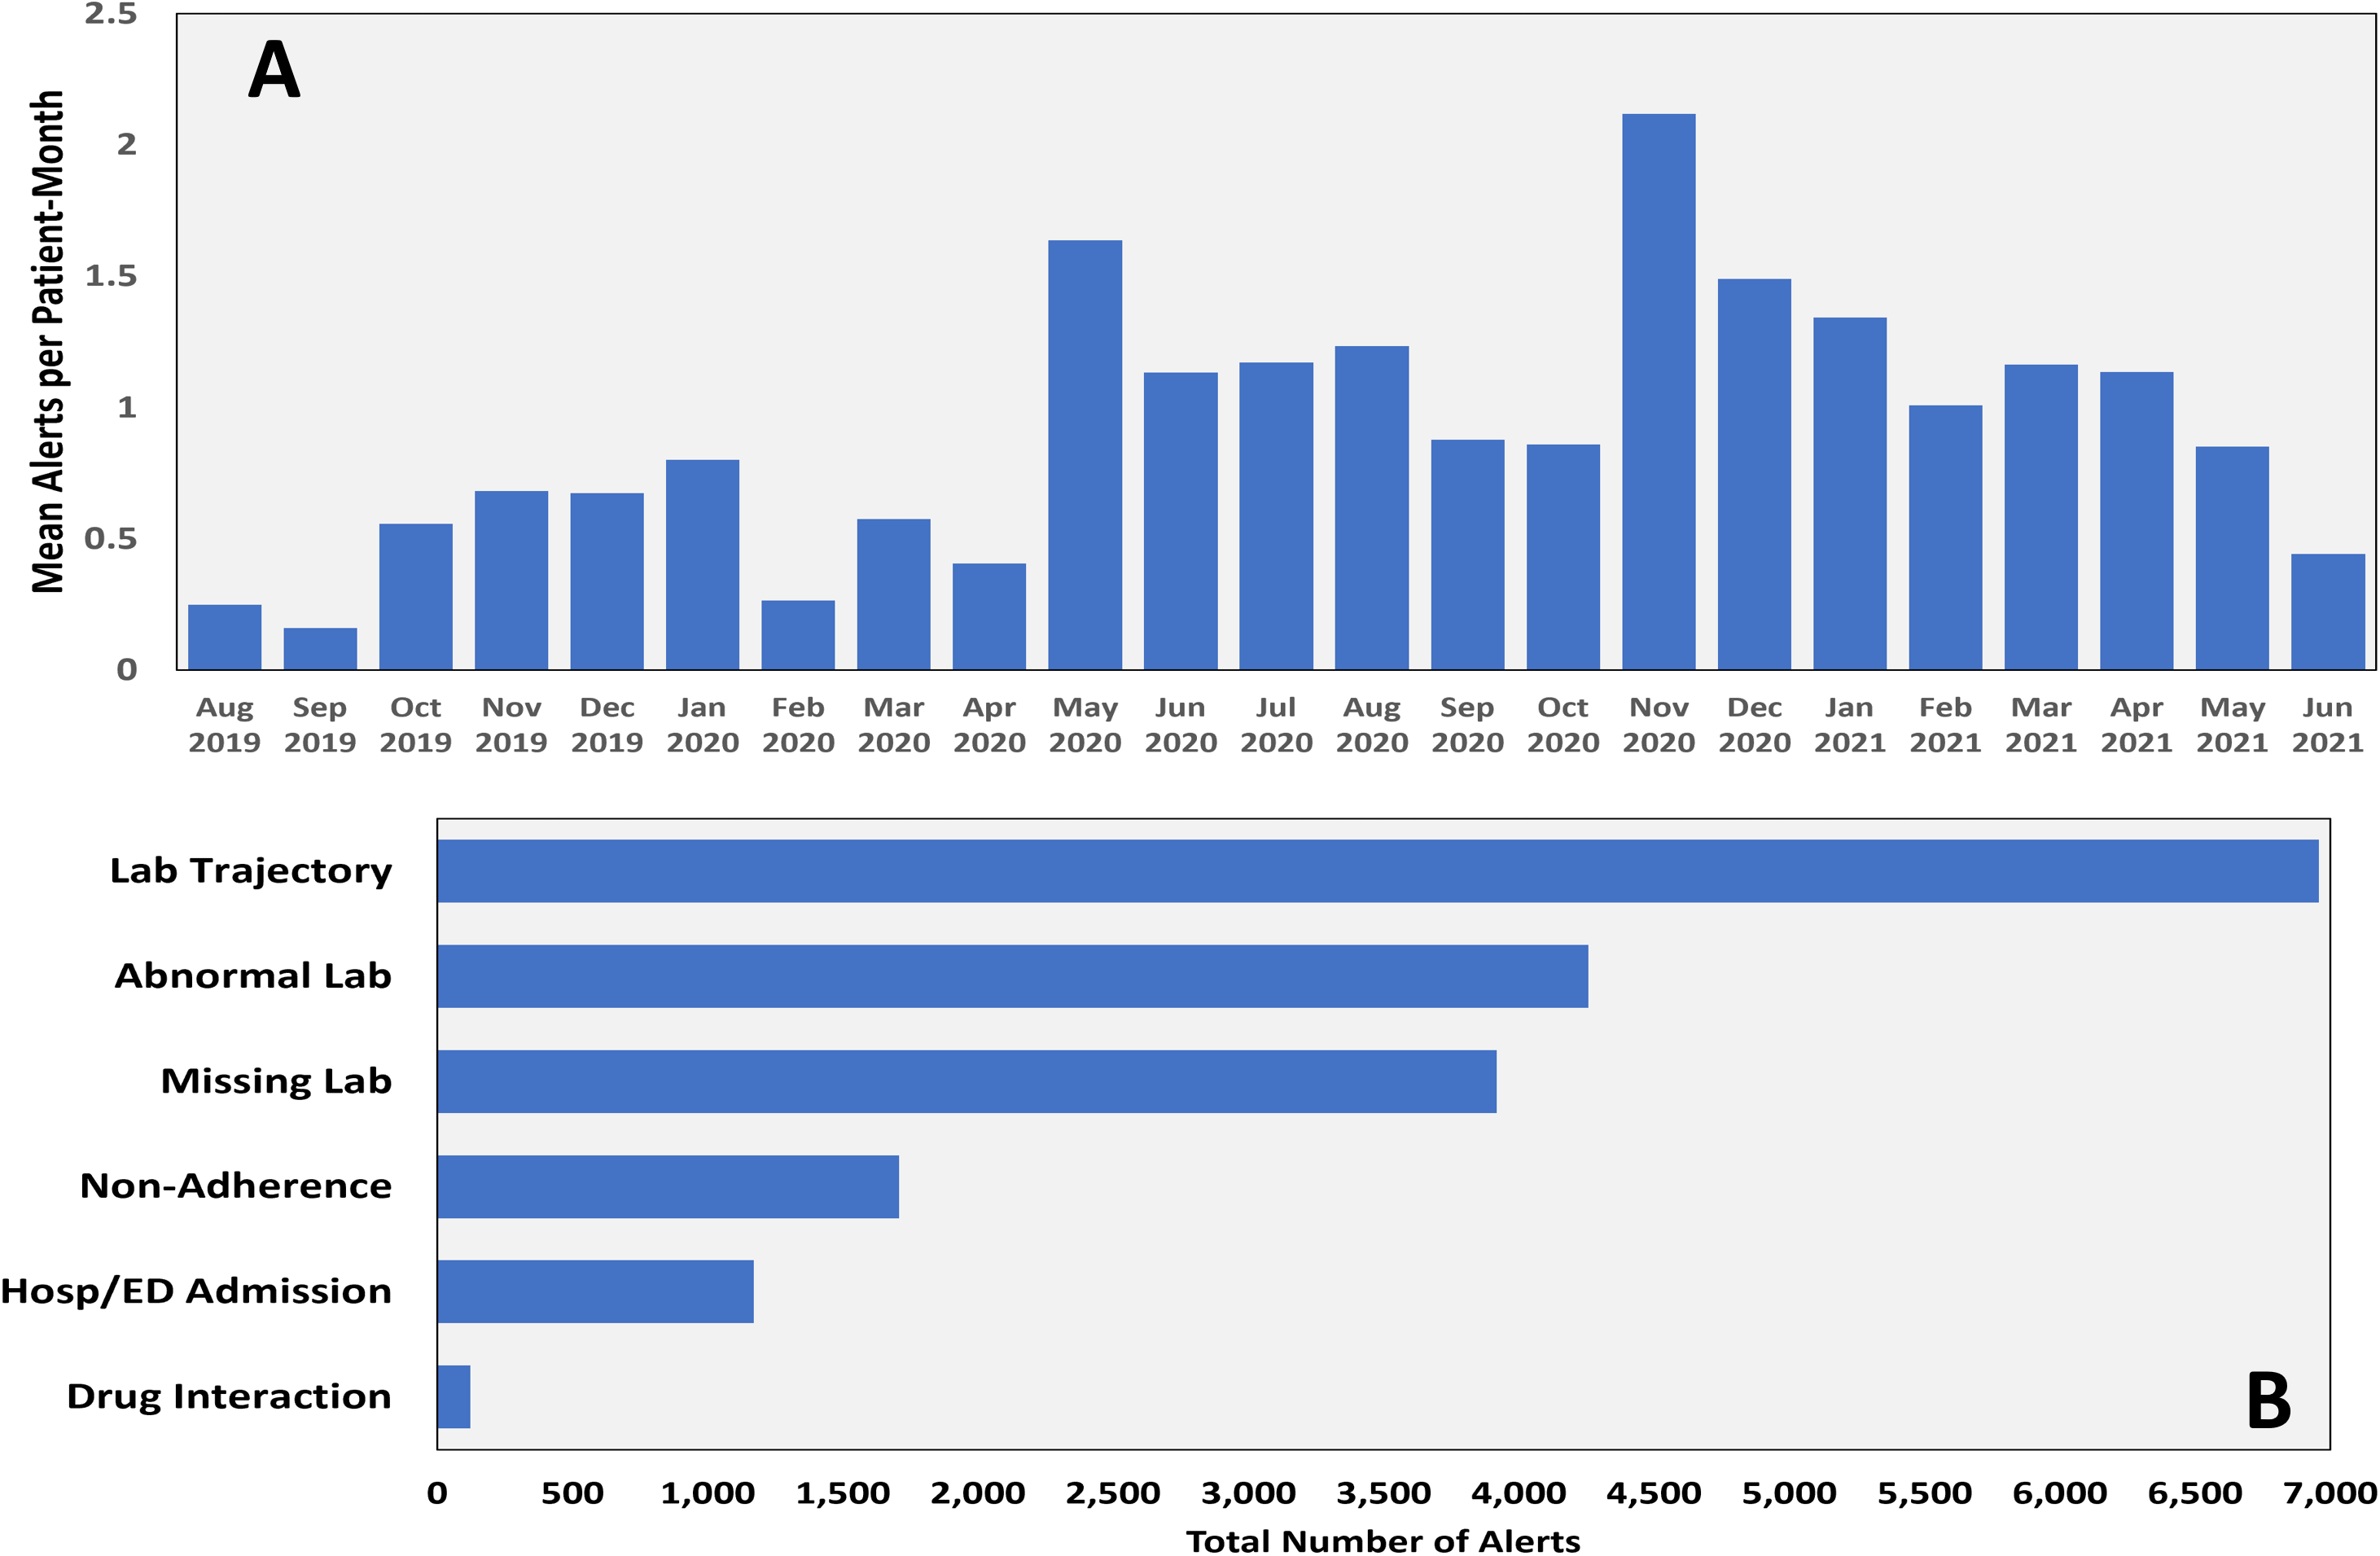
The mean number of alerts per month (A) and type of alert (B).
Alert types are displayed in
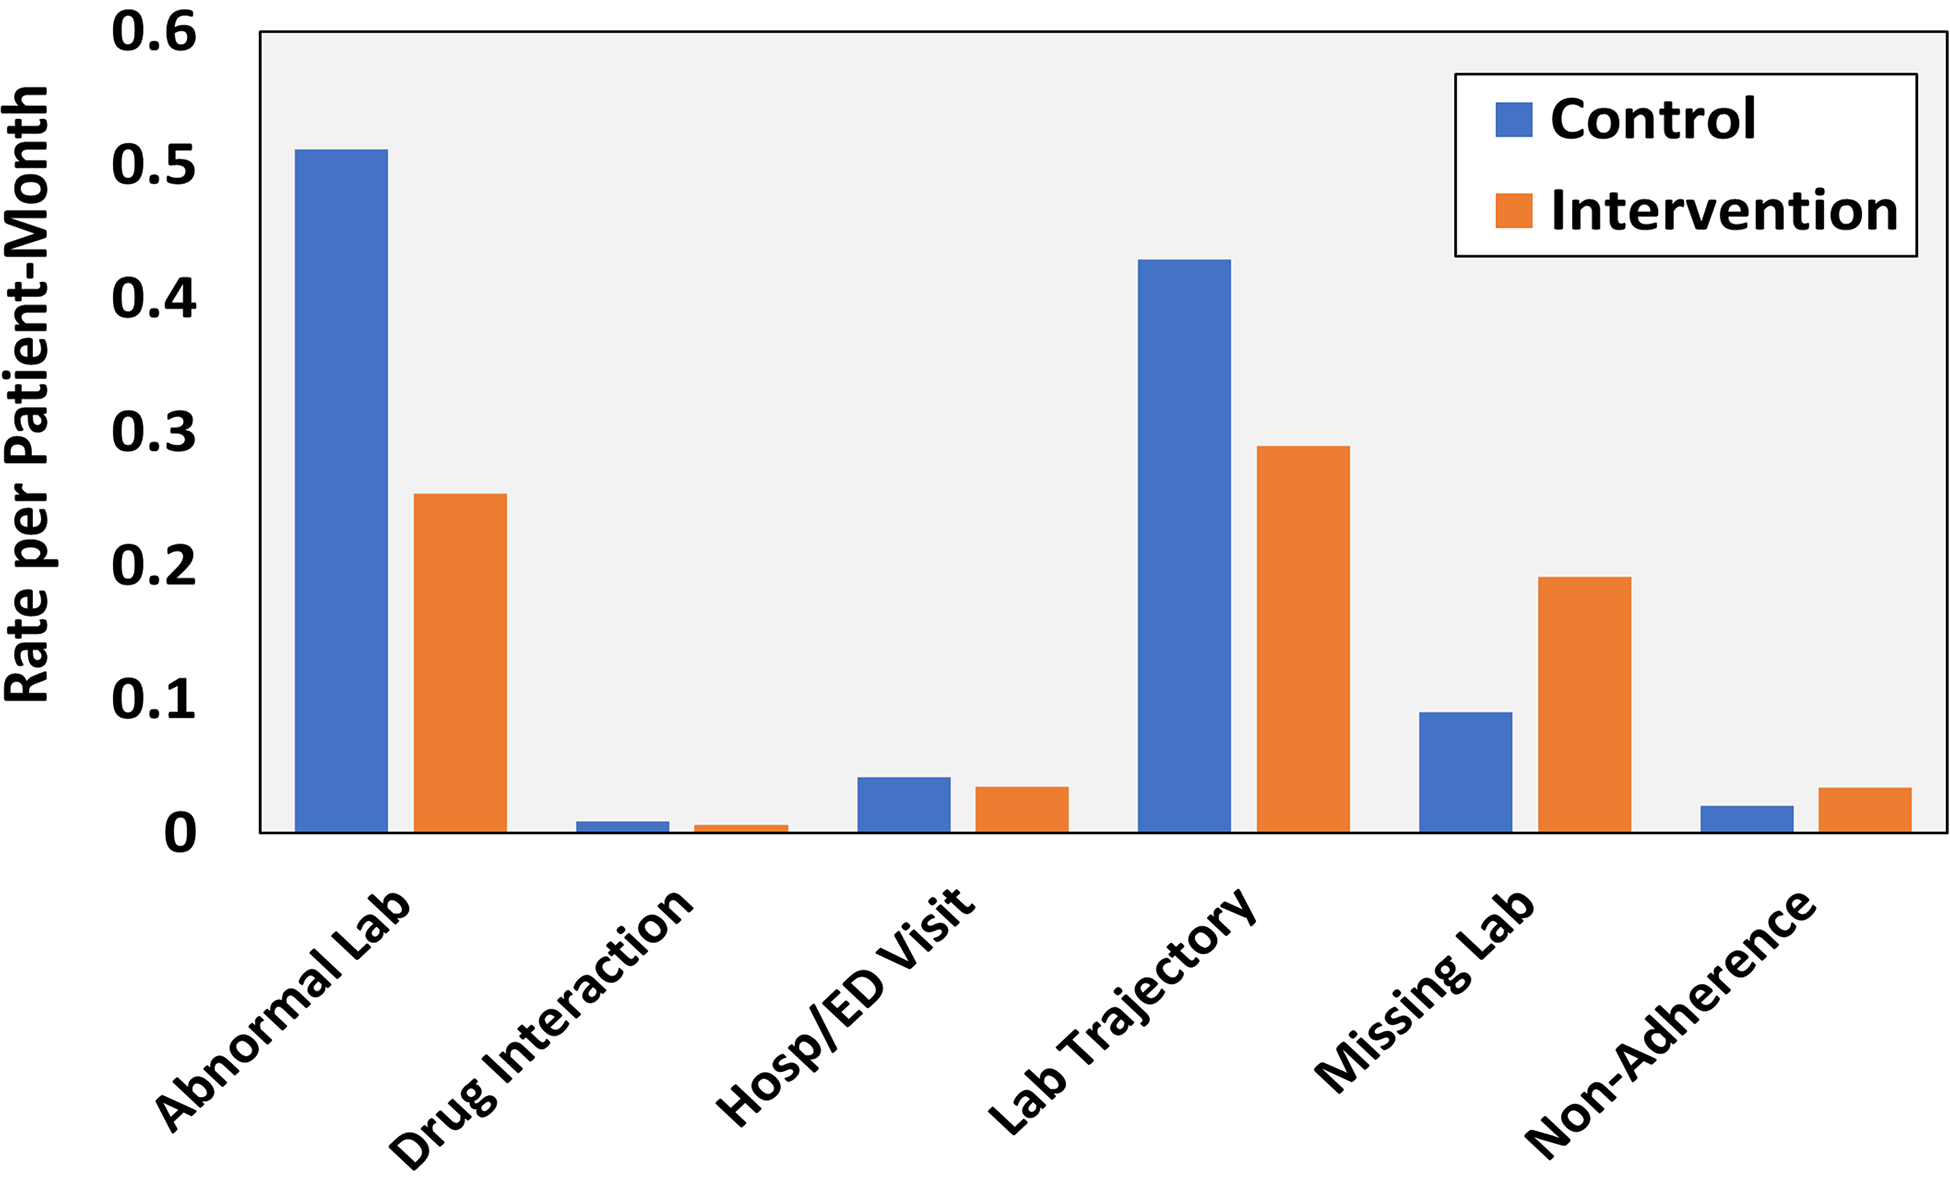
Alert rates are categorized by type between control and intervention sites.
Pharmacist Use of Dashboard
Given the pragmatic design of this study, the use of the dashboard at intervention sites was encouraged but not required; there was no protected time or funding provided to view or address dashboard alerts by pharmacists. Over the course of the study, intervention pharmacists documented 10 128 actions in response to the 18 131 alerts (55.9% of alerts addressed,
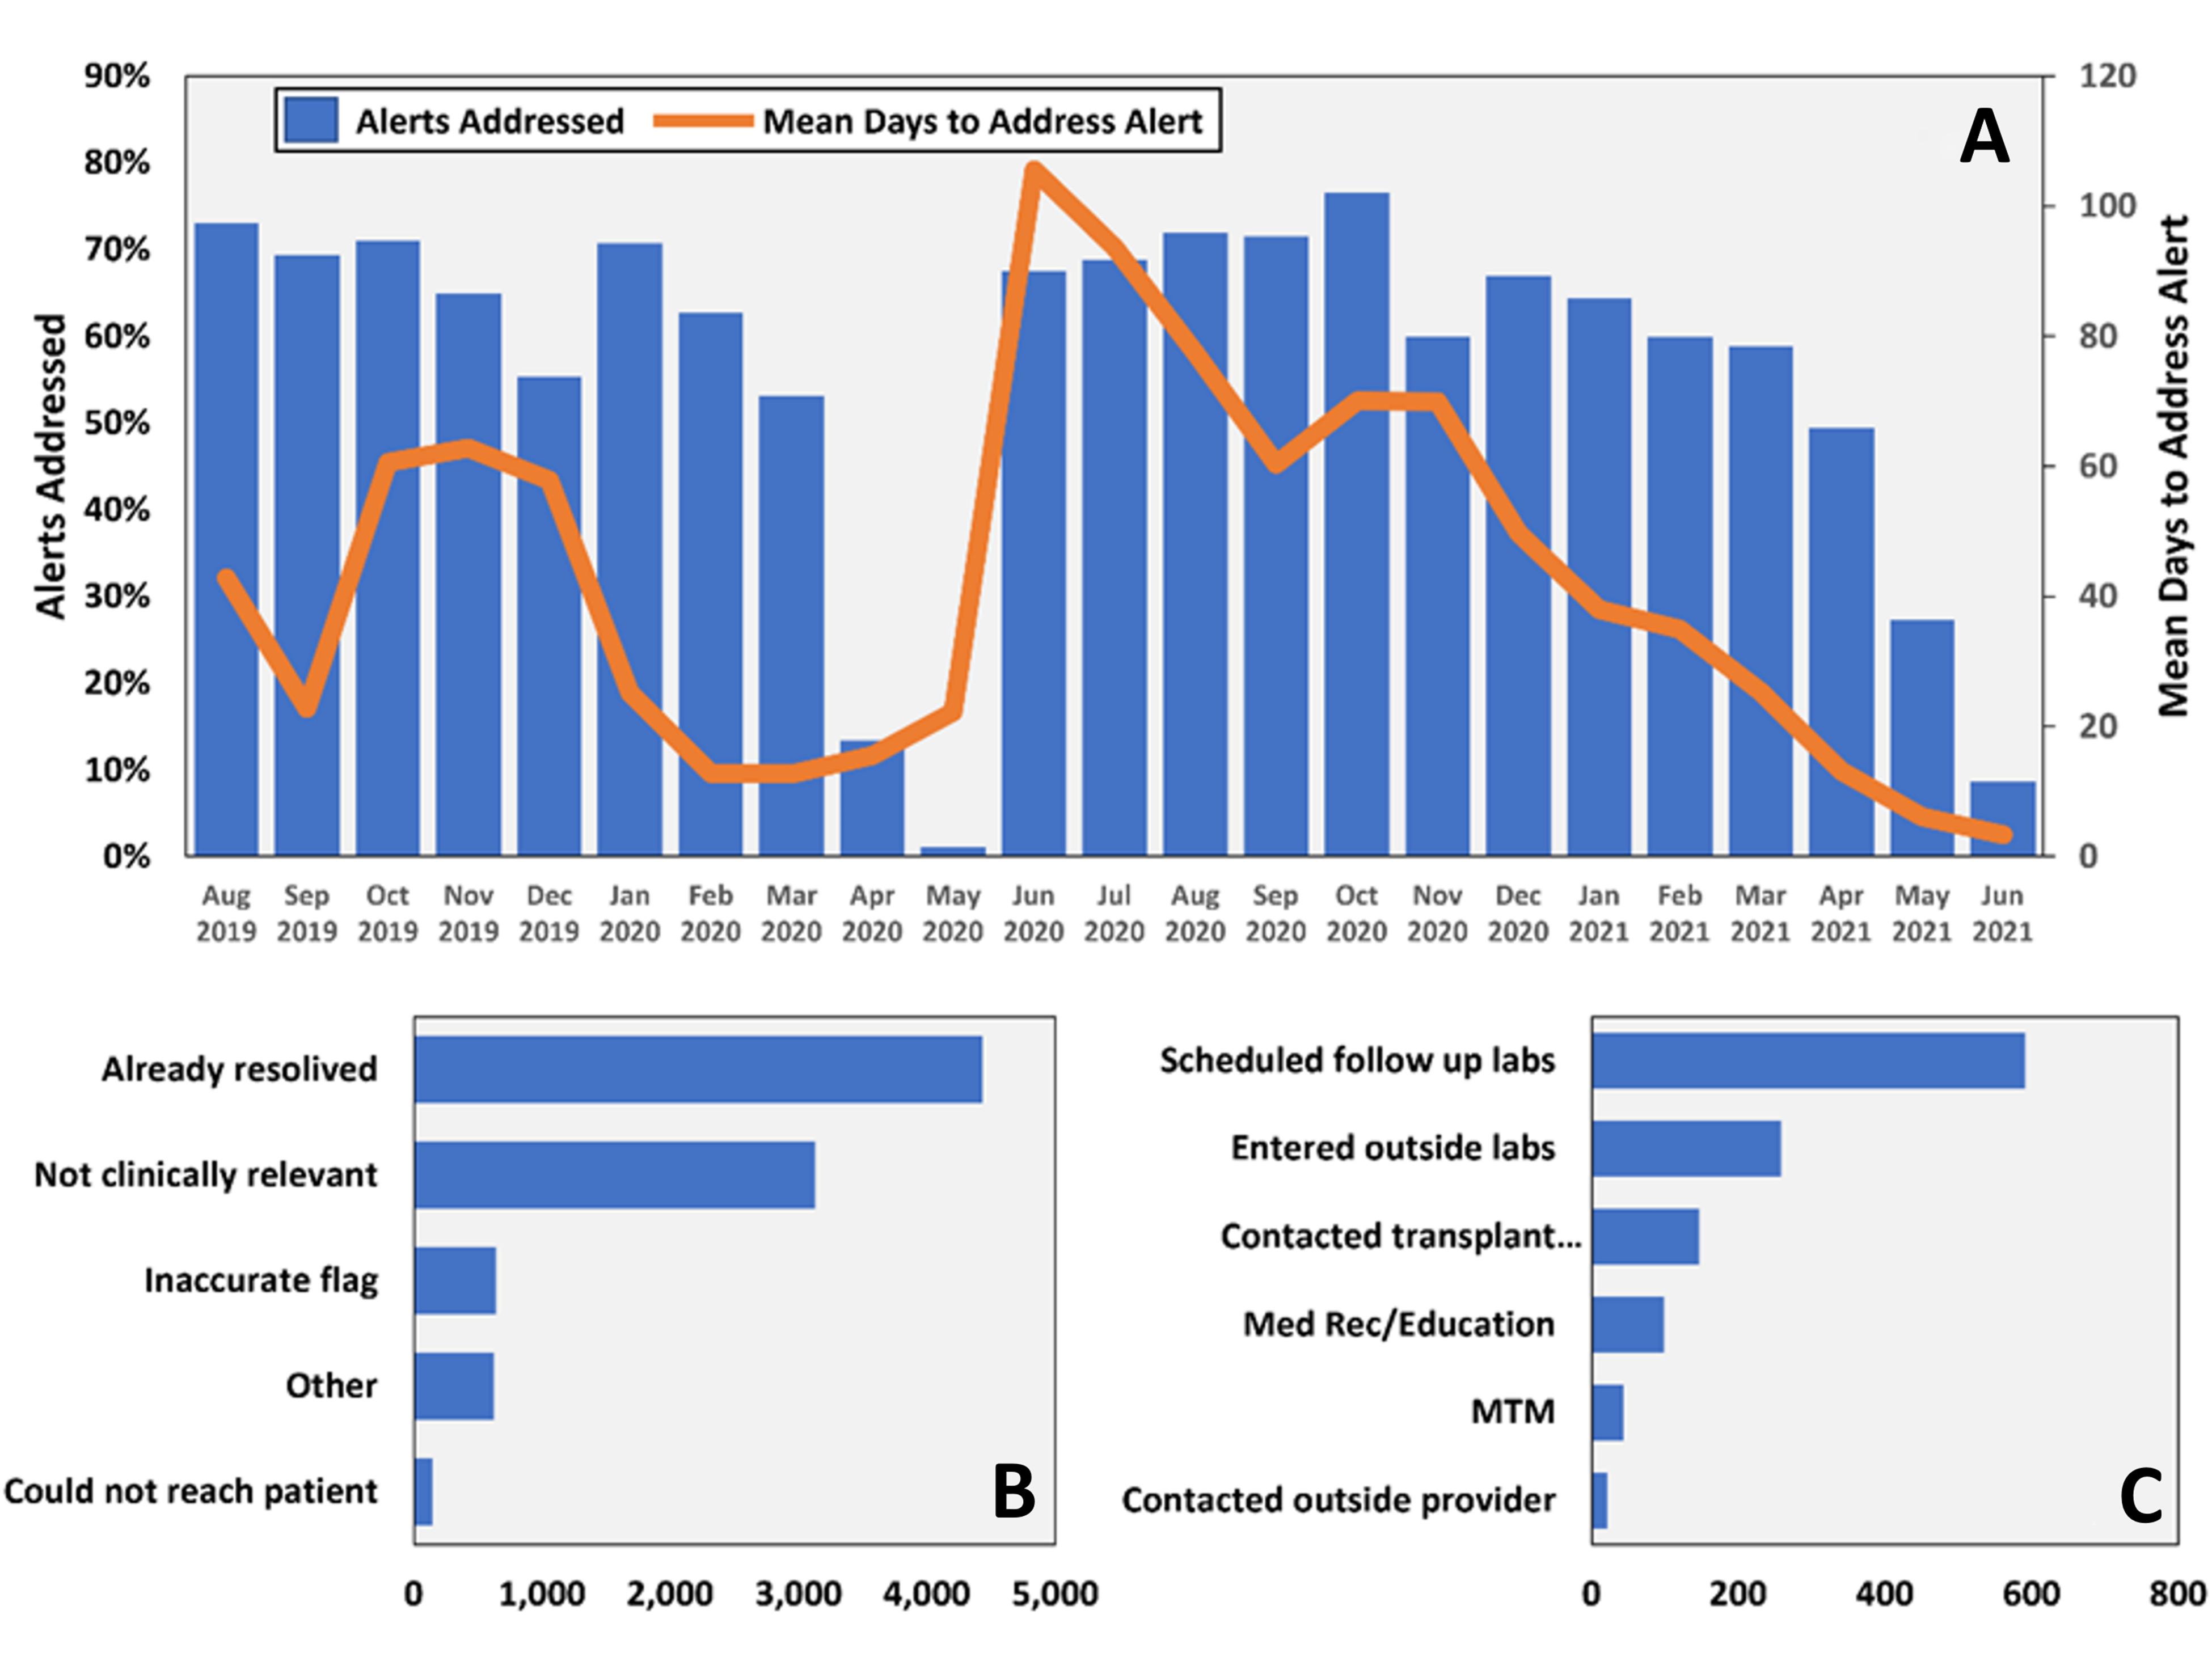
Percent of alerts and time to addressing alert by intervention pharmacist (A), number of alerts deemed nonactionable (B), and number and type of actions taken (C).
Predictors of Dashboard Use
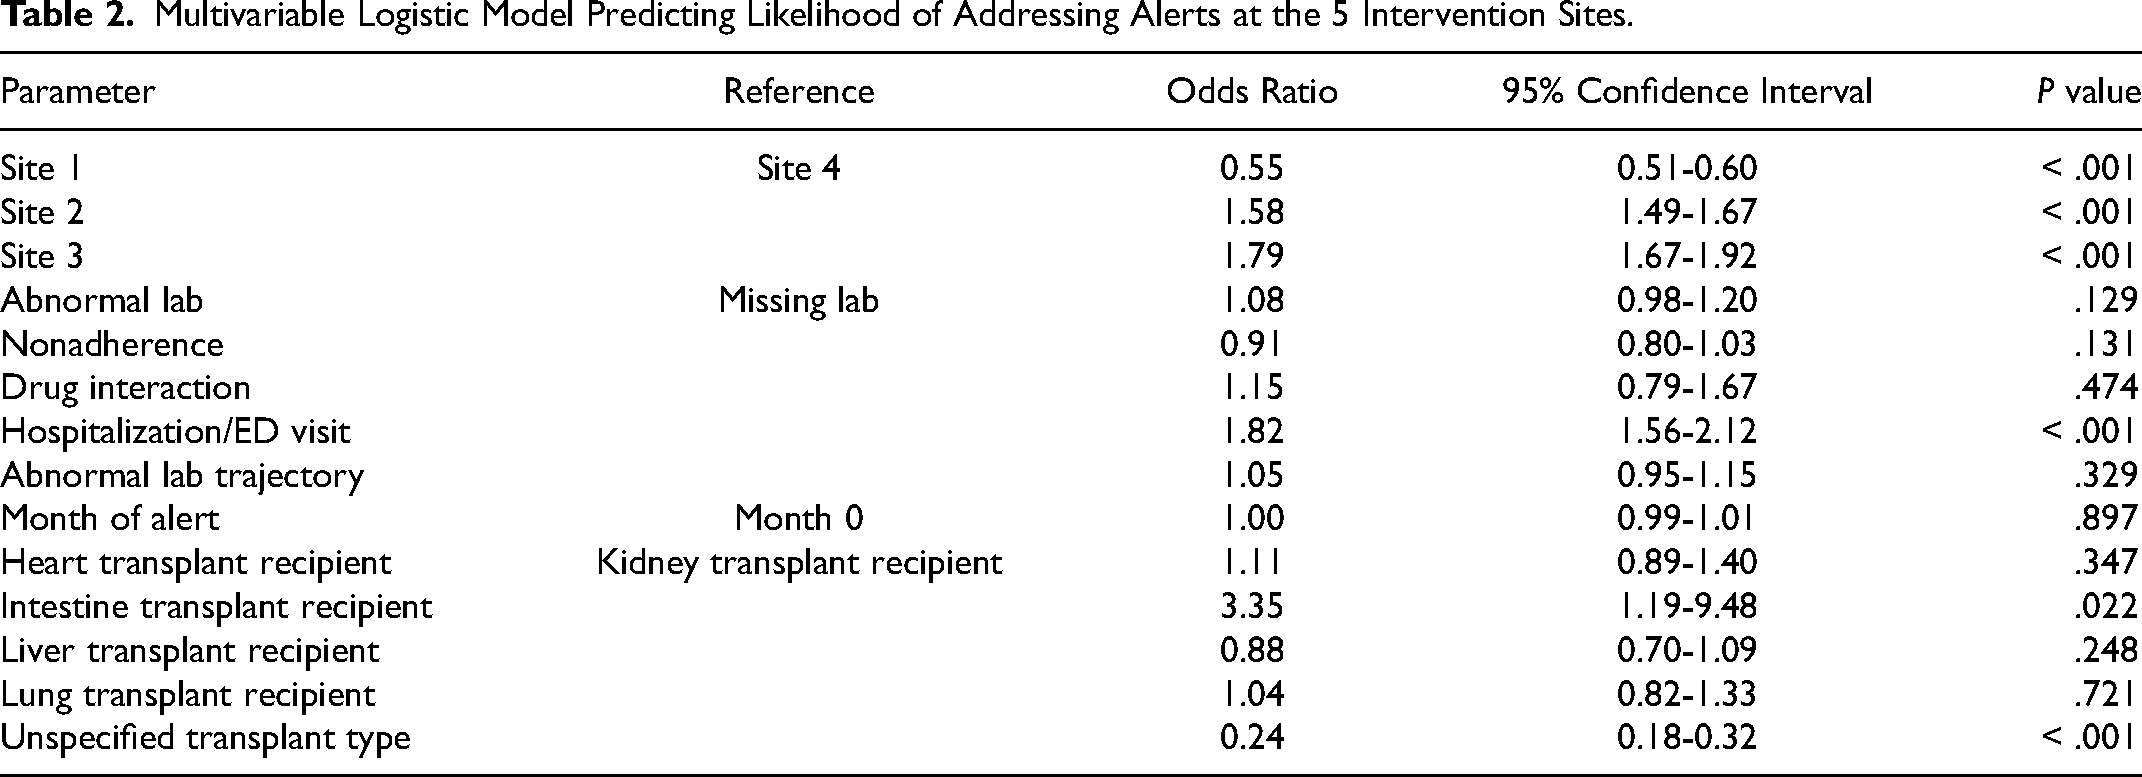
A multivariable logistic model predicting the likelihood of addressing alerts at the 5 intervention sites is displayed in
Multivariable Logistic Model Predicting Likelihood of Addressing Alerts at the 5 Intervention Sites.
Discussion
The findings of this study demonstrated that the deployment of a web-based, population-level medication-safety dashboard for organ transplant recipients across multiple sites was feasible and, in general, produced valid alerts.
Medication-related dashboards are commonly used by pharmacists to facilitate patient monitoring and MTM. The VA Academic Detailing Service has dashboards for acute respiratory illnesses, diabetes, chronic pain, and suicide prevention dashboards. These VA-supported dashboards provide tools for clinical pharmacists, as the academic detailer, to interface with providers with the primary goal of aligning prescribing behavior to established clinical standards.17,18 These differ from the dashboard presented in this article, which focuses on providing data for pharmacists to interact with transplant recipients directly. Other clinical dashboards have been evaluated within the VA system for patient safety and population management. Examples include a multisite telenephrology dashboard to identify transplant recipients with early changes in renal function, 19 and a single-center program to assist with monitoring of TNFα inhibitors. 20 Although the VA system uses many dashboards, they are seldom formally analyzed for functionality and usability. For this reason, the results of this analysis are novel and important as they provide a formal assessment of a multicenter medication safety dashboard within the VA system.17‐19
The dashboard system used by pharmacists was acceptable but certainly less than optimal; 56% of alerts were addressed, resulting in more than 8000 unaddressed alerts. There are likely several reasons for this. First, there was no protected time for pharmacists to use this system, and it was layered on top of their already full day of work. This was worsened by the COVID-19 pandemic when job functions changed and time and resources were stretched thin. 21 Second, the number of alerts was considerable, and even when addressed, there was a significant time between when the alert was provided to the pharmacist and when the pharmacist documented their actions for that specific alert. This likely led to a situation where a large proportion of alerts became nonactionable due to this delay (already addressed by another provider or new labs or data that supersede the original alert). This system's use may have been improved by adjusted queries to create fewer alerts that are more clinically relevant and actionable and ensuring pharmacists had adequate time to review and address alerts. It is important to note that dashboard systems are often developed without using informatic or human factor principles and, as a result, often fail to achieve desired outcomes of high usability and functionality. Standard human factors design principles focus on how the clinicians interact with the technology (dashboard) during typical daily workflows and create conceptual models that outline common scenarios. Further, these principles engage the user stakeholders in the design early and assess usability and functionality throughout the process. In a systematic review that assessed 4624 publications and critiqued 33 studies, Murphy and colleagues concluded that only 4 systems were explicitly based on human factors and informatics; most did not formally assess usability and functionality as outcomes. 22 The development and validation of the Salford medication safety dashboard (SMASH) to guide a pharmacist-led interaction is probably the most similar system to ours in terms of scale and scope. The SMASH system was developed to identify potential medication safety issues and deployed to 43 general practices in Salford, UK. It was deployed to 36 pharmacists, and preliminary evidence supported its use, functionality, and potential effectiveness. These principles were used during the development of our system, having multiple iterations guided by the 13 pharmacist participants and the project informaticists. 23 Unfortunately, it is difficult to compare our results to the SMASH study for usability, as we report different metrics. The SMASH study focused on metadata use, including sessions per week and duration of use. In contrast, we focused on the number of alerts reviewed and addressed, actions taken based on alerts, and time to address alerts. 23
Most alerts that were addressed within this dashboard system were deemed nonactionable, commonly because they were already addressed by another provider or not clinically relevant. This was likely because most alerts were not addressed for several weeks after the queries were created and presented to study pharmacists. The lag between query triggering and being addressed was clearly a limitation of this system and one that should be addressed in future iterations. Timely assessment of alerts by clinical pharmacists is required to improve data actionability and dashboard functionality.
There are several important implications related to the findings of this process measure study. It was clear from this pragmatic study that the development and deployment of an accurate and advanced medication safety dashboard within a national healthcare system was technically feasible, but this did not necessarily equate with practical dashboard utility. Within this multicenter study, pharmacists were encouraged to use the system. However, there was not any deliberate effort to protect time or adjust workflows to incorporate this tool into usual daily routines. As measured by a number of alerts addressed, the multivariable analysis revealed that the use of the system significantly differed by the site. Sites also differed substantially by pharmacist job type, sole dedication to transplant populations, and job-sharing. These structural differences in how pharmacists manage transplant recipients across the 5 intervention sites impacted the use of this dashboard system. Future endeavors or iterations of medication safety dashboards, either in organ transplant or other populations, should ensure ample expertise, time, and motivation to address the products (alerts) of such systems and that workflows are deliberately adjusted to incorporate these systems into usual daily routines. Dashboards, even those that use real-time data and have advanced analytics, are still simply a tool. Without having these tools integrated effectively into the clinical workflows, their utility is not likely to be fully realized.17,22 Further, such systems may have the capacity to overwhelm users if inappropriate or extraneous information is presented. The number of daily alerts produced needs to be carefully considered in the context of a reasonable expectation that is not likely to impact provider uptake. Iterations should be tested and refined, with components tested using real-world data and actual target end-users. These best practices will ensure that systems produce accurate and clinically actionable information and be utilized to their fullest potential to improve patient outcomes directly. 22
There are limitations worthy of discussion. First, this was a pragmatic trial, and as such, pharmacists were not required to use the dashboard and workloads were not adjusted to provide more time for dashboard review. Because of this, the number of alerts addressed was < 60% and this significantly varied by site. This is a clear challenge to implementation and one that needs to be thought of at the start of developing and deploying these systems. A dashboard is simply a sophisticated tool, and its effectiveness hinges most importantly on the end-user. If too many alerts are produced or the alerts are not clinically relevant, alert fatigue, alert noise, and lack of use are real issues that need to be carefully considered when developing such systems. Third, the system predominantly focused on internal data (labs, medications) and did not have automated access to non-VA clinical data. Although this data could be entered manually, it likely led to situations where transplant recipients were not fully assessed by this dashboard system. Additional limitations to this assessment included neither fact that interrelated reliability to actions taken by pharmacists by alert type was not measured nor was satisfaction with the system from participating pharmacists. There were no set a priori levels of what would be considered acceptable for accuracy and usability.
Conclusion
The findings demonstrated that the use of a pharmacist-directed population safety dashboard was a feasible tool for the care of transplant recipients within a large multidisciplinary healthcare system. Actionable alerts were identified, resulting in additional laboratory monitoring, communication between the VA center and the primary transplant providers, and in some instances, drug therapy modifications by the pharmacists. However, there was a substantial delay between alert firing and addressing of the alerts by the pharmacists using the dashboard, which reduced the number of relevant and actionable alerts. To incorporate this technology, future iterations should include refinement of alerts to be most actionable by the target end-users and improve the workflow/electronic health record integration to allow pharmacists to promptly review and address the alerts.
Supplemental Material
sj-docx-1-pit-10.1177_15269248231164177 - Supplemental material for A Randomized Control Trial Testing a Medication Safety Dashboard in Veteran Transplant Recipients
Supplemental material, sj-docx-1-pit-10.1177_15269248231164177 for A Randomized Control Trial Testing a Medication Safety Dashboard in Veteran Transplant Recipients by David J. Taber, Sherry Milfred-LaForest, Kelsey Rife, Rebecca Felkner, Danielle Cooney, Nicholas Super, Samantha McClelland and Casey Buchanan in Progress in Transplantation
Supplemental Material
sj-docx-2-pit-10.1177_15269248231164177 - Supplemental material for A Randomized Control Trial Testing a Medication Safety Dashboard in Veteran Transplant Recipients
Supplemental material, sj-docx-2-pit-10.1177_15269248231164177 for A Randomized Control Trial Testing a Medication Safety Dashboard in Veteran Transplant Recipients by David J. Taber, Sherry Milfred-LaForest, Kelsey Rife, Rebecca Felkner, Danielle Cooney, Nicholas Super, Samantha McClelland and Casey Buchanan in Progress in Transplantation
Footnotes
Funding
The authors disclosed receipt of the following financial support for the research and/or authorship of this article: The research presented in this article is supported by a grant provided by the Department of Veterans Affairs, VA, Office of Research and Development, Health Service Research and Development (I01HX002130).
Declaration of Conflicting Interests
The authors declared the following potential conflicts of interest with respect to the research, authorship, and/or publication of this article: David Taber receives research grant support from Veloxis, Merck, Takeda, and CareDx and is a consultant for Veloxis and Eurofins. None of the research presented in this article is related to these grants or consulting agreements.
Supplemental Material
Supplemental material for this article is available online.
References
Supplementary Material
Please find the following supplemental material available below.
For Open Access articles published under a Creative Commons License, all supplemental material carries the same license as the article it is associated with.
For non-Open Access articles published, all supplemental material carries a non-exclusive license, and permission requests for re-use of supplemental material or any part of supplemental material shall be sent directly to the copyright owner as specified in the copyright notice associated with the article.