
Abstract
By using a data set of professional basketball players' free agent contracts from the National Basketball Association (NBA) between the 2001-2002 and 2007-2008 seasons, which has rich data on worker productivity, the author is able to identify the effect that changes in income tax rates have on the labor migration decisions of NBA free agents. After controlling for other observable characteristics of teams, cities, and states, the author finds that an increase in the marginal income tax rate faced by NBA basketball players that play for a given team leads to a decrease in the average skill of the NBA free agents that migrate to that team.
In the summer of 2010, LeBron James had a decision to make about his National Basketball Association (NBA) playing future. In the week leading up to “the decision,” James met with representatives from six NBA teams: the New Jersey Nets, New York Knicks, Miami Heat, Los Angeles Clippers, Cleveland Cavaliers, and Chicago Bulls. In an hour long special which aired on July 8, 2010, on ESPN, James chose to play the next five years of his career with the Miami Heat. “The decision” is still being criticized by NBA analysts at the time of publication.
According to many income tax experts, LeBron James made the right decision. “If LeBron James goes to the Miami Heat instead of the Knicks, blame our dysfunctional lawmakers in Albany, who have saddled top-earning New Yorkers with the highest state and city income taxes in the nation, soon to be 12.85% on top of the IRS bite,” said the New York Post. “On a five-year contract worth $96 million—what he’d get from the Knicks or the Heat—LeBron would pay $12.34 million in New York taxes” (Gillis, 2010). Based on a similar contract, “James would pay $5.69 million in state taxes if he re-signed with the Cleveland Cavaliers. If he signed with the New Jersey Nets, James would pay $10.32 million in state taxes” (Gillis, 2010). He would also pay $2.87 million more in state taxes if he signed with the Chicago Bulls as compared to the Miami Heat, and much more if he went to play for the L. A. Clippers in California, where the top income tax rate is 10.55% (Merchak, 2010). According to agent Gregg Clifton of Octagon Sports who represents big-name baseball players such as Tom Glavine and David Wells, “…there’s a clear benefit to relocating to tax-free states” (Heath, & Crenshaw, 2003).
Literature Review
While the causes and effects of labor migration are of central importance in the labor migration literature, little work has been done regarding the effects that changes in state and city income tax rates may have on the labor migration decisions of high-income individuals. This gap in the labor migration literature may be due to a lack of data availability. Many data sources, such as the March Current Population Survey and the Panel Study of Income Dynamics, top code or censor individuals whose income exceeds a certain amount. In addition, these surveys contain only limited information about worker ability. By using a data set of professional basketball players' free agent contracts from 2001 to 2007, I am able to circumvent both of these data limitations.
Clark and Hunter (1992) find that working males in their peak earning years are detracted by high income taxes in migration decisions. Wallace (1993, 2002) finds that income taxes are not always entirely borne by labor, and when income taxes are capitalized within wages, they generally do not affect individual’s migration decisions. However, it may be particularly useful to explore the effects that changes in income tax rates may have on the labor migration decisions of high-income individuals, since high-income individuals bear the largest burden of an income tax, especially when tax rates are progressive. Kirchgassner and Pommerehne (1996) and Feld and Kirchgassner (2001) find that high-income individuals in Switzerland, where local tax competition between cantons and cities is relatively high, seem to choose their location based on the amount of income taxes they must pay. However, their work does not estimate the causal effect of taxation, but rather notes a negative spatial correlation between cities and cantons with high-income taxation and the location of high-income individuals. Egger and Radulescu (2009) find that personal income tax rates have a negative effect on cross-border flows of skilled workers in OECD (Organization for Economic Co-operation and Development) countries.
Taxes and the NBA
The NBA’s regular season lasts from late October to late April. Approximately two fifths of one season takes place at the end of 1 year, and three fifths of the season takes place at the beginning of the next year. Thus, two fifths of the income tax paid by a player in a given season will be taxed in the first year of a season, and three fifths of the income tax paid by a player in a given season will be taxed in the second year of a season.
Each team in the NBA plays an 82-game regular season schedule. Exactly 41 of these games are “home games” that are played in the team’s home arena and are taxed by the team’s home state. For the remaining 41 “away games” that are played in their opponent’s arena, players generally must pay whichever tax rate is higher, the home state’s or the away state’s (Merchak, 2010). 1 Many teams also play in cities where there are city or county income taxes as well. Of course, in the United States, state income tax is deductible from federal income tax. In Canada, however, this is not the case; provincial income tax is not deductible from Canadian income tax.
Under the collective bargaining agreement of the NBA, there are two types of free agents: restricted free agents and unrestricted free agents. A restricted free agent may entertain offers from any team; however, the player’s current team reserves the right to match any offer in order to keep the player. Any veteran free agent who will have 3 or fewer years of NBA service following the season in which his contract expires will become a restricted free agent if the player’s prior team makes a qualifying offer (the higher of 125% of his previous season’s salary or $175,000 plus the league minimum) to him. An unrestricted free agent is a player who is not bound to any particular team and is free to negotiate a contract with any team (“2005 Collective Bargaining Agreement,” 2009). Unrestricted free agents include any veteran free agents with at least 4 years of service, any veteran free agents with 3 or fewer years of service that does not receive a qualifying offer from his prior team, and any undrafted rookies (“2005 Collective Bargaining Agreement,” 2009). Figure 1 shows the average salary of NBA players in each season between 2001 and 2007.
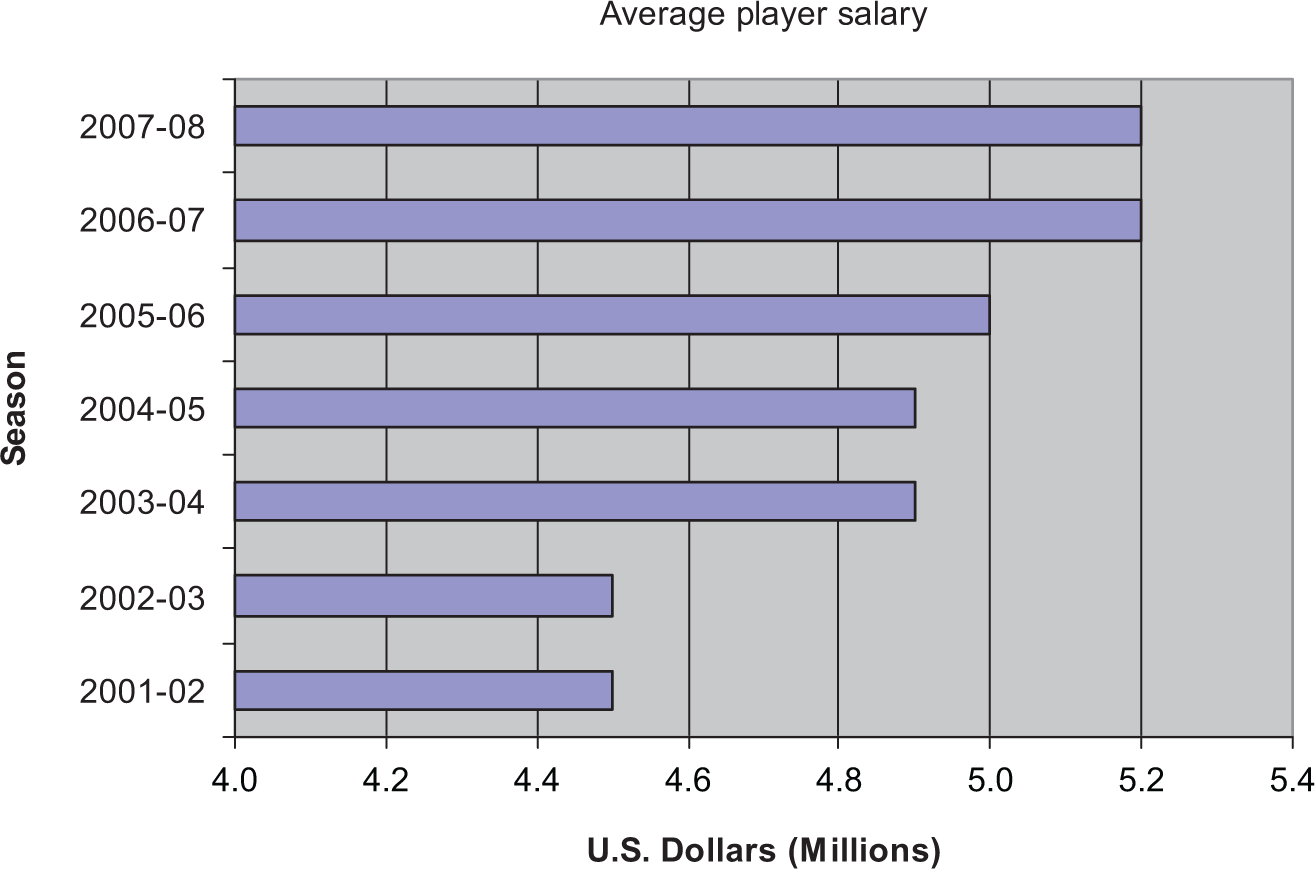
Average NBA Player Salary, 2001-2002 to 2007-2008 seasons.
There is a league-wide maximum salary that cannot be exceeded for a single player, and a salary cap that restricts the total amount of a team’s payroll. While there are many exceptions to these restrictions that allow teams to exceed the salary cap, the most important of these exceptions fall into the “Larry Bird” family of exceptions. These exceptions, which are named after the famous Boston Celtics forward Larry Bird, allow teams to exceed the salary cap by re-signing their own free agents.
Teams that exceed the salary cap by large amounts are punished with a luxury tax. There is a strong incentive for teams to keep their payroll under the luxury tax threshold; for each dollar by which a team’s payroll exceeds the luxury tax threshold, the team must pay to the league one dollar, 2 which is then dispersed evenly among the teams that have not exceeded the luxury tax threshold (“2005 Collective Bargaining Agreement,” 2009). Table 1 shows the top 10 NBA payrolls for each season between 2001-2003 and 2007-2008. 3 In the 2002-2003 season, in the first year of the luxury tax, more than half of the teams in the NBA were over the threshold. However, by 2005-2006 season, only one sixth of the league had a payroll above the luxury tax threshold. But, in recent seasons, the number of teams with payroll above the luxury tax threshold has again increased. In the 2007-2008 season, 11 teams had a payroll that exceeded the luxury tax threshold, and in the 2008-2009 season, 13 teams had a payroll that exceeded the luxury tax threshold. While many teams choose to exceed the salary cap and even the luxury tax threshold, only a very small minority of teams choose to exceed the luxury tax threshold by a large amount.
Top 10 NBA Payrolls in Millions of Dollars, 2001-2007
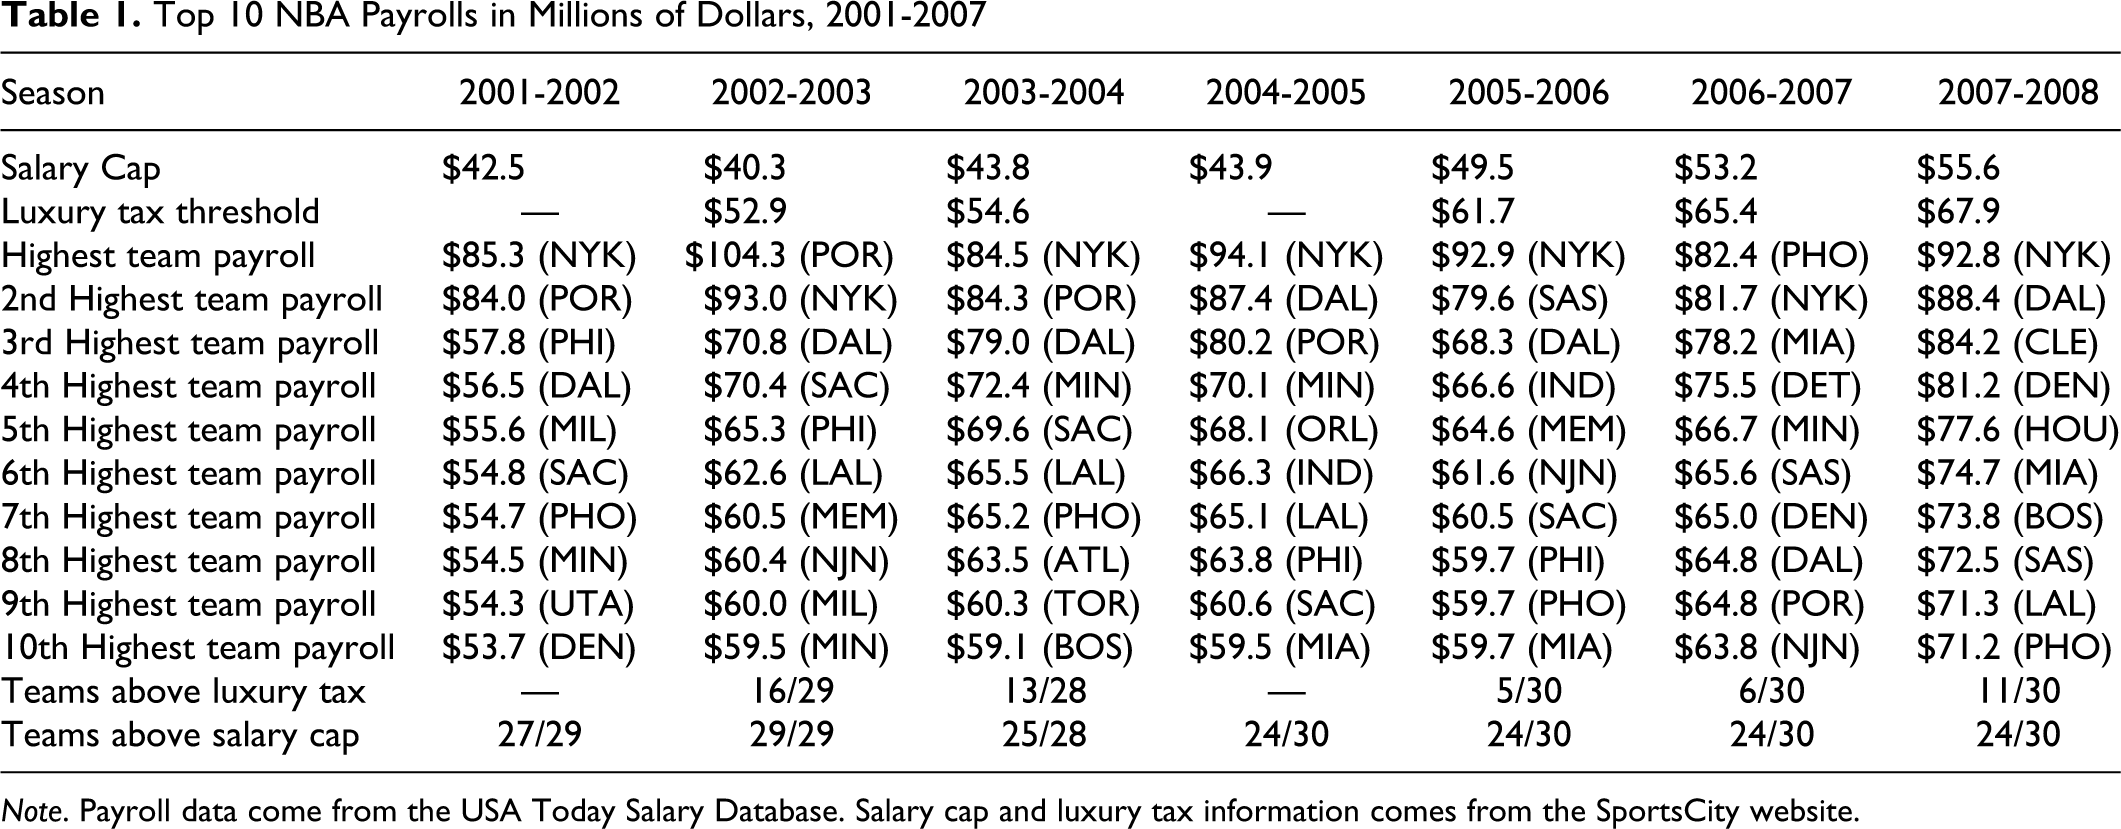
Note. Payroll data come from the USA Today Salary Database. Salary cap and luxury tax information comes from the SportsCity website.
It appears that most teams are constrained from raising their payroll above what is observed. Because of this, teams may not be able to compensate players for higher tax rates in the form of higher salaries. In fact, of the teams in our sample, 49.8% of them are already over the cap prior to the free agency period. These teams, on average, must sign an average of 4.88 players in free agency in order to get to the league minimum roster size of 14, and will be greatly restricted in the signing of free agents. However, this is an underestimate of the number of teams that are constrained, as an additional 50 teams have less than 20% of total cap space available to sign an average of 5.32 free agents to reach the league minimum roster size.
Theoretical Framework
Assume that each free agent maximizes his utility through his utility function, U (Wkc (S), Xkc ), which is identical for all free agents, and depends only on the skill-dependent after-tax salary and a vector of team and city characteristics, where Wkc (S) is the after-tax salary of a free agent with skill level S on team k in city c, and Xkc is a vector of characteristics that are specific to team k and city c, which affect player utility. Furthermore, assume that it is the goal of team k to maximize ΣS subject to some spending constraint B. For simplicity, let wkc (S) be the pretax salary of a free agent with skill level S on team k in city c, such that Wkc (S) = wkc (S) × (1 − tkc ), where tkc is the state tax rate faced by players on team k in city c.
Suppose that a free agent with skill level S = s receives two pretax salary offers; the free agent is offered w 11 (s) from Team 1, and the free agent is offered w 22 (s) from Team 2. If all elements of Xkc are identical, such that X 11 = X22 , then the free agent will accept the offer from Team 1 if and only if the after-tax salary offered by Team 1 is greater than (or equal to) the after-tax salary offered by Team 2; that is, if W 11 (s) ≥ W 22 (s) or w 11 (s) × (1 − t 11) ≥ w 22 (s) × (1 − t 22).
Suppose for a moment that the state income tax rates faced by players on each team are equivalent, that is, t 11 = t 22. In this case, the free agent will accept the highest pretax offer. However, if we now suppose that the tax rate faced by players on Team 1 is greater than the tax rate faced by players on Team 2, t 11 > t 22, then free agents will accept offers from Team 1 if and only if the pretax salary offer from Team 1 is greater than (or equal to) the pretax salary offer from Team 2; w 11 (s) ≥ w 22 (s) × [(1 − t 22)/(1 − t 11)], where (1 − t 22)/(1 − t 11) > 1.
Now, let U (W 11 (s), X 11) = U (W 22 (s), X 22), relaxing the assumption that X 11 = X 22 and allowing t 11 and t 22 to differ. If t 11 were to rise relative to t 22 to a level of t 11’ and w 11 (s) and w 22 (s) were to remain unchanged, then U(W 11 (s), X 11) < U(W 22 (s), X 22), and players with offers from Teams 1 and 2 would choose to play for Team 2. However, if Team 1 were to offer a high enough pretax wage, w 11’ (s), such that w 11’ (s) × (1 − t 11’) ≥ W 11 (s), then it would be possible to for Team 1 to sign players with offers from Team 2.
The implication of this theory is that for Team 1 to sign a free agent, which also has an offer from Team 2, Team 1 must compensate him for the income tax rate differential, holding constant all other team and city-specific characteristics that a player cares about. While a free agent may make a counteroffer to Team 1 which explicitly considers tax rates, to the extent to which it is not possible for Team 1 to compensate a free agent for the income tax rate differential (due to salary cap restrictions, the luxury tax threshold, etc.), it would be expected that Team 2 will be able to sign the free agent. Indeed, Team 2 will likely be able to sign most of the free agents with offers from both Team 1 and Team 2, and Team 1 will have to target many lower skilled free agents which Team 2 has no interest in. In this case, the average skill of the free agents signed by Team 2 will be higher than the average skill of the free agents signed by Team 1.
In the preceding theoretical analysis, a free agent’s skill level S has been taken as known, and it has been implicitly assumed that both teams have the same expectation of the free agent’s skill level S. It may be worth noting that in reality each team may have a different expectation about S. There may also be other considerations that may affect each team’s evaluation of a given player, such as player maturity and off-court behavior, or team cohesiveness.
The Data
The data used in this article comes from a multitude of sources. NBA player contract data, which include data on team, year, position played, contract length, and total contract dollar amount, are taken from USA Today Salaries Database and the Pro Sports Transactions website. Player performance data are taken from the Database Basketball website. State and federal income tax rate data are taken from the National Bureau of Economic Analysis Taxsim. Canadian central and provincial tax rates are taken from the Canada Revenue Agency. State effective sales taxes and effective property taxes are calculated from the Census of Governments. Metropolitan Statistical Area (MSA) demographic data, including population, employment, and income per capita, are taken from the Bureau of Economic Analysis. Data pertaining to the relevant exchange rate between the United States and Canada are taken from the Bank of Canada.
Summary statistics for all free agent signees broken down by the relative income tax rate quartiles (deviation from season mean) are available in Table 2 . Furthermore, all summary statistics are weighted by contract length so that our sample is representative of the entire population of free agent signees.
Summary Statistics by Income Tax Rate Quartile, Weighted by Contract Length
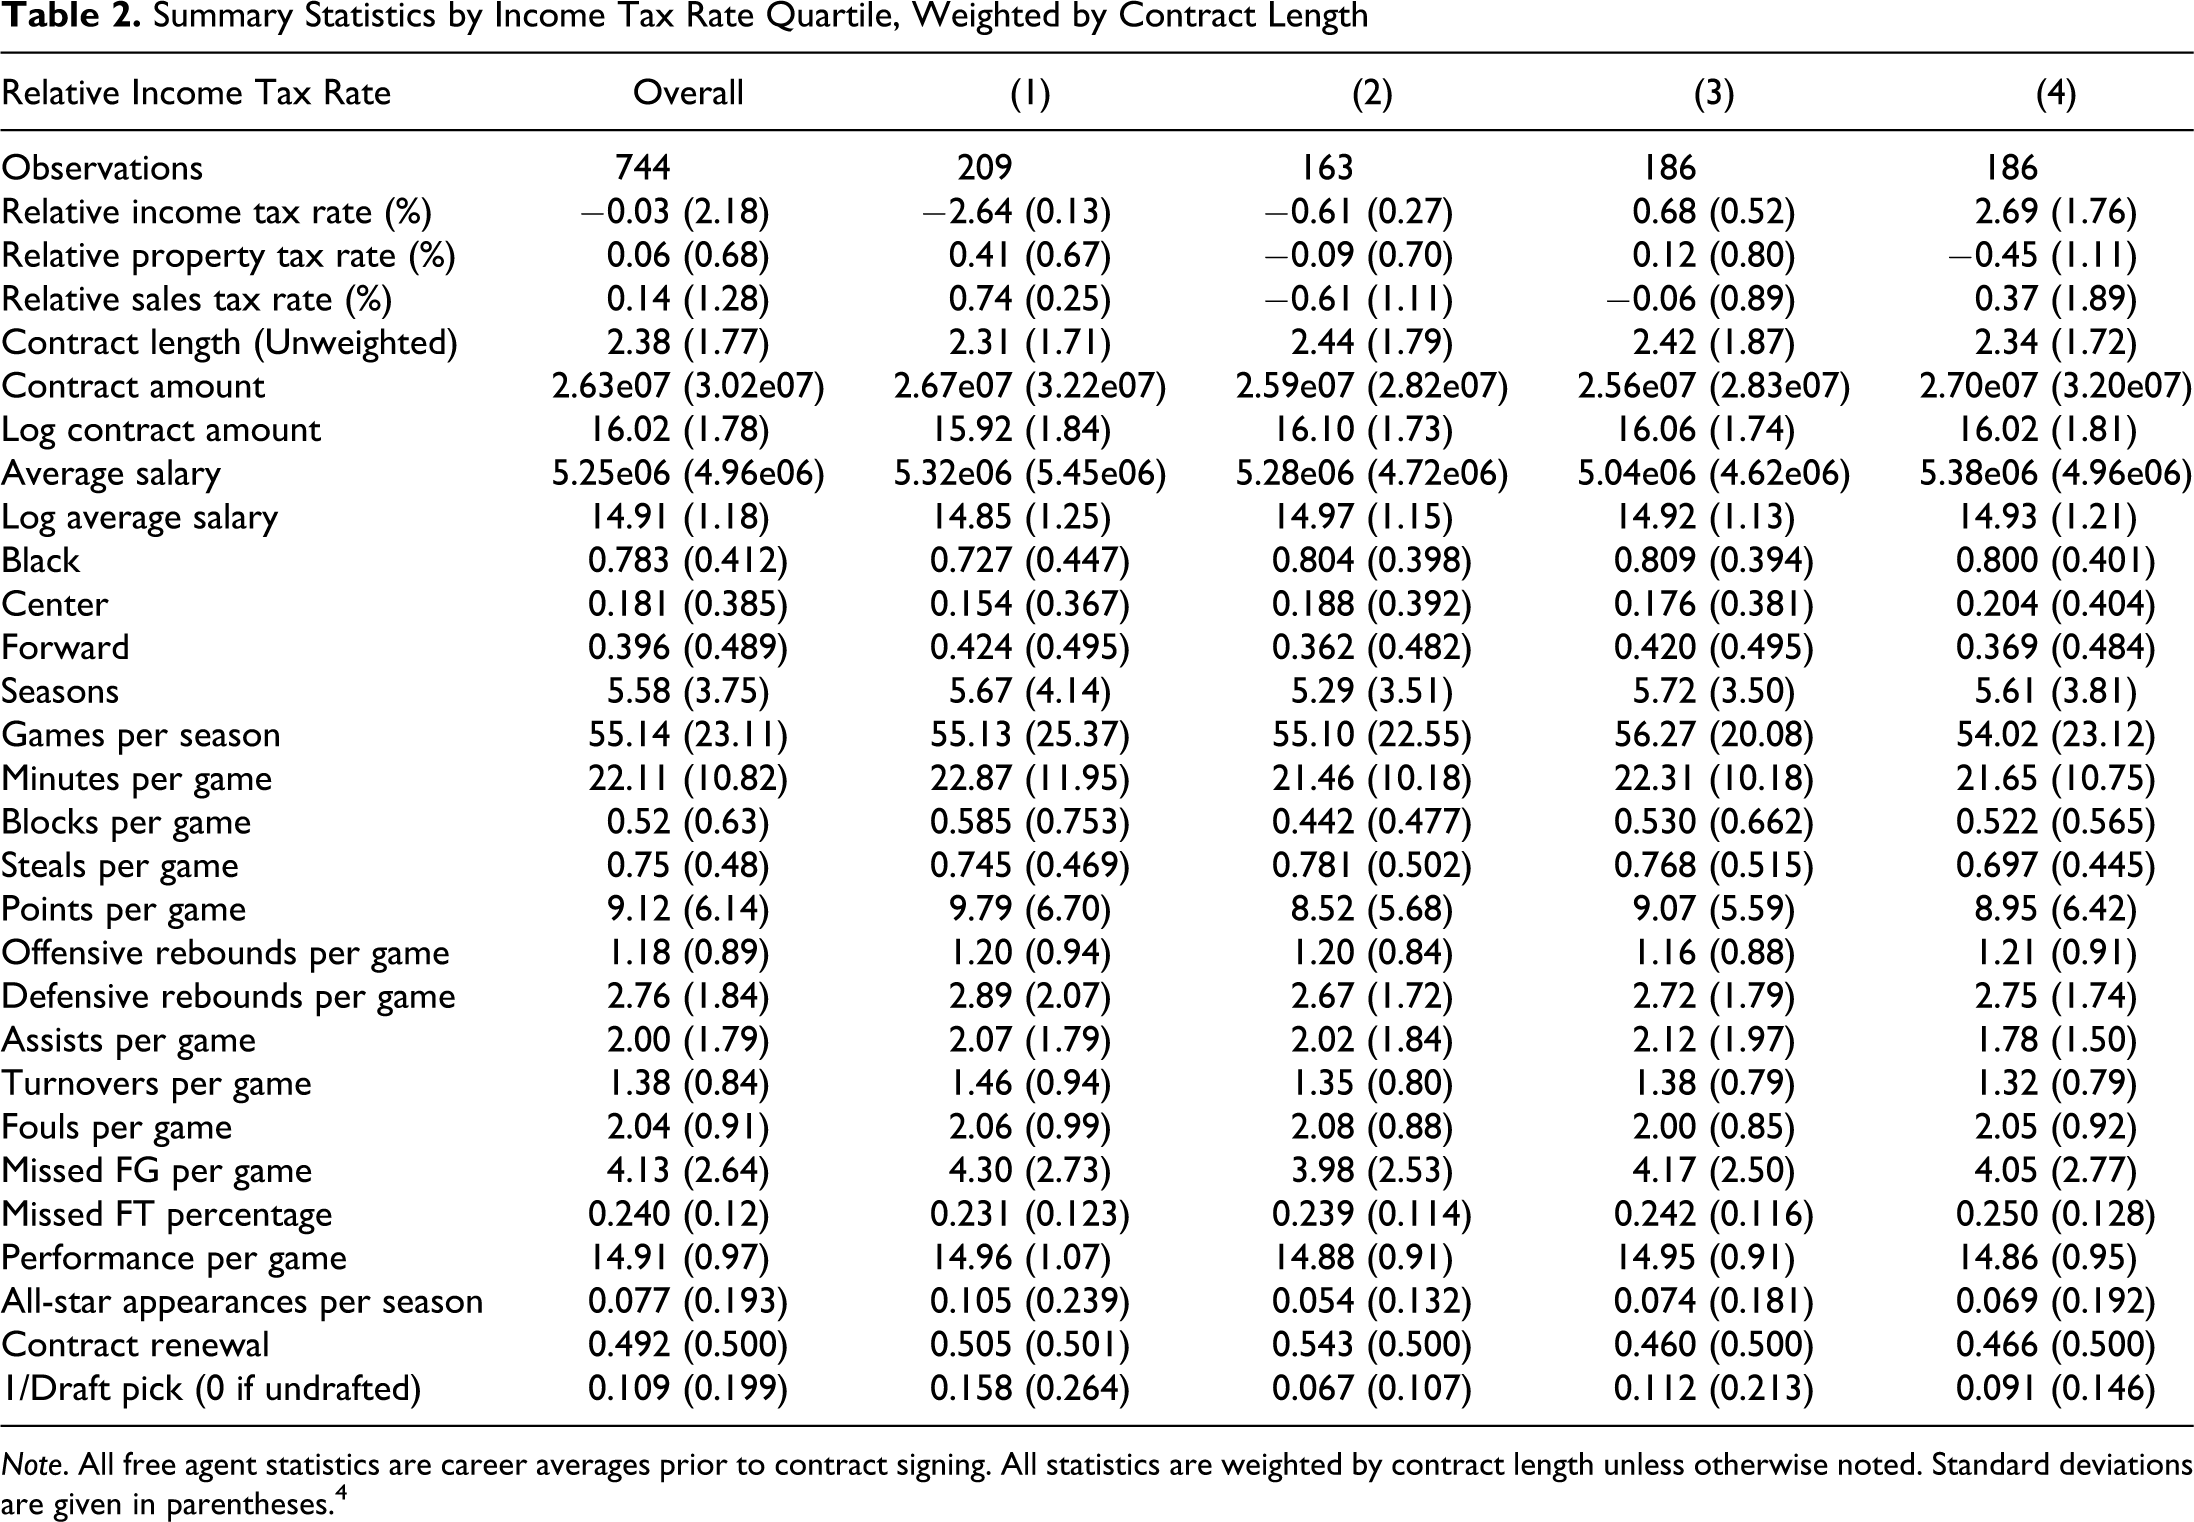
Note. All free agent statistics are career averages prior to contract signing. All statistics are weighted by contract length unless otherwise noted. Standard deviations are given in parentheses. 4
Inference of summary statistics is by no means rigorous; however, by looking at the summary statistics, a few patterns are noticeable. It appears that income tax rates and properties tax rates have a negative relationship, as do income tax rates and sales tax rates, as one might expect. There does not seem to be much of a trend in total contract amount or average salary across income tax quartiles. However, it does appear that free agents that sign into relatively lower income tax quartiles have more points per game, blocks per game, rebounds per game, assists per game, and a higher free throw percentage, all leading to a higher performance per game measure throughout their career. They are also more likely to have been all-stars and to be taken earlier in the NBA draft.
Ideally, to determine the impact of an income tax differential, we would compare two teams that are identical in every aspect, except for the income tax rates faced by the two teams, and observe the difference in skill of the free agent signees or the incremental salary increase that is necessary to make a free agent indifferent between the two teams. However, since we cannot observe any team’s counterfactual, we must take a different approach. Since we can only observe accepted offers, we must compare the salaries of free agent signees of differing skill levels that sign with different teams and attempt to control for differences between the players and teams. First, we must determine the relevant comparable team-specific income tax rate faced by each NBA free agent signee. Quick inspection of the data shows that every free agent signee in the sample is above the highest tax threshold in their respective state and the majority make at least a few million dollars more, so the highest marginal tax rate in each state is a good approximation for the actual tax rate that each free agent signee will face in that state. State and local tax rates are federal tax deductible, so we must adjust the state and local marginal tax rates to get an effective tax rate. Since 41 games take place in the home state and 41 games take place on the road, and each team typically has road games in approximately the same locations each season, we can find a linear combination of effective marginal state and local income tax rates that each team’s players face. 5 Because the season takes place over the course of two separate years, the tax is paid over two separate years, possibly at different tax rates.
Due to the way that our relative income tax rate measure for each year is calculated, we can garner some intuition about when the relative income tax rate will change. Obviously, any change to the highest marginal state or local income tax rate will change the relative income tax rate facing any of that state’s home teams; however, it will also alter the relative income tax rate facing any other team in the league, both because their players may pay some tax toward that state, and because it changes the mean tax rate for that year. This makes sense, since a change to the tax rate facing other teams greatly alters the after-tax salary available to each free agent if they had signed with that other team. In the same way, any change to a U.S. federal or Canadian central tax rate policy will also change the relative income tax rate facing each team by raising or lowering the relative income tax rate facing free agents that sign with the Toronto Raptors, the only Canadian team in our sample. For example, if the U.S. government decides to increase federal tax rates, the relative income tax rate facing the Toronto Raptors' players will fall since the league’s average tax rate will rise relative to the Toronto Raptors' tax rate. Any change in league alignment, such as that which took place prior to the 2004-2005 NBA season, will also alter relative income tax rates since the opponents that teams will face each year will change. It is worth noting that, since provincial tax rates are not tax deductible from Canadian taxes, and Canadian tax rates are typically different from U.S. federal tax rates, provincial tax rates must be adjusted so that they are comparable to any U.S. state in the preceding analysis. 6
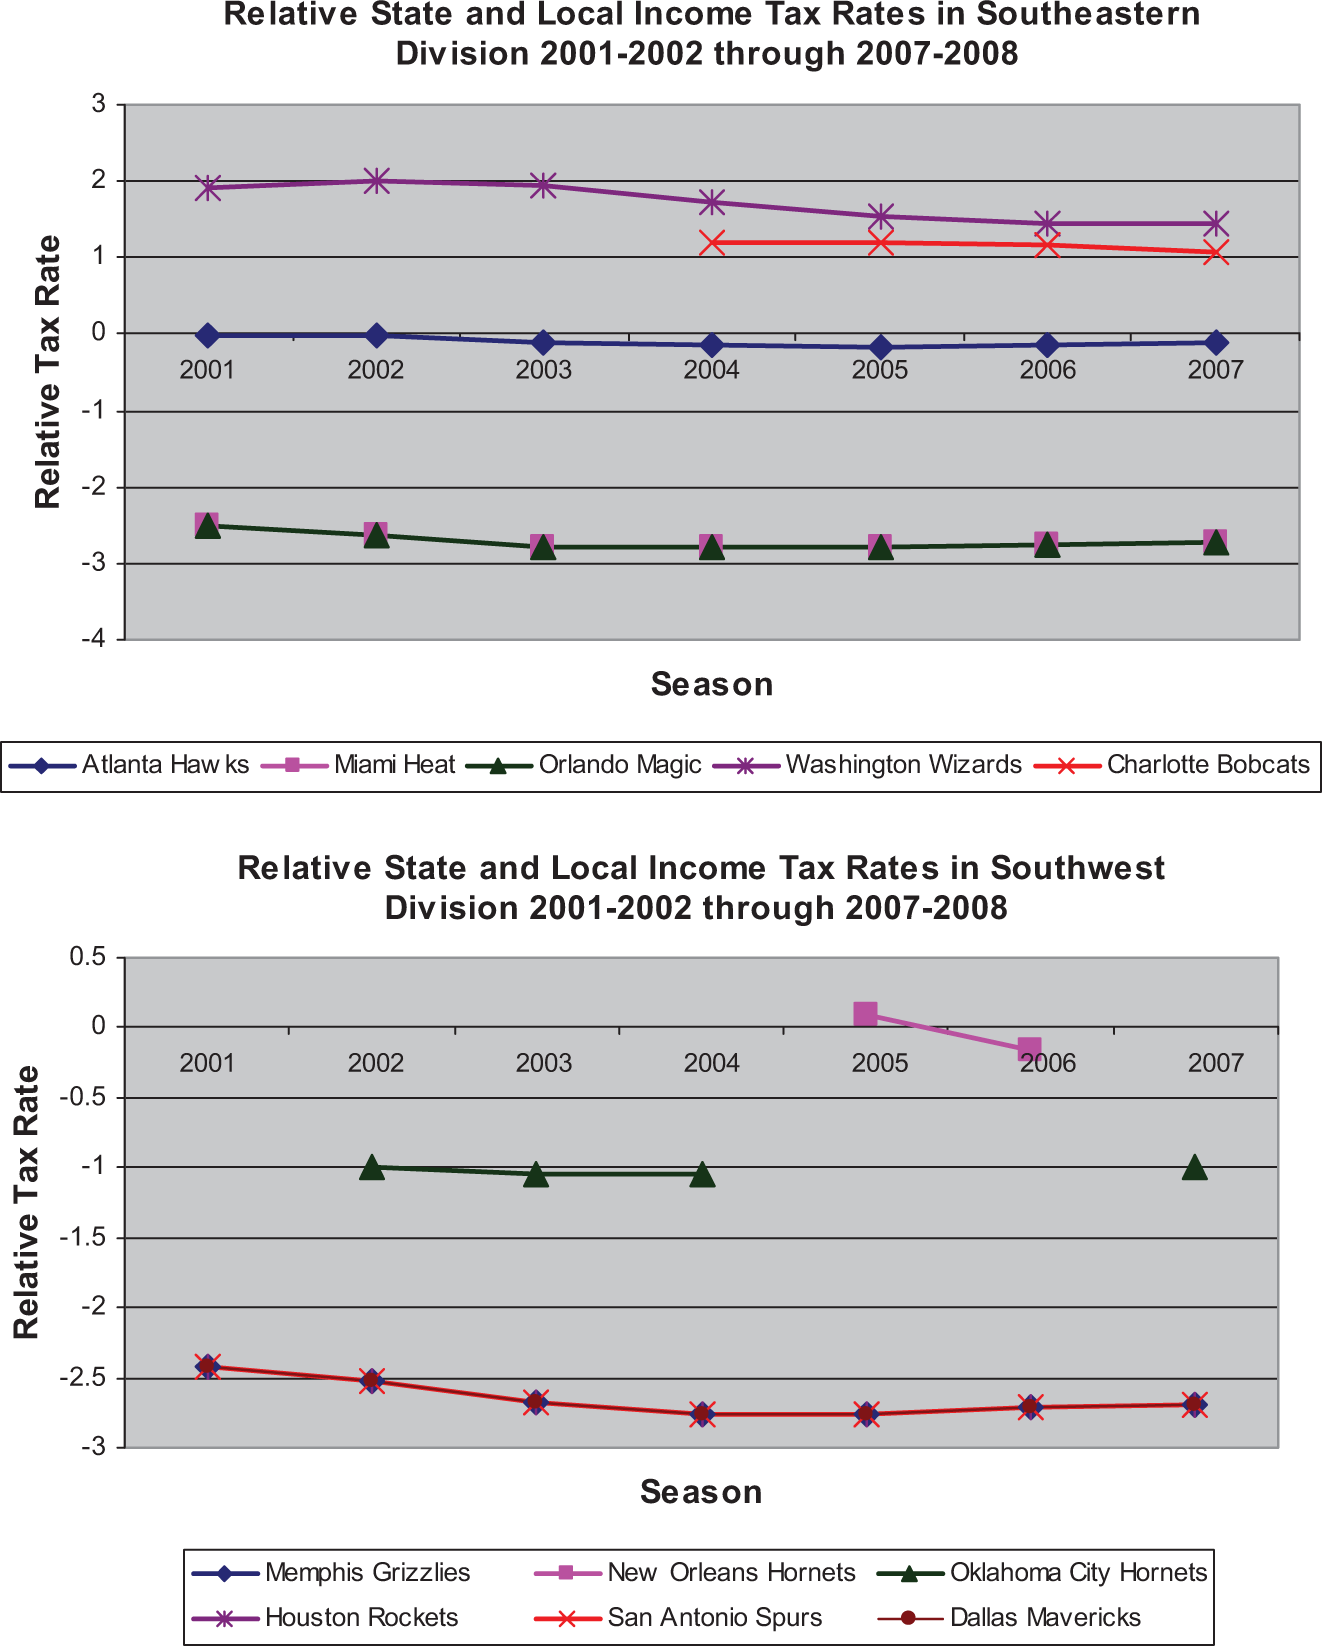
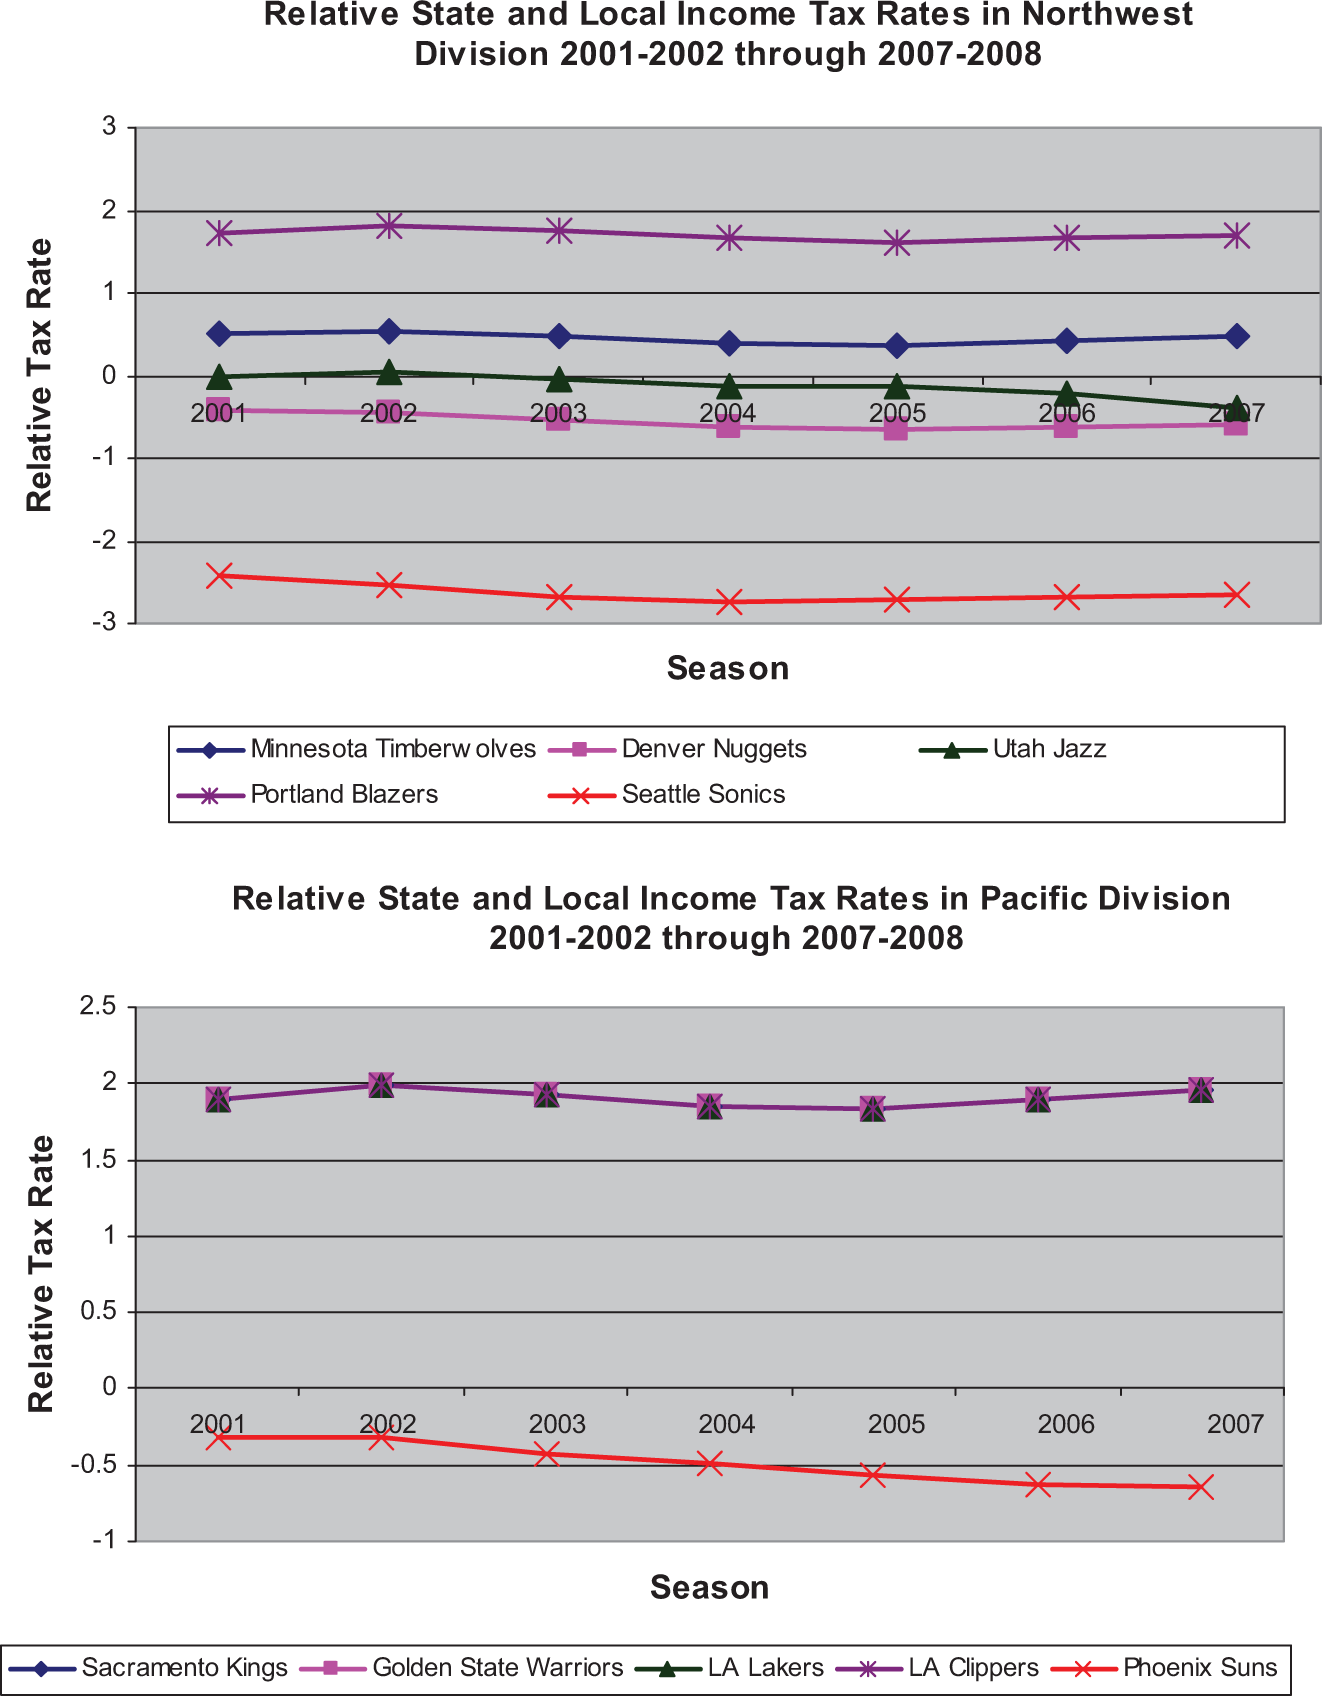
Figure 2 shows the relative income tax rate facing each team between the 2001-2002 and 2007-2008 seasons. After looking over Figure 2, it should be clear that, while the relative tax rate may vary significantly across teams, they may not vary much within teams over time. However, even changes of a fraction of a percentage point, which occur quite frequently within the sample, may represent a large change in after-tax salary. The largest change in relative income tax occurred for those players on the Toronto Raptors between when the U.S. dropped its federal income tax rate from 39.1% in 2001 to 35% in 2003. Players on the New Jersey Nets also experience a change in income tax rates when the New Jersey increased their state income tax from 6.37% in 2003 to 8.97% in 2004. New York State also increased income tax rates from 6.85% in 2002 to 7.7% in 2003, only to return them to 6.85% in 2006.
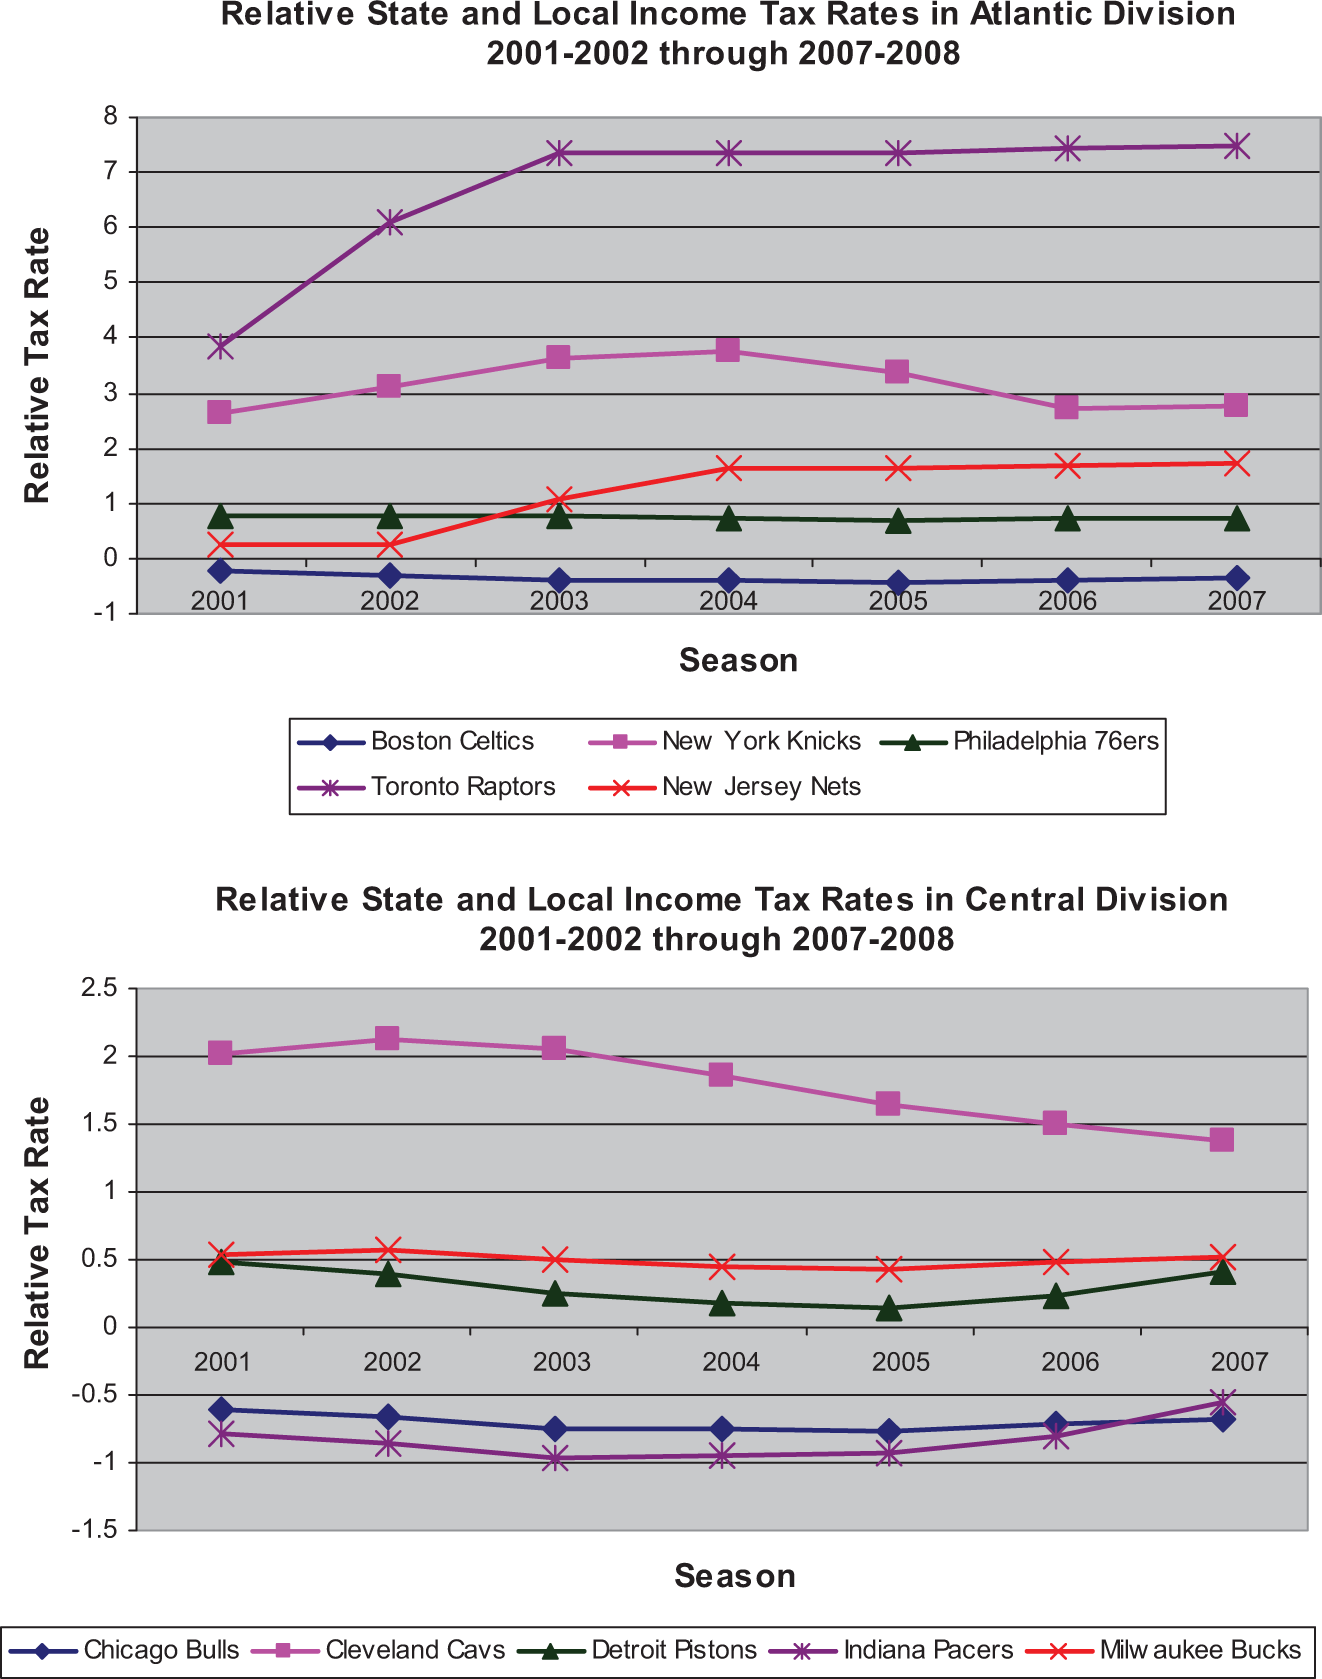
Relative state and local income tax rates in the NBA, 2001-2002 to 2007-2008 seasons.
Figure 3a shows the distribution of relative income tax rates accepted by free agent signees. Figure 3b shows the distribution of relative income tax rates accepted by free agent signees weighted by contract length, and Figure 3c shows the distribution of relative income tax rates facing each team’s players. Since the distributions in Figure 3a and b are nearly identical, we would not expect that there is much correlation between relative tax rates and the length of contract being signed. However, it does appear that those teams with the lowest relative income tax rate are offering shorter contracts. A comparison of Figure 3a to c yields the same conclusion.
Figure 2 (continued)
Empirical Work
I will seek to estimate the causal effect of changes in relative income tax rates on the labor migration decisions and compensation of NBA players. It will be necessary to consider those factors that might affect a team’s ability to recruit a free agent, which are correlated with the relative income tax rate. The factors we will include are the relative sales tax rate, the relative property tax rate, a lag in the natural logarithm of the population (in the MSA), a lag in the natural log of per capita income (in the MSA), a lag in the natural log of employment (in the MSA), the exchange rate (adjusted for purchasing power parity), a lag in the state’s crime rate (per 100,000), a lag in the state’s student–teacher ratio, the team’s wins last season, whether the free agent switches teams, and the amount of money a team can use to attract free agents under the salary cap. Clearly the sales tax and property tax rates ultimately affect a player’s amount of discretionary income, and both are correlated with income tax rates. Population, income, and employment are relevant because they affect consumer demand for basketball, and ultimately may affect the salary a team is willing to offer free agents, while at the same time they may be correlated with a change in income tax rate. The hope here is that if taxes change in response to economic problems that also adversely affect an NBA team, then those economic problems can be fully explained by changes in population, income, and employment. The crime rate and student–teacher ratio may be reasons why tax rates increase. For example, if a state decides to increase expenditures in response to a high crime rate in order to pay for additional police officers or longer prison terms, they may have to increase tax rates to finance the additional spending. A similar argument would hold for a response to school quality, so both crime rate and student–teacher ratio may be correlated with changes in the relative income tax rate, while they may also be correlated with a player’s preferences. 7 A team’s wins last season might increase labor supply, since players may be more willing to play for a winning team. Whether a player resigns with a team may also ultimately affect the amount of money that a team can offer, through the “Larry Bird” family of exceptions. The amount of money a team has to spend on free agents may also affect whether a given free agent signs with a team, both through the direct effect of increasing the likelihood of a higher salary offer and through the indirect effect of being able to improve the team by attracting other top-quality free agents. We include lags for some variables because it would be impossible for a free agent to estimate the current value of things such as population counts or crime rates since these data are usually gathered with a lag. We will focus on the differences between a free agent’s signing team and the overall average of all other teams, which best represent a free agent’s outside option in the available data, since we do not know which other teams have given offers to a free agent.
My empirical model takes the form

Note that if the model takes the form shown above, then β1, the coefficient on TAX ct in Equation 1, is identified by a change in the skill of free agent signees within a team-city pairing brought about by a change in the relative income tax rate faced by a team’s players over time. In the same fashion, γ1, the coefficient on TAX ct in Equation 2, is identified by a change in the natural logarithm of annual salaries of free agent signees within a team-city pairing brought about by a change in the relative income tax rate facing a team’s players over time. So β1 represents the average change in the measured skill level of free agent signees, which is brought about by a one-percentage point change in the relative income tax rate, and γ1 represents the average change in the natural logarithm of the annual salary of free agent signees, which is brought about by a one-percentage point change in the relative income tax rate. If the majority of changes in the tax rate differentials are capitalized in the average salaries of free agent signees, then we would expect little or no effect on the change in skill level of free agent signees brought about by changes in the relative income tax rate (Wallace, 2002). However, if changes in the tax rate differential are not capitalized in the average salaries of free agent signees, then we may expect large changes in the skill level of free agent signees brought about by changes in the relative income tax rate (Wallace, 2002). Due to the identification strategy that is employed here, if we believe that any factor that we have chosen to ignore is time invariant, then omitting these factors will not change our results.
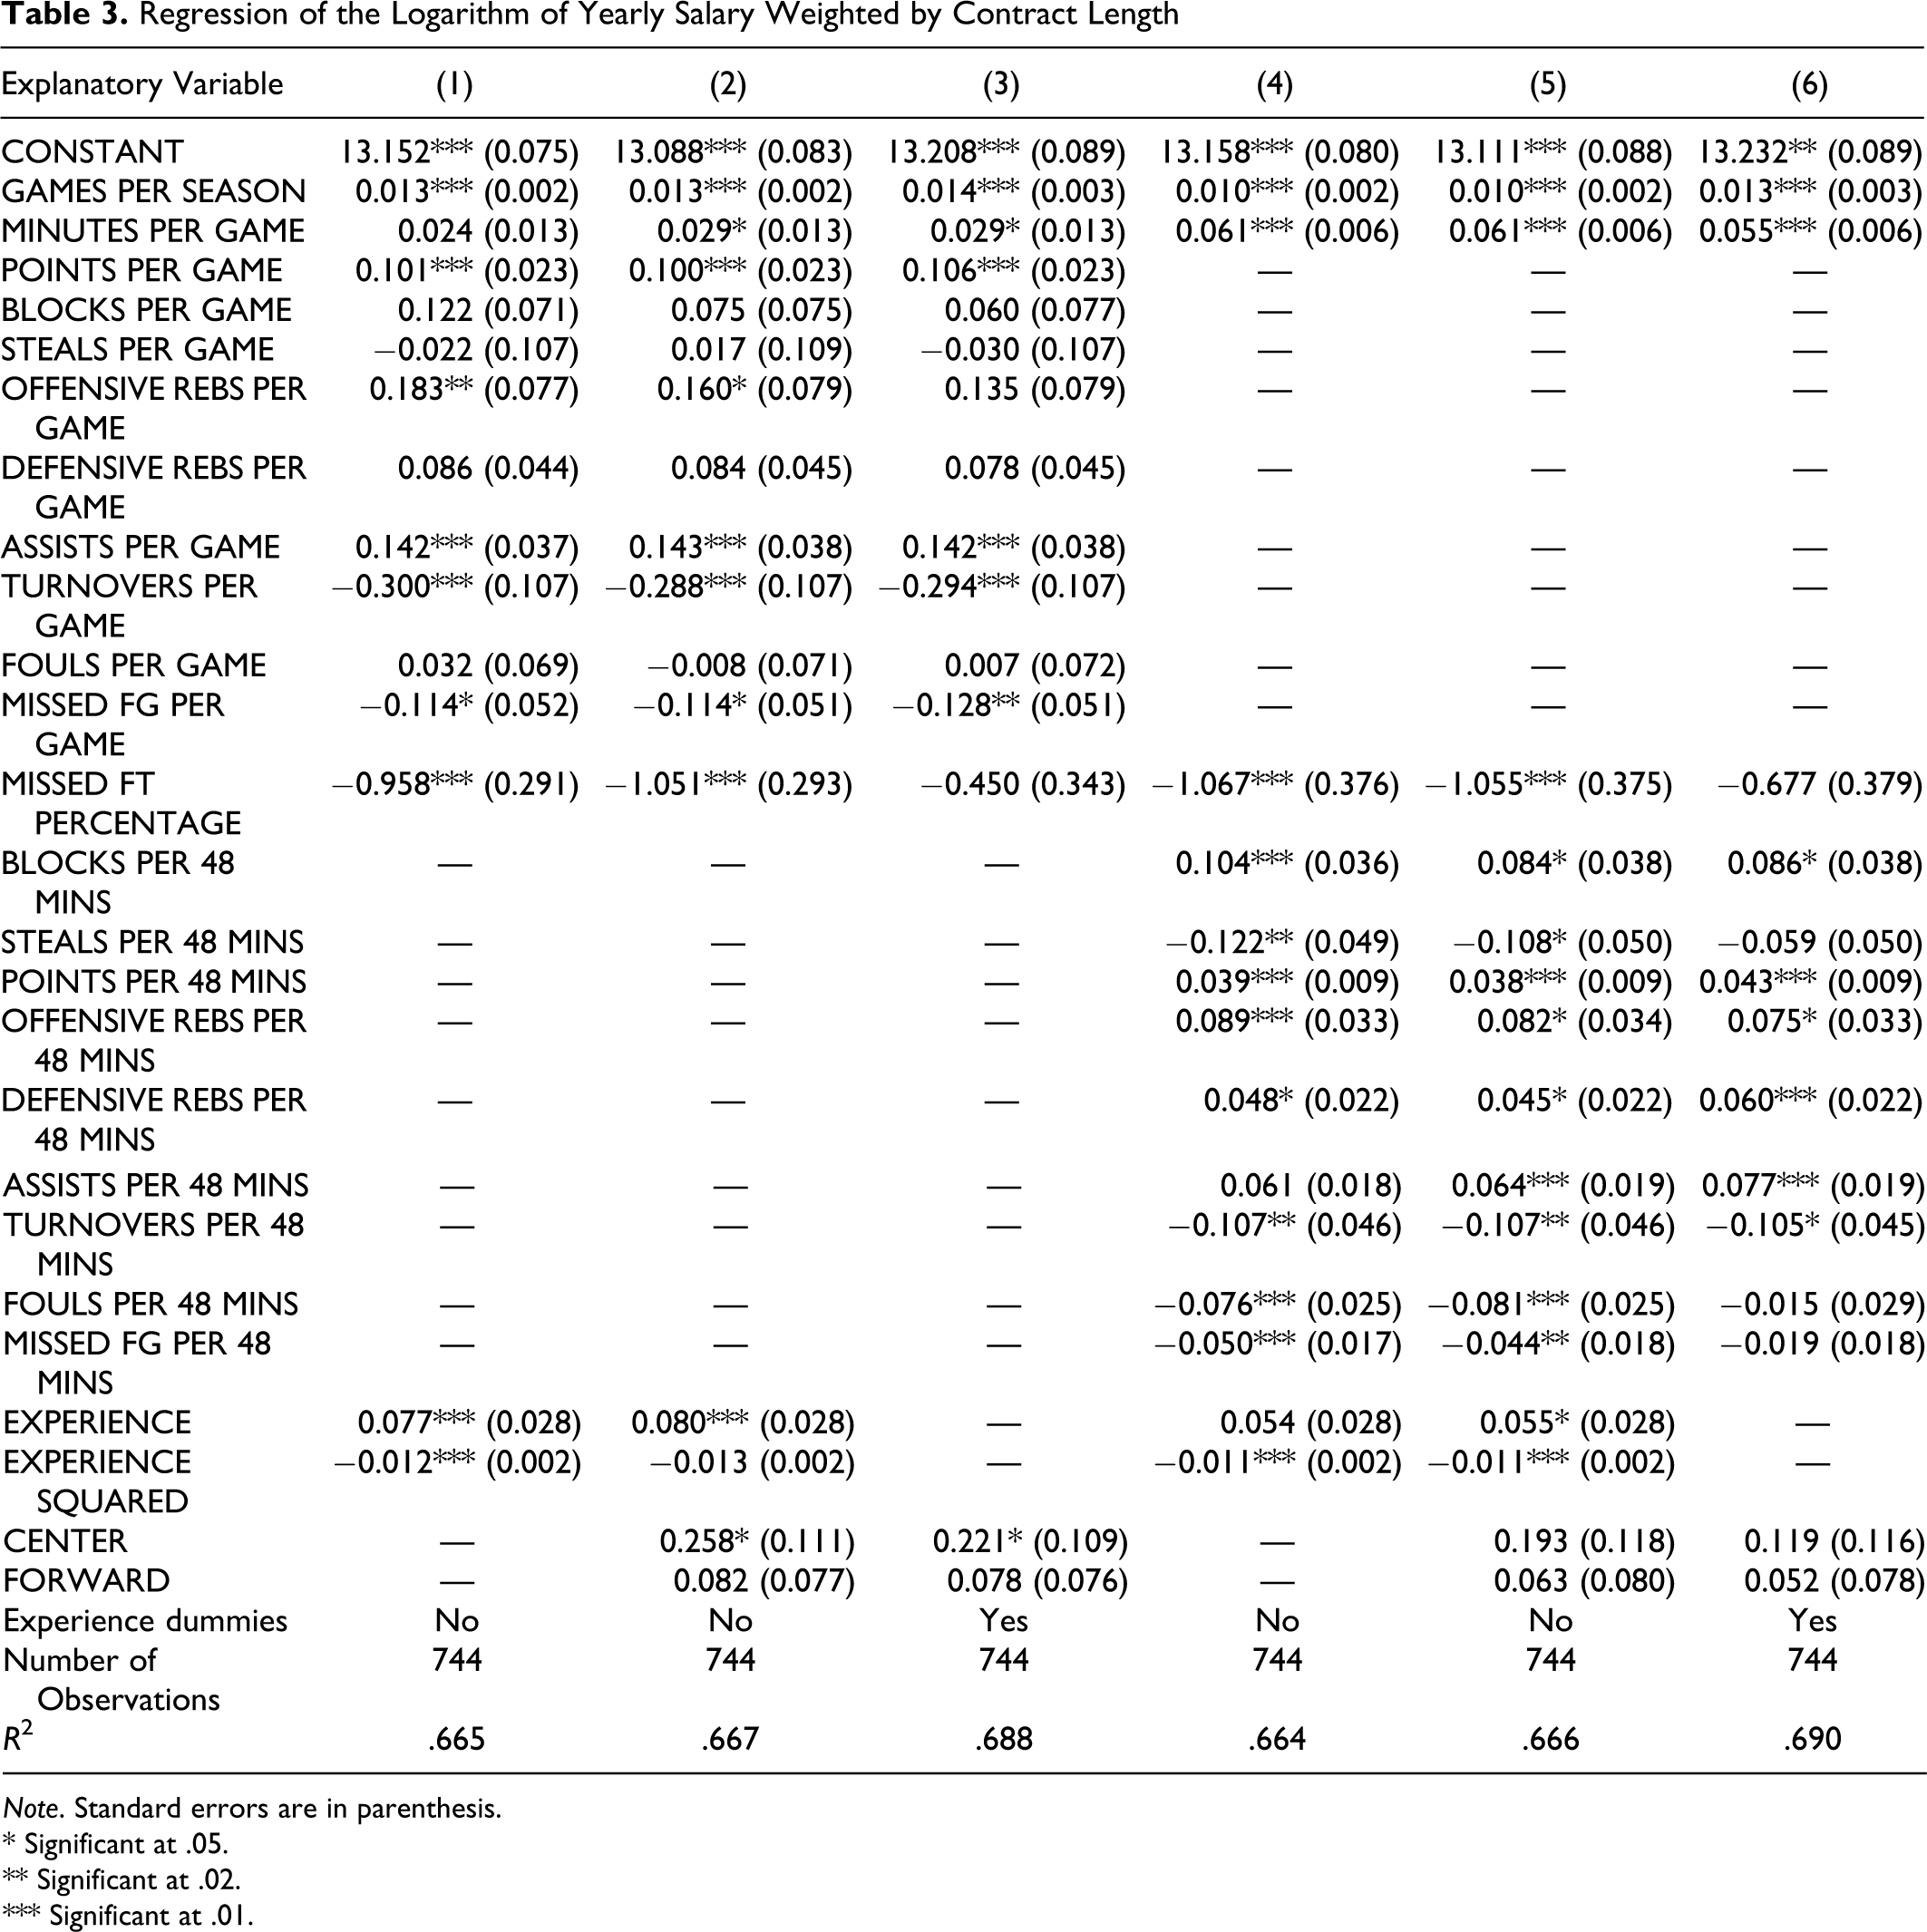
The problem that remains is that skill is difficult to measure. The many statistics that are measured by the NBA can be combined to create a proxy for skill. We will use the market value of these statistics to index free agent skill. To determine the market value of each statistic, we run the regression of the natural logarithm of the average annual salary of the contract signed by each free agent on the statistics that each free agent has put up over the preceding years of his career, on a per game or per 48 min basis. The predicted value of this regression will then represent the measured skill of each free agent signee. The results of this regression are shown in Table 3 .
Regression of the Logarithm of Yearly Salary Weighted by Contract Length
Note. Standard errors are in parenthesis.
* Significant at .05.
** Significant at .02.
*** Significant at .01.
Specifications 1–3 show the regression of the natural logarithm of average annual salary on per game statistics over the career of each free agent prior to their contract signing, while specifications 4–6 show the regression of the natural logarithm of average annual salary on statistics which are calculated per 48 min (the length of one full NBA game) over the career of each free agent prior to their contract signing. Specifications 4–6 should adjust upward the measured relative skill level of any “highly skilled” free agent who has not played a large number of minutes per game throughout his career and adjust downward the relative skill level of any “low skilled” free agent who has played a high number of minutes per game throughout his career.
From Table 3, we get many expected results. For instance, a free agent’s annual salary seems to be positively correlated with seasons played, games played per season, and minutes played per game, as well as points, blocks, rebounds, and assists per game (or per 48 min), and a free agent’s annual salary seems to be negatively correlated with turnovers, fouls, missed field goals, and missed free throw attempts per game (or per 48 min). However, steals, which are generally thought to be a positive statistic, tend to be somewhat negatively correlated with salary. One reason why this might be the case is that it is generally the shorter players which get the most steals. To the extent that this height difference is not fully captured by differences in position, it might be captured in the steals statistic in the form of lower salaries since we have not included a height variable in the regression equation. On average, centers make more than both forwards and guards, and forwards make more than guards, although this result is not statistically significant.
Using the predicted values of the regression in Table 3 (Column 2), we can estimate the average skill level of free agent signees for each team in the NBA over the seasons in our sample. Figure 4a plots the average skill level of free agent signees for each team against the average tax rate for each team relative to the rest of the league. The average skill level of each team’s free agent signees is negatively correlated with the relative income tax rate facing each team’s players. Figure 4b plots the average salary of each team’s free agent signees against the average tax rate for each team relative to the rest of the league. The average salary of each team’s free agent signees is positively correlated with the relative income tax rate facing each team’s players.
Figure 2 (continued)
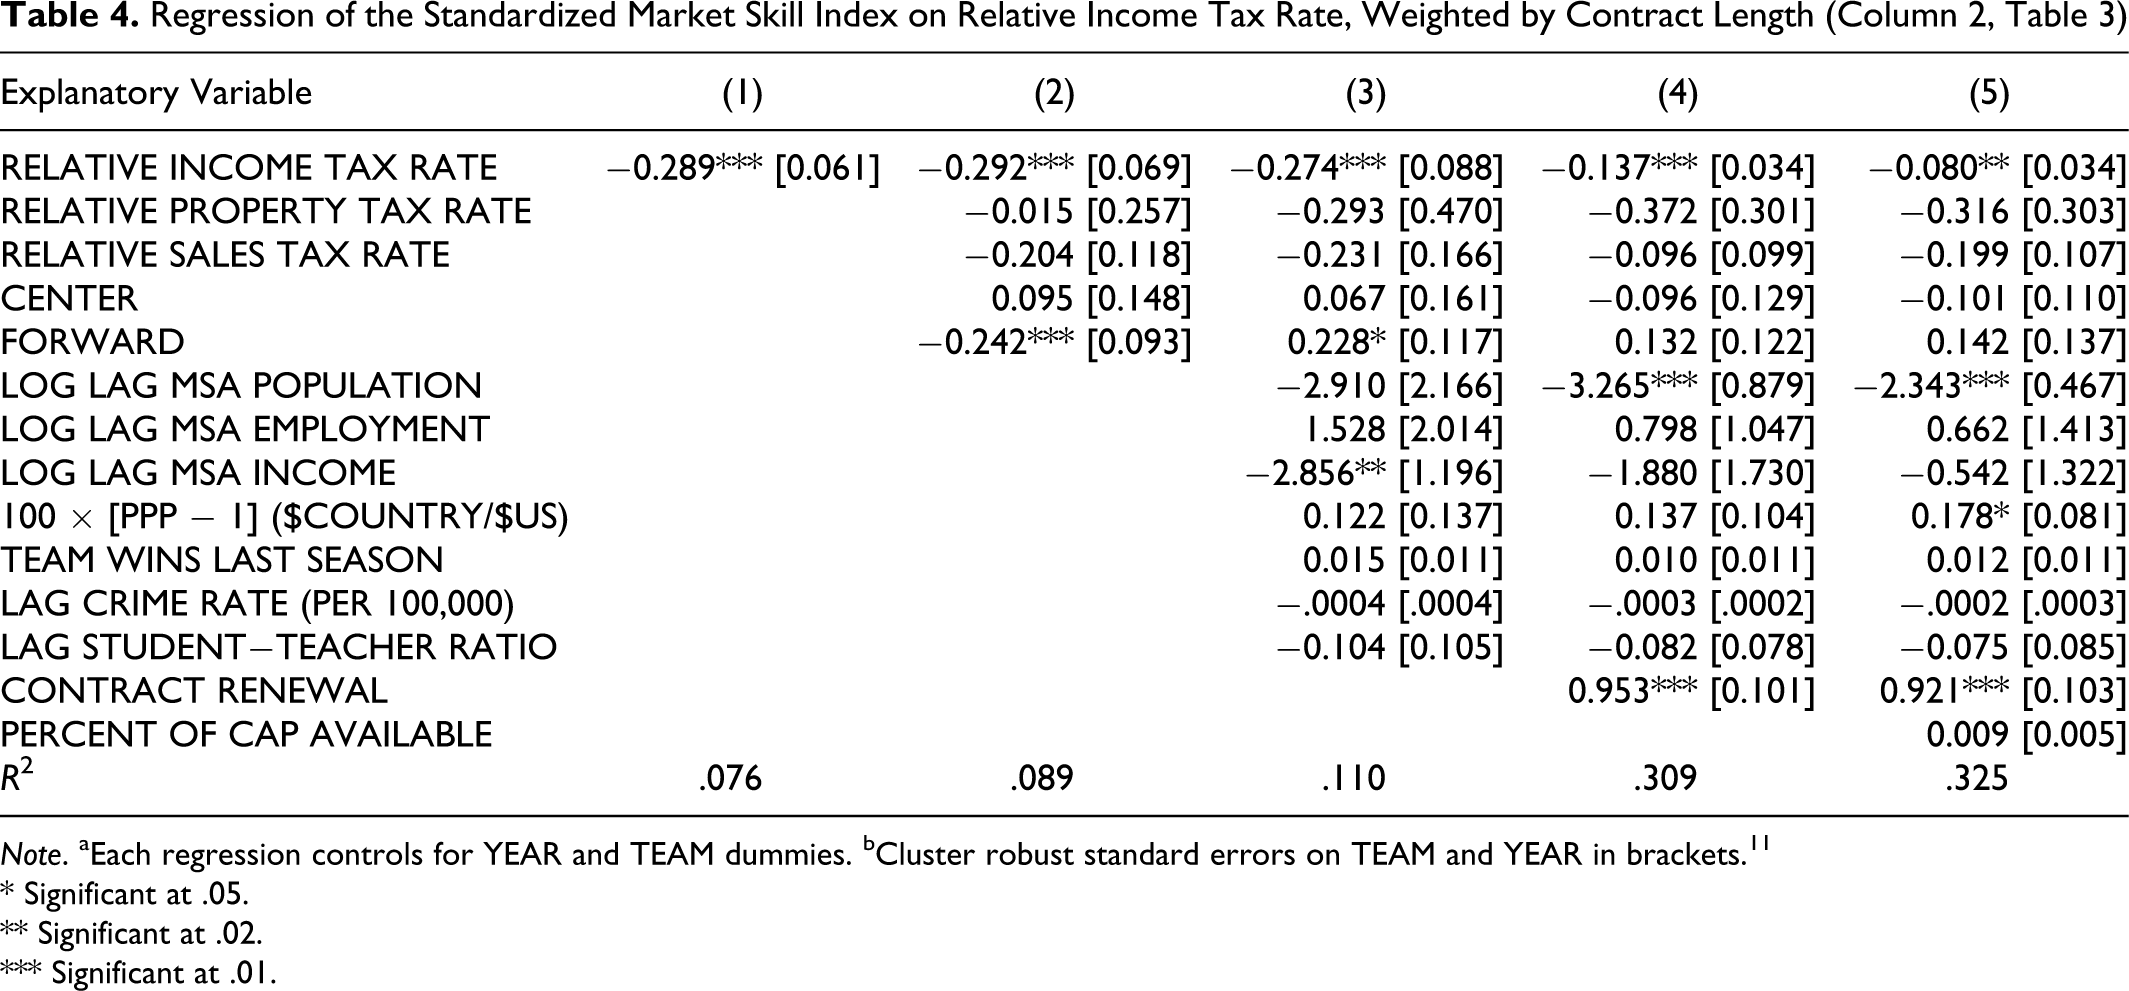
We can then standardize the predicted values of the regression from Table 3 to put our measure of skill into units that we can more easily interpret. We then run the regression in Equation 1. The regression results are shown in Tables 4 and 5 .8,9 Whether we look at Table 4, which uses a performance per game measure as the dependent variable, or Table 5, which uses a performance per 48 min measure, we find that decreasing the marginal income tax rate by 1 percentage point in our full specification leads to a 0.080–0.088 standard deviation increase in the skill of the average free agent signee for a given team, ceteris paribus. This effect is both economically and statistically significant. 10
Regression of the Standardized Market Skill Index on Relative Income Tax Rate, Weighted by Contract Length (Column 2,
Note. aEach regression controls for YEAR and TEAM dummies. bCluster robust standard errors on TEAM and YEAR in brackets. 11
* Significant at .05.
** Significant at .02.
*** Significant at .01.
Regression of the Standardized Market Skill Index on Relative Income Tax Rate, Weighted by Contract Length (Column 5,
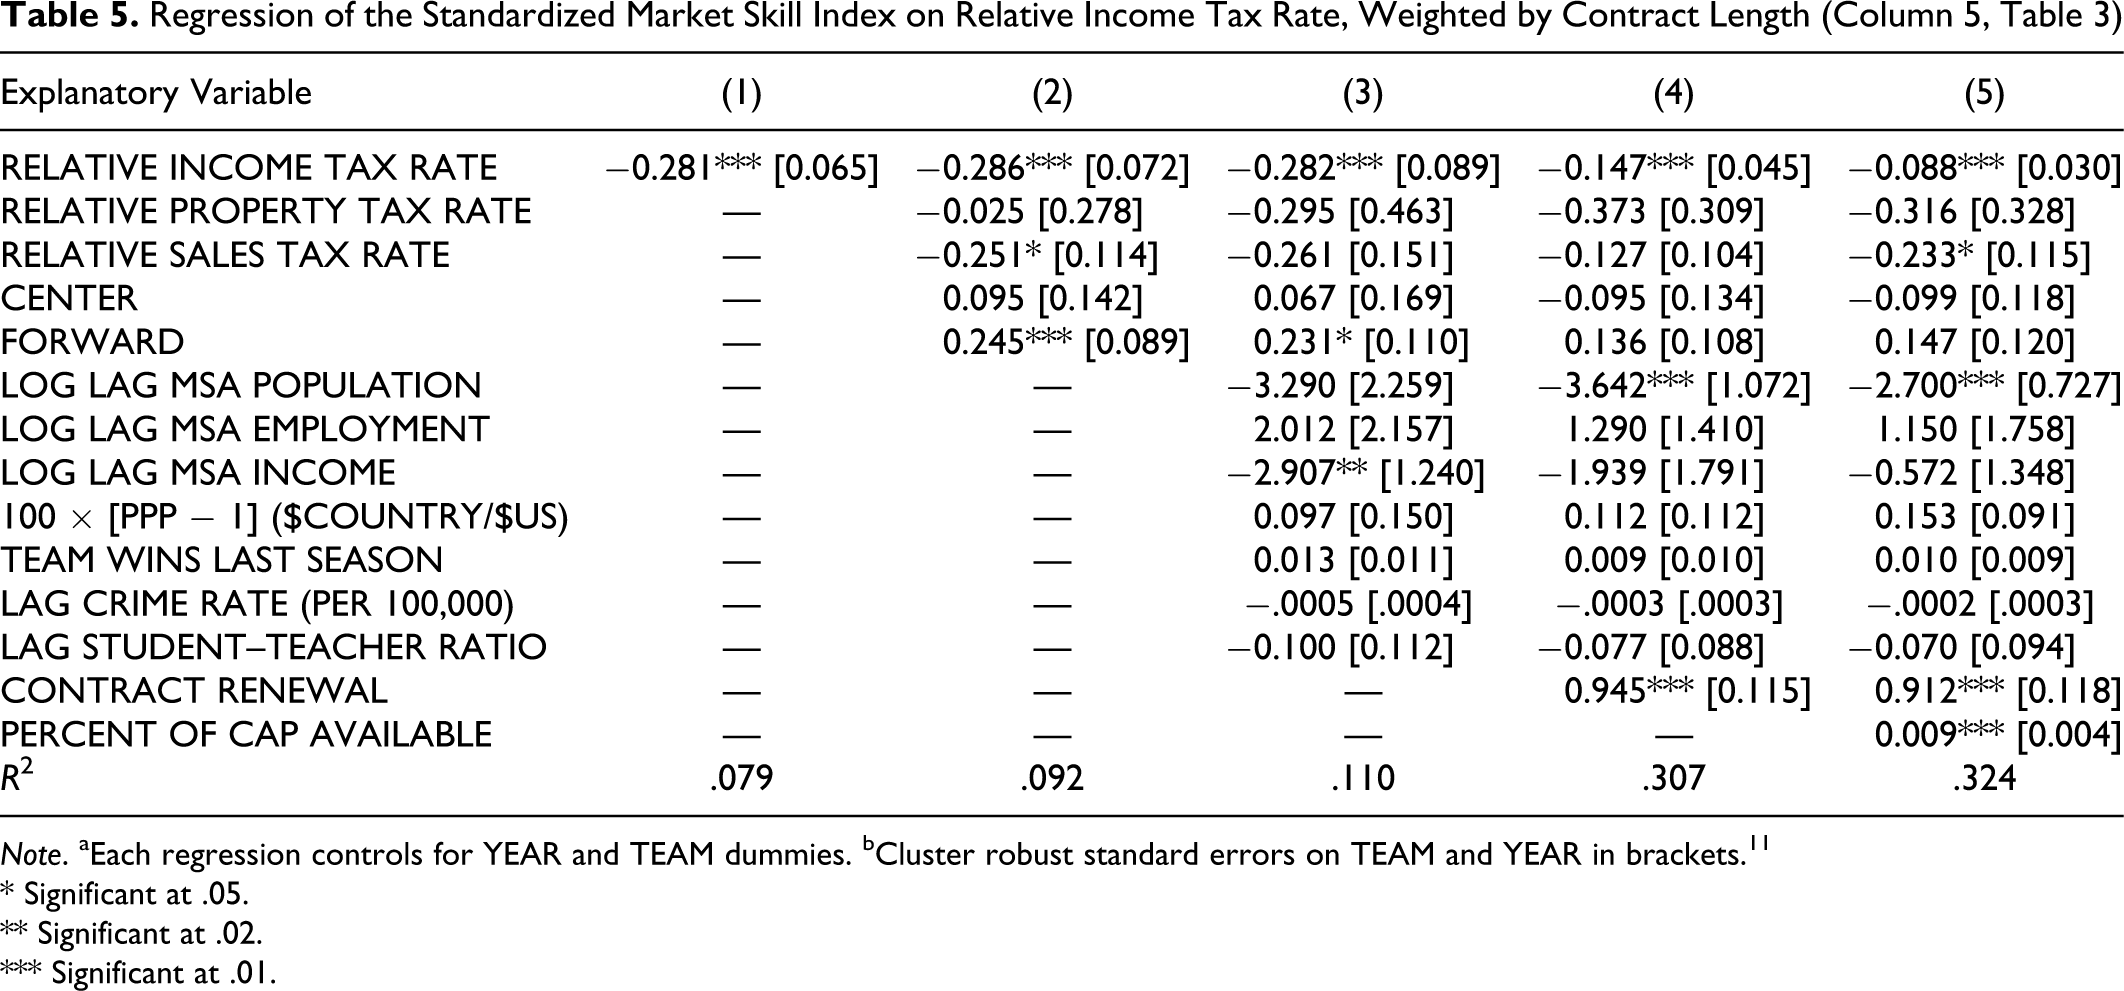
Note. aEach regression controls for YEAR and TEAM dummies. bCluster robust standard errors on TEAM and YEAR in brackets. 11
* Significant at .05.
** Significant at .02.
*** Significant at .01.
As Wallace (2002) suggests, since the skill of free agent signees responds to changes in the relative income tax rate, it must be the case that teams do not fully compensate all free agents for the income tax differential. While it appears that free agents are, on average, reacting to changes in the marginal income tax rate, it is still possible that some teams are able to compensate some free agents for changes in the relative income tax rate in order to sign them. Therefore, it remains to check whether any of the changes in the relative income tax rate are capitalized in the salaries of free agent signees. These results are found in Table 6 . Theoretically, to fully compensate a player for a 1% increase in tax rates, salaries must increase by approximately 1.01%. Therefore, if any team is able to compensate some free agents for changes in the relative income tax rate in order to sign them, then we would expect a positive coefficient on the relative income tax rate which is less than 0.0101. However, none of our specifications led to a coefficient on the relative income tax rate which is statistically significant, and all of the specifications lead to a negative coefficient. Therefore, we are able to learn very little about how changes in relative income tax rates affect the salaries of free agent signees. However, it is not hard to believe that teams in the NBA are too financially constrained to be able to compensate free agents for any income tax differential, as we have discussed in previous sections.
Regression of the Logarithm of Average Annual Salary on Relative Income Tax Rate, Weighted by Contract Length
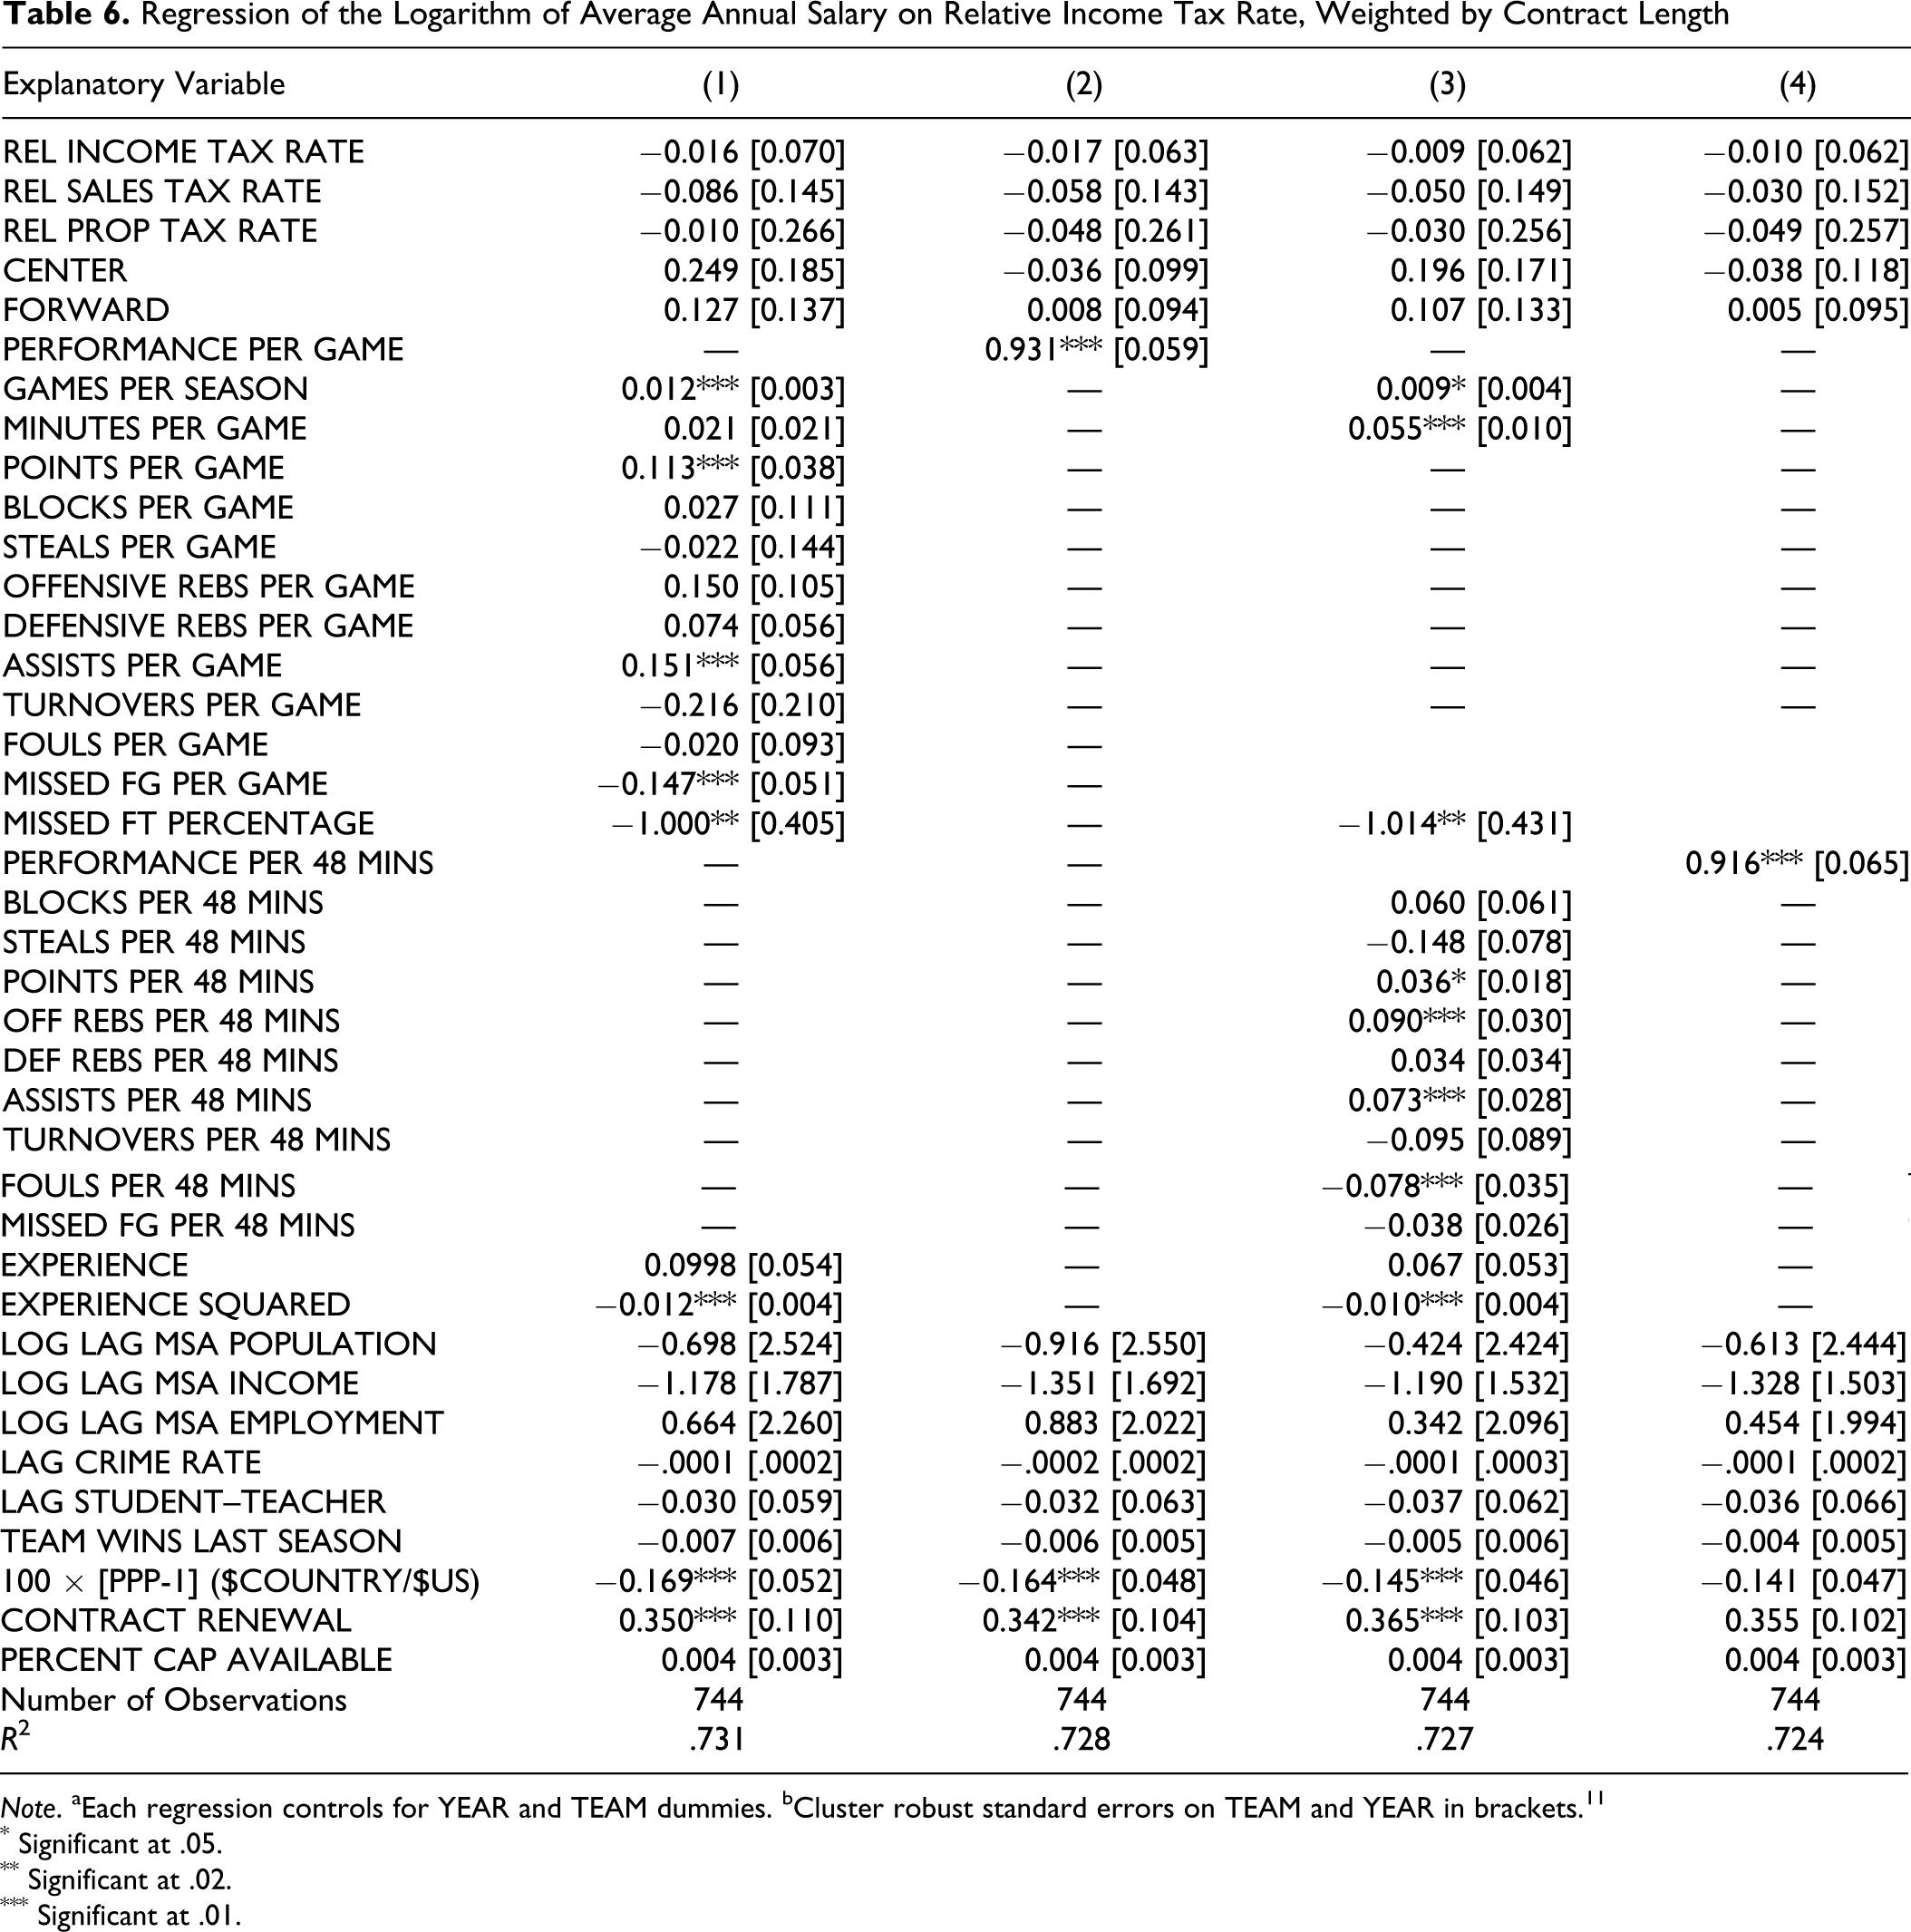
Note. aEach regression controls for YEAR and TEAM dummies. bCluster robust standard errors on TEAM and YEAR in brackets. 11
* Significant at .05.
** Significant at .02.
*** Significant at .01.
To further illuminate the effect of a 1 percentage point fall in the relative income tax rate, we can convert the 0.080 standard deviation increase in the skill of the average free agent signee to a dollar figure that comes from the market price of the incremental increase in skill. In particular, by taking an approximation around the average performance per game measure, we find that a 1 percentage point fall in the relative income tax rate leads to an average free agent signee skill increase worth $231,260 per year. However, if the average free agent were to be taxed an additional 1 percentage point on their average log salary, the tax would amount to only an additional $30,019. This does seem like an extremely large effect for such a relatively small amount of money. We would think that if a team were able to pay an extra $30,019, on average, to a free agent, then they could fully compensate them for a 1% tax differential. However, there are a few reasons why this might be plausible. Since the most highly skilled free agents will usually earn maximum contracts with a maximum contract length, it is impossible for relatively high income tax teams to compensate these free agents for any tax differential. Since teams may be strained financially, free agents may opt to take even a little more in after-tax dollars to play for teams with lower tax rates. Furthermore, since the skill distribution of free agent signees is very spread out (standard deviation in performance per game is 0.92, which translates into roughly $2,676,123 in terms of market worth), and there are a limited number of free agent signees each year (an average of 93 or approximately 3 per team), a change in relative income tax rates that attract or discourage only one or two free agents from signing may result in large resulting skill differences among free agents signees. Figure 5 makes this increasingly clear. Each bar in Figure 5 is split into 0.080 standard deviations of the skill variable. If we use 2001 as an example, we can see that in the tails of the distribution there are often one or fewer free agent signees in any 0.080 standard deviation area.
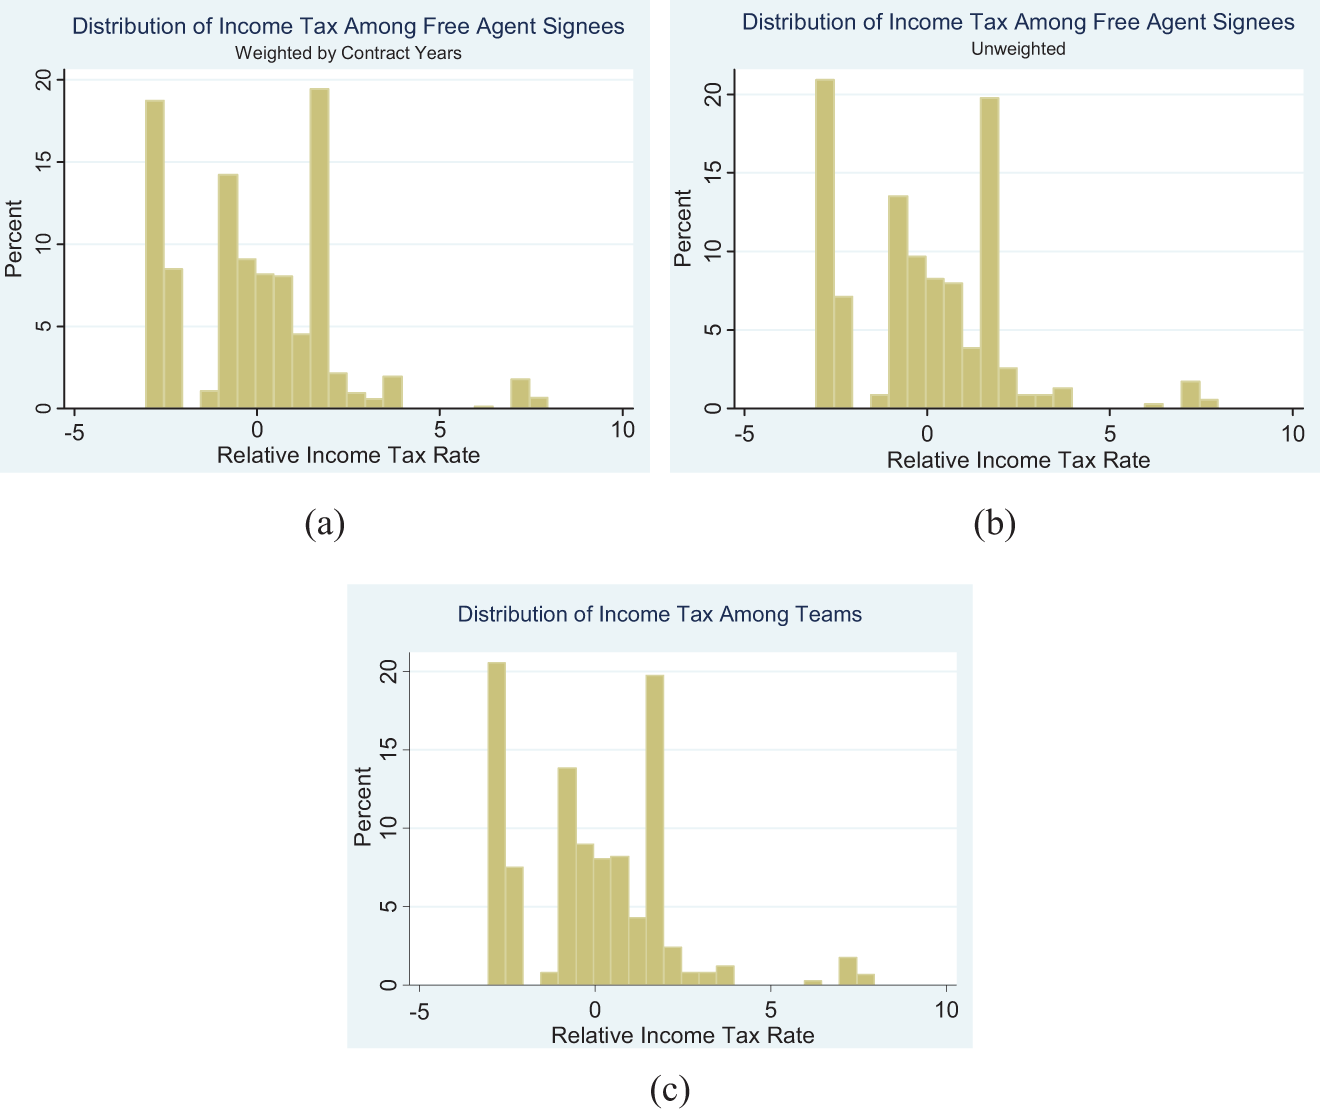
Distribution of income tax rates in the NBA, 2001-2002 to 2007-2008 seasons.
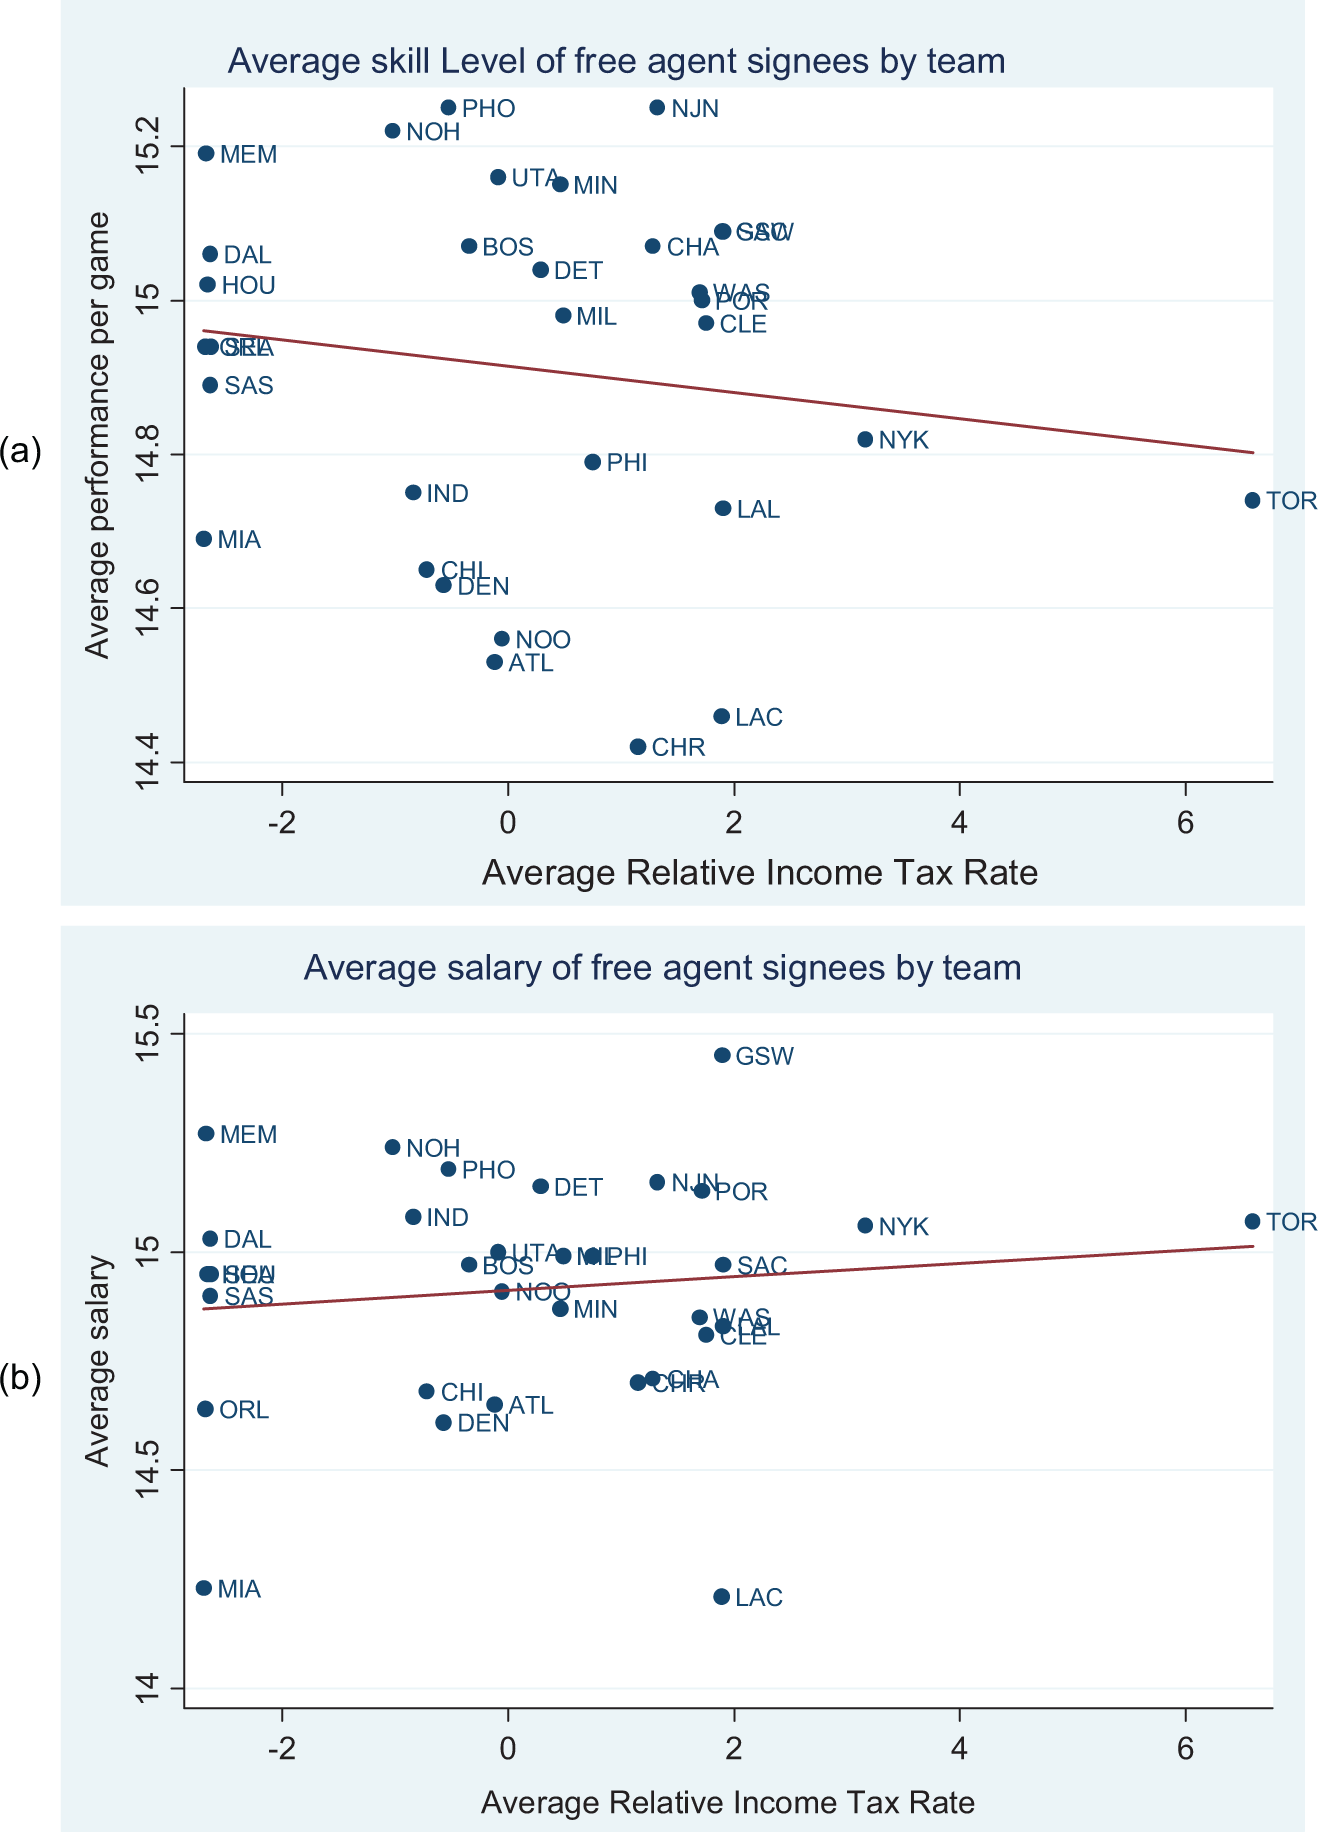
Average skill level and salary of free agent signees by team.
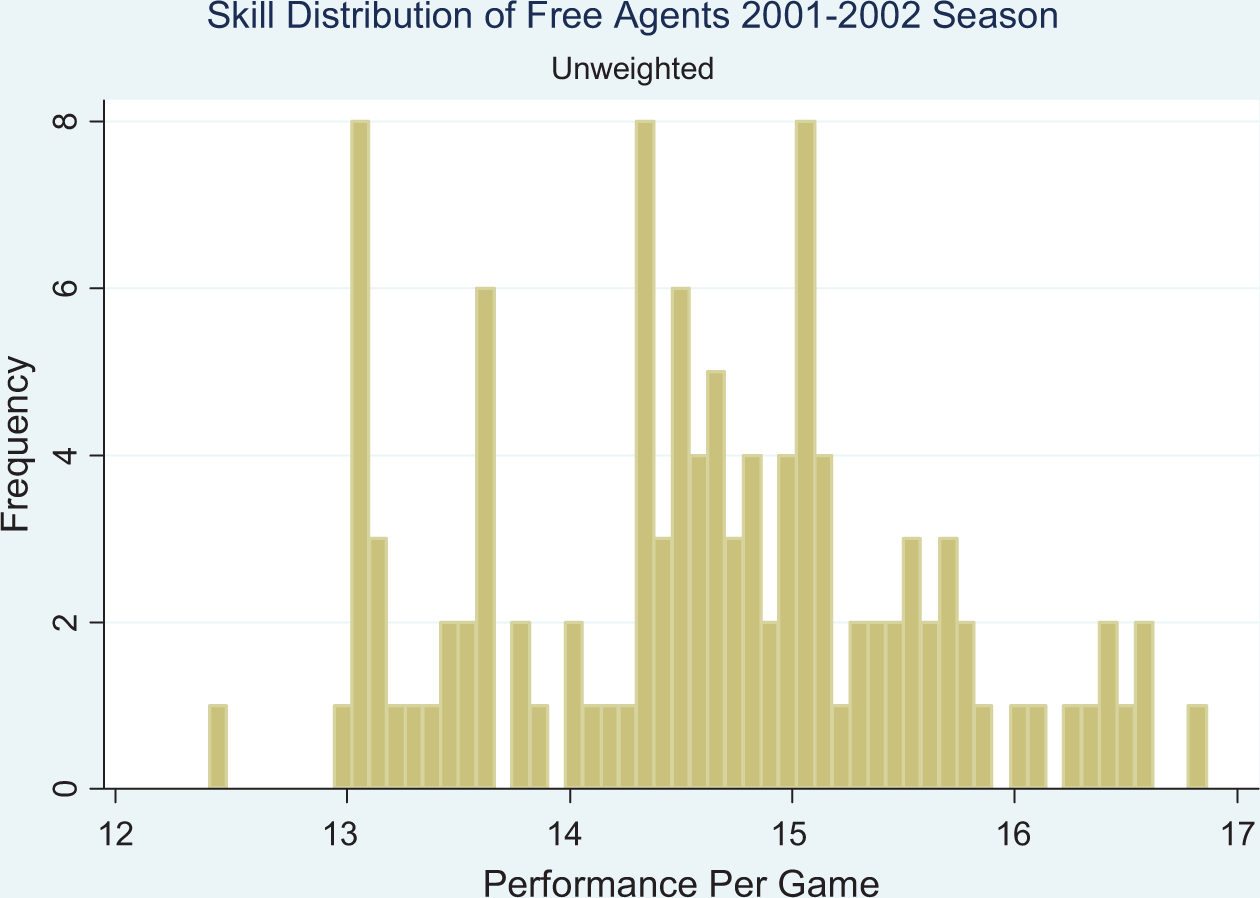
Skill distribution of free agents, 2001-2002 season.
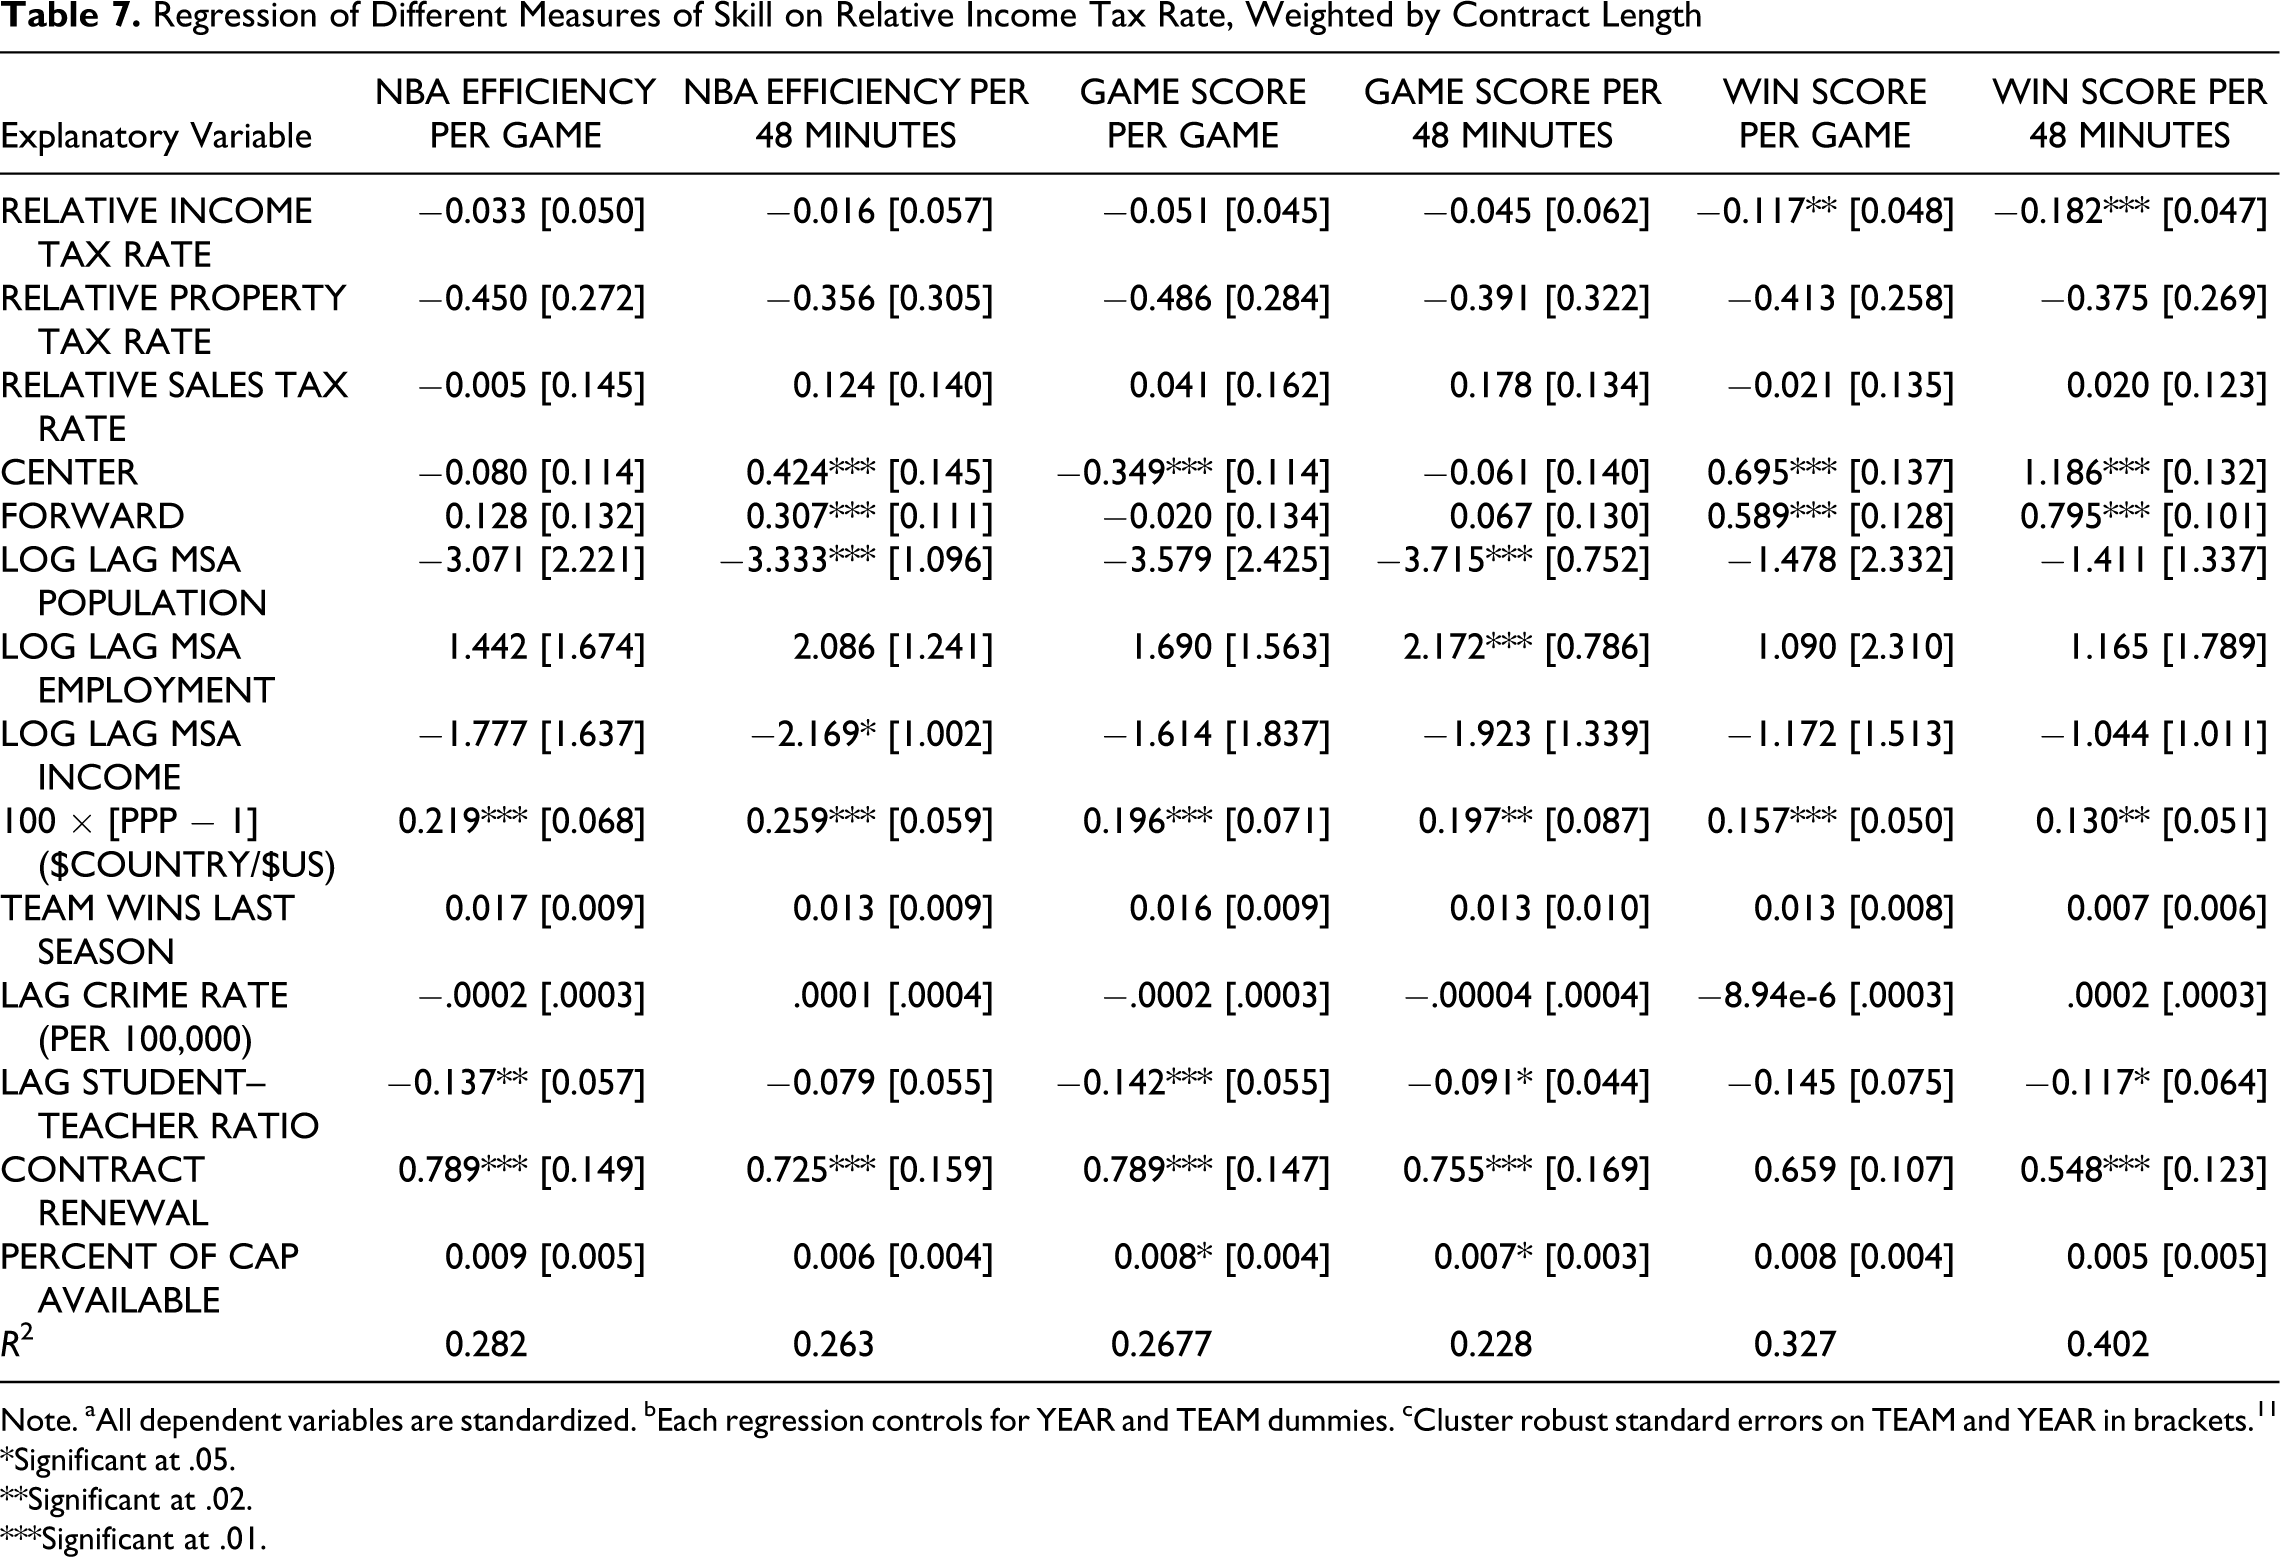
Next, I decide to look at other metrics of NBA performance to see if they show corroborating results. Specifically, I look to the NBA Efficiency, Game Score, and Win Score measures of performance, since they are easily calculated using our data set. NBA efficiency is a statistic that is reported by the NBA website, and it is believed that many coaches and executives rely on the NBA efficiency measure to evaluate player performance (Berri, Schmidt, & Brook, 2006). Game score is a measure created by sports writer John Hollinger in order to measure single game performances. Win score is a measure created by economist David Berri from a regression of team wins on points scored and points allowed per possession (Berri, et al., 2006). Despite its name, NBA efficiency measures performance quite inefficiently; it is a linear combination of box score statistics, all with equal weight. Game score gives different weight to the statistics that John Hollinger felt “evaluate players in a fashion consistent with what NBA observers would believe” (Berri, 2006). The win score measure does slightly better by giving more weight to those box score statistics that are more closely correlated with winning or losing games. A major downfall of all three of these measures is that they measure only box score statistics, and thus give no added value to experience. The results are shown in Table 7 .
Regression of Different Measures of Skill on Relative Income Tax Rate, Weighted by Contract Length
Note. aAll dependent variables are standardized. bEach regression controls for YEAR and TEAM dummies. cCluster robust standard errors on TEAM and YEAR in brackets. 11 *Significant at .05.
**Significant at .02.
***Significant at .01.
Decreasing the relative income tax rate by 1 percentage point leads to a 0.117 standard deviation skill increase in the average free agent signee for a given team, as measured by win score per game, or a 0.182 standard deviation skill increase as measured by win score per 48 min. These results are statistically significant at the 2% and 1% level, respectively. The coefficient on relative income tax rate when the dependent variable is NBA efficiency (per game or per 48 min) or game score (per game or per 48 min) is negative, although not statistically significant. We might believe this is because NBA efficiency and game score are not very accurate measures of skill (Berri, 2006). It does seem that a decrease in relative income tax rates leads to an increase in the skill of free agent signees, regardless of how skill is measured.
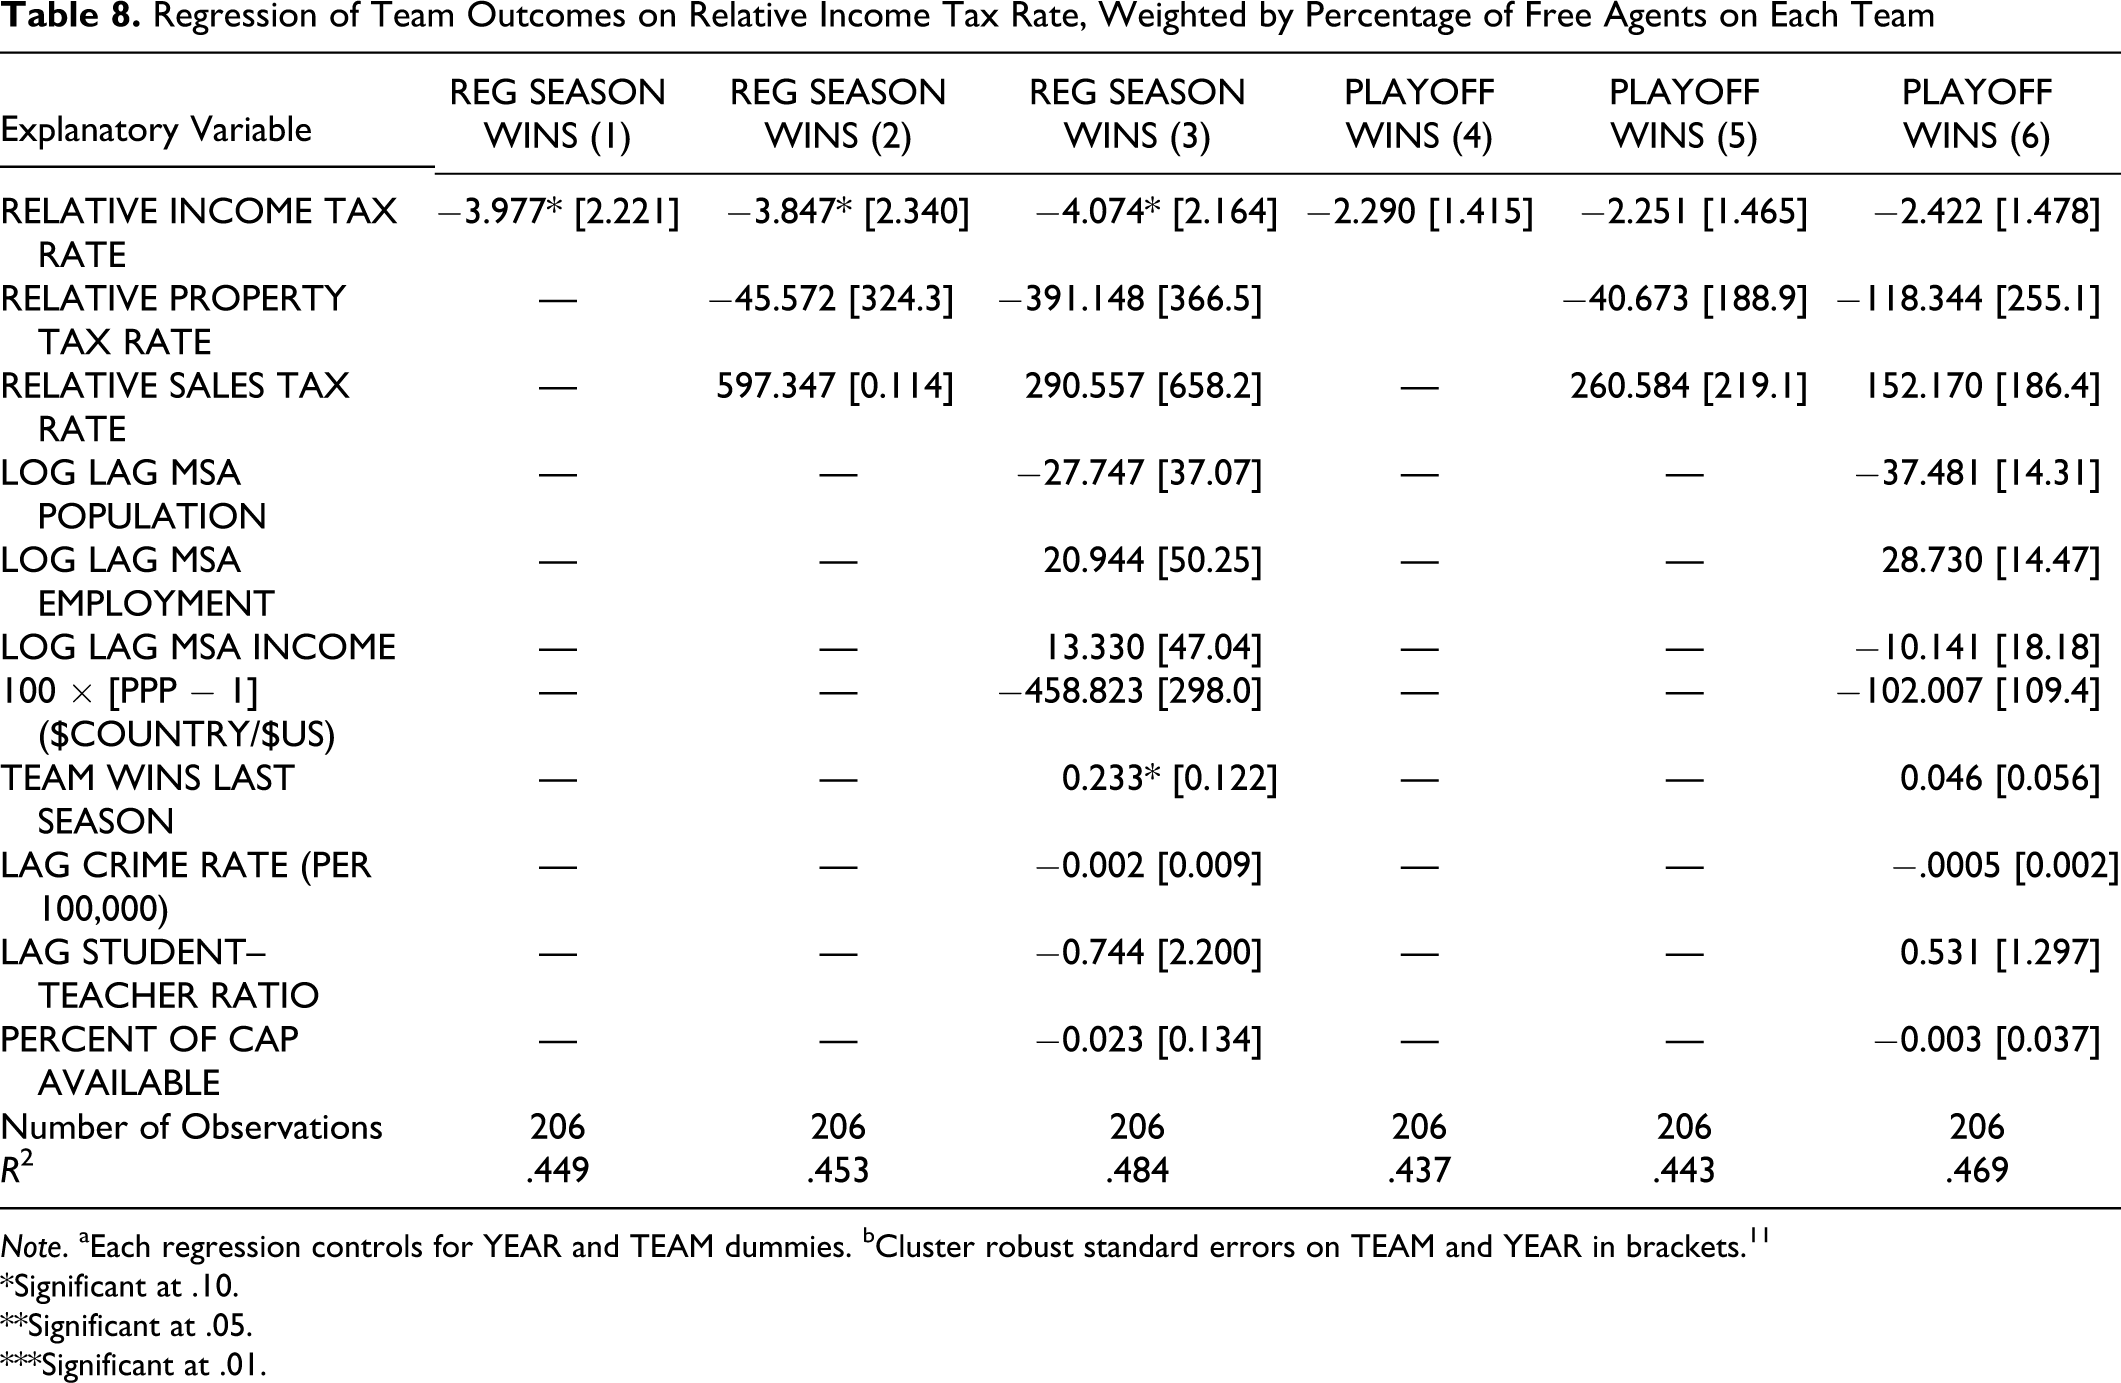
As has been argued thus far, we find that decreasing the marginal income tax rate leads to an increase in the skill of the average free agent signee for a given team. If this is the case, then we might expect that team success might be significantly affected by a change in tax rates. This is shown in Table 8 . We find that decreasing the relative income tax rate by 1 percentage point is associated with 4.074 more regular season wins in that season in the full specification. This result is significant at the 10% level. We also find that decreasing the relative income tax rate by 1 percentage point is associated with 2.422 more playoff wins in that season in the full specification. This result is not significant at the 10% level, although it is extremely close given a small sample size of 206 team-season observations.
Regression of Team Outcomes on Relative Income Tax Rate, Weighted by Percentage of Free Agents on Each Team
Note. aEach regression controls for YEAR and TEAM dummies. bCluster robust standard errors on TEAM and YEAR in brackets. 11
*Significant at .10. **Significant at .05. ***Significant at .01.
Conclusion
By using a data set of professional basketball players' contracts from the 2001-2002 to 2007-2008 seasons, which has rich uncensored data on worker productivity, I am able to identify the effect that changes in state and local income tax rates have on the labor migration decisions of high-income NBA free agents. I find, after controlling for other observable characteristics of teams, cities, states, and MSAs, that an increase in the relative income tax rates faced by players on a given team leads to a decrease in the average skill of the free agents that team is able to sign.
While it is difficult to measure skill, we determine the value that teams in the NBA attach to different player attributes by regressing the natural logarithm of annual salary on a free agent’s career statistics prior to signing his contract. Using market weights, we can aggregate a free agent’s career statistics to determine their measurable skill level. I then find that after controlling for other observable characteristics of teams, cities, states, and MSAs, that a 1 percentage point increase in the marginal state income tax rates facing players on a given team leads to a 0.080 to 0.088 standard deviation decrease in the average skill of the free agents that the team is able to sign. Other metrics of player performance seem to corroborate these results.
While the focus of this article is very specific, it would appear that the results may be generalizable to a larger population. While I find that an increase in the marginal state income tax rates facing players on a given NBA team leads to a decrease in the average skill of the free agents that the team is able to sign, an analogous result might hold for athletes in other sports. A similar result might also hold for actors, singers, and other entertainers, which are taxed in a similar fashion. Cities are clamoring to improve their culture, and perhaps state income tax rates have some effect on attracting quality in other entertainment areas as well.
Future research might look at the relationship between income tax rates and labor migration in other major sports. Of particular interest might be how the collective bargaining agreement set up in each sport frames this relationship. For instance, in Major League Baseball, where there is no salary cap and the luxury tax is much weaker than in the NBA, are tax rates more likely to be capitalized in salaries? Or, did a hard salary cap in the National Football League prior to the 2010 season prevent teams from compensating free agents for an income tax differential, causing labor migration to be very sensitive to tax rates, and did this change when the salary cap was dropped in the 2010 season?
The current NBA Collective Bargaining Agreement is set to expire on June 30, 2011, and front and center to the issues surrounding the new CBA is the salary cap (Garcia, 2010). The owners are currently pushing for a hard cap for each team which cannot be exceeded, while the union vehemently opposes one. I will not sound off on this debate at the moment, however, based on the results of this article, it may make sense to allow the salary cap of each team to respond to changes in the relative income tax rate facing each team’s players. This would give teams the ability to compensate free agents for changes in the relative income tax rate and maintain their ability to attract top free agents.
Footnotes
Notes
Declaration of Conflicting Interests
The author declared no potential conflicts of interest with respect to the research, authorship, and/or publication of this article.
Funding
The author received no financial support for the research, authorship, and/or publication of this article.