
Abstract
This article uses bookmaker betting volume data to test the influence of bettor sentiment on bookmaker pricing in the over/under 2.5 goals betting market. In an average match, more than 80% of the volume wagered is concentrated on the over bet as cheering for a high score is more attractive than betting against it. We do not find that this volume imbalance is associated with systematic biases in bettor returns. High price transparency seems to prevent bookmakers from systematically distorting their odds in order to exploit bettor sentiment.
Introduction
Sports betting is a multibillion dollar business. Fédération Internationale de Football Association (2011) estimates that sports betting generated between US$350 billion and US$400 billion in 2011, while the sports industry itself generated around US$300 billion. The dominant form of sports betting is bookmaker betting. Bookmakers act as dealers by announcing the odds or point spreads that reflect the prices against which bettors can place their bets. Thereby, bookmakers enter the opposite position of each bet. As long as bettor preferences and perceptions are unbiased, bookmakers do best by setting informationally efficient odds that reflect the true winning probability of the underlying event. Otherwise, bookmakers can sustain large losses if bettors are able to recognize and exploit the biased odds (Levitt, 2004). In the presence of sentimental bettors who prefer bets with particular characteristics and who do not necessarily choose the bets with the highest expected return, optimal bookmaker pricing becomes more complex. Popular examples of bettor sentiment include the optimistic/perception bias (e.g., Kuypers, 2000; Levitt, 2004; Page, 2009) which causes bettors to overrate the winning probability of certain teams, and the loyalty bias (e.g., Forrest & Simmons, 2008; Franck, Verbeek, & Nüesch, 2011) which prevents bettors from betting against the team they support. Bettor sentiment leads to an asymmetric volume demand even when the bookmaker odds reflect the true winning probability of the underlying event.
This article tests whether and how bettor sentiment affects the pricing strategy of bookmakers. Bookmakers can react to bettor sentiment and thus asymmetric volume demand in three different ways: They can either lengthen or shorten the odds of the more heavily demanded bet or they can refrain from price adjustments and set unbiased odds that provide equal betting returns for all outcomes of the market. Kuypers (2000) and Levitt (2004) argue that bookmakers can maximize their profits by shortening the odds of the bet with the comparatively higher betting volume. Alternatively, the model of Franck, Verbeek, and Nüesch (2011) shows that, given a highly elastic demand, risk-neutral bookmakers could profit from lengthening the odds of the more heavily demanded bet. The reasoning behind this pricing strategy is that the lower but still positive margin on such bets is overcompensated by a vast additional betting volume from price-sensitive bettors.
Empirical evidence on the effect of bettor sentiment on bookmaker odds is mixed. Avery and Chevalier (1999), Levitt (2004), Paul and Weinbach (2007), and Woodland and Woodland (1994) show that the bettor returns are abnormally low for bets with higher bettor sentiment. Forrest and Simmons (2008) and Franck et al. (2011), however, find higher returns for bets with high bettor sentiment. And while Braun and Kvasnicka (2013) find both upward and downward biases, Page (2009) does not find any evidence of biased odds due to bettor sentiment. Hence, the cumulative evidence on the effect of bettor sentiment on bookmaker pricing is weak and/or inconsistent.
One difficulty in establishing a link between bettor sentiment and bookmaker pricing is that actual betting volume data are often missing. To the best of our knowledge, we are the first to use actual bookmaker betting volume data as an indicator of sentimental betting to analyze the effect of bettor sentiment on bookmaker pricing. 1 The previous sentimental preferences literature typically has only employed proxy measures for sentimental betting demand such as the advice of experts, the historical success or prestige of teams (Avery & Chevalier, 1999), the difference in mean home attendance between the two opposing teams (Forrest & Simmons, 2008; Franck et al., 2011), or the number of bets placed in a betting tournament with a fixed entry fee (Levitt, 2004).
A second difficulty in establishing a link between bettor sentiment and bookmaker pricing is that bettor sentiment is often correlated with other confounders such as bettor risk or skewness preferences (Golec & Tamarkin, 1998; Quandt, 1986) and bookmaker price adjustments due to the risk of the underlying event (Shin, 1991). Thus, empirical patterns in betting markets such as the favorite-longshot bias, which refers to the finding that the expected return of bets with a high winning probability tends to be systematically higher than the return of bets with a low winning probability (see Sorensen & Ottaviani, 2008, for a survey), cannot be attributed solely to bettor sentiment.
We investigate betting returns and volume percentages of the popular over/under 2.5 goals betting market on soccer matches. 2 This market is beneficial for three reasons. First, there are only two possible outcomes. An under 2.5 goals (hereafter under) bet wins if the total score of the two teams is 2 or less and an over 2.5 goals (hereafter over) bet wins if the total score is 3 or more. Second, the average score of a soccer match lies somewhere between 2.4 and 2.6 goals, depending on the league and competition (Norman, 2011). Thus, the empirical probability of winning is close to 50% for both the over bet and the under bet, which indicates that potential risk considerations of bettors and bookmakers are negligible. Third, the over/under 2.5 goals betting market allows us to exploit a natural source of sentimental betting. Matches with a high number of total goals are generally more attractive than matches with few or no goals (Paul & Weinbach, 2002; Woodland & Woodland, 2010). As gambling is a consumption good, some bettors may even be willing to sacrifice expected returns for the inherent entertainment value of the bet (Conlisk, 1993). Cheering for an exciting high-scoring match is more attractive than cheering for a dull low-scoring match and the entertainment value is therefore certainly higher for the over 2.5 goals bet than for the under 2.5 goals bet. Hence, at least part of the betting volume wagered on the over bet is expected to be sentimentally driven due to this preference. All in all, our setting allows a clean and simple analysis of whether and how bettor sentiment affects bookmaker pricing.
Data and Method
We use data on the volume percentages of money wagered on each side of the over/under 2.5 goals betting market. The betting volume data were provided by the bookmaker Tipico, which is one of the leading sports betting vendors in Germany. In addition to the online betting portal, Tipico has over 1,000 betting shops in several European countries. The original data sample included 4,491 soccer matches played worldwide in 220 different leagues and competitions between November 1 and December 7, 2011. The corresponding odds information was collected from the website oddsportal.com. A total of 372 observations were deleted because bookmaker odds could not be matched. 3 Therefore, the final sample consists of 4,119 matches.
The website oddsportal.com publishes both opening and closing decimal odds offered by Tipico and up to 62 other bookmakers. The opening odds are the first odds published by a bookmaker, usually 1–2 weeks in advance, whereas the closing odds are the last odds offered before the match starts. For the empirical analysis, we use the closing decimal odds. However, the main results would not change in any significant way if we used the opening odds. For about 60% of all bets, the closing odds are the same as the opening odds. Decimal odds denote the payoff of a successful bet. For example, if the odds for an over bet are 2.50, a one-dollar wager pays US$2.50 if the total score is 3 or more. We converted the decimal odds into prices, which are the reciprocal of the decimal odds (e.g., 1/2.50 = 0.40). These prices indicate how much a bettor has to invest in order to collect US$1 in the event of a successful bet (Forrest & Simmons, 2008).
Figure 1a shows the distribution of the prices from over bets offered by the bookmaker Tipico. The mean price is 0.54 and the prices appear to be fairly symmetrically distributed around the mean. Figure 1b presents the corresponding distribution of the betting volume percentages wagered on the over bet. This distribution is highly asymmetric, with a mean of 0.82 and a skewness of −1.11. Thus, on average, about 80% of the betting volume is concentrated on the over bet, leaving 20% of the betting volume for the under bet.
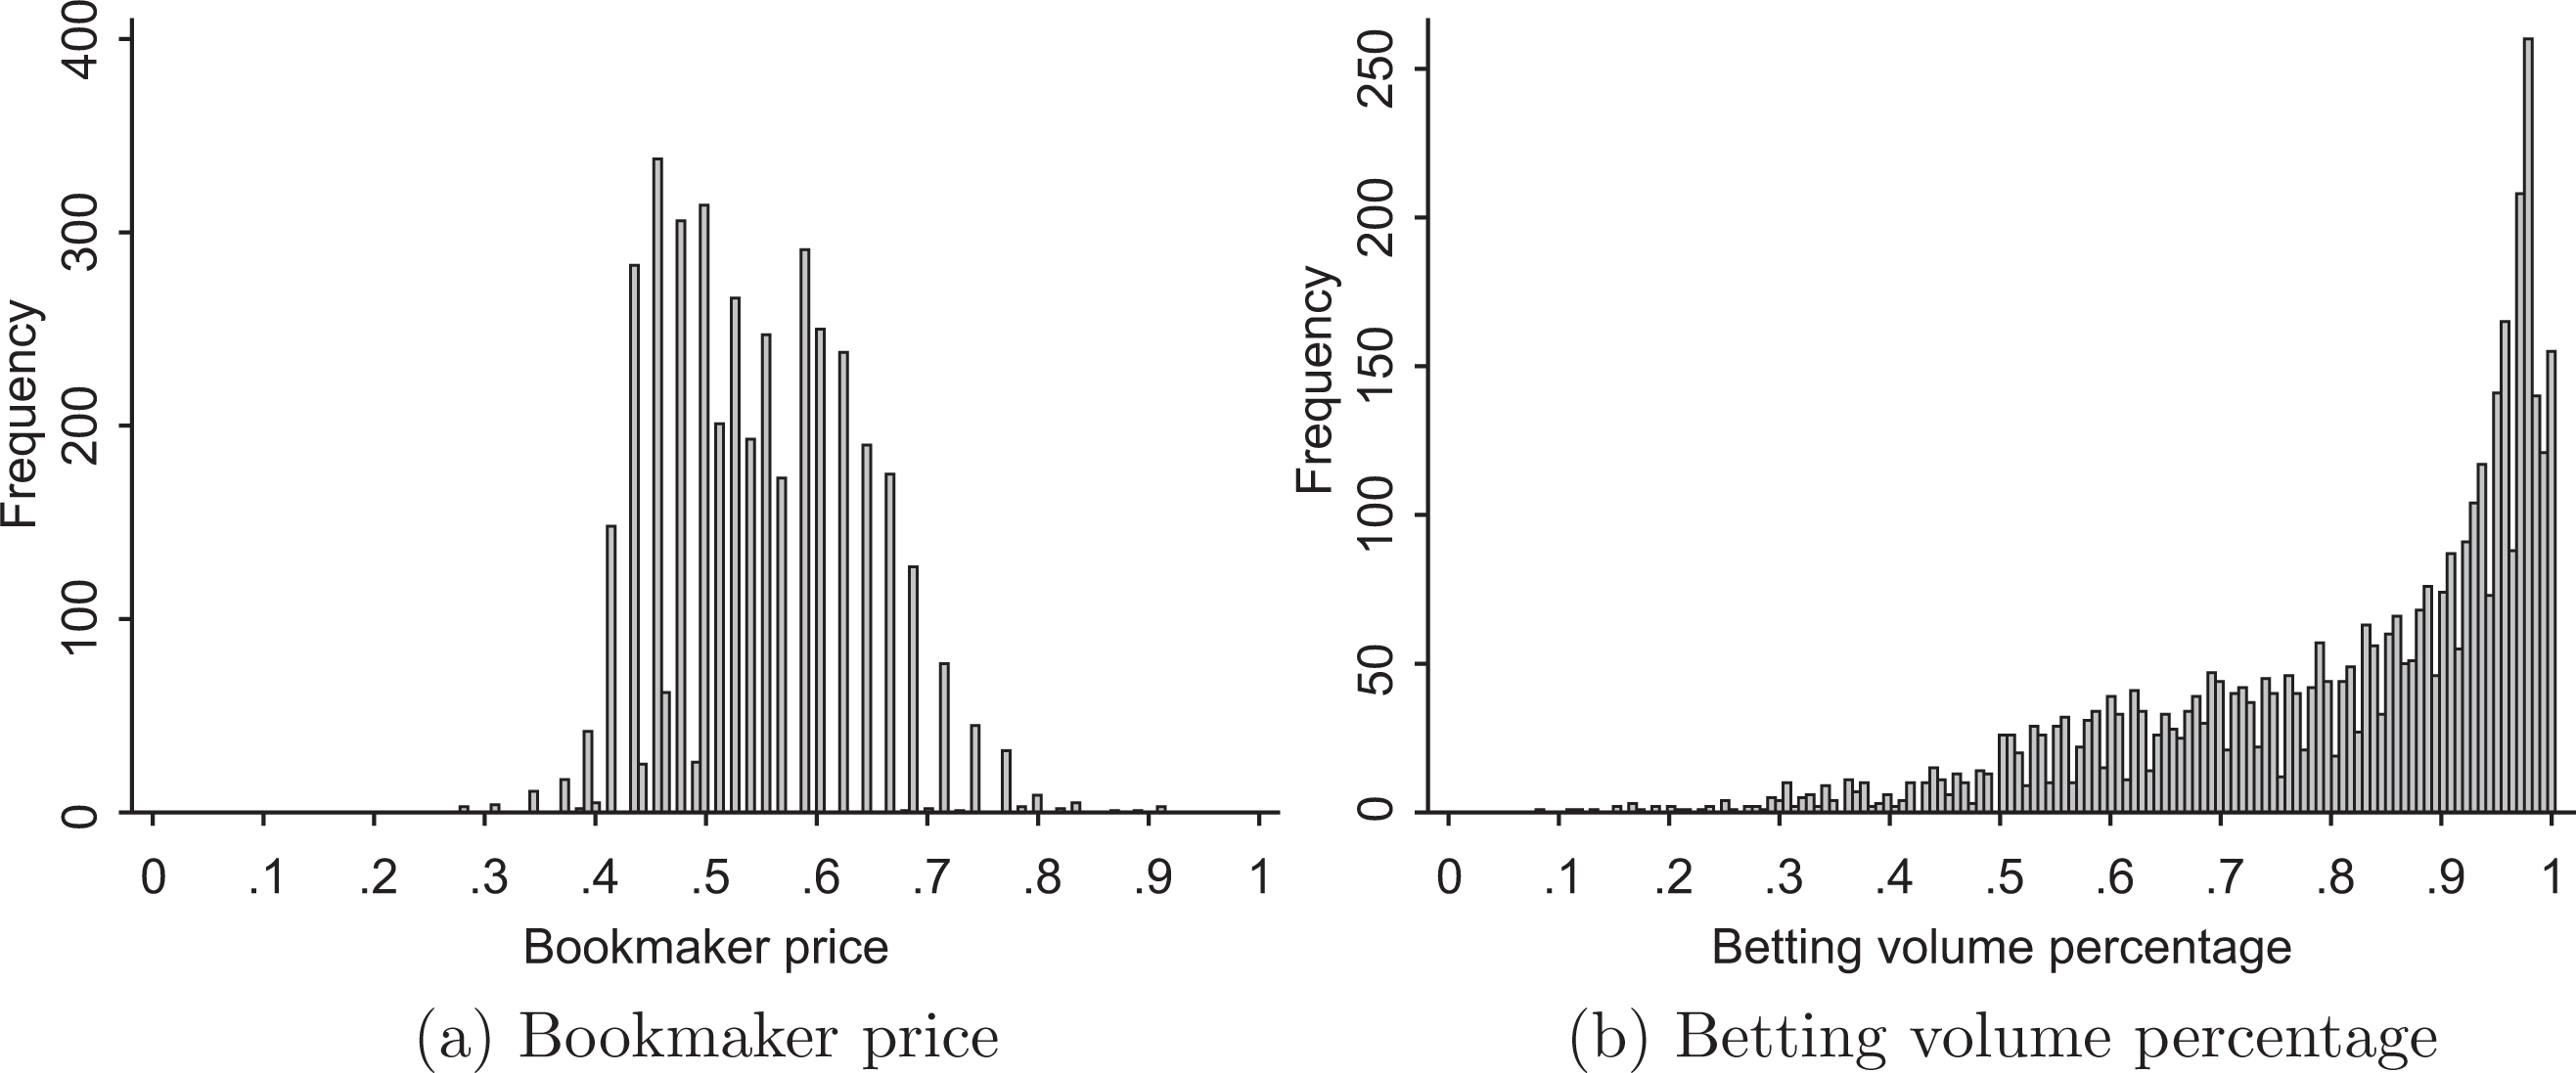
Distribution of bookmaker prices and betting volume percentages from over bets.
To test whether the bookmaker prices displayed in Figure 1a exhibit a systematic bias due to the highly asymmetric volume distribution, we conduct simple t-tests for differences in mean objective winning probabilities, betting volume percentages, prices, and bettor returns on a one-unit wager between over and under bets. By testing for differences in the objective winning probabilities, we verify that one of the central characteristics of the over/under 2.5 goals betting market, namely that the probability of winning is close to 50% for both the over and the under bet, also applies to our data set. By comparing differences in mean betting volume, we test whether the over/under 2.5 goals betting market is indeed characterized by sentimental and thus asymmetric betting volumes. By comparing mean prices and bettor returns, we examine whether bookmaker pricing differs between over and under 2.5 goals bets.
Because the betting volume is potentially endogenous to the bettor return, we estimate a two-stage least squares (2SLS) model to identify the effect of sentimental betting volume on bookmaker pricing. We use the over bet as an identifying instrumental indicator variable to predict the betting volume in the first stage. The first-stage regression is specified as

where

where
Results
Table 1 shows the results from two-sided t-tests for the differences in mean objective winning probabilities (winning), betting volume percentages (volume), prices (price), and bettor returns (return) between over and under bets. The average objective probability for the over bet to win is 49.8% which is not significantly different from the average probability of 50.2% for the under bet to win. By contrast, the betting volume is highly concentrated on the over bet, accounting for 81.7% of the betting volume on average. However, this highly asymmetric betting volume does not seem to affect bookmaker pricing and bettor returns. The t-tests show that the differences in the mean prices and mean returns are not statistically different between the over bet and the under bet. 4 Nonparametric Wilcoxon signed-rank tests confirm these findings. Risk considerations of bettors or bookmakers should not affect these results because the objective probability of the over and the under bet to win is close to 50% (see first column of Table 1) and the standard deviations of the returns are very similar (see last column of Table 1). The results of a variance ratio test show that the standard deviations of the returns from over and under bets are not statistically different.
t-Tests for Differences in Mean Winning Probabilities, Volume, Prices, and Returns.
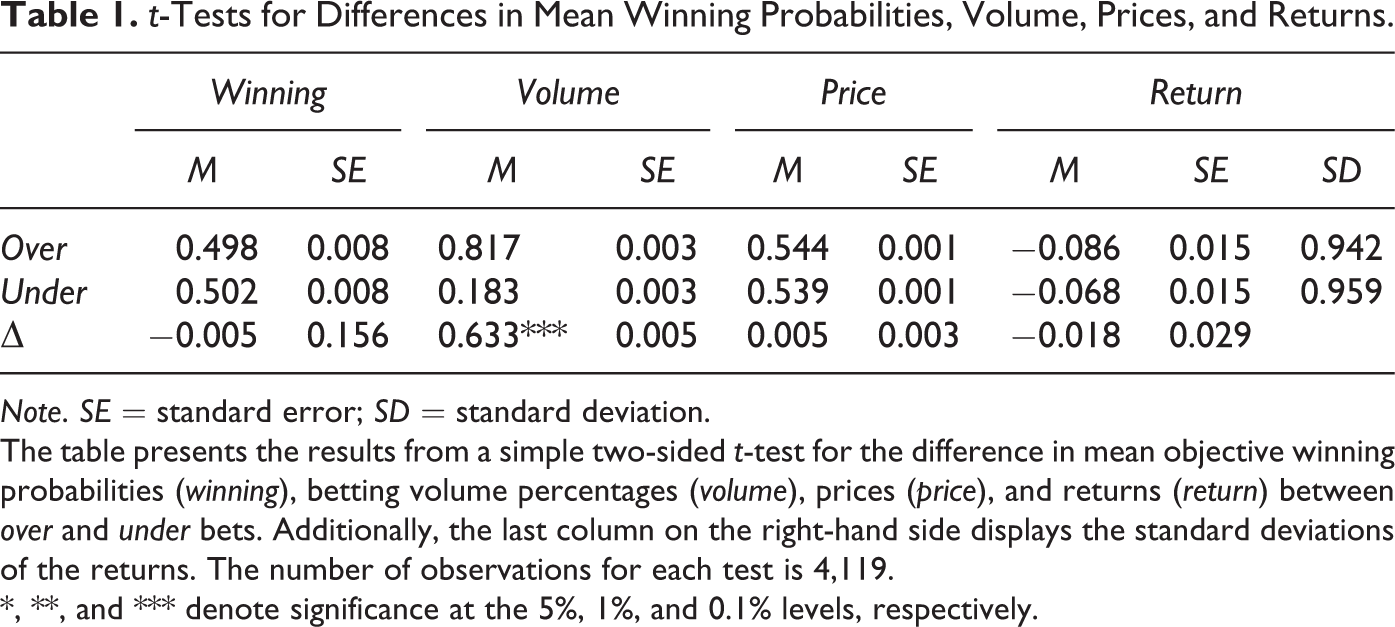
Note. SE = standard error; SD = standard deviation.
The table presents the results from a simple two-sided t-test for the difference in mean objective winning probabilities (winning), betting volume percentages (volume), prices (price), and returns (return) between over and under bets. Additionally, the last column on the right-hand side displays the standard deviations of the returns. The number of observations for each test is 4,119.
*, **, and *** denote significance at the 5%, 1%, and 0.1% levels, respectively.
The results from the 2SLS model are shown in Table 2. Column 1 reports the estimates of the first-stage regression, which predicts the betting volume. Our instrument over is a strong predictor for the volume with a partial R2 of around 88%. Column 2 reports the estimates of the second-stage regression on the relation between the predicted betting volume and bettor returns. The sentimental betting volume does not significantly affect the returns. Thus, high sentimental betting volume does not cause abnormally high or low bettor returns. 5
2SLS Regressions of Returns.
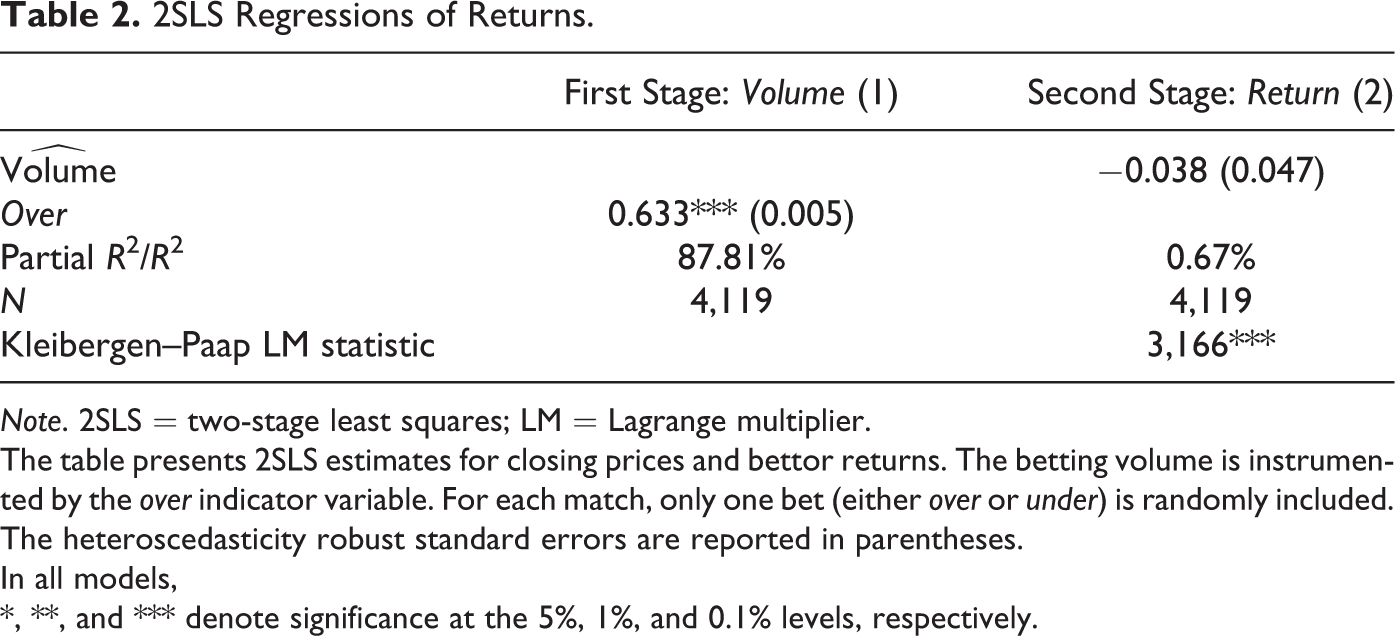
Note. 2SLS = two-stage least squares; LM = Lagrange multiplier.
The table presents 2SLS estimates for closing prices and bettor returns. The betting volume is instrumented by the over indicator variable. For each match, only one bet (either over or under) is randomly included. The heteroscedasticity robust standard errors are reported in parentheses.
In all models, *, **, and *** denote significance at the 5%, 1%, and 0.1% levels, respectively.
Conclusion
We use actual betting volume data to analyze the effect of bettor sentiment on bookmaker pricing in the over/under 2.5 goals betting market of soccer matches. This market offers ideal conditions because bettors exhibit a natural preference for high match scores. At the same time, the empirical winning probability for either bet to win is close to 50%, indicating that potential risk considerations of bettors and bookmakers that could interfere our results are negligible in this setting.
We find that the betting volume from the over/under market is highly concentrated on the over bet, accounting for over 80% of the betting volume on average. However, this imbalance is not associated with systematic sentimental biases in bookmaker pricing and bettor returns.
Our results do not necessarily imply that bookmaker prices are always unbiased. If the sentimental betting volume is positively correlated with the objective-winning probability of the underlying bet, bookmakers’ prices may still be biased. Forrest and Simmons (2008) and Franck et al. (2011) find that bookmakers offer significantly more favorable prices for bets on wins by strong teams with a large supporter base.
This article shows that in a setting where risk considerations of both bettors and bookmakers are negligible, bookmakers do not distort their prices to exploit the bettor preference to bet on a high number of goals in a soccer match. Instead, bookmakers offer prices that reflect their best prediction of the true outcome probability and add an equally distributed commission, even when bettor sentiment leads to a highly asymmetric volume distribution.
One possible explanation for this finding is that bettors can easily compare the prices listed by several different bookmakers and find the best prices through a number of websites such as oddsportal.com or betbrain.com, which increases the bettors’ price sensitivity. Thus, small price changes tend to have a large impact on the betting volume and eventually on the bookmaker’s profit. If a bookmaker increases the price (shortens the odds) of an over bet, sentimental bettors would switch to a competitor. On the other hand, if a bookmaker lowers the price (lengthens the odds) of an over bet, the bookmaker gains additional sentimental betting volume, however, at a higher risk of substantial losses.
Footnotes
Declaration of Conflicting Interests
The author(s) declared no potential conflicts of interest with respect to the research, authorship, and/or publication of this article.
Funding
The author(s) received no financial support for the research, authorship, and/or publication of this article.