
Abstract
Prior to the 2012-2013 season, National Football League franchises had the option to significantly adjust their TV blackout policies for the first time since 1973. Using data from team policy choices and local TV blackouts during the 2007-2008 to 2014-2015 seasons, we examine whether the policy change was effective in reducing the probability of blackouts or affected attendance. Controlling for team-fixed effects, we find no evidence that policy-adopting teams experienced significantly fewer blackouts or a change in attendance following the policy implementation. Our analysis sheds light on the economic factors that are correlated with local TV blackouts and game attendance.
Introduction
In December 2012, Buffalo restauranteur Russell Salvator purchased 10,000 tickets for the upcoming matchup between the Buffalo Bills and the St. Louis Rams in order to avoid a second consecutive local TV blackout of a Bills’ home game (Davidson, 2012). Between the 2007-2008 and 2011-2012 seasons, National Football League (NFL) home games were locally blacked out 83 times due to restrictions on local TV broadcasts of sporting events dating back to the 1960s and 1970s. In granting an antitrust exemption for sports franchises to collectively bargain for their national TV broadcast contracts, the Sports Broadcasting Act of 1961 also permitted teams to restrict the TV broadcasts of their home sporting events within a local geographic territory (Horowitz, 1974). In 1973, this policy was relaxed to permit local TV broadcasts if the game was also broadcasted into other markets and if the game was sold out at least 72 hr prior to kickoff (Federal Communications Commission [FCC], 2013). Although to increase its flexibility the NFL made minor changes to this policy over the subsequent 40 years, the “sellout or blackout” rule remained fundamentally unchanged until June 2012. 1
Under mounting public pressure, prior to the 2012-2013 season, the NFL gave teams the option to continue under the existing local TV blackout policy or adopt a lower attendance threshold that must be met to avoid a blackout. Under the revised policy, teams could set an attendance threshold between 85% and 100% of stadium seating capacity that, if met, would permit local TV broadcasts even if the game was not sold out. In exchange for this flexibility, teams adopting the new policy would be subject to greater revenue sharing with their opponents for home contests when attendance exceeds the threshold. The new policy was met with mixed reactions from NFL teams, with four teams publicly announcing the adoption of a lower attendance threshold, seven teams announcing they would not change their blackout policy, and the remainder either remaining silent about their policy choice or refusing to reveal their decision. To explore the effectiveness of the 2012 NFL policy change in reducing the probability of local TV blackouts, we combine team-level policy adoption decisions with game-level data for all franchises for the 2007-2008 season through the 2014-2015 season. The policy change also permits us to examine the long-standing claim that local TV blackouts are necessary to insure fan stadium attendance is not adversely affected by TV broadcasts of franchise home games.
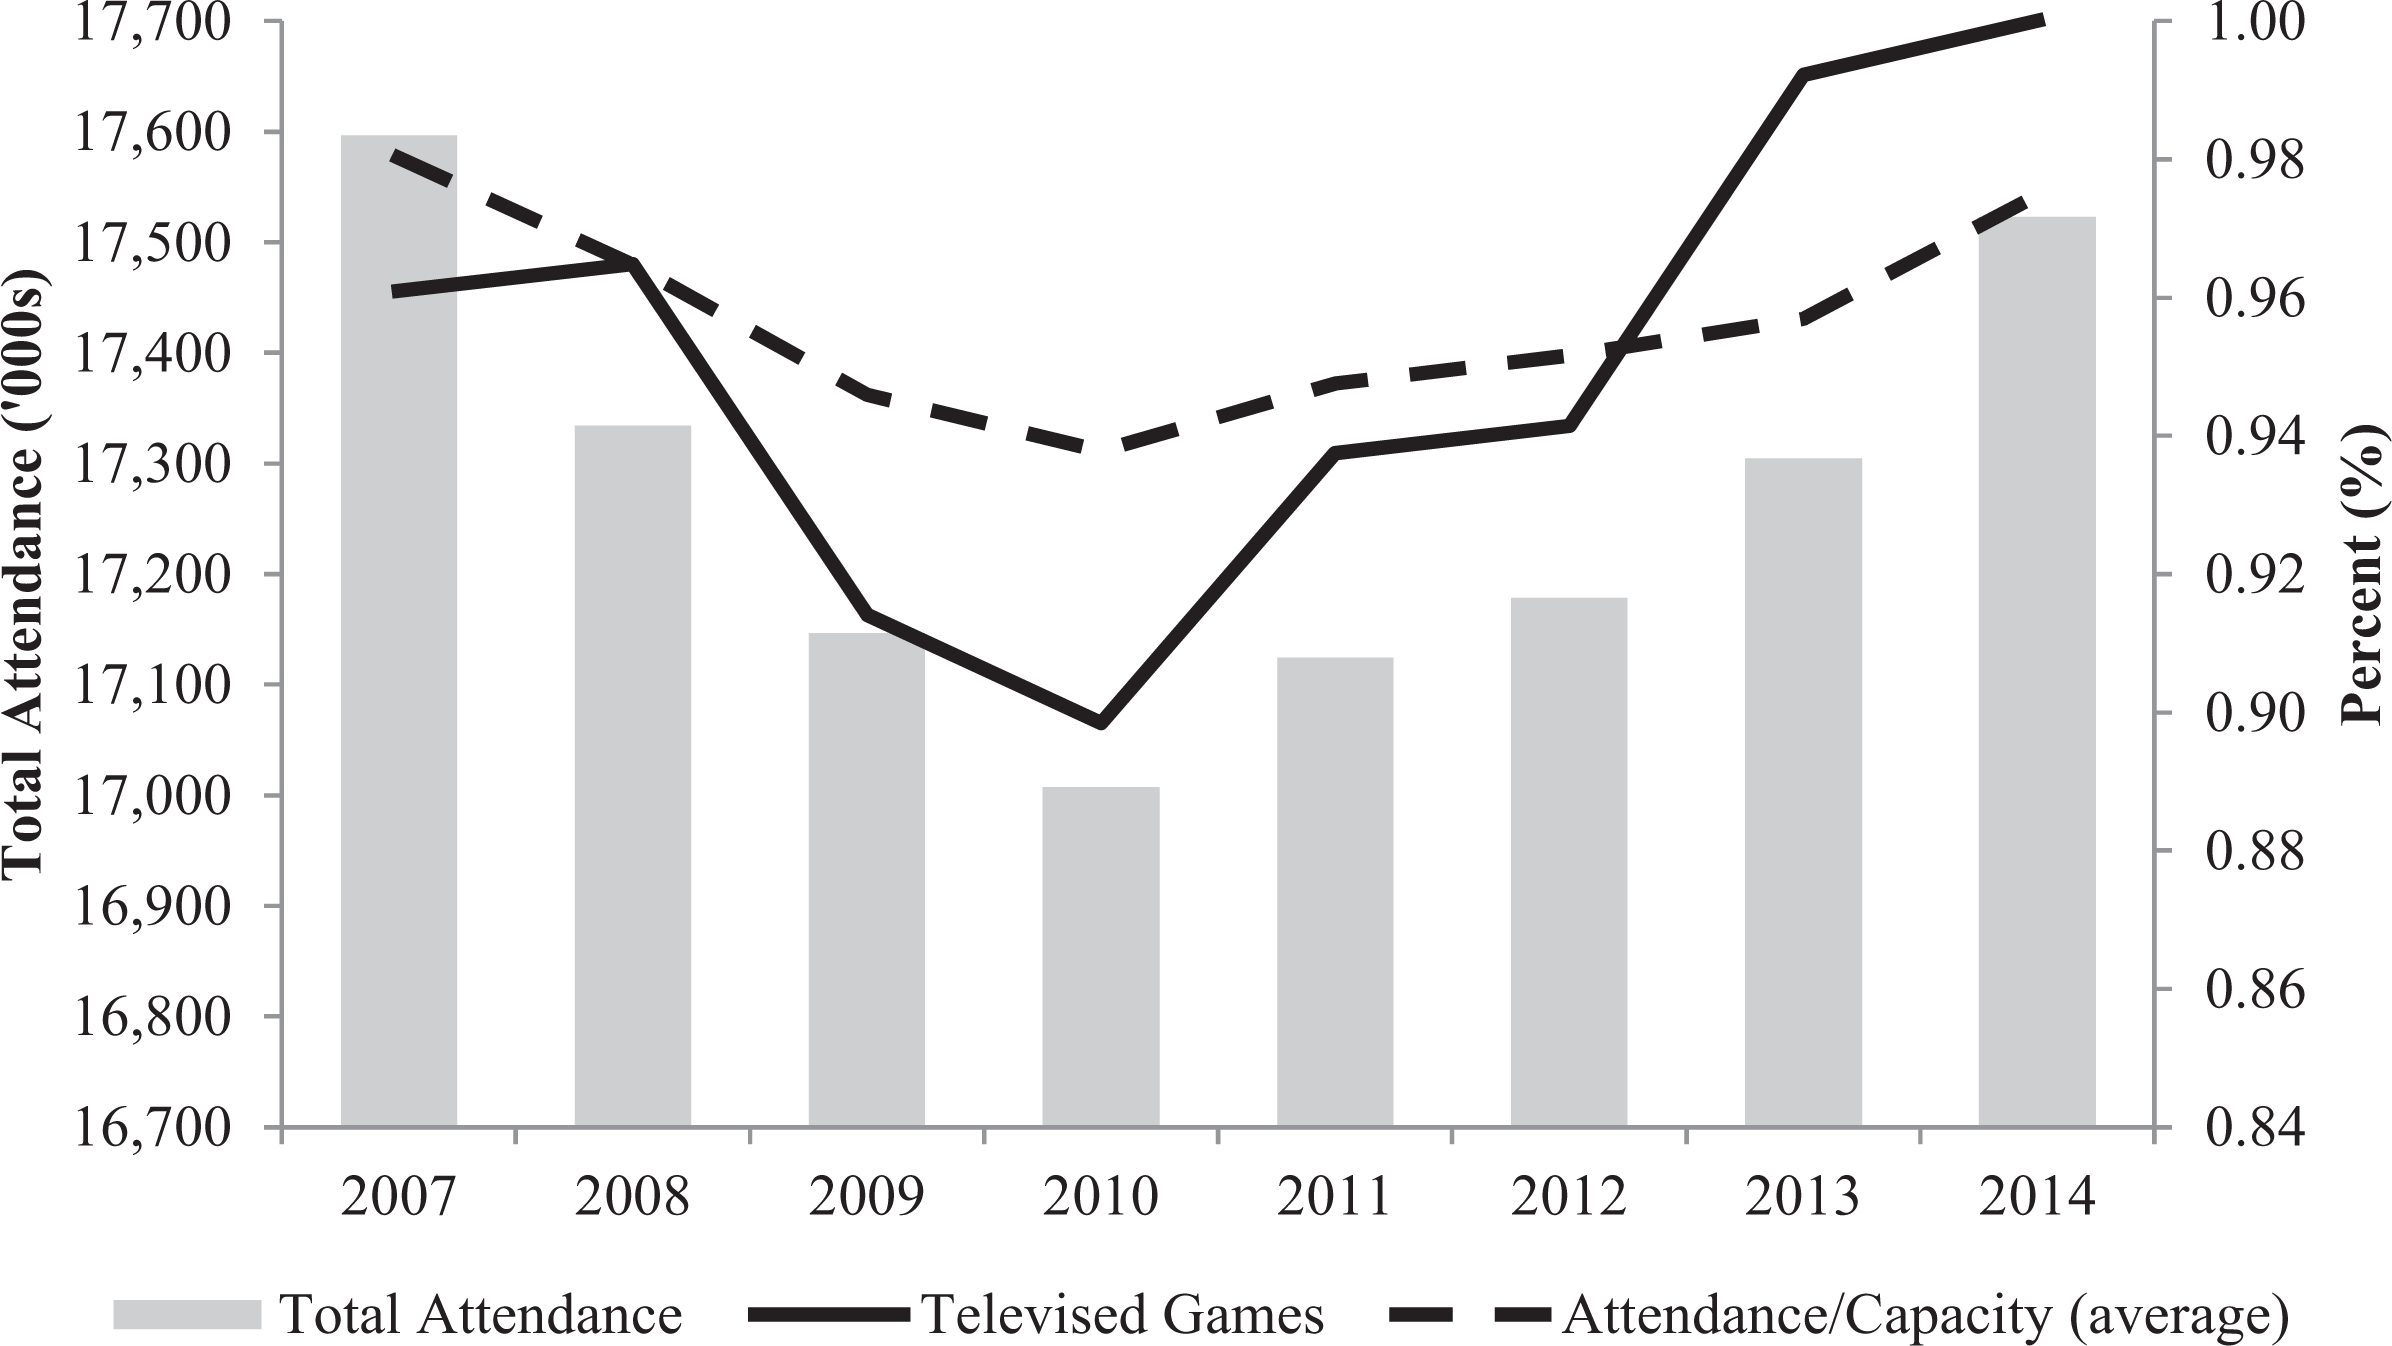
Figure 1 plots the percentage of games televised, attendance as a percentage of stadium capacity, and total NFL attendance for each season between 2007-2008 and 2014-2015. The graph illustrates the decline in attendance and increase in the frequency of blackouts beginning with the 2008-2009 season and continuing through the 2013-2014 season. This trend corresponds with the recession from December 2007 to June 2009 along with the gradual economic recovery. Using game-level data on TV blackouts collected from local newspapers, we evaluate the effectiveness of the 2012 policy adoption in reducing the probability of home blackouts. Additionally, we explore the demand for NFL game attendance by identifying a plausibly exogenous change, associated with lower attendance thresholds relative to capacity, in the probability of a TV blackout. To our knowledge, we provide the first analysis of NFL team attendance across more than two seasons which can account for team-, season-, and week-of-season-fixed effects in addition to game, team, stadium, and macroeconomic controls.
Attendance and blackouts.
The 1973 TV blackout policy has resulted in public outcry from fans (Assael, 2012), economists (Baade et al., 2012), and politicians (Shields, 2012). Although the number of blackouts has declined significantly from 60% of 182 games (109 blackouts) in 1975 to 6% of 256 games in 2011 (16 blackouts), repeated blackouts within a season continue to occur and are concentrated in a small number of franchises (Assael, 2012). Between the 2007-2008 and 2011-2012 seasons, two thirds of NFL franchises did not face a single local TV blackout of a home game, whereas five franchises had seasons in which at least half of their home games were blacked out. The increase in concentration of blackouts, despite the declining total number of blackouts, corresponds with an increase in popularity of the NFL, the increase in luxury-box seating options, which are excluded from blackout policies, and policies that allow teams to circumvent local blackouts by either changing stadium capacity for the entire season or purchasing excess tickets for specific games at discounted prices (Tuttle, 2013). In response to the frequency of local TV blackouts, the FCC proposed to eliminate the ability of sports leagues to blackout TV broadcasts in 2013 (FCC, 2013). Less than 15 months later and following a season in which no local TV blackouts occurred, NFL owners voluntarily decided to suspend local TV blackouts for the 2015-2016 season (Brown, 2015).
Although the blackout policy relates to the local TV broadcast of NFL games, whether or not a team faces a blackout is fundamentally an issue of insufficient fan attendance. 2 The 1973 blackout policy, which permitted the local broadcast of NFL games, was first examined by Siegfried and Hinshaw (1979) using FCC data. They find no significant increase in game-day “no-shows,” defined as fans who purchase tickets but fail to attend a game, when local TV blackouts are lifted. Zuber and Gandar (1988) update Siegfried and Hanshaw (1979) with additional data and correct for several model-specification issues but continue to fail to find a significant effect of removing local TV blackouts on “no-show” behavior for the league as a whole. However, they find a small positive increase in the number of “no-show” fans in a more restricted sample. In a pair of articles examining the determinants of game-day attendance, Welki and Zlatoper (1994, 1999) find a negative correlation between attendance and local TV blackouts when attendance is defined relative to both the proportion of tickets sold and to stadium capacity. 3 In addition to the studies addressing the impacts of the NFL blackout policy on fan attendance, the literature most relevant to our examination explores the relationship between TV broadcasts and live event attendance. 4 A consistent result from these studies is that any decrease in revenues from foregone attendance is likely to be small relative to broadcast fees.
As Putsis and Sen (2000) identify, the blackout indicator fails to account for the endogeneity arising from the joint determination of blackouts and attendance. They explore three different measures of attendance: (i) season-ticket sales, (ii) individual-game sales, and (iii) day-of-game no-shows. Using the latter two measures, they instrument for the endogeneity of TV blackouts with remaining seats available for sale after season-ticket sales are realized. Consistent with the previous research, they find the counterintuitive results that local TV blackouts decrease individual-game sales and increase game-day no-shows and develop a framework in which fan interest in a specific game drives both the probability of a blackout and attendance.
Our analysis builds on Putsis and Sen (2000) by identifying a plausibly exogenous policy change that affects the probability that a game will be televised. We collect game-level data on home TV blackouts from local newspapers for all franchises, identify blackout policy choices for 11 franchises from local newspapers, and, for an additional 8 franchises, verify policy choices via personal correspondence. We deviate from previous literature on local TV blackouts and attendance by controlling for game, team, stadium, and macroeconomic covariates, in addition to unobserved team-, season-, and week-of-season-fixed effects, in our analyses. Our analysis contributes to the literature by focusing on a change in blackout policy that is exogenous, conditional on the observable covariates and unobservable fixed effects. Controlling for fan interest, we examine the effectiveness of the policy change in reducing local TV blackouts as well as whether there was an adverse impact upon attendance.
Given the recent FCC proposal and the NFL’s decision to eliminate blackouts for the 2015-2016 season, our analysis is uniquely situated to address the effectiveness of the 2012 policy change in reducing TV blackouts. We find that teams that adopted a lower threshold for ticket sales to qualify as a sellout experienced an economically, but not statistically, significant reduction in the probability of local TV blackouts in the seasons following the policy change. Additionally, we consider, and rule out, the possibility of past blackouts determining whether teams adopted the 2012 blackout policy. We also fail to find a statistically significant impact of policy adoption on game attendance, measured as the natural log or as a percentage of stadium capacity. Finally, we explore the individual game, team, and stadium characteristics, as well as macroeconomic controls, that are related to local TV blackouts and game attendance. Our results confirm the positive relationship between home-team quality and expected scoring in reducing the probability of TV blackouts but reveal a surprisingly negative (positive) relationship between outcome certainty and attendance (blackouts).
In the next section, we provide additional background to the NFL’s TV blackout policy and explore team incentives to opt into the new policy. We then discuss the data used in the empirical estimations and provide some descriptive evidence of recent trends in TV blackouts and game attendance. In the fourth section, we present our empirical framework and the estimation results for the franchise opt-in decision, the probability of a local TV blackout, and game attendance. Given the null results regarding the policy impacts, we subsequently explore alternate sample specifications as robustness checks. The final section concludes.
Background
Following a judicial ruling that sports leagues that collectively bargain over national TV broadcasts were in violation of antitrust law, the U.S. Congress passed Title 15 of the U. S. Code, Chapter 32 “Telecasting of Professional Sports Contests,” otherwise known as the “Sports Broadcasting Act of 1961.” This act granted an antitrust exemption to professional sports franchises to negotiate jointly as a league over the sale of their national broadcast rights (Horowitz, 1974). Additionally, the Act adopted part of the 1953 judicial ruling on the use of TV blackouts within a home team’s “territory” to protect franchises against a decrease in attendance (Fecteau, 1995; Horowitz, 1974). This implied that local TV broadcasts of professional football games were prohibited regardless of the actual game attendance, implying that even sold-out home games would be unavailable to local TV viewers.
Public Law 93–107, proposed by the FCC and enacted by Congress in 1973, revised the Sports Broadcasting Act of 1961 by prohibiting territorial blackouts of local sporting events if the game was broadcast in other markets and sold out 72 hr in advance of game time (FCC, 2013). Although the 1973 law was enacted on a limited basis and not renewed following its expiration in 1975, NFL franchises adopted the blackout rules as their own policy. In an era where the most important source of revenue was from ticket sales and game-day revenues, the intent of the original blackout rule was to entice fans to come to the stadium rather than opting to stay home and watch the TV broadcast.
Despite minor revisions to accommodate technological advances such as cable and satellite TV, the fundamentals of this policy went largely unchanged until 2012. In the face of falling league-wide attendance and fan outrage over local blackouts, the NFL owners decided to give each team an option regarding the blackout policy to which its home games would be subject to. In order to avoid a blackout, teams could continue with the existing policy, sales of 100% of stadium capacity, or adopt the new policy and set an attendance threshold between 85% and 100% of capacity. Teams that adopt a lower attendance threshold are required to evenly split their ticket-sales revenues for all tickets sold in excess of the attendance threshold with the visiting team. Under the 1973 policy (and for ticket sales below the attendance threshold), the home team retains 66% of ticket sales while the visiting opponent receives the remainder. Home teams continue to retain 100% of the revenue from parking, concession, and merchandise sales and leases on luxury boxes regardless of the policy choice or attendance threshold. Under either policy, if a team sells less than its capacity or attendance threshold and wants to avoid a blackout, it can purchase unsold tickets for 0.34 cents on the dollar.
A team’s decision to adopt the 2012 policy and the threshold attendance level depends on the team’s ticket pricing strategy, the stadium capacity, the number of unsold tickets following season ticket sales, and the expected demand for unsold tickets. Teams that opt into the 2012 blackout policy face a trade-off between lower revenues on tickets sold in excess of the attendance threshold and the (potential) benefits that arise from a decrease in the probability of a local TV blackout. If local TV blackouts are associated with a reduction in the consumer surplus of fans within a team’s home territory, then an avoided blackout may create goodwill among the team’s fan base that transforms into potential future revenues. In the extreme case of pervasive and widespread local TV blackouts, local affiliates could be faced with reduced advertising revenues from local sponsors if home games are consistently blacked out in the home territory. Subsequently, local affiliates would have decreased incentives to push their associated national networks into acquiring national broadcasting rights.
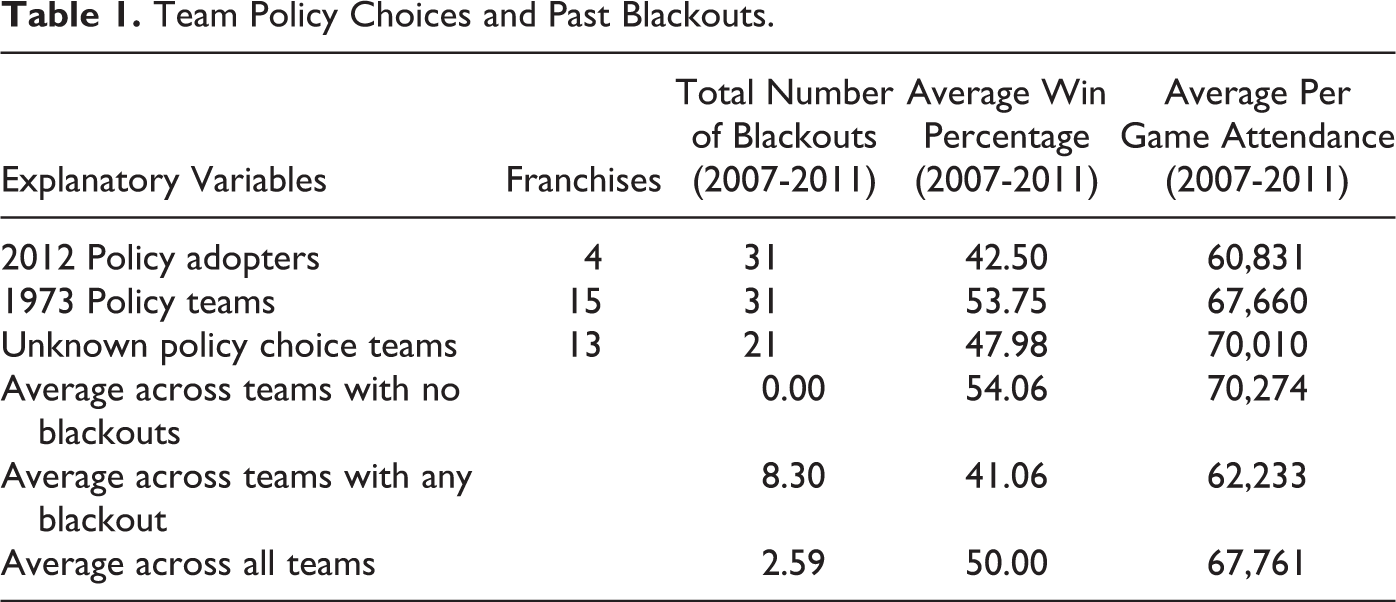
Following the 2012 policy change, four teams opted to adopt an attendance threshold between 85% and 100% of stadium capacity (“2012 policy adopters”) even though only two of them experienced a local TV blackout in our sample period. Seven teams announced that they would not change their blackout policies (“1973 policy teams”) despite four of those franchises having experienced a home blackout. Additionally, four teams that had a local TV blackout in our sample period did not announce their policy choice. In order to gain additional information regarding blackout policy choices, we contacted each franchise individually and an additional eight teams revealed that they did not change their blackout policy. Table 1 summarizes franchises according to their policy choices, whether they faced any blackout in the 5 years prior to the policy change (2007-2011 seasons), average win percentage (2007-2011 seasons), and stadium capacity in 2011. Teams that faced any blackout between 2007 and 2011 have lower win percentages and slightly smaller stadium capacities on average relative to teams not facing any blackouts. Moreover, on average teams that adopted the 2012 policy also had lower win percentages and smaller stadium capacities.
Team Policy Choices and Past Blackouts.
Data and Descriptive Statistics
Several challenges arise in assessing the effectiveness of the change in policies governing local TV blackouts prior to the 2012-2013 season. First and foremost, teams were afforded the option to either adopt the revised policy or continue under the existing policy. Moreover, it was up to each individual franchise to reveal whether it opted into or out of the policy change. Finally, although league-wide data are available on the total number of local TV blackouts in a given season, data on whether a particular game was blacked out locally are not publicly available.
To resolve the second issue, we searched local newspaper articles for each franchise in order to determine whether the team made a public announcement in response to the policy change and identify four teams (Miami, Minnesota, Oakland, and Tampa Bay) that publicly announced they had opted into the new policy. Additionally, seven teams (Buffalo, Cincinnati, Cleveland, Indianapolis, Jacksonville, San Diego, and Tennessee) publicly announced they had opted out of the new policy and one team (St. Louis) declined to reveal their choice publicly. In order to determine the policy choices of the remaining 21 franchises, we contacted each of the 32 franchises. 5 We obtained responses from 11 of the 21 franchises for which we had no decision information: Eight revealed that they did not opt into the new blackout policy and four declined to reveal their choice. The remaining nine franchises that did not respond are categorized as having an unknown blackout policy and are treated equivalently to those franchises that declined to reveal their policy choices.
For each franchise, we searched local newspaper articles from the beginning of the 2007-2008 season through the end of the 2014-2015 season in order to identify the NFL games that were blacked out on local TV. We confirm the results of our search against the total number of blackouts per season across all franchises made publicly available by the NFL. Our sample, covering the 2007-2008 through the 2014-2015 seasons, includes 10 franchises that faced a blackout with Tampa Bay and Oakland facing the most home blackouts (19) and two franchises, Atlanta and Kansas City, only facing blackouts in a single season.
In order to explore whether the policy was effective in decreasing the likelihood of local TV blackouts and whether the policy had an impact on game attendance, we collect game- and season-level data on attendance as well as other factors affecting ticket demand (for a complete list of data sources and descriptive statistics, please refer to Appendix Table A1). The game-level data that we collect include the location of the game, the time and date of the game, weather conditions, home and away team quality, outcome certainty, and expected scoring. For home and away team quality, we observe win percentages in the current season prior to the game and an indicator that takes the value of one if the home team is a favorite to win the game as established by the betting line. We control for outcome certainty by including the absolute value of the betting line point spread, a measure of how “close” the game is expected to be. We also control for expected scoring by including the over/under on the total points expected to be scored in the game.
The weather conditions that we observe include temperature, relative humidity, wind speed, and temperature accounting for wind chill for outdoor games below 32 °F. For games that occur under a retractable roof, we obtained data from team media guides for game histories when the roof was either open or closed and, for games played under an open roof, collect historical weather data from Weather Underground. For games played under a closed roof or dome, we consider an interior temperature of 72 °F and 0 mph wind speed. Unfortunately, game-level precipitation data were not available. Finally, we control for unobserved variation in the likelihood of local blackouts or attendance with an indicator variable for non-Sunday games and games played in London or Toronto which are more likely to be sold out.
We also observe team and stadium characteristics that vary across, but not within, seasons. The stadium characteristics that we control for include stadium age, whether the stadium is domed, and stadium seating capacity. We also control for team quality by including the overall win percentage from the past season, an indicator for a play-off appearance in the previous season, and the home team’s strength of schedule. We collect season-level data on average ticket prices and Fan Cost Index (FCI) from the Team Marketing Report for each NFL franchise and every season. 6 Finally, we adjust ticket prices and FCI using price indexes for each metropolitan statistical area (MSA) and control for local economic conditions using annual estimates of MSA population, per capita personal income, and unemployment rate.
Throughout the estimations of the blackout probability and per game attendance, we include team-fixed effects and in a subset of specifications also consider season- and week-of-season-fixed effects. For example, if there are some unobservable differences between franchises that opt into the 2012 blackout policy and those that do not and these unobservables are correlated with the probability of local TV blackouts or game attendance, then the estimates on the impact of policy adoption will be biased. Assuming that these unobservables are constant over time, the team-fixed effects correct for the endogeneity of the policy choice and the outcome variables that bias the estimates. Similarly, season- and week-of-season-fixed effects control for common shocks in the probability of local TV blackouts or game attendance that affect all franchises.
In Table 2, we report descriptive statistics for outcome and control variables for the full sample of teams across all seasons (column 1). Additionally for the prepolicy seasons (2007-2008 through 2011-2012), we separate the sample according to whether teams adopted the 2012 blackout policy (column 2) and teams that either did not adopt it or whose policy choice remains unknown (column 3). We test for equality of sample means between policy adopters and all other teams and find significant differences in the number of blackouts and game attendance as well as in the control variables (column 4). These differences motivate the exploration of the nonrandom adoption of the 2012 blackout policy as well as robustness checks that restrict the sample to teams that are more similar to policy adopters.
Summary Statistics.
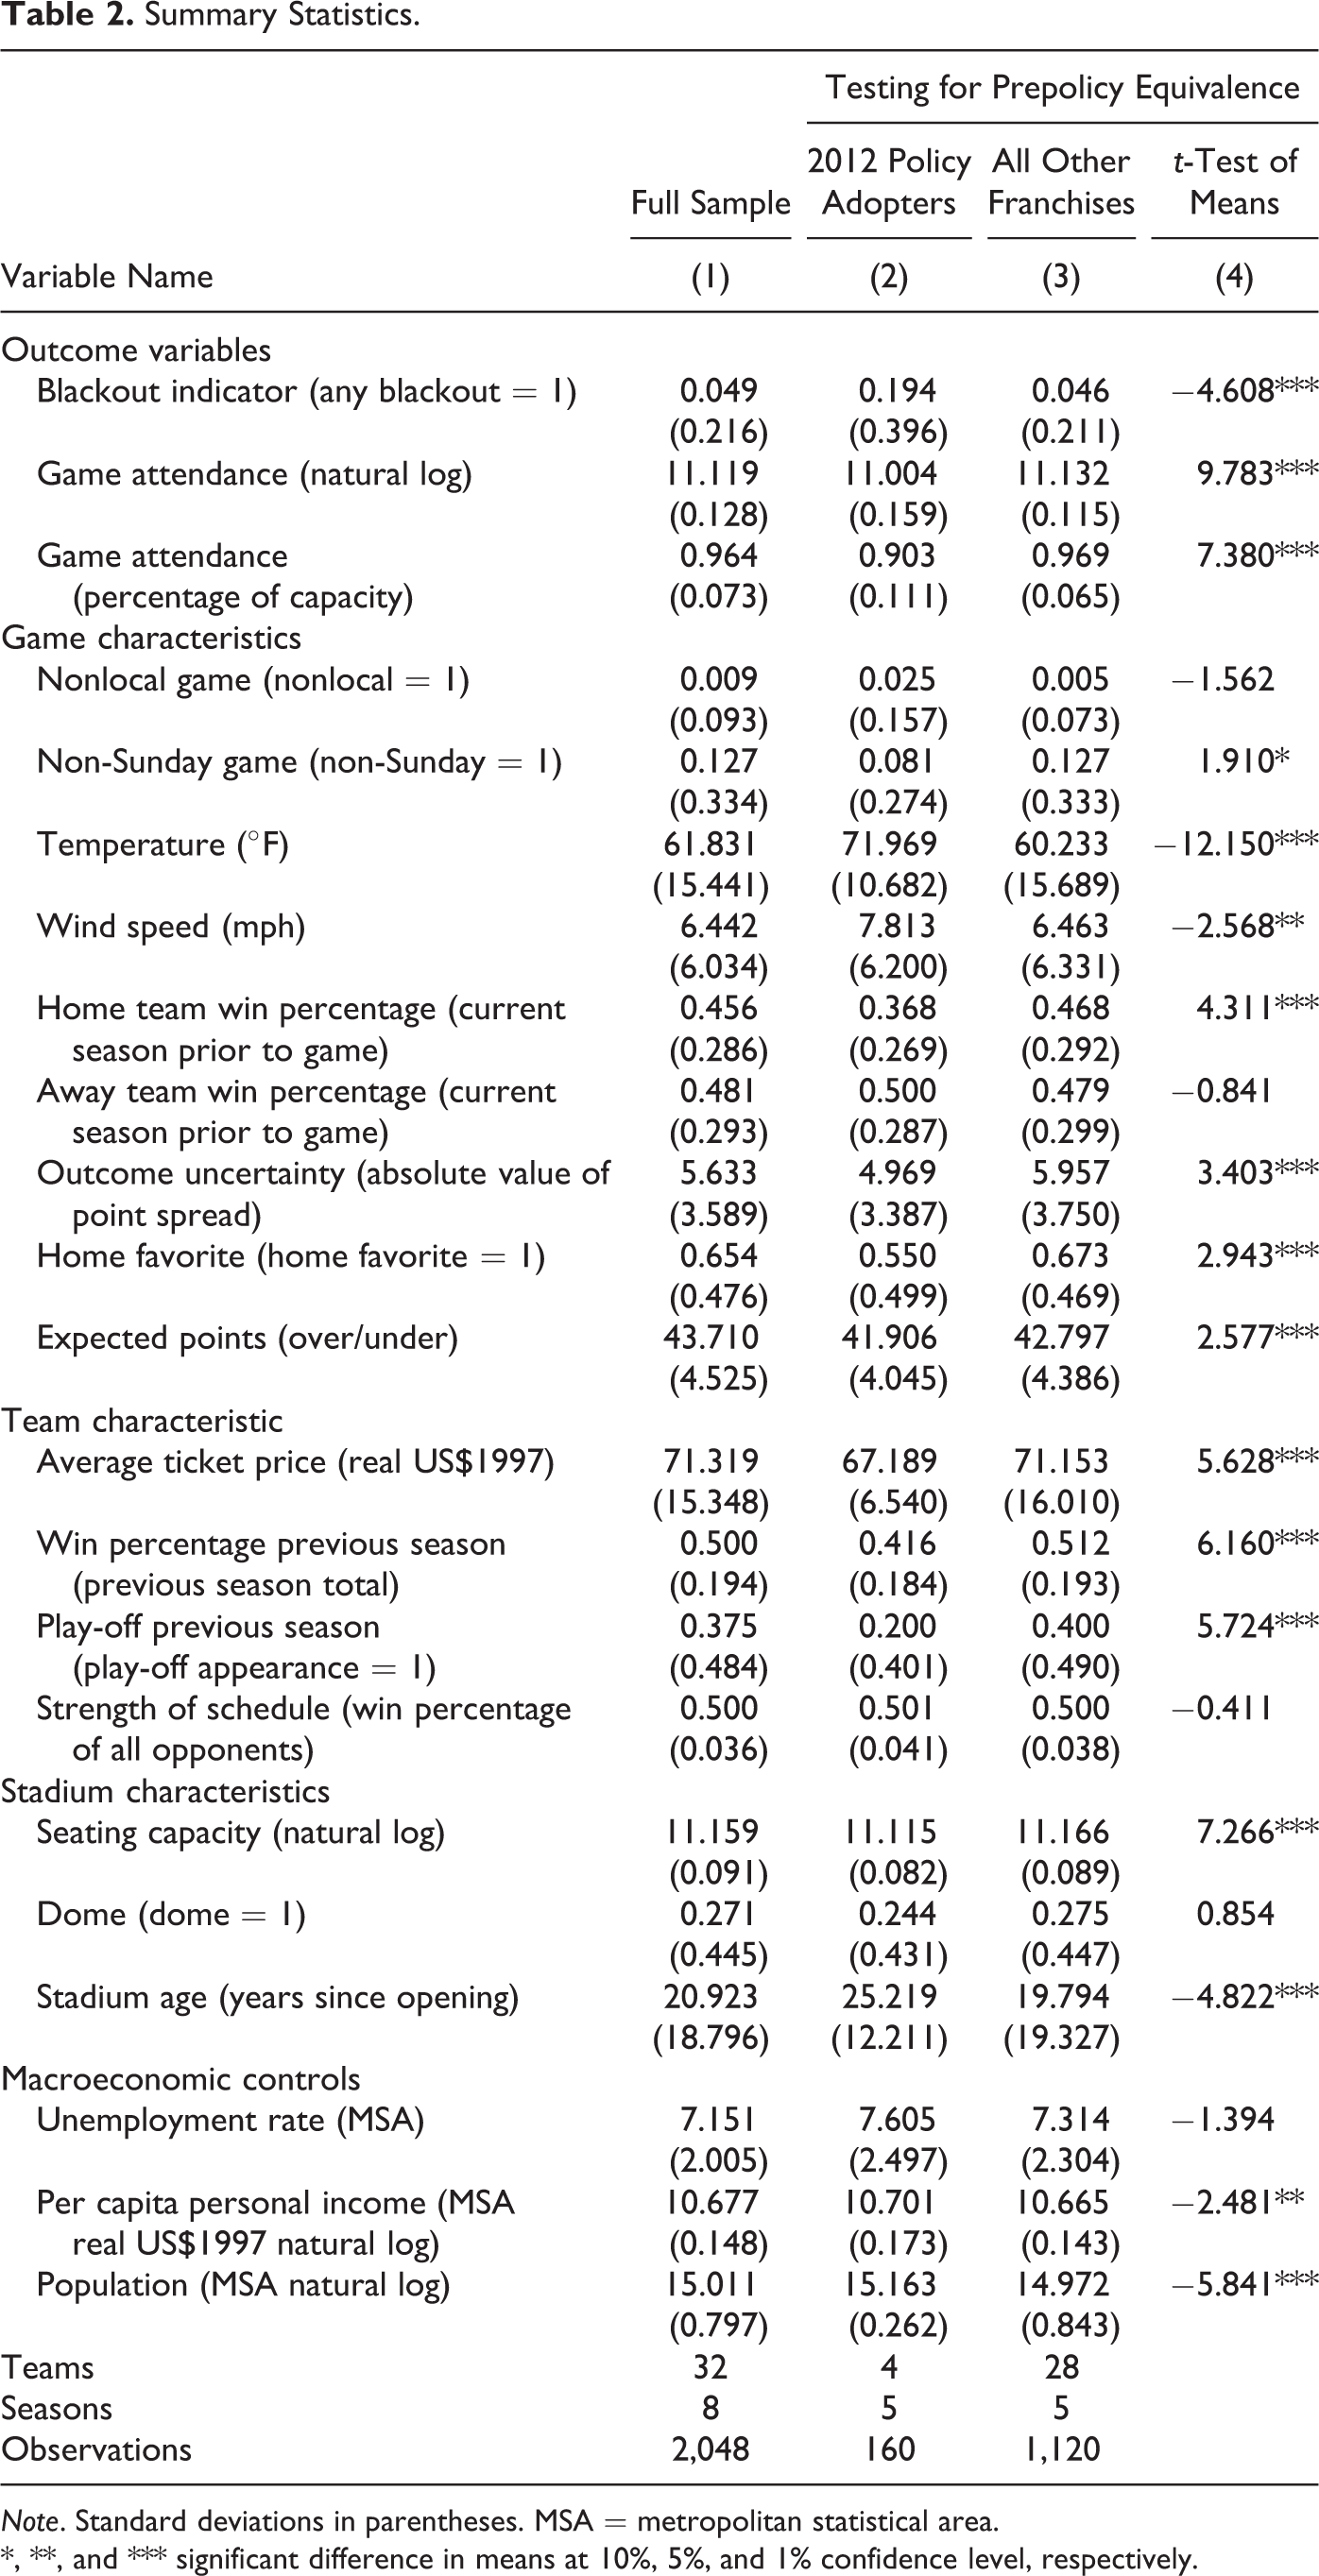
Note. Standard deviations in parentheses. MSA = metropolitan statistical area.
*, **, and *** significant difference in means at 10%, 5%, and 1% confidence level, respectively.
For teams that experienced any blackout between the 2007-2008 and 2011-2012 seasons, Figure 2 plots the frequency of local TV blackouts for teams that opted into the 2012 policy and for all other teams. The prepolicy trends between the two groups are similar with the notable exception of the 2010 season when Oakland and Tampa Bay, two policy adopters, experienced local TV blackouts in a 15 of 16 combined home games. Figure 3 presents the prepolicy trends in attendance, measured either as average per game or as a percentage of stadium capacity, for teams that opted into the policy change and for all other franchises. The graph reveals that all franchises experienced a decline in attendance, albeit of different magnitudes, associated with the economic recession and recovery from the 2008-2009 to 2011-2012 season.
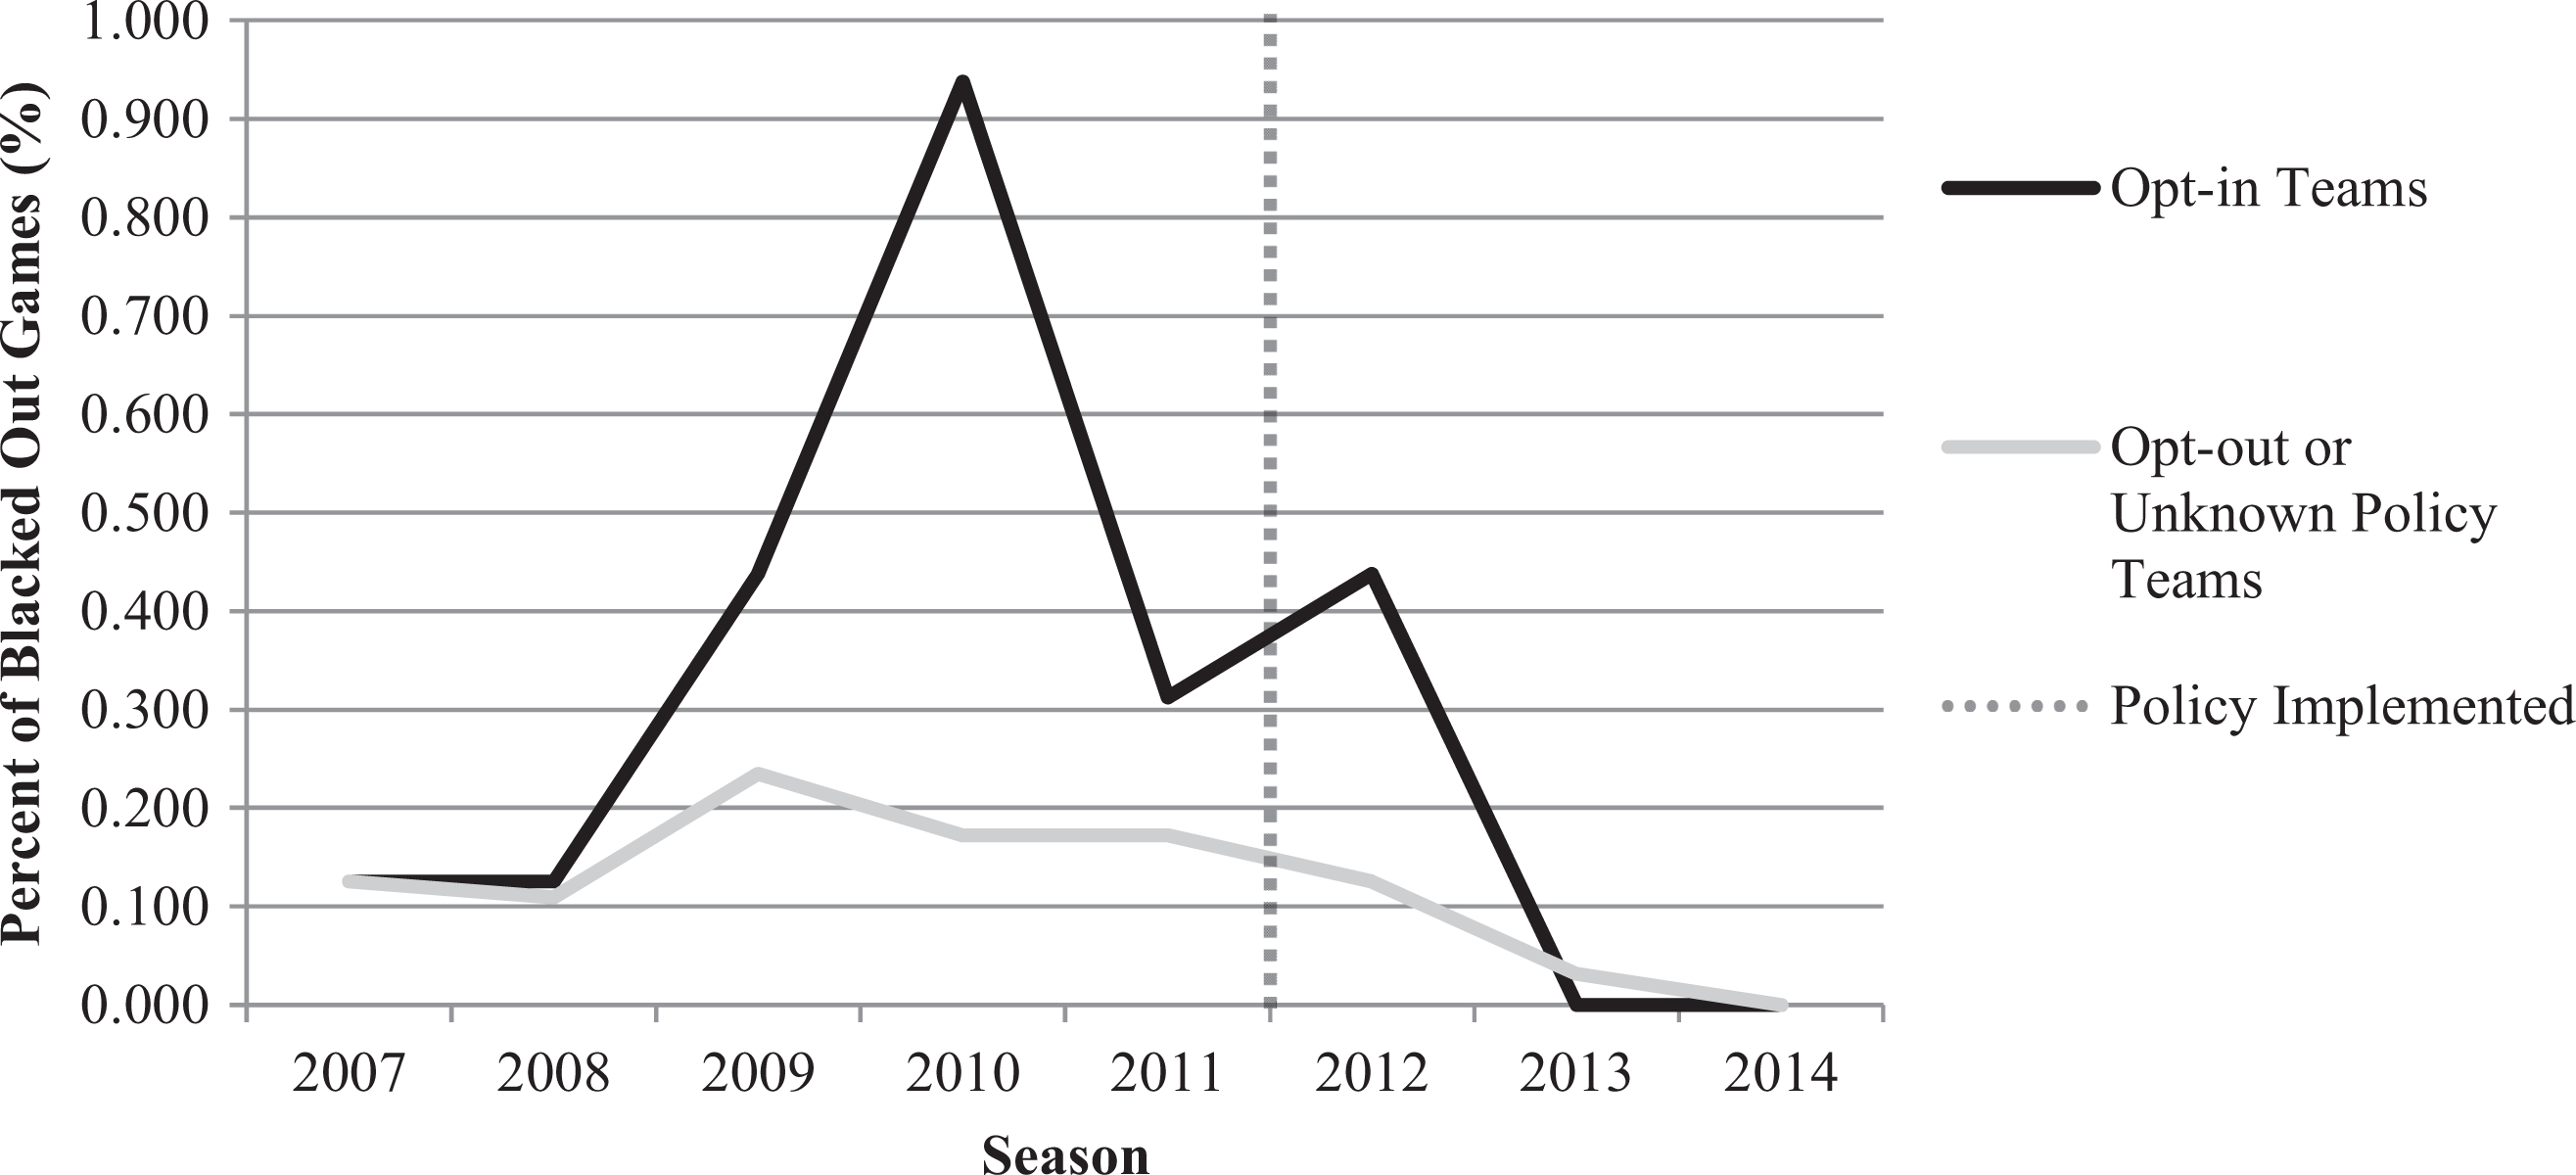
Local TV blackouts (teams with any blackouts).
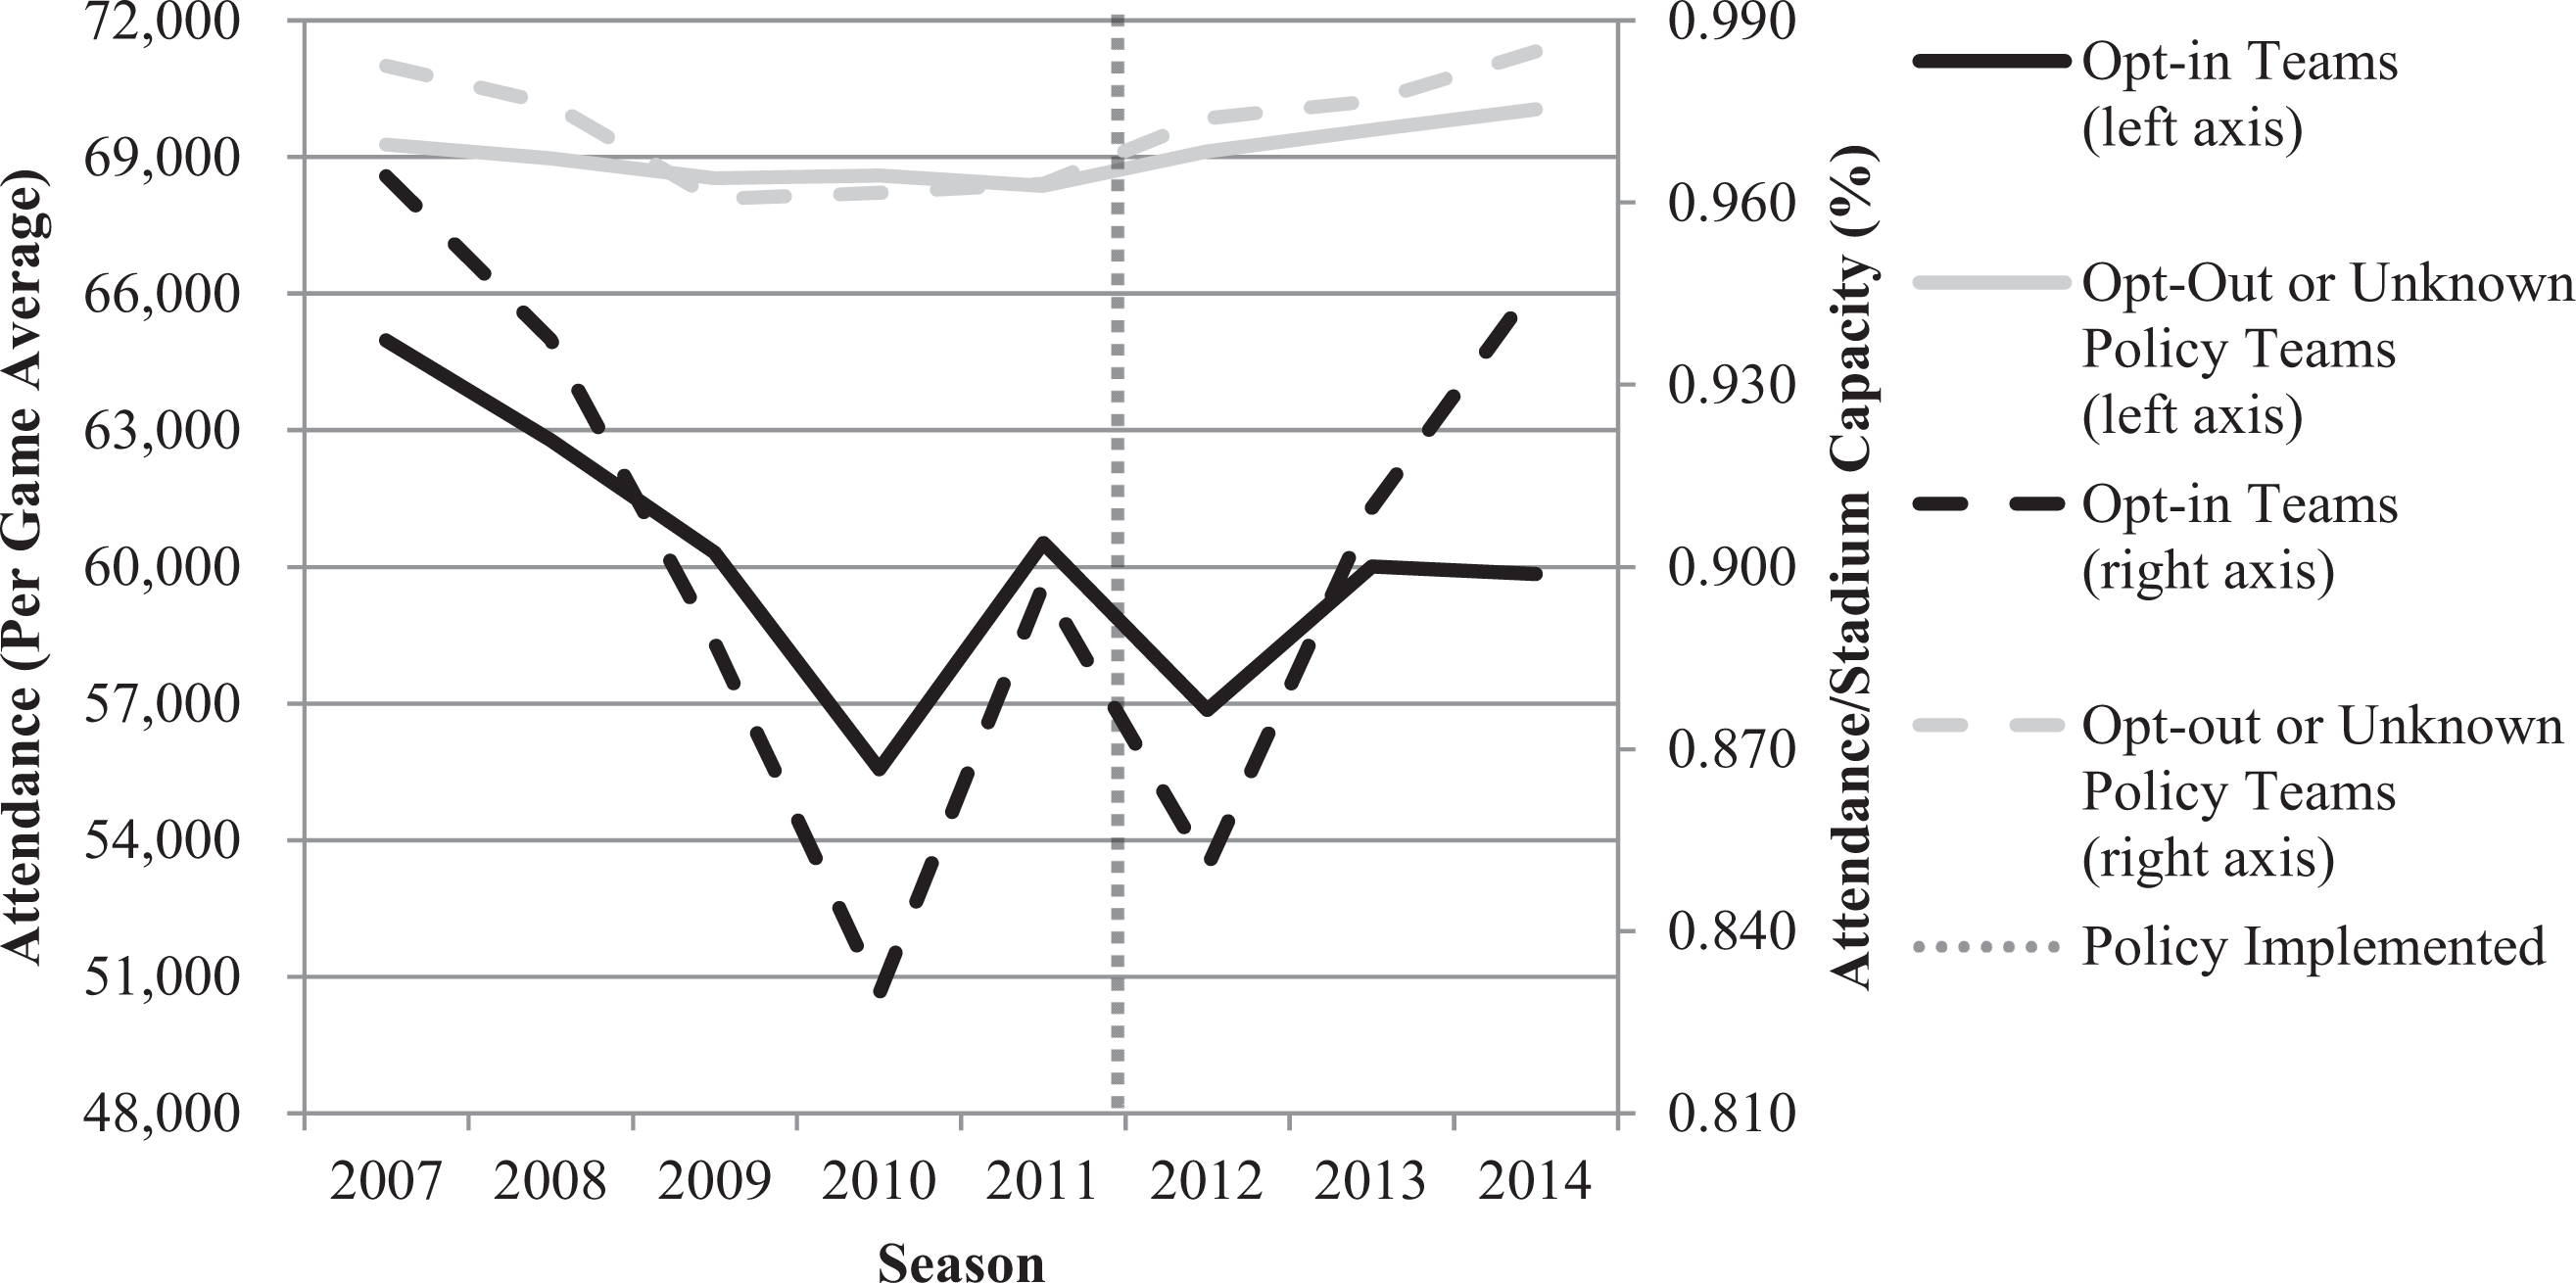
Attendance (all teams).
Results
The opt-in decision
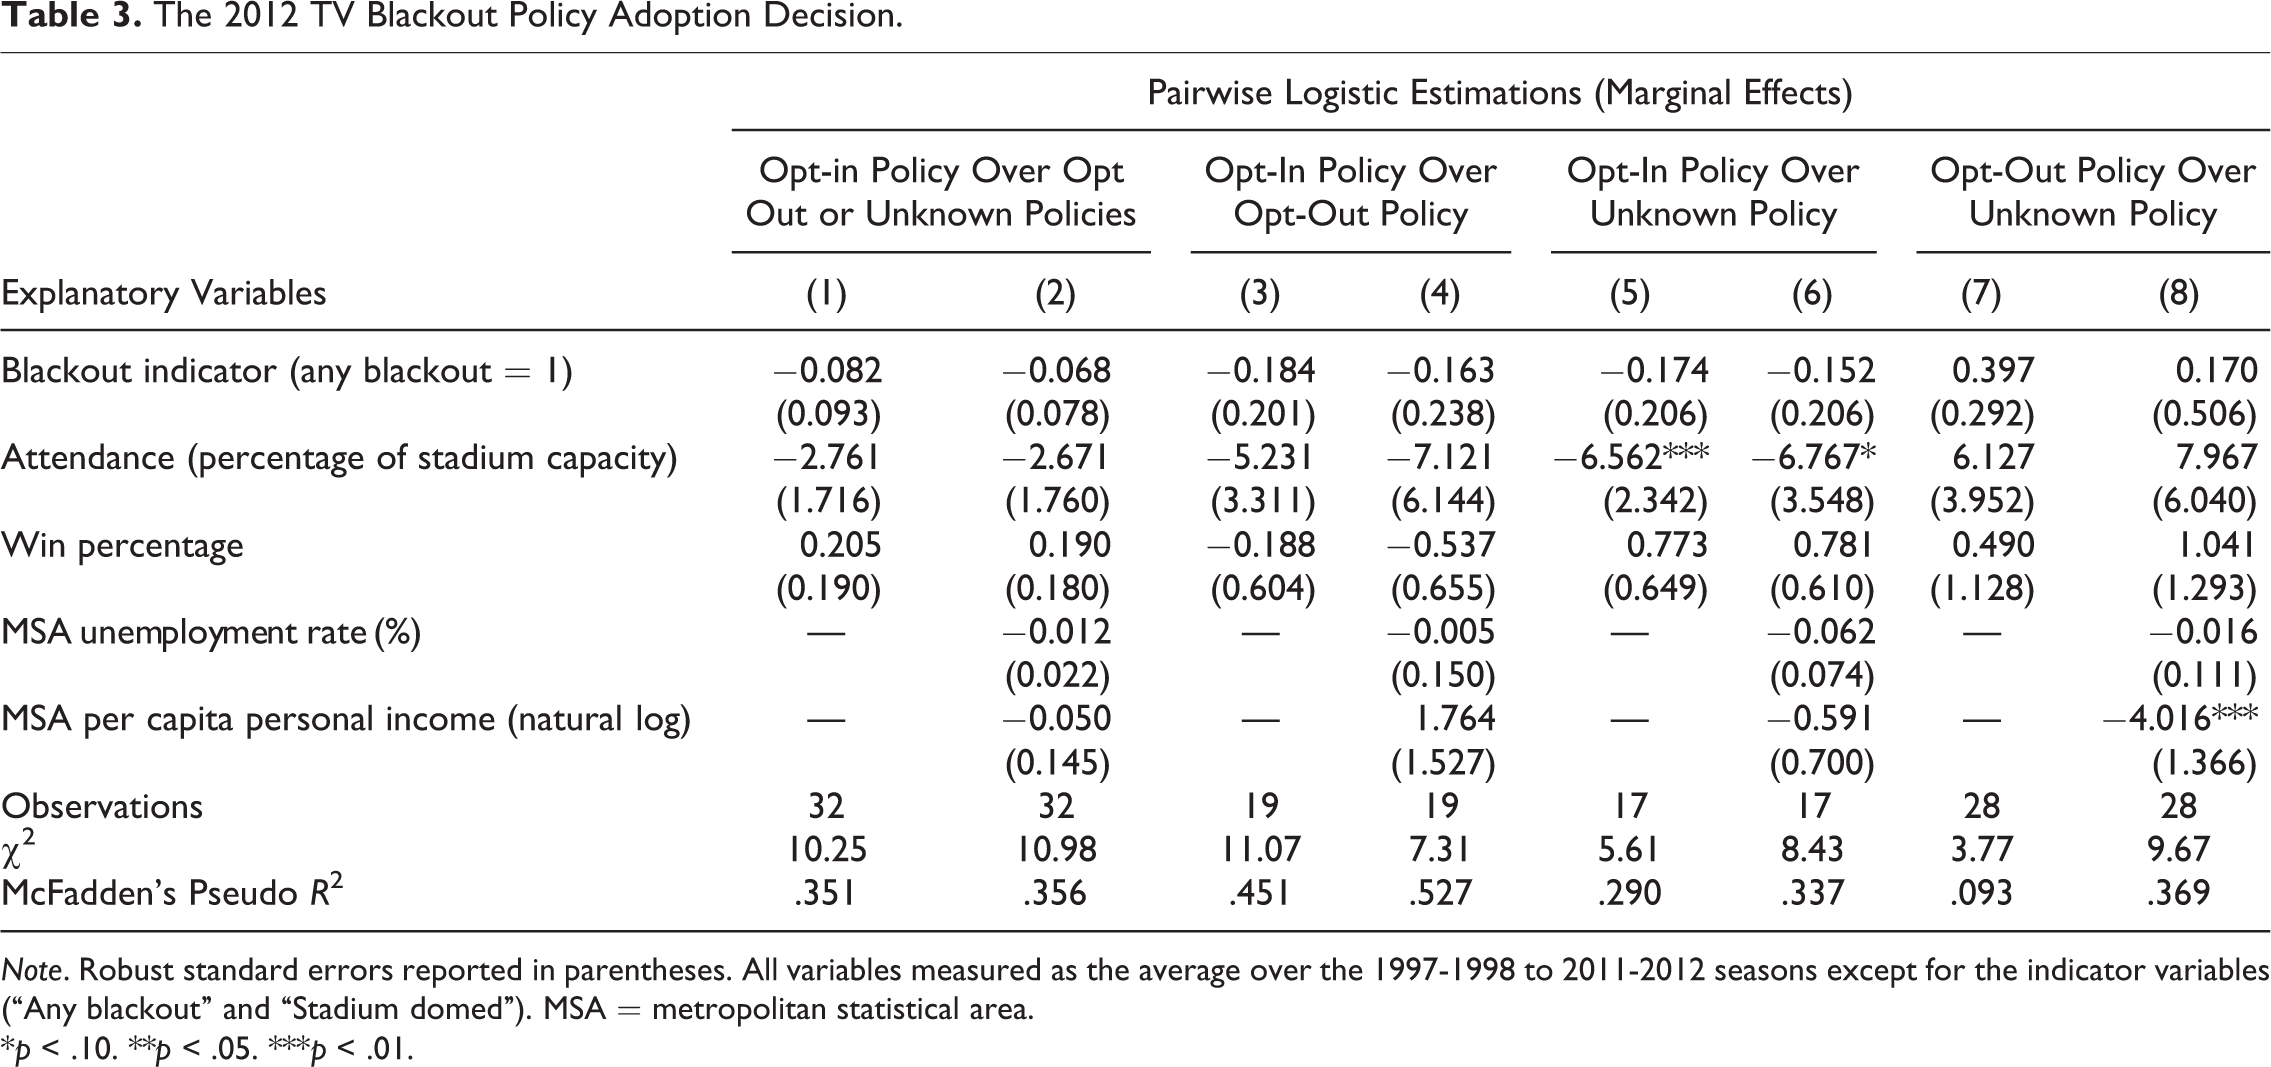
Several empirical identification problems arise in the examination of the NFL blackout policy change prior to the 2012-2013 season. If the new policy was assigned randomly to franchises, then a simple difference-in-differences model would be appropriate to measure the average treatment effects of the policy conditional on the trends in blackouts between policy adopters and nonadopters being equivalent. As teams are given the option to opt into or out of the new policy, and given the significant difference in means between policy adopters and other teams (Table 2), it is unlikely that the policy was adopted randomly by franchises. This is problematic if adopting teams faced a greater probability of a blackout and opted into the new policy in response to these expectations. In order to address this issue, we first explore the team opt-in decision, which occurred between the 2011-2012 and 2012-2013 seasons, using data from the 1997-1998 to 2011-2012 seasons prior to the policy change.
Ideally, we would prefer to estimate a multinomial logistic equation with three outcome classes (opt in, opt out, and conceal or fail to reveal). However, since we only observe a single decision for 32 franchises, and only four franchises opt into the 2012 policy, we do not have the power to meaningfully estimate that logit model. Instead, we estimate a logistic model of team i’s decision to opt into the 2012 policy for the full sample of teams as well as a set of pairwise logistic models that compare opt-in teams to opt-out teams, opt-in teams to unknown policy teams, and opt-out teams to unknown policy teams. The set of equations that we estimate can be specified as:

where choice i reflects the decision to opt into the 2012 policy change relative to opting out of the policy or failing to reveal the policy choice for the logistic model for the full sample. In the pairwise estimations, choice i represents teams that (i) opted into the 2012 policy relative to franchises that opted out of the policy, (ii) opted into the 2012 policy relative to teams that did not reveal their policy choice, and (iii) opted out of the policy relative to those that kept their policy choice unknown.
We are interested in determining whether past blackouts had an impact on a team’s decision to adopt or fail to adopt the 2012 policy. The variable of interest, blackout i , takes the value of 1 if a team experienced any local TV blackout when playing at home between the 1997-1998 and 2011-2012 seasons and 0 otherwise. We include variables for per game attendance relative to stadium capacity averaged over the prepolicy sample, attend i , and the team’s average winning percentage between the 1997-1998 and 2011-2012 seasons, win i . We also include macroeconomic controls, economic i , for per capita personal income and unemployment rate. 7
Results from the estimation of the opt-in policy choice for the full sample of teams, presented in columns 1 and 2 of Table 3, fail to reveal a significant correlation between experiencing any blackout in the 2007-2008 to 2011-2012 seasons and the decision of teams to adopt the new blackout policy. These results are reinforced by the pairwise estimations, reported in columns 3–8 in Table 3, in which we fail to find a significant correlation between previous blackouts and the policy choices. Similarly, we fail to find any relationship between past on-field performance, measured by team win percentage averaged across the 2007-2008 and 2011-2012 seasons, and franchise choices to opt into the policy. However, there is evidence that teams that had higher attendance, measured as a percentage of stadium capacity averaged across the 2007-2008 and 2011-2012 seasons, were less likely to opt into the 2012 blackout policy relative to franchises that did not reveal their policy choices. In exploring the teams that opted into the policy relative to those that explicitly opted out, the coefficient estimates on past attendance are similar in sign and magnitude but are statistically insignificant.
The 2012 TV Blackout Policy Adoption Decision.
Note. Robust standard errors reported in parentheses. All variables measured as the average over the 1997-1998 to 2011-2012 seasons except for the indicator variables (“Any blackout” and “Stadium domed”). MSA = metropolitan statistical area.
*p < .10. **p < .05. ***p < .01.
Finally, we find no evidence that local MSA unemployment rates or per capita income were significantly correlated with franchises opting into the 2012 blackout policy. The lack of significance applies to both the full sample of franchises (column 2) as well as in the pairwise estimations comparing opt-in franchises to opt-out teams (column 4) and comparing teams that opted into those that did not reveal their policy choice (column 6). In exploring differences between teams that opted out of the policy to those that kept their policy choices hidden (column 8), we find that franchises with higher local per capita personal incomes were less likely to reveal that they opted out of the 2012 policy.
Taken together, the logistic and pairwise logistic regressions fail to reveal that past blackouts or past on-field performance are related to franchise policy choices, although the null results might be driven by the small sample sizes. The sign of the coefficient on past blackouts is consistently negative in the estimations comparing franchises that opted into the policy relative to teams that opted out, teams that did not reveal their policy choice, or both. Past attendance is (weakly) correlated with teams opting into the 2012 policy which is consistent with teams that are more likely to face blackouts, determined by stadium attendance, nonrandomly opting into the new policy. Although these estimation results are likely to be underpowered due to the small sample size, the signs of the coefficients move in the expected direction. 8 In order to control for nonrandom assignment resulting from unobservable team characteristics that are unchanging over time, we include team-fixed effects in our estimations of the probability of local TV blackouts and attendance.
The impact of the policy change on the probability of blackouts
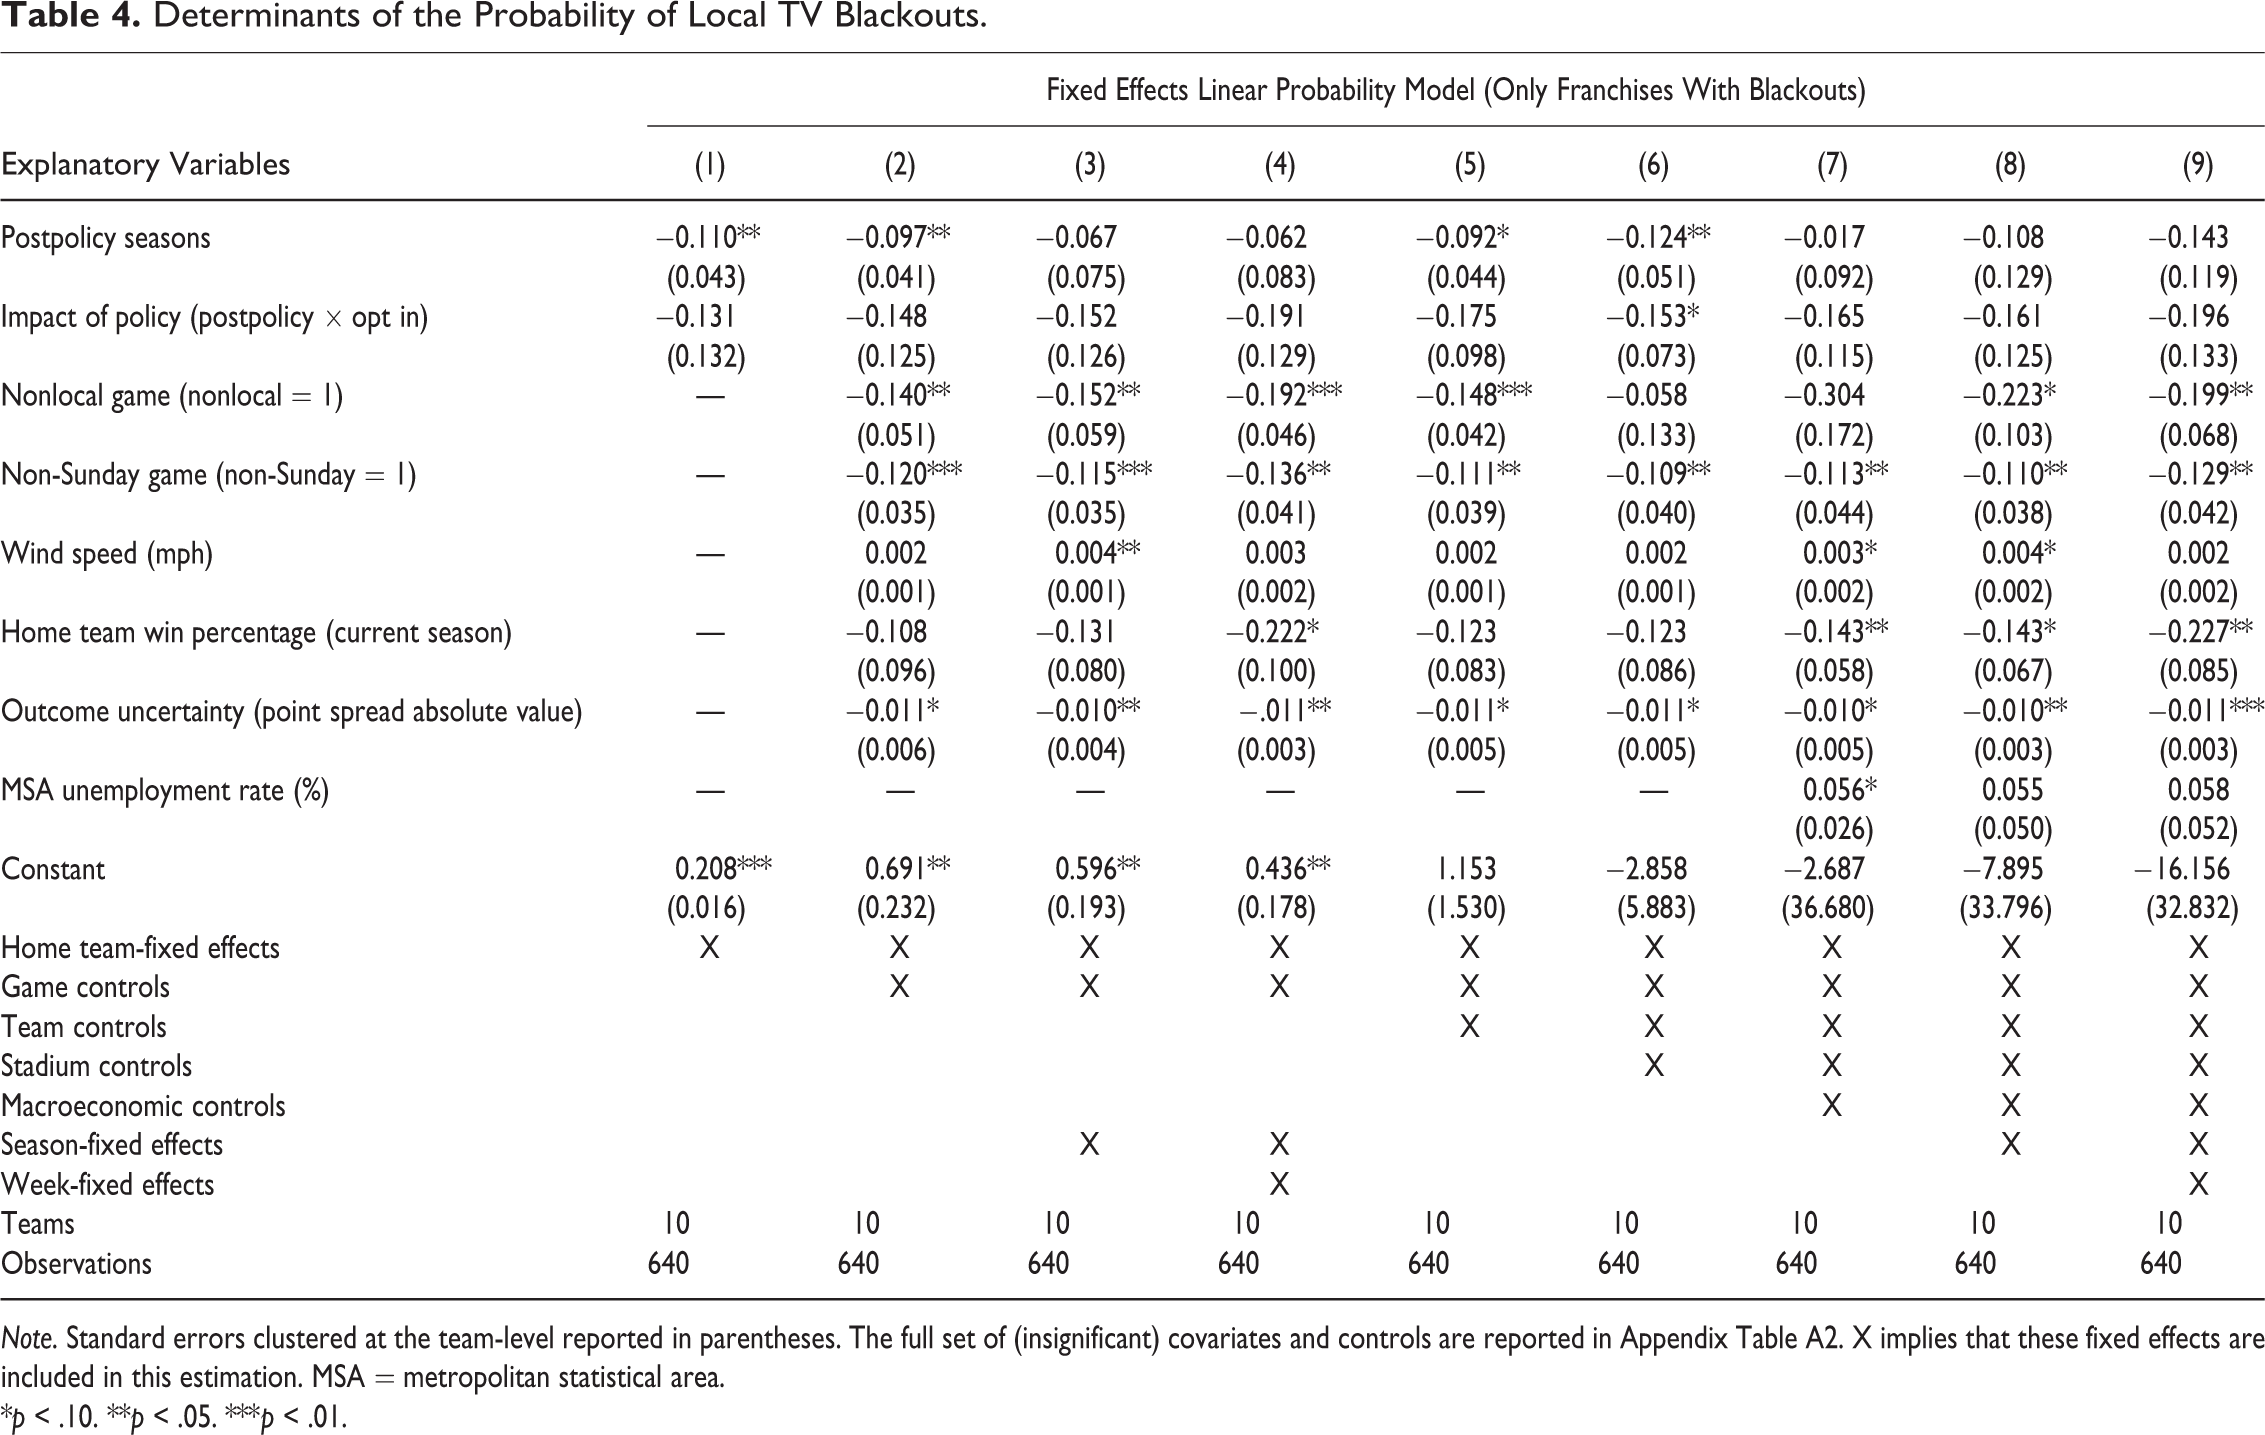
We estimate a fixed effects linear probability model on the likelihood of local TV blackouts for teams that adopted the new policy relative to all other franchises. The inclusion of team-fixed effects controls for unobserved heterogeneity in the probability of a local TV blackout that varies across franchises. We estimate the following difference-in-differences specification:

where policy t is an indicator variable for postpolicy seasons; optin i is an indicator variable for teams that adopt the 2012 blackout policy; Xit are game, team, stadium, and macroeconomic controls; and α i are the team-specific fixed effects.
Since the outcome variable of interest here is a limited dependent variable, identification relies only on the 10 franchises that “switch” from no blackout to blackout in at least one game in the sample. Baseline differences between teams that opt into the new policy and all other franchises are captured by the team-fixed effects. In subsequent estimations, we include season- and week-of-season-fixed effects to control for changes in the probability of local TV blackouts that are common for all teams in a season or in a particular week of the season. The time-varying controls, including game, team, and stadium characteristics as well as MSA-level macroeconomic variables, account for trends and nonpolicy changes over time. Standard errors are clustered at the team-level across specifications.
Results from the estimations on the impact of the 2012 blackout policy adoption upon the probability of local TV blackouts are presented in Table 4. The baseline specification, column 1, considers only team-fixed effects in examining the impact of the 2012 policy. In all of the subsequent specifications (columns 2–9), we include game-level characteristics. Team characteristics are included in columns 5–9, stadium characteristics are included in columns 6–9, and macroeconomic controls are included in columns 7–9. We include season-fixed effects with only game characteristics in columns 3 and 4 and with the full set of covariates in columns 8 and 9. Finally, estimations with week-of-season-fixed effects, with and without the additional covariates, are reported in columns 4 and 9, respectively. 9
Determinants of the Probability of Local TV Blackouts.
Note. Standard errors clustered at the team-level reported in parentheses. The full set of (insignificant) covariates and controls are reported in Appendix Table A2. X implies that these fixed effects are included in this estimation. MSA = metropolitan statistical area.
*p < .10. **p < .05. ***p < .01.
Although the estimated coefficients are consistently negative, we fail to find any significant impact of the 2012 policy on reducing the probability of local TV blackouts across specifications. The estimates on the impact of the policy are likely to be low powered, a limitation that we cannot resolve given both the small number of postpolicy seasons and policy-adopting franchises that experienced blackouts in the sample time period. Nonetheless, the estimated magnitudes of the policy impact are large and economically important given the baseline probability of a local TV blackout for these franchises of 19.4%. In particular, the estimated coefficients of the policy impact, ranging from 13.1 to 19.6 percentage points, eliminate any prepolicy differences in the likelihood of local TV blackouts.
Table 4 also reports the control variables that are significantly correlated with the probability of local TV blackouts. Teams playing a home game in a nonlocal stadium (i.e., Buffalo playing in Toronto, various franchises playing in London) or on any day other than Sunday are less likely to face a local TV blackout. In addition to fans and franchises viewing these games as more desirable, it is also unclear whether the NFL blackout policies are applicable to nonlocal games or non-Sunday games are subject to the ticket sale restrictions. Although there was no significant relationship between temperature and the probability of a blackout, there is some evidence that wind speed, a proxy for adverse weather conditions, is positively correlated with local TV blackouts.
Finally, both the quality of the home team, measured as the current win percentage, and outcome certainty, measured as the absolute value of the point spread, are negatively correlated with the probability of a local TV blackout. The result that teams with better records prior to the game face fewer blackouts is unsurprising, but the result on outcome certainty is unexpected. The estimated coefficient(s) imply that a one point increase in the point spread, regardless of whether the home or away team is favored, is associated with a 1% decrease in the probability of a local TV blackout. This contrasts with the conventional wisdom that fan interest is greater for games with more uncertainty or lower point spreads. Moreover, this relationship is not being driven by home favorites, which are (insignificantly) positive correlates with the probability of local TV blackouts. We fail to find expected points, average ticket prices, stadium characteristics, or macroeconomic controls to be related to local TV blackouts.
The impact of the policy change on attendance
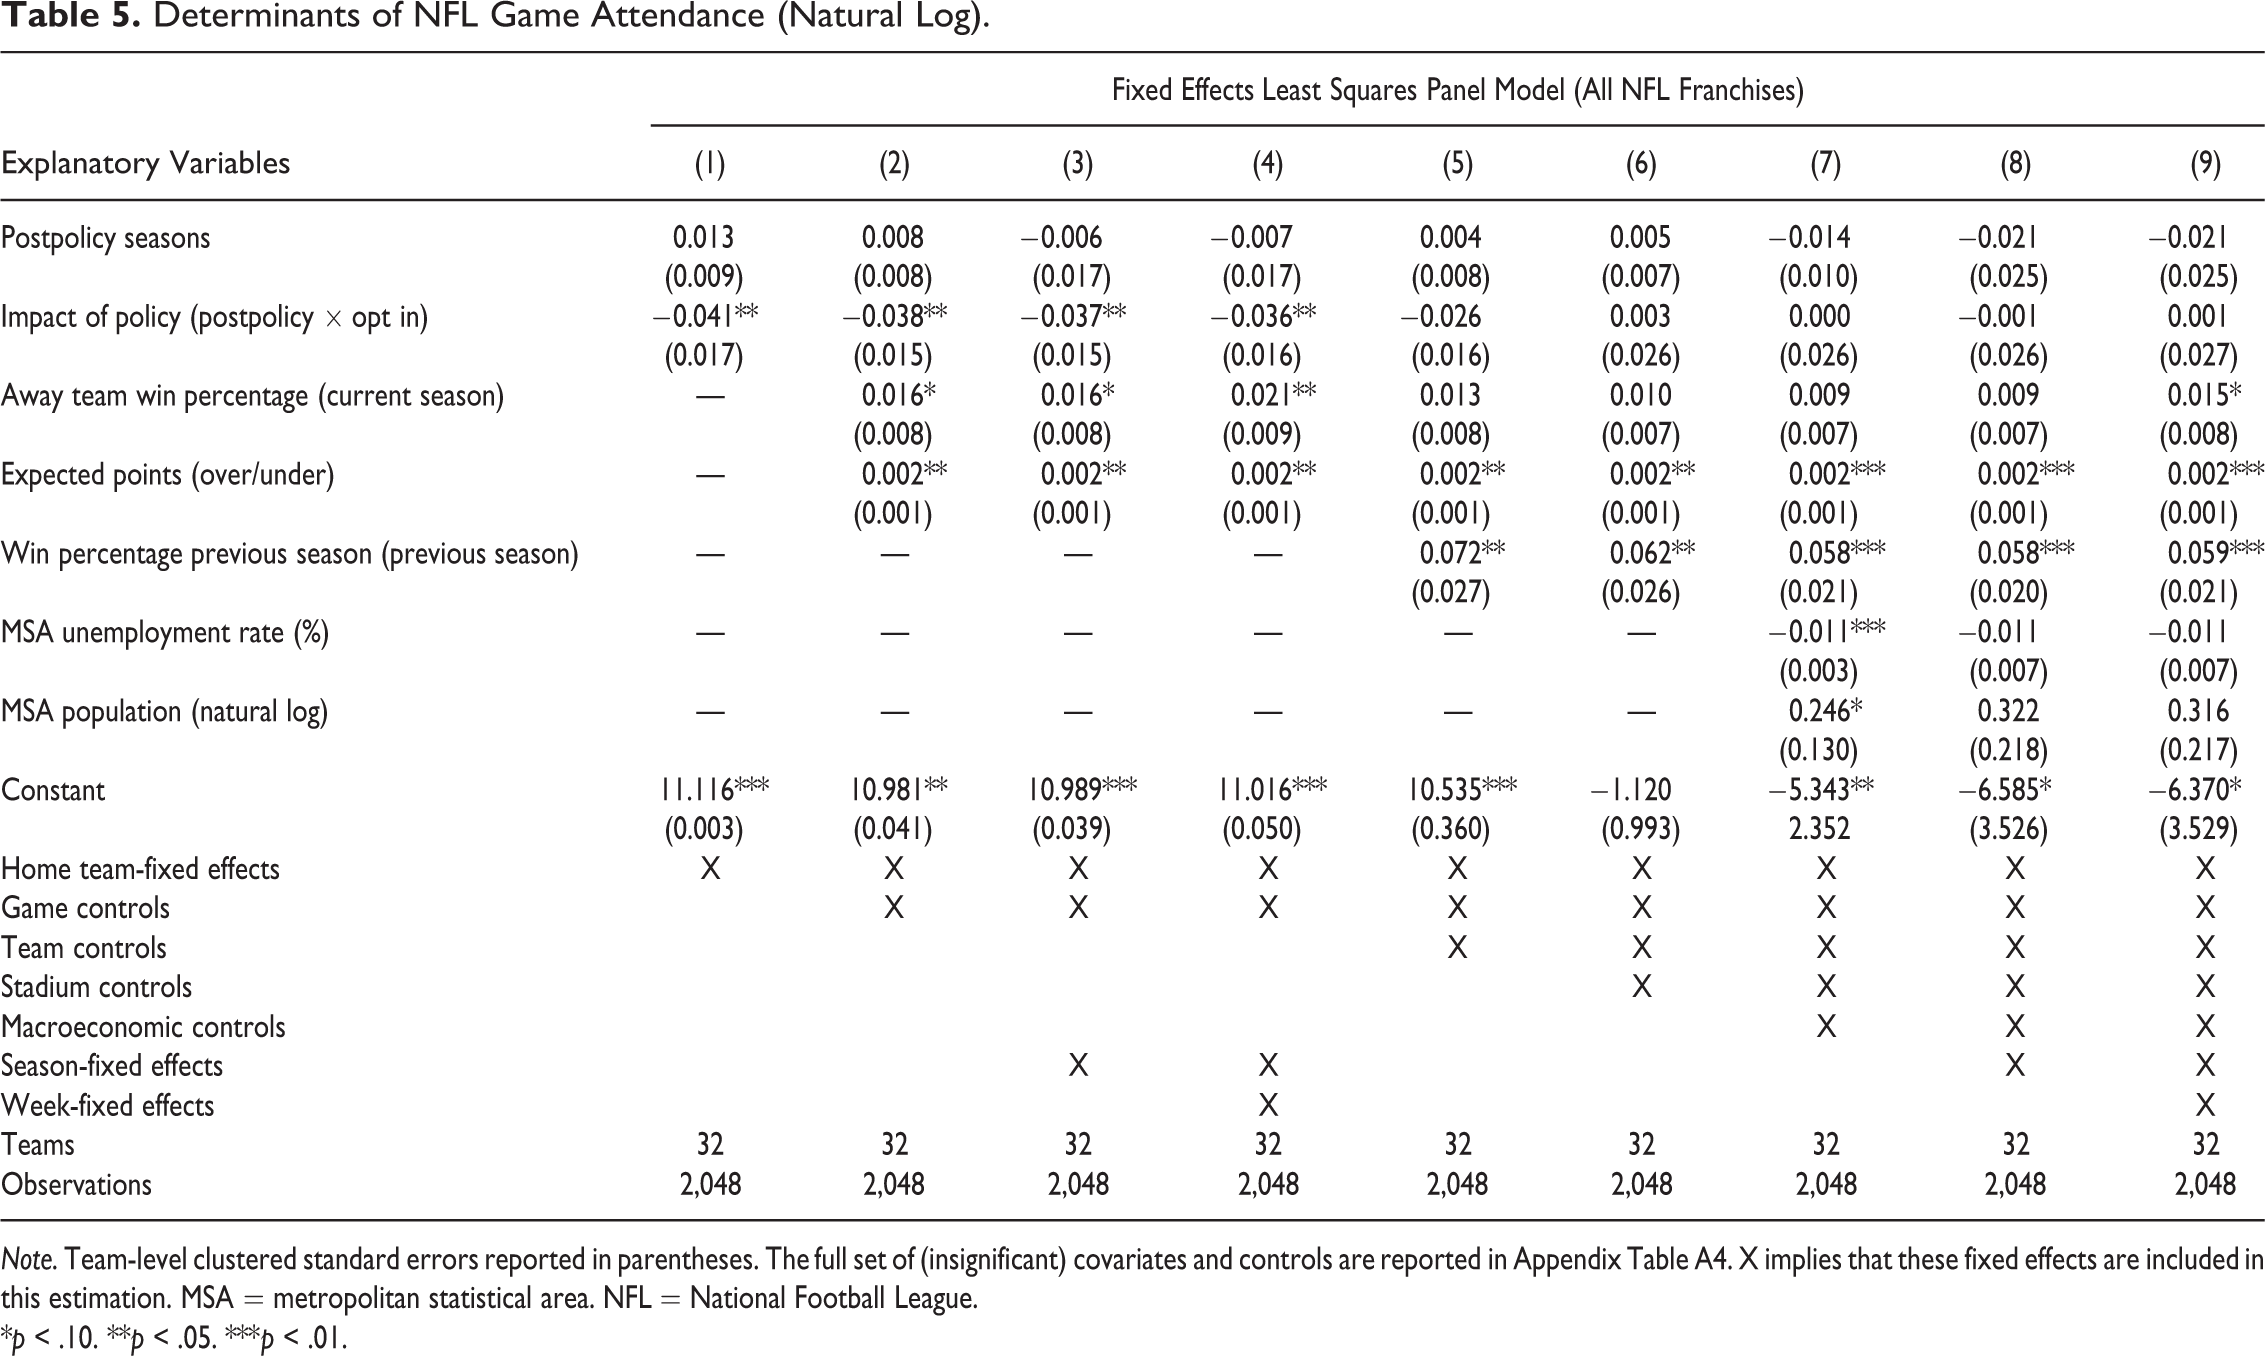
Even if the policy did not have the intended impact on blackouts, it is possible that game attendance was adversely affected if opting-in franchises had less motivation to sell unsold tickets. To explore the policy implications on game attendance, we estimate a linear model with team-fixed effects and indicator variables for the postpolicy implementation seasons and for opt-in franchises in the postpolicy seasons. We consider the natural logarithm of game attendance and attendance measured as a percentage of stadium capacity as outcome variables and estimate the following model:

The policy implementation and franchise opt-in variables are defined as before. We include specifications that control for game, team, stadium, and macroeconomic covariates as well as season- and week-of-season-fixed effects. The estimation results on the determinants of the natural log of attendance and attendance as a percentage of stadium capacity are reported in Tables 5 and 6, respectively.
Determinants of NFL Game Attendance (Natural Log).
Note. Team-level clustered standard errors reported in parentheses. The full set of (insignificant) covariates and controls are reported in Appendix Table A4. X implies that these fixed effects are included in this estimation. MSA = metropolitan statistical area. NFL = National Football League.
*p < .10. **p < .05. ***p < .01.
Determinants of NFL Game Attendance Rate (Percentage of Stadium Capacity).
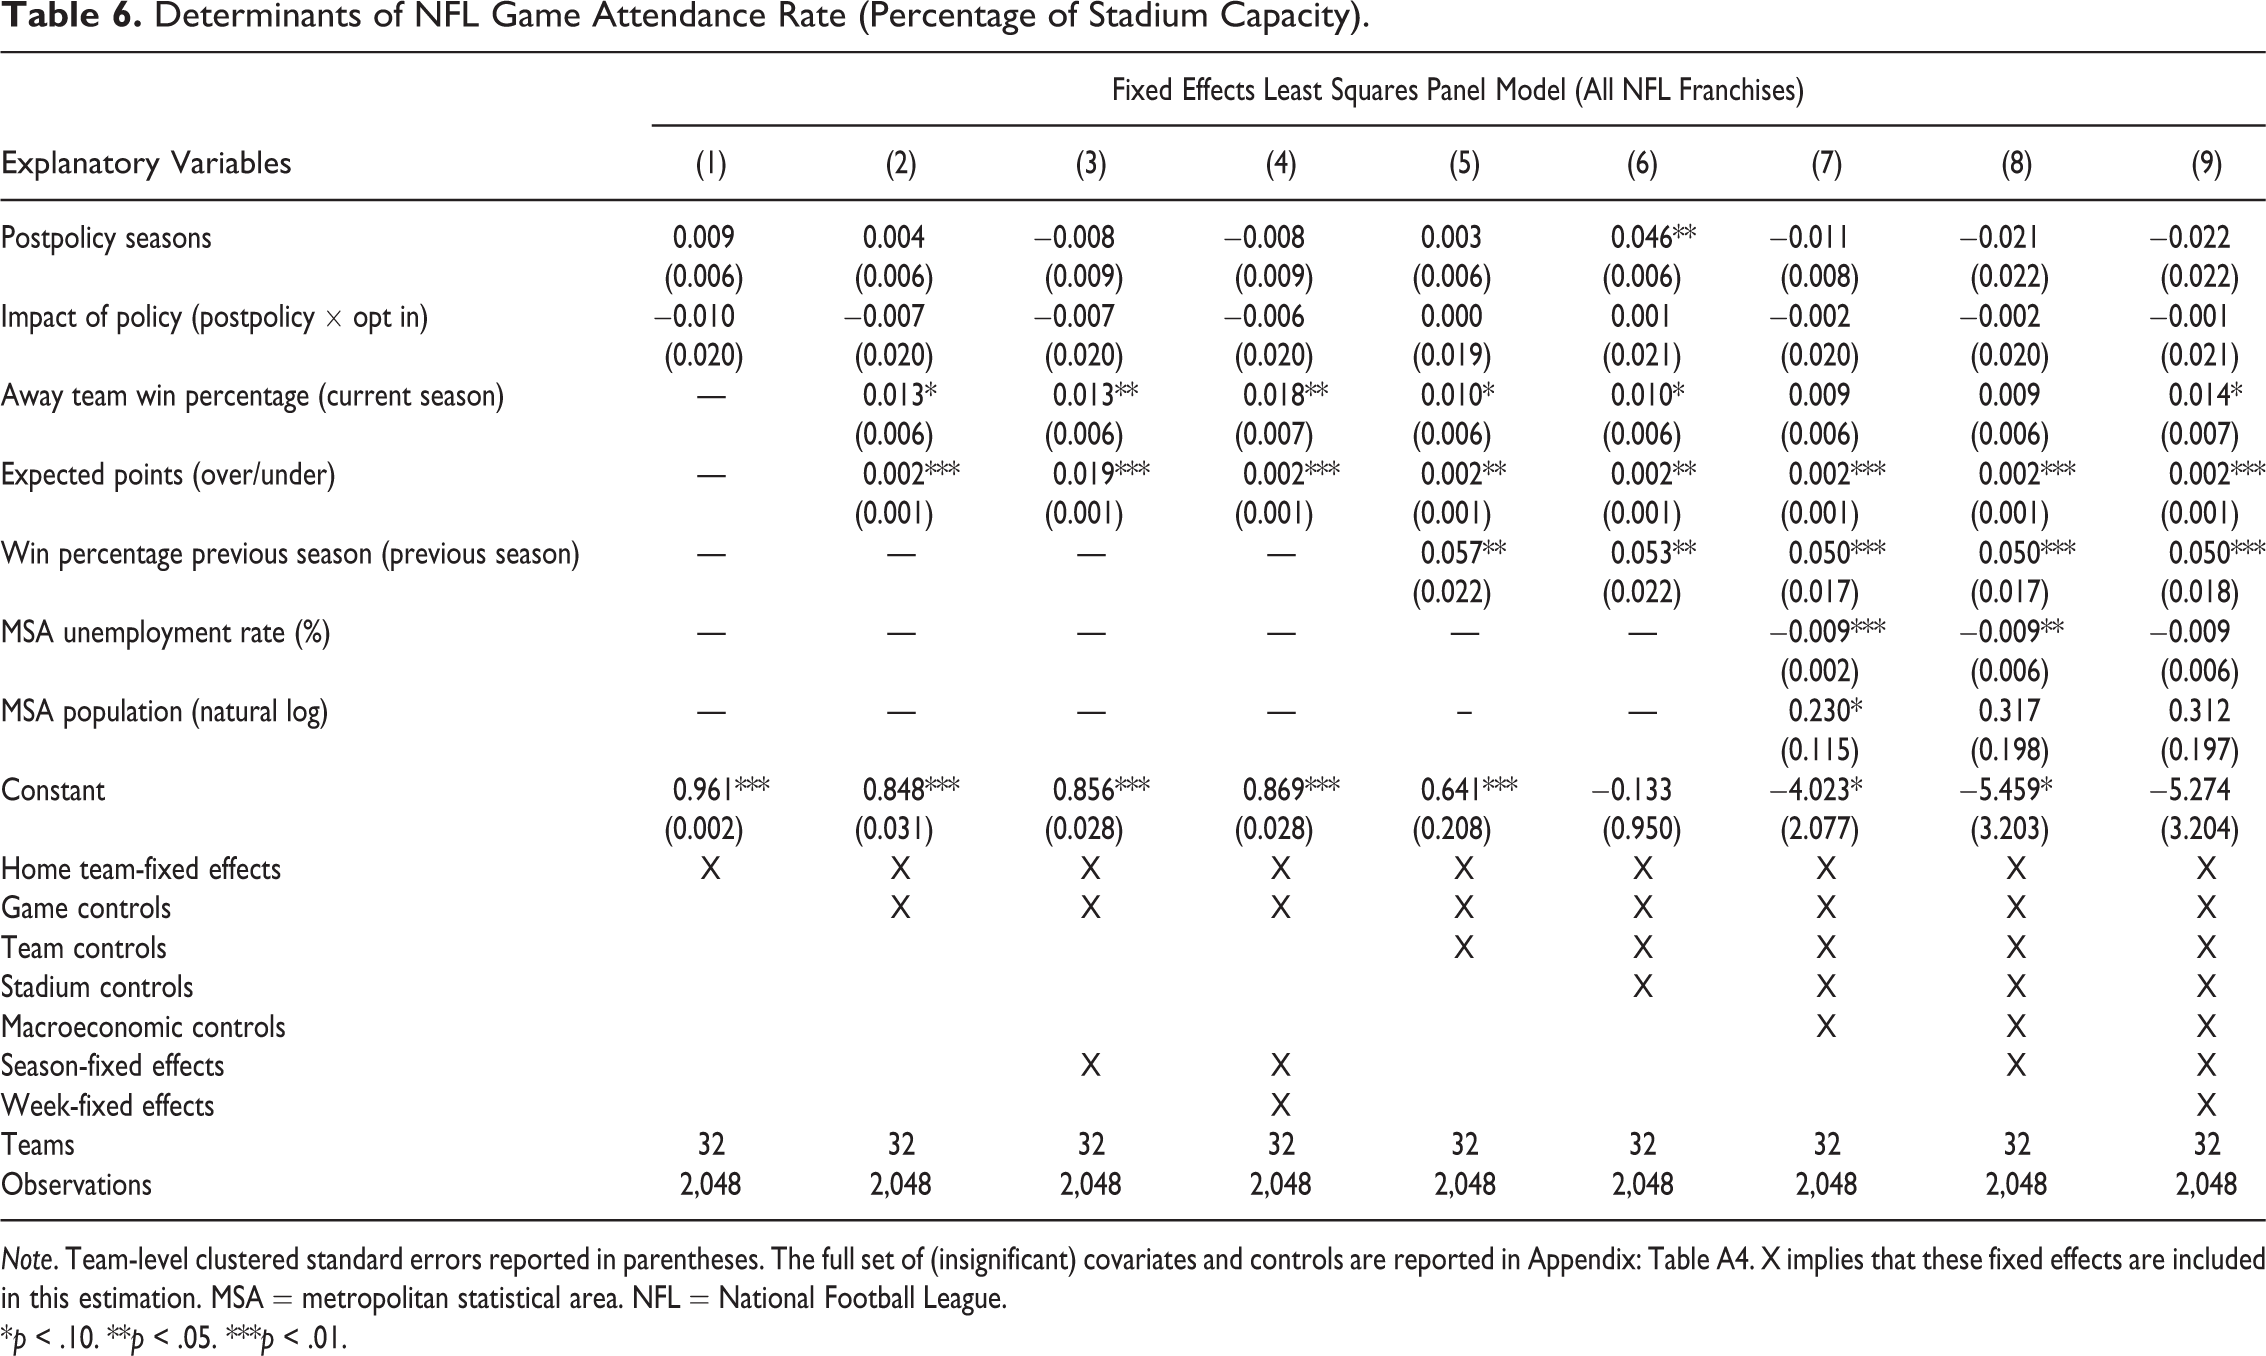
Note. Team-level clustered standard errors reported in parentheses. The full set of (insignificant) covariates and controls are reported in Appendix: Table A4. X implies that these fixed effects are included in this estimation. MSA = metropolitan statistical area. NFL = National Football League.
*p < .10. **p < .05. ***p < .01.
When we do not control for stadium characteristics, namely, seating capacity, we find that the new blackout policy is associated with a 3.6–4.1% decrease in game attendance (Table 5: columns 1–4). However, once we control for stadium capacity changes (Table 5: columns 5–7) or measure attendance relative to capacity (Table 6), we find no significant relationship between policy adoption and a change in game attendance. Taken together, the results suggest that teams that adopted the 2012 blackout policy experienced a decrease in attendance that arose from downward adjustments to their stadium seating capacities.
Controlling for fixed team-level unobservables, the only game-level characteristics that are significantly correlated with game attendance are the away team win percentage and the expected points in the game. Away team win percentage, as a proxy of away team quality, is positively correlated with game attendance implying fans care about opponent quality. The coefficients on expected points, measured by the betting line over/under on total points for both teams, imply that a 10-point increase in expected total points scored increases attendance by 2%. Surprisingly, we fail to find a significant relationship between weather (temperature and wind speed) or outcome certainty and game attendance across specifications.
For team characteristics, we fail to find any relationship between average ticket prices and game attendance. As our measure of ticket prices is an average across all tickets sold, it is likely that it is a poor indicator of the marginal ticket sold. Consistent with the previous literature, we find a significant and positive coefficient on team win percentage in the previous season. The estimated magnitudes imply that one additional win in the previous season increases attendance between 0.30% and 0.45%. We fail to find that play-off appearances in the previous season or opponent quality are significantly related to current attendance. The stadium characteristics are generally not statistically significant, but there is some evidence of higher attendance in more populated MSAs and in MSAs with lower rates of unemployment.
Thus far, we have failed to find evidence that teams that opted into the 2012 NFL blackout policy faced a decreased probability of local TV blackouts or had significantly lower attendance after controlling for stadium capacity. One possible explanation behind these null results is that the appropriate sample to analyze the policy impacts is not all NFL franchises, but only franchises that are likely to blackout. We address this alternate explanation below.
Robustness Checks
In order to test the robustness of our results, we consider four samples of NFL franchises and estimate the effects of policy adoption on the probability of local TV blackouts and both outcomes on game attendance. In correspondence with franchises that did not opt into the 2012 blackout policy, the most common response was that the policy change was unimportant for these franchises because they either consistently sold out home contests or had not experienced a local TV blackout in recent history. Thus, it is a feasible that the appropriate reference group for teams that opt into the policy change are only the other franchises that are at risk of a blackout.
In the estimations on the determinants of local TV blackouts, we controlled for unobservable team-fixed effects and restricted the sample to only franchises that face a home blackout between the 2007-2008 and 2011-2012 seasons. In the robustness checks, we also estimate the probability of local TV blackouts under the full sample of franchises, under the subsample of 12 franchises that publicly announced their policy choice in 2012, and under a subsample restricted to the 13 franchises that had average attendance, as a percentage of stadium capacity, that fell below 95% between the 2007-2008 and 2011-2012 seasons. In each of these alternate samples, franchises that did not experience a local TV blackout are included and therefore have no variation in the outcome variable. The inclusion of these teams in fixed effects estimations to control for unobservable heterogeneity biases the estimated coefficients downwards. We consider the same four alternate samples of franchises in our estimations of the determinants of game attendance, albeit without the same concerns regarding biased coefficient estimates.
The regression results on the probability of local TV blackouts, reported in Table A4 in Appendix, fail to reveal any significant impact of the 2012 policy adoption on reducing the probability of local TV blackouts. Other than the expected reduction in the magnitudes of the coefficient estimations, the results from the alternate samples are consistent with those reported for the sample including only teams that experienced a home blackout. The only control variables that gain significance are the team’s strength of schedule, measured as the win percentage of all opponents in the announcement sample, the indicator variable for domed stadiums in the full and announcement samples, and the MSA unemployment rate in the full and announcement samples. Playing better opponents or in a domed stadium reduces the probability of a local TV blackout, whereas an increase in unemployment rates increases the blackout probability, as expected.
The robustness checks on game attendance, reported in Appendix Table A5, reveal some differences relative to the full sample of franchises, but we continue to fail to find any significant effect of teams opting into the 2012 blackout policy upon per game attendance, measured either directly or as a percentage of stadium capacity. The coefficient estimates on expected points and previous season win percentage remain positive and significant with larger magnitudes in the subsample estimations. Additionally, there is evidence of a positive relationship between local population and attendance and a negative relationship between local unemployment rates and attendance. Consistent with the estimation results for the probability of local TV blackouts, we find that nonlocal games, non-Sunday games, current season win percentage, and lower outcome uncertainty are positively correlated with game attendance.
Conclusion
Using game-level data on TV blackouts and game attendance, we fail to find evidence that the adoption of the 2012 policy change governing local TV blackouts in the NFL was effective in reducing the probability of a home blackout or otherwise had an impact upon game attendance. Although we fail to find a significant impact of the policy adoption upon reducing local TV blackouts, the coefficient estimates are consistently negative and large and the limited number of policy adopters that experience blackouts and limited number of postpolicy seasons suggest that the estimations are underpowered. There is some evidence that teams that adopted the 2012 blackout policy experienced a decrease in game attendance following the policy implementation, but the effect disappears after we control for changes in stadium capacity.
Controlling for unobserved heterogeneity using team-fixed effects, we also explore the relationship between game, team, and stadium characteristics, as well as macroeconomic controls, and the likelihood of local TV blackouts and NFL game attendance. We find that local TV blackouts (attendance) is negatively (positively) correlated with home team quality in both the current and previous seasons and opponent quality in the current season. We find that current performance is most important in determining the probability of TV blackouts, but it is past performance that is most important in determining attendance. These results are suggestive of differences between season ticket sales being driven by previous performance and individual, marginal sales being driven by current performance.
Contrary to the theory that fans are concerned with outcome uncertainty, we find that as outcome certainty, measured by the absolute value of the expected point spread, increases, games are less likely to be blacked out and are better attended and that these results are not being driven by home favorites. However, we also find that fans care about the quality of the game as an increase in the expected points scored is positively correlated with game attendance and is (insignificantly) negatively correlated with the likelihood of a local TV blackout. Finally, there is evidence of the importance of macroeconomic variables, particularly local unemployment rates, in increasing the probability of a TV blackout or in decreasing game attendance.
Although it is tempting to attribute the null results on policy impacts to ineffective policy design, a number of alternate explanations remain plausible. In robustness checks, we explored and discarded the argument that the 2012 policy was effective when restricting our analysis to subsamples of franchises with higher TV blackout risk. Of greater concern is the possibility that we failed to identify all franchises that switched to the new policy. If this is the case, then our estimation results on the policy effects would be underestimated. Despite our efforts to identify the policy choice of all franchises, we still failed to identify the choice for 13 franchises with 4 teams explicitly refusing to disclose their choices. Even if we have correctly identified the opt-in franchises, it is possible that the effects of the policy are underwhelming relative to other policies to reduce TV blackouts (i.e., more frequent extensions to the blackout deadline, greater flexibility regarding the purchase of excess tickets, etc.) adopted by the NFL in the same time period. Alleviation of this concern, as well as use of alternate policies available to franchises, would require more information than is publicly available. Following the abolition of local TV blackouts for the 2015-2016 season, it remains unclear if any additional information will become available from either the NFL or franchises regarding these past policies.
Footnotes
Appendix
Declaration of Conflicting Interests
The author(s) declared no potential conflicts of interest with respect to the research, authorship, and/or publication of this article.
Funding
The author(s) received no financial support for the research, authorship, and/or publication of this article.