
Abstract
Increasing Latinx students’ success in college-level mathematics calls for exploration on their mathematics anxiety as it relates to study habits. Using a sample of Latinx students in a Hispanic Serving Institution and their levels of mathematics anxiety, pairwise analyses revealed significant differences among subgroups. Moreover, regression analyses showed Latinx students’ study habits being predictive of mathematics anxiety. As a result, recommendations are provided that could alleviate mathematics anxiety and its effects on Latinx college students.
As society enters an era of rapid globalization, it has become clear that the nation’s prosperity will increasingly depend on mathematical and scientific advances from within its student body, particularly from Minority Serving Institutions (MSIs; National Academies of Sciences, Engineering, and Medicine [NASEM], 2018). Unfortunately, research consistently yields significant proportions of college-entering freshmen as being mathematically underprepared (Brown & Niemi, 2007; Greene & Forster, 2003), including, but not limited to, Latinx 1 students (Otero, Rivas, & Rivera, 2007). Despite significant gains in Latinx students pursuing science, technology, engineering, and mathematics (STEM) degrees (Crisp & Nora, 2012), still remaining is an overrepresentation of Latinx students in developmental mathematics’ classes (Sparks & Malkus, 2013), which, combined with significantly low passing rates (Solórzano, Acevedo-Gil, & Santos, 2013), become substantial obstacles for many Latinx students throughout their college trajectories (Crisp, Reyes, & Doran, 2017). However, even though it has been shown that Latinx students have the capability of succeeding in college-level mathematics (Cole & Espinoza, 2008; Crisp & Nora, 2010), the mathematical underpreparedness experienced by many Latinx college students has led researchers to the identification of key contributors, including fragmented mathematical backgrounds (Musoba & Krichevskiy, 2014) and a lack of “belongingness” in a postsecondary educational setting (Maestas, Vaquera, & Muñoz Zehr, 2007; Ojeda, Castillo, Meza, & Pina-Watson, 2014).
Strong evidence suggests that mathematical underpreparedness can also occur due to high levels of mathematics anxiety combined with weak study skills (e.g., Cates & Rhymer, 2003; Fannin-Carroll, 2014), factors commonly found in developmental mathematics’ classes overrepresented with Latinx and other underserved student populations (e.g., Asera, 2011; Fike & Fike, 2012). Strong study skills and positive attitudes toward mathematics, however, could have a positive impact on Latinx students’ mathematical performance (e.g., Brummer & Macceca, 2008), and, therefore, potentially reduce their overall mathematics anxiety levels. Regrettably, research on mathematics anxiety with ethnically and culturally diverse student populations is scarce (Brown & Niemi, 2007; Young & Young, 2015). Moreover, Ramirez, Shaw, and Maloney (2018) call attention to 4-year MSIs, given that underrepresented students have been shown to demonstrate higher mathematics anxiety levels when compared with White students from more traditional institutions. Hence, it is because of the lack of mathematics anxiety research done specifically on Latinx students, as well as the serious implications that this can have on Latinx students’ college trajectories, that this study attempts to understand the intersections between mathematics anxiety and the mathematics study habits of a Latinx student population in a 4-year institution. More specifically, this study addresses the following research questions (RQs):
The results of this study provide recommendations that could alleviate mathematics anxiety and its effects on Latinx college students.
Literature Review
Mathematics anxiety has been defined as a syndrome of emotional reactions, such as anxiety, dread, nervousness, tension, and fear when doing mathematics (Ashcraft, 2002; Wood, 1988). Perhaps, the most commonly used definition comes from Richardson and Suinn (1972), who describe mathematics anxiety as “feelings of tension and anxiety that interfere with the manipulation of numbers and the solving of mathematical problems” (p. 551). In addition, the Deficit Theory and the Cognitive Interference Theory have been two influential models in the research of mathematics anxiety causation (Devine, Fawcett, Szűcs, & Dowker, 2012; Ma, 1999). On one hand, the Deficit Theory postulates that low mathematical performance stems, in part, from students’ poor academic preparation, including weak study habits and test-taking skills, which, in return, contribute to higher levels of mathematics anxiety (Tobias, 1985; Wittmaier, 1972). Indeed, it has been shown that students with a richer social capital, or the relationships students have with their parents measured by the educational norms and values that are effectively communicated among them and others (Coleman, 1988), yield a stronger academic preparation, including academic preparation in mathematics (e.g., Leana & Pil, 2006; Morgan & Sørensen, 1999). This could imply an indirect, yet significant, association between students’ social capital and their development of mathematics anxiety. Such association gets clouded, however, as many Latinx students with high levels of social capital still experience academic disadvantages in mathematics when compared with other Latinx peers of similar social capital levels but from significantly higher socioeconomic statuses (Valadez, 2002).
The Cognitive Interference Theory, on the other hand, theorizes that when confronted with a mathematical task, individuals’ remembrance of negative experiences with mathematics prompts an emotional and sometimes physiological disturbance that interferes with their cognitive process and ends up increasing their mathematics anxiety regardless of their actual mathematical capabilities (Dowker, 2005). Such negative experiences with mathematics could stem, in part, from students’ interactions with previous teachers of mathematics that fostered unfavorable learning experiences due to their beliefs of how mathematics should be taught and their overall instructional practices. For instance, Beswick (2005) demonstrated that teachers adopting a more “traditionalist” perspective of mathematics, or a belief that mathematics is a finite collection of facts and procedures that must be conveyed in a decontextualized manner through a teacher-centered approach (Ernest, 1989; Hughes, 2016; Mosenthal & Ball, 1992), are less likely to provide their students with positive experiences toward mathematics required for the development of an appreciation toward such field. In contrast, Riconscente’s (2014) study demonstrated that teachers who were perceived by their Latinx high school students not only as sharing a more reform-oriented belief toward mathematics instruction that values mathematical exploration and conceptual understanding but also as being caring role models and having a genuine interest in student learning were strongly associated with their students’ increase in mathematical achievement, self-efficacy, and overall interest in the subject. Most importantly, Riconscente (2014) highlights that the fact that teacher caring and interest remained prevalent in the study’s model even after the inclusion of teacher pedagogical variables suggests the critical role that interpersonal relationships could play in mathematical classes with Latinx students), relationships that could ultimately prevent the development of mathematics anxiety in Latinx students.
More recently, studies have shown a strong inverse relationship between mathematics self-efficacy and mathematics anxiety (e.g., Goetz, Cronjaeger, Frenzel, Ludtke, & Hall, 2010; Jain & Dowson, 2009). For instance, Lee (2009) investigated three mathematical structures, namely, math self-concept, math self-efficacy, and math anxiety, across 41 countries, and found that although there existed variations across countries in the relationships between the three structures and mathematical achievement, there existed an overall strong inverse relationship between mathematics self-efficacy and mathematics anxiety. This, in return, points to the possibility of lower mathematics self-efficacy contributing to higher mathematics anxiety. Nonenvironmental factors have also been considered in the investigation of mathematics anxiety causality. For instance, Wang and colleagues (2014) considered genetics to play an influential role in causing high levels of mathematics anxiety. In their study of 514 twelve-year-old twins, mostly identifying as White, the researchers argue that aside from negative past experiences with mathematics, predisposing genetic risk factors associated with both mathematical cognition and general anxiety could cause high levels of mathematics anxiety. Nevertheless, despite disagreements still occurring among researchers as to the exact causation of mathematics anxiety (Dowker, Sarkar, & Looi, 2016), there is an overall consensus on the effects that mathematics anxiety has on highly anxious populations.
Individuals who suffer from high levels of mathematics anxiety not only demonstrate difficulties performing basic numerical operations (Maloney, Risko, Ansari, & Fugelsang, 2010) but also underperform in holistic mathematical assessments when in comparison with less anxious individuals (Ashcraft, 2002; Hembree, 1990; Ma, 1999). More recently, DeCaro, Rotar, Kendra, and Beilock (2010) investigated the interrelationships between low-pressure and high-pressure testing environments and mathematical performance on a mostly homogeneous (White) college-level student population. Their results showed that students who were asked to perform verbally based mathematics problems in a low-pressure environment, and, therefore, a less anxiety-inducing setting, outperformed those who performed under high-pressure testing environments.
Students with high levels of mathematics anxiety are also less likely to take more rigorous mathematics courses and mathematics-oriented college majors (Ashcraft, 2002; O. M. Ramirez, 1985; Torres, Arnold, & Shutt, 2016), potentially undercutting lucrative career pathways in mathematics and STEM fields in general (Brunyé et al., 2013). As a result, high levels of mathematics anxiety, in conjunction with other critical environmental and social factors such as age, gender, socioeconomic status, high school experiences, and college enrollment patterns (Bahr, 2010; Fong, Zientek, Ozel, & Phelps, 2015), could play a significant role in explicating the large discrepancies present with Latinx students and mathematics performance and their underrepresentation in the nation’s STEM pipeline at the postsecondary level. That is not to say that efforts in the diversification of STEM graduating students are not being implemented. In fact, key initiatives such as those implemented by the Office of Community College Research and Leadership (OCCRL) at the University of Illinois have begun to revamp community colleges across the state of Illinois with the intentions to enhance community college education and the transition to college for its diverse learners, including the Latinx student population (Owens, Thrill, & Rockey, 2017). This, in part, has taken the form of more robust student support frameworks and other student support services through the professional development of student services staff (Fox, Thrill, & Keist, 2018). A closer look into initiatives such as these and their effects on mathematics anxiety, however, remains unclear.
Possessing strong study skills, however, could potentially counteract the effects of mathematics anxiety on college students, including Latinx students. For instance, Hattie, Biggs, and Purdie (1996) conducted a meta-analysis about the effects of learning skills and interventions on the learning of a mostly mixed-race student population and found a strong relationship between interventions that fostered strong study skills and student academic achievement. Unfortunately, the lack of research of mathematics anxiety and Latinx college students in particular only highlights the urgency in systematically beginning to explore the implications that such anxiety could have on such student population and how this relates to their study habits.
Method
Participants
Survey data were collected early in the academic semester from a total of 405 self-identified Latinx participants from four different mathematics courses for a combined total of 20 sections. This led to an equal distribution of five sections per course that were surveyed. These included the developmental mathematics courses, Elementary Algebra (78 students, 19.16%) and Intermediate Algebra (106 students, 26.04%), and the nondevelopmental courses (college level), College Algebra (106 students, 26.04%) and Elementary Statistics (117 students, 28.75%), at a 4-year institution located in the southwest region of the United States. It is noted that since then, the 4-year institution has introduced mathematics courses into the curricula to provide various pathways to better suit student career preparation as suggested by the Dana Center Mathematics Pathways, formerly known as the New Mathways Project, from the University of Texas–Austin (Kruglaya, 2018). Along with Elementary Statistical Methods and College Algebra, courses such as Contemporary Mathematics, Introduction to Biostatistics, and Math for Business and Social Sciences have been introduced. In addition, the developmental course Intermediate Algebra and the college-level core class College Algebra are now corequisite courses, in the sense that both are taken simultaneously in the same semester for students who require developmental mathematics, hence expediting students’ time to graduate.
Instruments
All student participants were given a survey packet containing a demographic form, two survey instruments, and corresponding Institutional Review Board (IRB) documentation. The demographic form involved demographic and educational variables such as student’s gender and age; siblings, parents, and grandparents’ highest level of education; student classification; mathematics course currently enrolled in; college of major; enrollment status; and employment status.
Survey on Study Habits
The Survey on Study Habits (SSH; Fernández, 2015) is a self-reported 57-item survey instrument designed to measure students’ study habits (see Appendix A). Student participants responded to statements regarding academic-oriented behaviors, and these were evaluated on a 3-point Likert-type scale that ranged from not true (1) to always true (3). The summative score was used to measure the students’ study habits, with higher scores reflective of stronger study habits. Furthermore, exploratory factor analyses (EFAs) yielded 10 factors within SSH explaining a total of 38.87% of the total variance. This led to the creation of 10 subscales, which included Math Skills, Note-Taking, Study Pattern Habits, Reading Skills, Homework Effort, Study Environment, Goals and Attitude, Commitment, Test Preparation Skills, and Participation in Class (see Appendix A).
Survey on Mathematics Anxiety
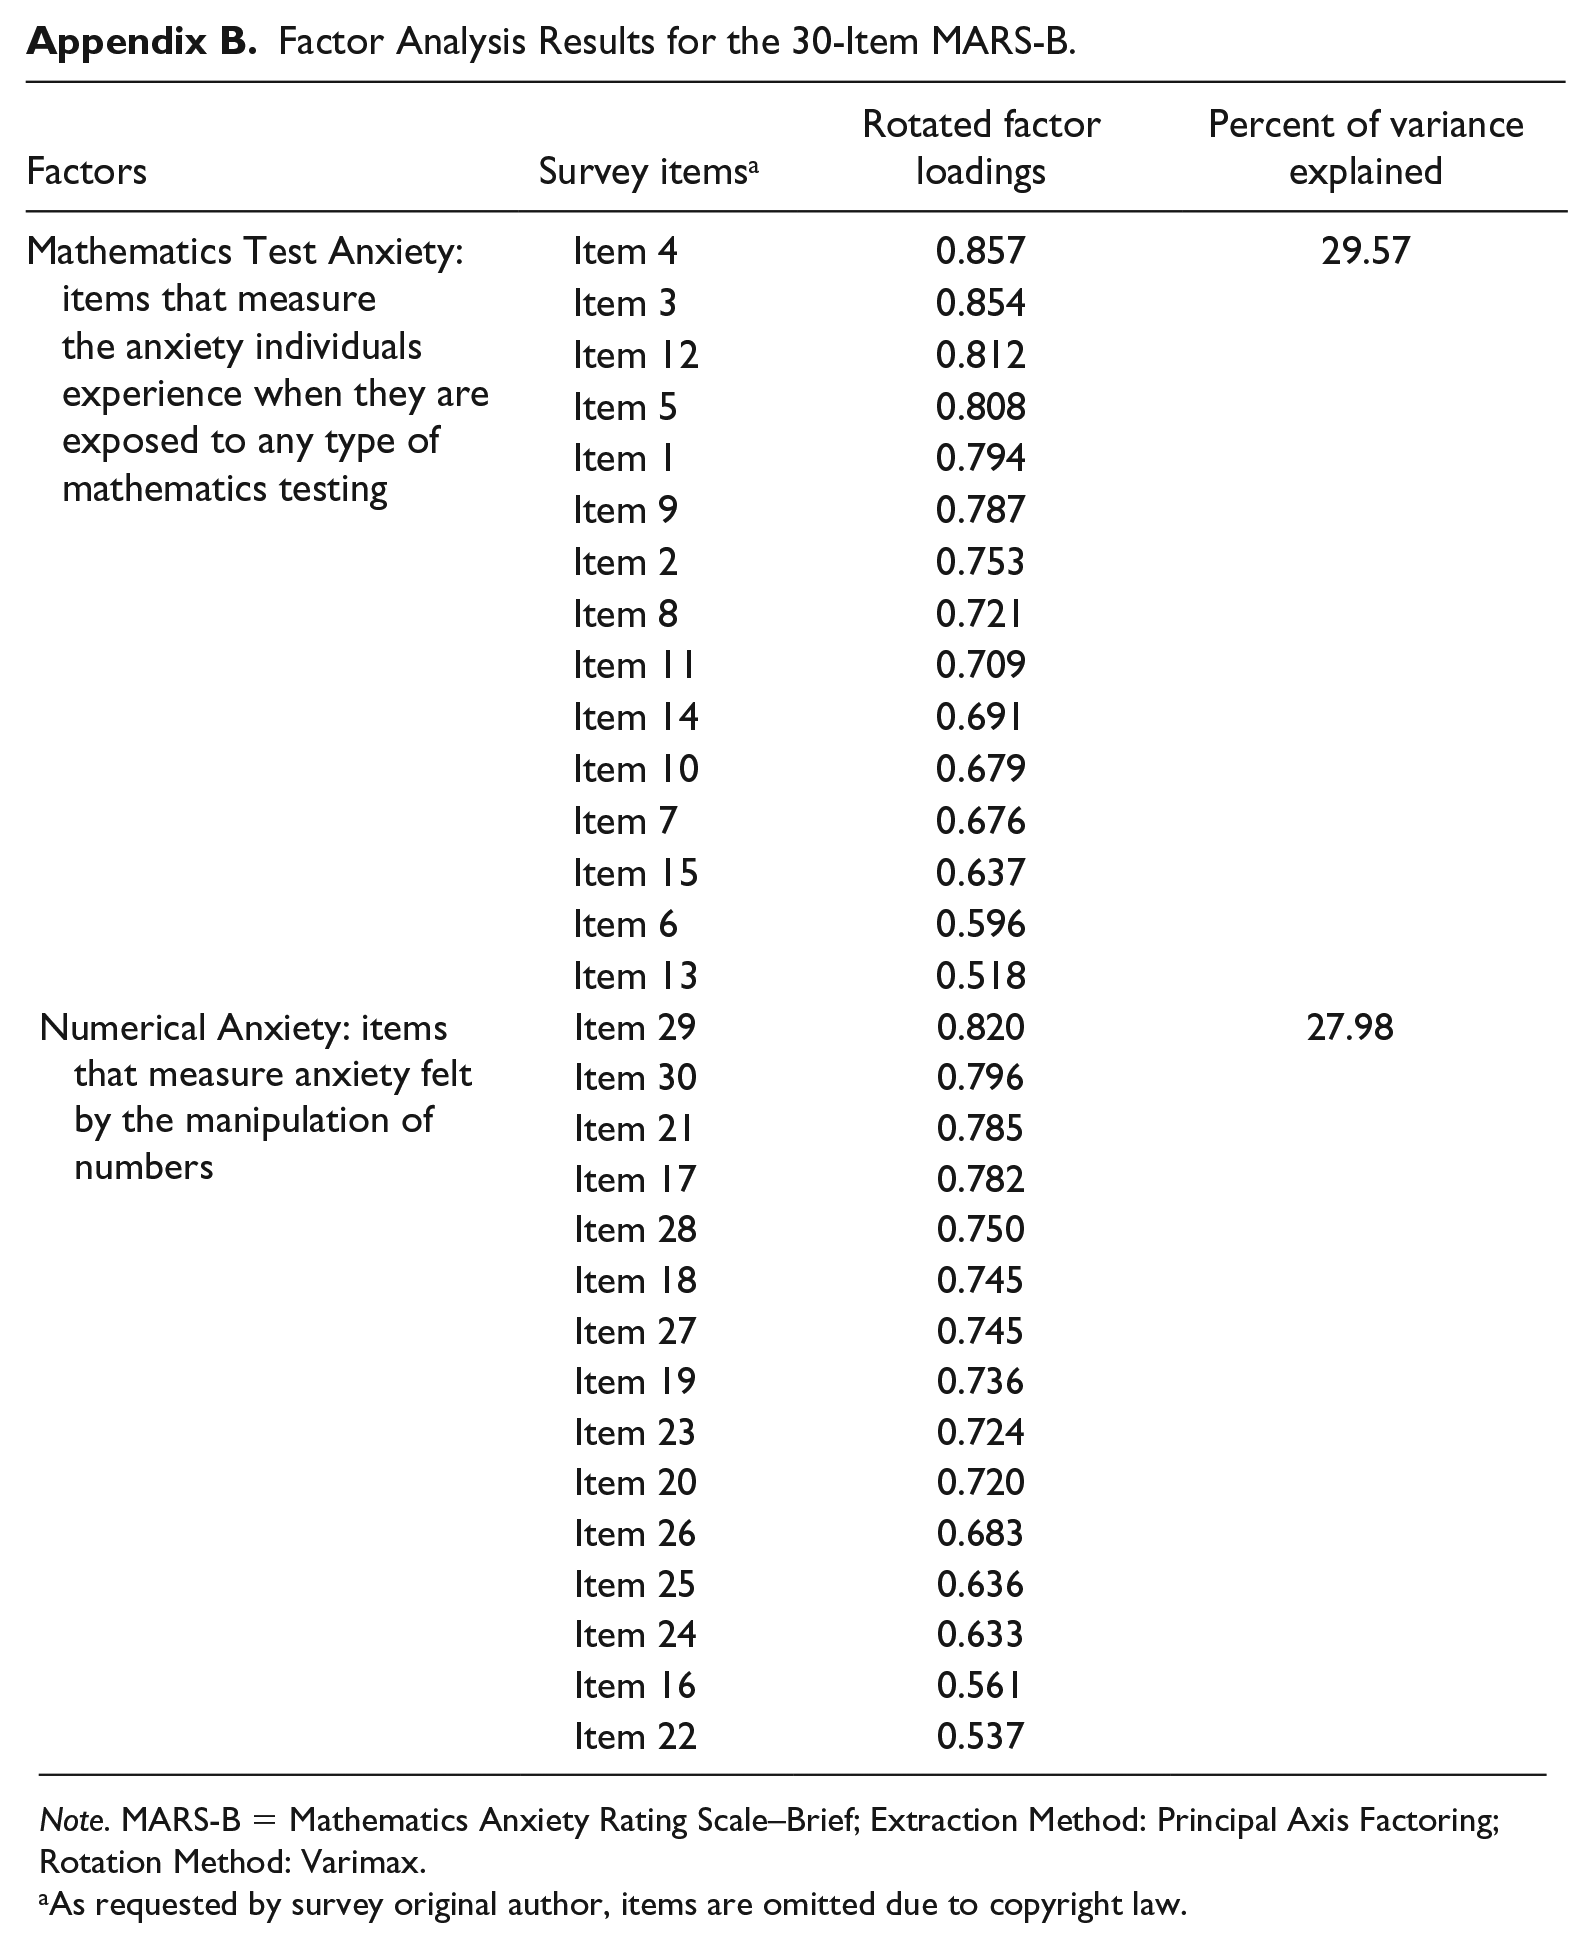
The Mathematics Anxiety Rating Scale–Brief (MARS-B; Suinn & Winston, 2003), a 30-item self-reported survey instrument, was chosen to measure students’ mathematics anxiety as it is a highly reliable and prevalent instrument used in the literature (e.g., Baloglu, 2010; Hines, Brown, & Myran, 2016; Young & Young, 2016). Student participants responded to general mathematical statements designed to invoke feelings of fear or apprehension, which were evaluated on a 5-point Likert-type scale with a range from not at all (1) to very much (5). Sample survey items include “Thinking about an upcoming math test one hour before” and “Being given a set of subtraction problems to solve.” The summative score was used as a measure of mathematics anxiety, with higher scores indicating more prevalent mathematics anxiety. In addition, EFA yielded two subscales of 15 items each, namely, Numerical Anxiety (NA), or anxiety stemming from having to do numerical computations, and Mathematics Test Anxiety (MTA), or anxiety stemming from being tested in mathematics, a common finding in similar studies (e.g., Alexander & Martray, 1989; Suinn & Winston, 2003). Combined, these two subscales explained a total variance of 57.55% (see Appendix B). Because of the explorative nature of the study, it was decided to consider the Overall Mathematics Anxiety (OMA) score with all 30 original items, as well as the two aforementioned subscales, namely, MTA score and NA score.
Procedures
To analyze the data and determine possible statistical differences in mathematics anxiety scores within subgroups of Latinx students, t tests and analyses of variance (ANOVAs) were implemented in the study. These statistical methods allowed for the consideration of possible differences in OMA, MTA, and NA scores among the demographic and educational variables of interest. In addition, multiple linear regression was used to investigate how OMA, MTA, and NA scores, respectively, were predicted from students’ study habits after controlling for the demographic and educational variables previously mentioned. Furthermore, the regression coefficients capture the impact of a unit change in predictor variables on Latinx students’ OMA, MTA, and NA scores. However, due to skewed distributions that impeded the satisfaction of the statistical assumptions for linear regression, the variables of Transformed Numerical Anxiety (T-NA) scores and Transformed Mathematics Test Anxiety (T-MTA) scores were used instead. The T-NA score is defined as the natural logarithm of the NA score, and the T-MTA score is the square root of the difference between 76 and the MTA score. Because of the aforementioned variable transformations, a positive unit change in predictor variables still indicated a one-unit increment in T-NA scores. However, a positive unit change in predictor variables indicated a one-unit decrease in T-MTA scores. This implied that an increase in T-MTA scores indicates a decrease in MTA scores for any particular student. Three significance levels were used to test satisfactory (.05), strong (.01), and very strong (.001) significances, respectively.
Limitations
There are several limitations that must be taken into consideration when interpreting the results. First, this study relied on participants’ self-reported data pertaining to habits and behaviors. In this regard, studies have shown survey participants’ tendency, including college students, to report on a socially desirable manner or an overall lack of insightfulness in regard to understanding their own inner behaviors (Tourangeau & Yan, 2007; Zalaquett, 2006). Second, random sampling was not implemented in the current study. Because of this, there existed various degrees of disproportionality of sample in several variables, including college majors and student classification. Furthermore, this limited our ability to further explore pairwise differences in all three anxiety scores on multileveled variables such as classification and math courses.
Third, multiple linear regression analysis did not address cause and effect or assess the nature of the relationships that were found. In other words, although our results allow us to conjecture on possible cause and effect relationships between our variables of interest, including study habits, and the causation of mathematics anxiety, our methods do not verify the validity of such conjectures. Finally, although all student participants self-declared as Latinx, their generational status (e.g., first, second, or third plus generation) or linguistic practices were unclear. Besides addressing the aforementioned limitations, future studies should incorporate qualitative research methods to assess levels of mathematics anxiety through a more robust theoretical lens.
Results
Of 405 student participants, the average age was 21 years, 62.7% were female, 58.2% were freshmen, 77.3% had non-STEM majors, 82.7% were full-time students, and 48.9% had no job obligations (see Table 1).
Means and Differences of OMA Scores, T-NA Scores Across All Variables of Interest.
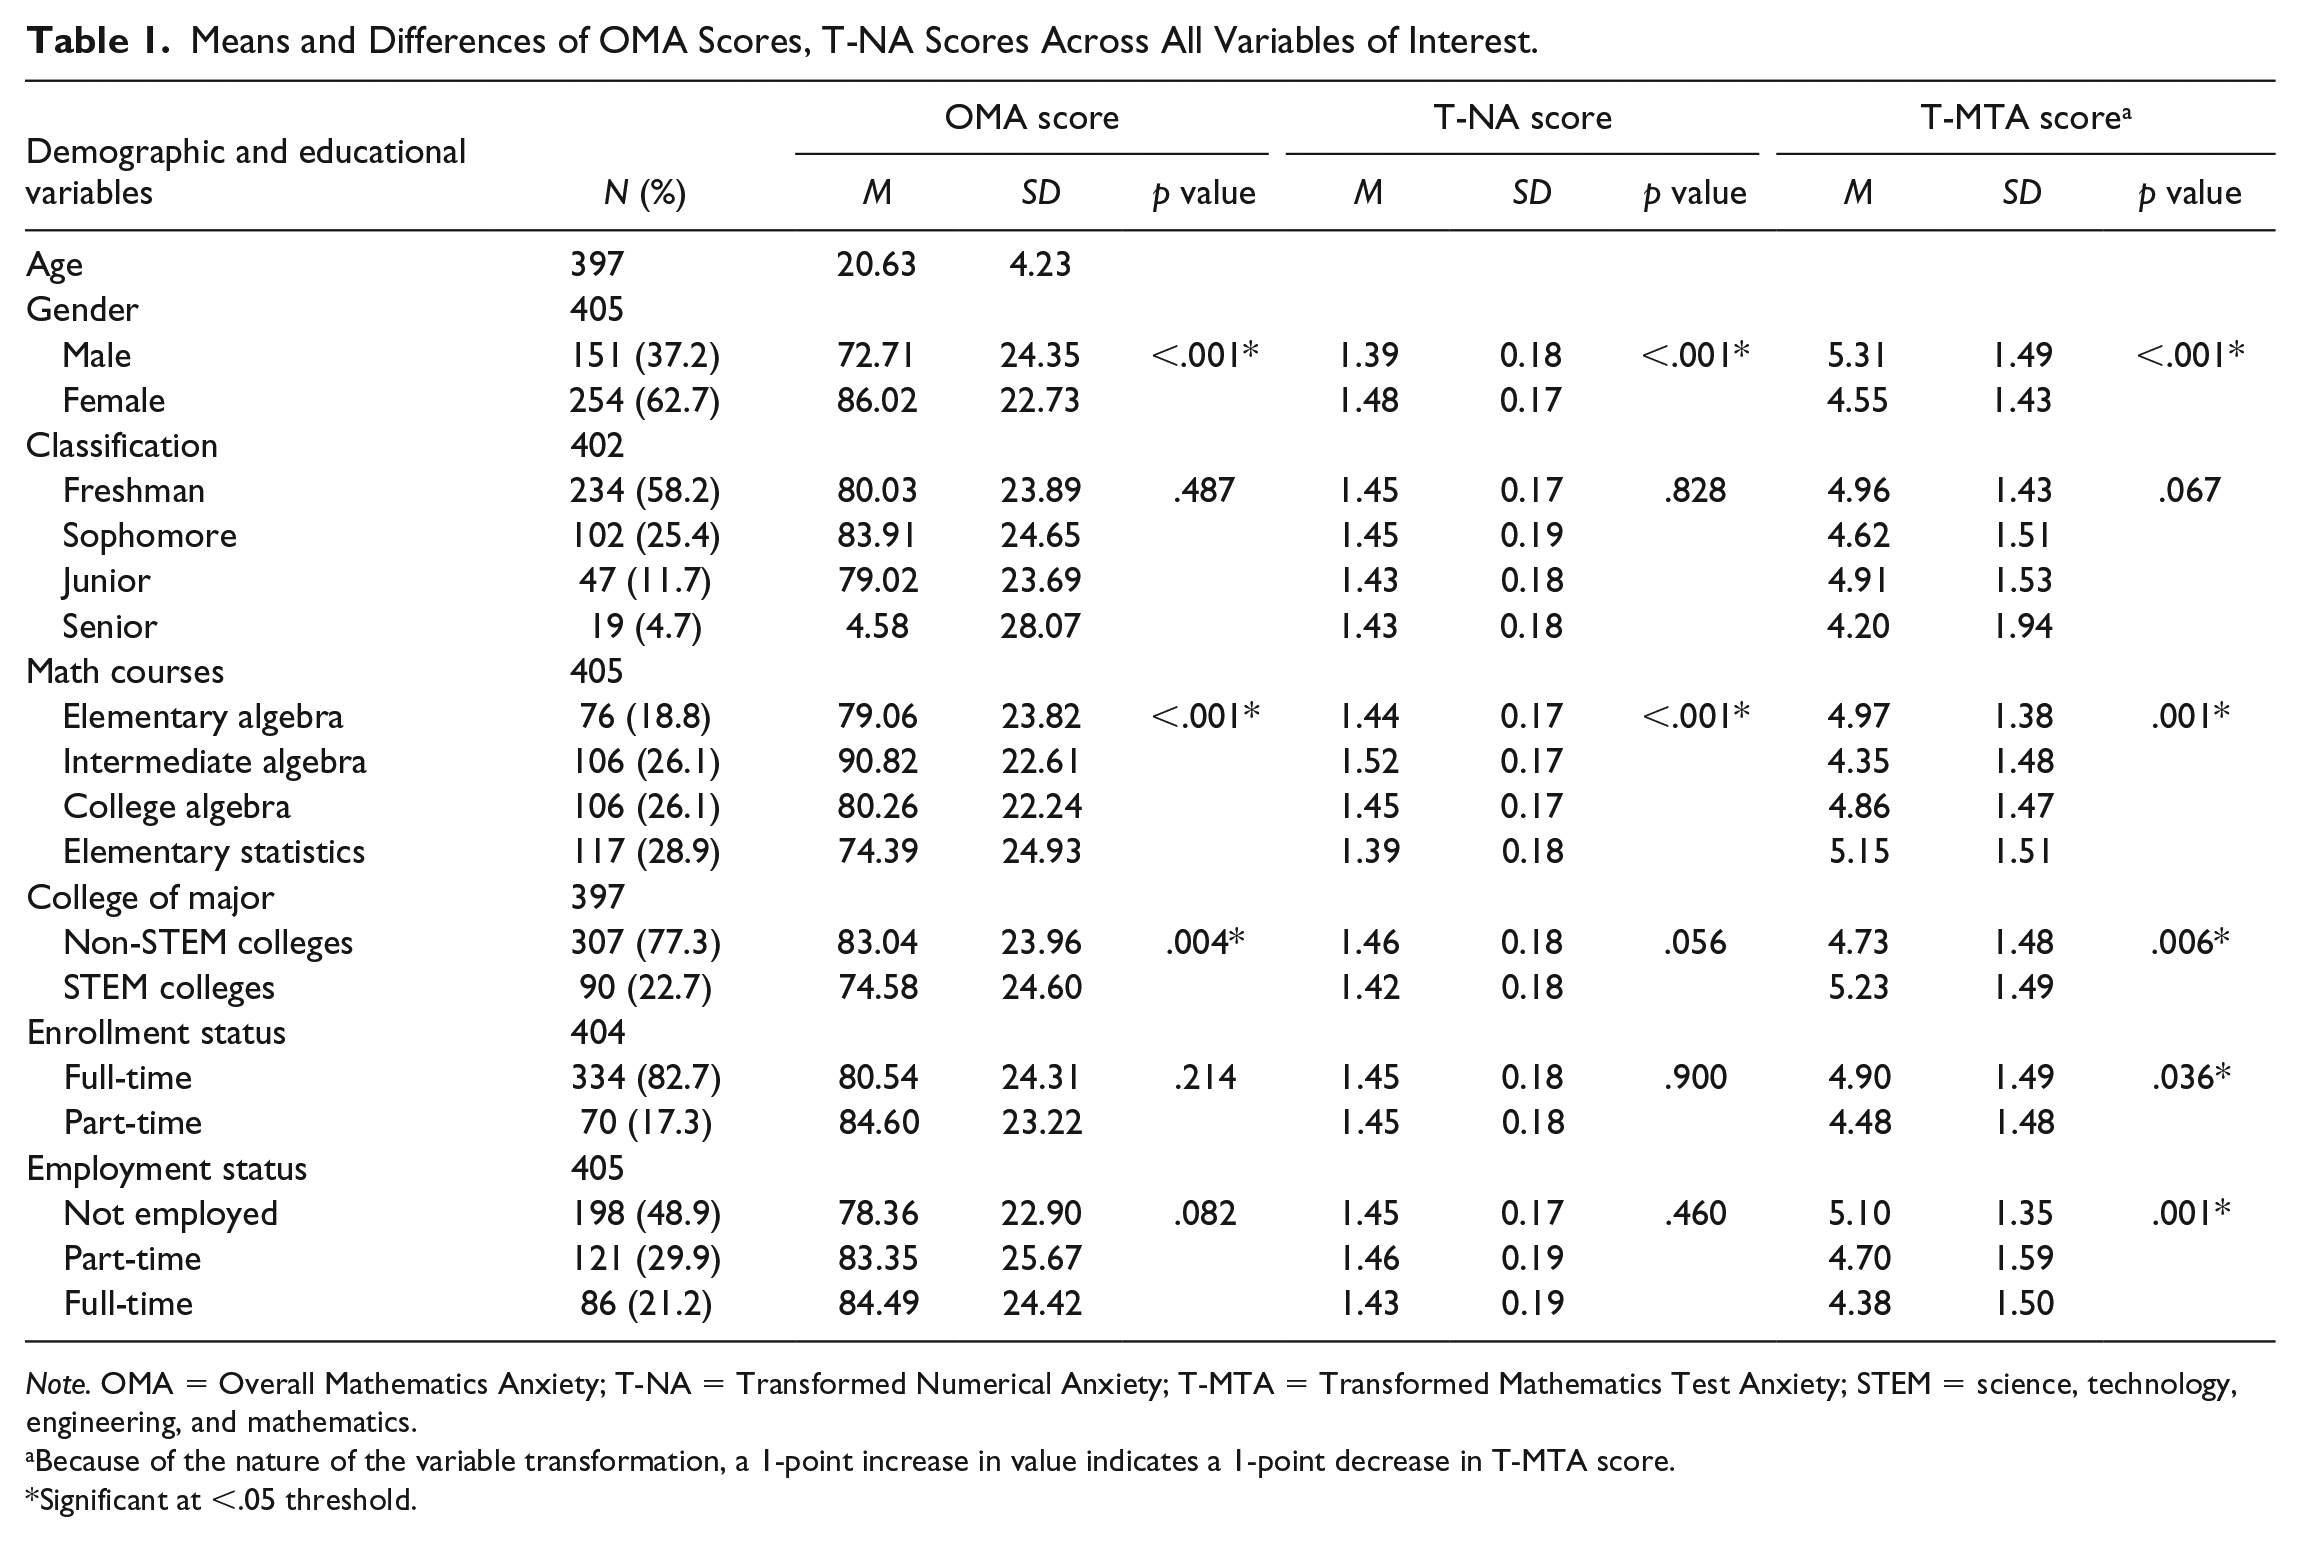
Note. OMA = Overall Mathematics Anxiety; T-NA = Transformed Numerical Anxiety; T-MTA = Transformed Mathematics Test Anxiety; STEM = science, technology, engineering, and mathematics.
Because of the nature of the variable transformation, a 1-point increase in value indicates a 1-point decrease in T-MTA score.
Significant at <.05 threshold.
In response to RQ1, Table 1 reports results from the pairwise analyses between OMA scores, T-NA scores, T-MTA scores, and the demographic and educational variables. These findings indicate that female students suffered significantly higher in all three mathematics anxiety scores compared with male students. Similarly, students with STEM majors had significant lower OMA and T-MTA scores than those with non-STEM majors. Full-time students also had significant lower MTA than part-time students. Finally, analysis of variance showed an effect of mathematics courses and employment status on the three anxiety scores.
When controlling for demographic and educational variables (see Table 2), results from the multiple linear regression analyses implemented for RQ2 reported a significant effect between all three types of anxieties. More specifically, stronger mathematics skills were shown to be predictive of lower OMA scores
Regression Results for OMA Scores, T-NA Scores, and T-MTA Scores When Controlling for Demographic and Educational Variables.
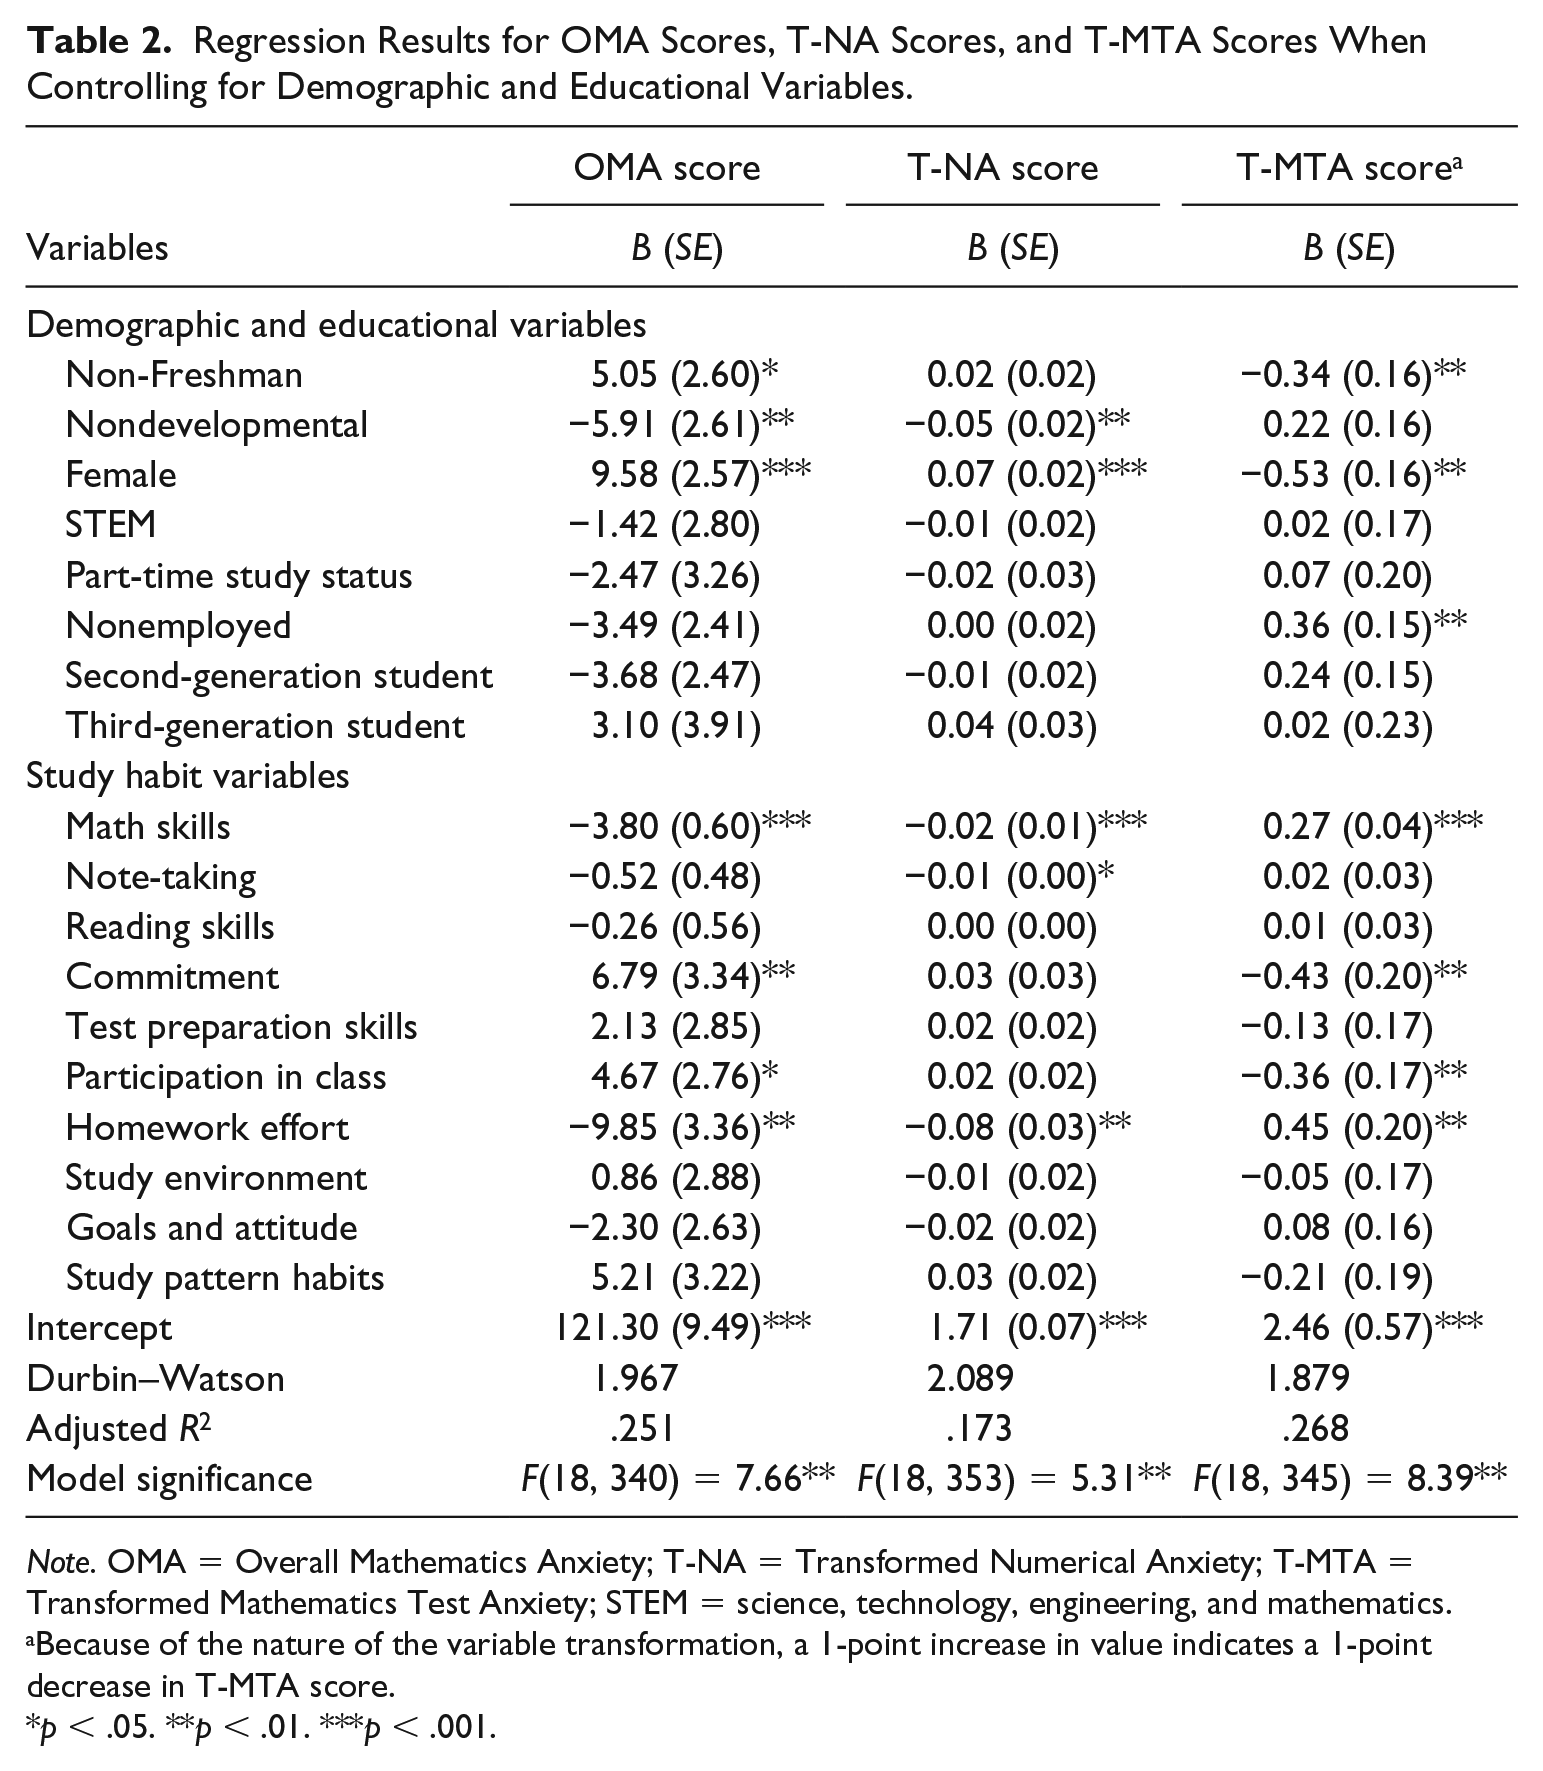
Note. OMA = Overall Mathematics Anxiety; T-NA = Transformed Numerical Anxiety; T-MTA = Transformed Mathematics Test Anxiety; STEM = science, technology, engineering, and mathematics.
Because of the nature of the variable transformation, a 1-point increase in value indicates a 1-point decrease in T-MTA score.
p < .05. **p < .01. ***p < .001.
Discussion
Results demonstrated significant differences in mathematics anxiety scores among different subpopulation groups of Latinx students, many of which can be corroborated with current literature on mathematics anxiety. For example, female Latinx students experienced higher mathematics anxiety when compared with their male Latinx peers, a finding which commonly gets attributed in the literature, in part, to societal norms and other media portraying women as incapable of doing mathematics (Ashcraft, 2002). Similar to Bonham and Boylan (2011) and Woodard (2004), differences in mathematics anxiety levels among mathematics courses were also prevalent, with Latinx students enrolled in developmental mathematics courses reporting higher levels of mathematics anxiety compared with their peers enrolled in nondevelopmental courses. This difference in mathematics anxiety between students in developmental and nondevelopmental mathematics courses suggests that as students take higher level mathematics courses, their mathematics anxiety levels decrease. It was unclear, however, which math course sequence the students had gone through, and, therefore, further exploration on this matter should be considered.
Latinx students pursuing a non-STEM degree were shown to experience higher mathematics anxiety than STEM degree–pursuing students. This could be attributed to findings that suggest that students experiencing high levels of mathematics anxiety tend to avoid mathematically oriented majors and, therefore, careers (Brunyé et al., 2013). Finally, Latinx college part-time students and Latinx students with full-time jobs were shown to experience higher MTA, a subcategory of mathematics anxiety. Parallel to this, research has shown that Latinx students’ academic success is negatively affected, in part, by “environmental pull factors,” including working off campus, financial concerns, attending college part-time, or having to commute to campus (Crisp & Nora, 2010). Therefore, it might be plausible that these factors also attribute to a higher MTA on Latinx students.
Linear regression analyses revealed that Latinx students’ appraisal about their study habits was significantly predictive of mathematics anxiety after taking into account important demographic and educational variables. For instance, possessing strong mathematical skills was shown to be strongly predictive of lower mathematics anxiety. Such an inverse relationship is the theoretical framework of the Deficit Theory, in that weak mathematics skills lead to higher mathematics anxiety and vice versa (Devine et al., 2012; Ma, 1999). Proper note-taking and higher homework effort were also predictive of low mathematics anxiety, particularly with NA. This could infer that Latinx students who spend more time understanding the mathematical numerical concepts through stronger note-taking skills and higher homework efforts might experience an increase in their mathematics self-efficacy, which, simultaneously, has been shown to lower mathematics anxiety (Hughes, 2016). However, Latinx students who expressed a high degree of commitment and class participation in their mathematics classroom yielded higher levels of mathematics anxiety, including MTA. However, a more careful examination of the wording used in items pertaining to both categories—high degree of commitment and class participation (see Appendix A)—could be implicative of underlying feelings of frustration, fear, self-doubt, or anger, all factors associated with high levels of general anxiety and lower academic performance (O’Connor & Paunonen, 2007).
Implications for Practice
As a result of this study, the coauthors recommend collaborating with staff in units such as tutoring centers and student accessibility services, and with faculty responsible for teaching entry-level mathematics courses to help Latinx students improve their study habits that can, in turn, help reduce their levels of mathematics anxiety. This includes efficient systems of taking notes during and after mathematics classes, from course-related texts, and from other types of educational materials. Students should also be able to utilize notes effectively as studying aids for homework assignments and exams. Similarly, a higher effort given to the completion of homework assignments, asking questions, and participating in classroom discussions, and an overall stronger commitment to learning can also decrease Latinx students’ OMA, which could possibly increase their mathematics achievement.
Ultimately, the shared goal would be to offer students diagnostic, testing, advisement, and counseling services that can assist students with their anxiety (e.g., mathematics anxiety, NA, MTA). Although not focusing on students’ mathematics anxiety specifically, efforts such as those implemented by the OCCRL, as previously highlighted, provide us with a robust blueprint that delineates the structure of similar initiatives wanting to close the “gap” between Latinx college students and STEM achievement through the implementation of continuous student support–oriented measures across different units. Therefore, a similar attempt to forge needed partnerships between aforementioned academic units, faculty, and staff could also continue with follow-up meetings on mathematics anxiety that can help these units better serve students by addressing mathematics anxiety through the improvement of their study habits.
Footnotes
Appendix
Factor Analysis Results for the 30-Item MARS-B.
| Factors | Survey items a | Rotated factor loadings | Percent of variance explained |
|---|---|---|---|
| Mathematics Test Anxiety: items that measure the anxiety individuals experience when they are exposed to any type of mathematics testing | Item 4 | 0.857 | 29.57 |
| Item 3 | 0.854 | ||
| Item 12 | 0.812 | ||
| Item 5 | 0.808 | ||
| Item 1 | 0.794 | ||
| Item 9 | 0.787 | ||
| Item 2 | 0.753 | ||
| Item 8 | 0.721 | ||
| Item 11 | 0.709 | ||
| Item 14 | 0.691 | ||
| Item 10 | 0.679 | ||
| Item 7 | 0.676 | ||
| Item 15 | 0.637 | ||
| Item 6 | 0.596 | ||
| Item 13 | 0.518 | ||
| Numerical Anxiety: items that measure anxiety felt by the manipulation of numbers | Item 29 | 0.820 | 27.98 |
| Item 30 | 0.796 | ||
| Item 21 | 0.785 | ||
| Item 17 | 0.782 | ||
| Item 28 | 0.750 | ||
| Item 18 | 0.745 | ||
| Item 27 | 0.745 | ||
| Item 19 | 0.736 | ||
| Item 23 | 0.724 | ||
| Item 20 | 0.720 | ||
| Item 26 | 0.683 | ||
| Item 25 | 0.636 | ||
| Item 24 | 0.633 | ||
| Item 16 | 0.561 | ||
| Item 22 | 0.537 |
Note. MARS-B = Mathematics Anxiety Rating Scale–Brief; Extraction Method: Principal Axis Factoring; Rotation Method: Varimax.
As requested by survey original author, items are omitted due to copyright law.
Declaration of Conflicting Interests
The author(s) declared no potential conflicts of interest with respect to the research, authorship, and/or publication of this article.
Funding
The author(s) disclosed receipt of the following financial support for the research, authorship, and/or publication of this article: U.S. Department of Education, Graduate Assistance in Areas of National Need (GAANN) Grant #P200A120256.