
Abstract

Introduction
Hypertension is the most common symptom leading to physician examinations in the United States and can be a devastating disease for millions of people. If left untreated, hypertension can lead to stroke, kidney failure, aortic dissection, and/or heart attack.
The underlying causes of hypertension are not well understood for most patients; however, for a small percentage of the population there is an identifiable, and potentially curable, cause for elevated blood pressure. Clinical investigations have shown that approximately 6% of hypertensive patients in the United States 1 have elevated blood pressure as a result of renal artery stenosis. Although the prevalence of renal artery stenosis in the general population is small, it represents thousands of potentially curable patients.
Most often, stenosis is caused by atherosclerotic disease involving the orifice or proximal segment of the renal artery. Fibromuscular dysplasia is the second most common cause of renal artery narrowing. This nonatherosclerotic disease entity affects the mid-to-distal segments of the renal artery, predominantly in young, hypertensive women.
The challenge lies in making an accurate diagnosis of the cause of hypertension. Historically, physicians have used magnetic resonance angiography 2 and captopril-stimulated nuclear renal flow scans 3 to confirm renal artery stenosis or occlusion. These modalities, however, have unacceptably low sensitivity and specificity. In recent years, considerable attention has been given to use of duplex ultrasonography as a tool for identification of renal artery stenosis and/or occlusion, follow-up evaluations, and natural history studies.4–6 What began as tentative investigation in a few laboratories has developed into highly sophisticated ultrasound procedures that yield accurate information about the presence of renal artery stenosis and parenchymal dysfunction. Although renal artery duplex scanning was validated in several laboratories in the mid-1980s,7–11 it is only within recent years that this diagnostic tool has gained increasing popularity. This is in large part due to the technical demands of the study, the extended time that may be required to complete an examination, and the lack of experience of technologists and physician interpreters in assessing visceral blood flow patterns and pathology. Many physicians now rely on renal duplex scanning as the initial diagnostic modality for identification of renal artery stenosis, for detection of disease progression, and for post-revascularization evaluation of renal blood flow patterns.
Generally three treatment options are considered for patients with hypertension caused by renal artery stenosis. For many patients, hypertension can be controlled with medication and modification of atherosclerotic risk factors. A surveillance program that uses duplex ultrasonography can be used to monitor renal artery flow patterns and kidney sizes for evidence of progression of stenotic disease and for timing of intervention. In a prospective natural history study of renal artery stenosis, Zierler et al. 5 used renal duplex ultrasonography to follow 84 patients with known renal artery stenosis on at least one side. Mean follow-up approached 13 months for 139 renal arteries. During this period, the cumulative incidence of disease progression was 42% ± 14%, with an occlusion rate of 11% ± 6% at 2 years. The overall progression rate was 20%.
If disease progresses, patients may require renal artery bypass surgery or percutaneous transluminal angioplasty of the renal artery, with or without stenting of the artery, for blood pressure control and to preserve renal function.
In recent years, surgical revascularization techniques have improved significantly. 12 The clinical impact of surgical revascularization has also received attention. Hansen and his associates 13 reported a series of 291 renal artery bypass procedures. Hypertension was cured in 21%, and 70% of patients had improved blood pressure control. Improved renal function was realized in 49% of survivors, whereas 36% of the study patients had no change in blood pressure after surgical revascularization. Deterioration in renal function was reported in 15% of the patients postoperatively. This beneficial impact on blood pressure control has also been reported by others. 14
The clinical interest in renal artery angioplasty, with or without stenting, has increased in parallel with the ability to use duplex ultrasonography for renal artery evaluation. In 1983, Sos et al. 15 published their initial series of 89 patients with renal artery stenosis who underwent renal artery angioplasty without stenting. Eighty-four percent of their patients with atherosclerotic renal artery stenosis demonstrated cure or improvement in hypertension. Other investigators have reported similar results. 16 These interventionalists and others have noted the lack of benefit of percutaneous transluminal angioplasty alone on ostial atherosclerotic lesions. As a result of these findings, endovascular renal artery stent placement has gained increasing importance as a procedure that may offer a longer term patency than angioplasty alone. Several series have reported 100% technical success.17, 18 One study reported a 6-month restenosis rate of 1.6% and a primary stent 1-year patency rate of 92%. 18 Hypertension was cured or improved in 76% of patients.
Before considering the scanning protocols used for evaluating stented renal arteries and the interpretive criteria currently in use, we must first understand the ultrasound techniques that have proven successful for examination of normal and diseased renal arteries.
Techniques for Duplex Assessment of Renal Artery Flow 19
Choice of Equipment
It is important to approach the examination with the right tools. Renal artery duplex scanning requires a high-resolution ultrasound system with a range of low-frequency pulsed Doppler transducers (2.25 MHz–4 MHz). Color flow imaging may facilitate the examination because it provides a global view of vascular anatomy and visualization of vessel segments with disordered flow patterns.
Patient Preparation and Position
Because abdominal gas will preclude satisfactory imaging of the abdominal aorta and renal arteries, it is important to have the patient fast for 6–8 hours before the ultrasound examination. Patients are asked to refrain from smoking and chewing gum to reduce the amount of swallowed air. In my experience, no great benefit is gained from performing a bowel preparation or having the patient use cathartics the evening before the study. You may, with permission of the referring physician, ask the very “gassy” patient to take one to two simethicone tablets about 20 min before the ultrasound examination.
The patient is initially positioned supine on the examination table for evaluation of the abdominal aorta, renal artery orifice, and the proximal-to-mid segments of the renal artery. For interrogation of the kidney and the distal renal artery, the patient may be moved to the lateral decubitus position with the arm extended over the head.
Technique
The examination is initiated at the level of the xiphoid process, with the transducer positioned in the left paramedian scan plane to create a longitudinal image of the aorta at the level of the celiac and superior mesenteric arteries. Because the ratio of the peak systolic velocities from the aorta and renal arteries may have diagnostic importance, the entire length of the aorta is evaluated with high-resolution B-mode imaging and Doppler velocity spectral analysis. Careful attention is given to regions of atherosclerotic disease, aneurysms, or dissection. By use of appropriate angle correction, Doppler spectral waveforms are recorded from the aorta at the level of the mesenteric arteries, and peak systolic velocity is documented. Color flow imaging may enhance this portion of the study.
The aorta is then imaged in the cross-sectional plane at the level of the left renal vein. It is important to remember that the left renal vein normally lies anterior to the aorta, but in a small, but significant, number of patients, this vein may be found in the retroaortic position or may be bifid. The renal arteries will arise from the lateral or posterolateral wall of the aorta at the level of the renal veins. If ultrasound system settings are optimized, color flow imaging will facilitate identification of the renal vessels.
The left renal artery will be noted to move gradually away from the aortic wall as it courses laterally through the abdomen, inferior to the left renal vein, to enter the kidney. In contrast, the right renal artery arcs anteriorly away from the aortic wall to initially move under, or above, the left renal vein as it crosses over the aorta. You should recall that the right renal artery courses posterior to the inferior vena cava to enter the hilum of the right kidney. It will be important to remember these anatomic arrangements as we consider the pitfalls associated with renal artery imaging after the placement of a Palmaz or wall stent.
The Doppler sample volume is initially placed in the lumen of the aorta and, with continuous Doppler display, moved slowly through the orifice of the renal artery. This is a very important step in the procedure, which will ensure detection of flow-limiting, orificial renal artery stenosis or inappropriate flow patterns associated with projection of a renal stent into the aortic lumen. The sample volume is then slowly and carefully moved throughout the proximal, mid, and distal renal artery to identify focal flow disturbances and to document peak systolic velocities in all segments of the vessel. It must be noted that with accurate angle correction, the peak systolic velocities will be quite similar throughout the proximal, mid, and distal renal artery in the absence of significant disease.
The patient may then be moved to the lateral decubitus position for interrogation of the intersegmental and arcuate branches of the renal artery within the medulla and cortex of the kidney. From this position, the renal artery can be re-evaluated with Doppler ultrasonography by sweeping the sample volume throughout the artery from the renal hilum to its origin from the aorta.
Calculations and Interpretation of Data
If the aorta is not diseased, a renal-aortic peak systolic velocity ratio >3.5 may be used to identify flow-reducing (>60%) renal artery stenosis (Table 1). In addition, a renal artery peak systolic velocity > 180 cm/ sec and presence of a characteristic poststenotic Doppler signal provide evidence of a pressure-flow gradient associated with significant stenosis. We can take these diagnostic criteria a step further. If a renal-aortic velocity ratio can be used, a ratio <3.5 associated with a peak systolic renal artery velocity >180 cm/sec and absence of a poststenotic signal identifies renal artery stenosis that is not yet hemodynamically significant (<60% diameter reducing).
PSV, Peak systolic velocity; RAR, renal aortic peak systolic velocity ratio.
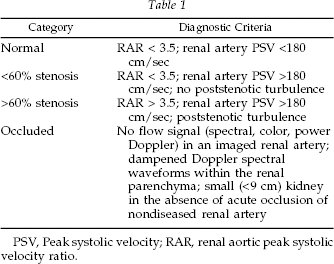
Normally, the Doppler spectral waveforms from the arterial branches within the kidney demonstrate constant forward diastolic flow. Such waveforms are evidence of the low resistance vascular bed expected in the nondiseased kidney (Figure 1). However, if the patient has clinical evidence of medical renal disease, vascular resistance may increase within the organ, and the Doppler spectral patterns will be characterized by low-diastolic, pulsatile flow. Low-amplitude, low-velocity Doppler spectral waveforms with delayed systolic acceleration may be recorded in the parenchymal branches of the renal artery if the main renal artery is critically stenosed or occluded. Although the kidney is a poorly collateralized organ, the adrenal and ureteral arteries may serve as alternative sources for blood flow to an ischemic kidney.
These ultrasound scanning techniques and interpretive criteria are important to remember as we consider evaluation of the renal artery that has been revascularized by angioplasty and stenting.
Renal Artery Stents
The image characteristics of a stented renal artery may differ depending on the type of stent used. The most popular renal stents are the Palmaz-Schatz and wall stent.
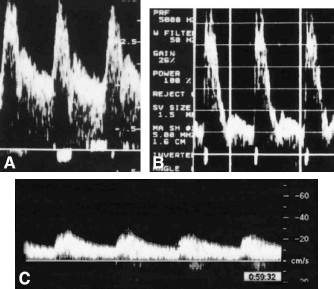
Although the Palmaz and wall stent are constructed of pure metal or alloys, other stents may be made of elastic, plastic, or thermoelastic-nitinol. Most stents are quite flexible because of the latticelike arrangement of their interstices (Figure 2). Even though the stent itself is flexible, when placed within the renal artery, the stented segment of the vessel becomes relatively noncompliant.
(A) Doppler spectral waveform from a normal renal artery. Note the high diastolic forward flow that characterizes blood flow to a low-resistance vascular bed. (B) Decreased diastolic flow is evidence of elevated renal vascular resistance and intrinsic medical renal disease. (C) Dampening of the Doppler spectral waveform characterized by delayed systolic upstroke is suggestive of critical proximal renal artery stenosis or occlusion.
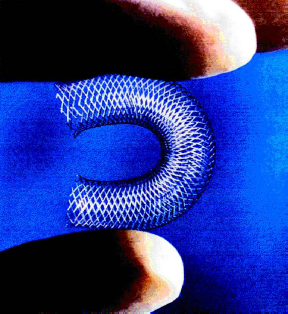
The stent is introduced into the renal artery on a balloon catheter (Figure 3). The balloon is inflated within the diseased segment of the artery, causing the stent to expand and press against the arterial wall. The interventionalist may choose to further expand the stent with a balloon catheter to ensure that the stent is in full contact with the vessel wall. When the balloon is deflated and withdrawn, the stent remains permanently in place, holding the artery open (Figure 4). New cell growth will eventually cover the stent, providing a smooth-surfaced arterial wall.
An arterial stent demonstrating the metallic latticed scaffold and flexibility that is characteristic of these structures.
An angioplasty balloon catheter inflated within an arterial stent. Note the metallic interstices of the stent.
Ultrasound Image Characteristics of the Stented Renal Artery
In most patients the stents are well visualized, and their location within the renal artery is easily determined, because the materials of the Palmaz and wall stent are brightly echogenic (Figure 5). Remember, the best image resolution occurs when the ultrasound beam strikes the vessel perpendicular to its anterior wall. Given the angle of the renal arteries with respect to the body surface, and therefore the sound beam, a 90° image angle is difficult to attain with the exception of the proximal right renal artery (Figure 6). However, longitudinal scanning of the renal arteries from a cross-sectional view of the aorta more often than not will produce satisfactory images of the stented renal artery segments. Alternately, the patient may be placed in a lateral decubitus position for evaluation of distal to proximal segments of the renal artery. In this position, the ultrasound beam will intersect the proximal segment of the artery at an acute angle, and the echogenic walls of the renal stent will be readily recognized (Figure 7). The wall of the aorta adjacent to the renal artery orifice should be carefully evaluated with high-resolution B-mode imaging to determine whether the stent is protruding into the aortic lumen.
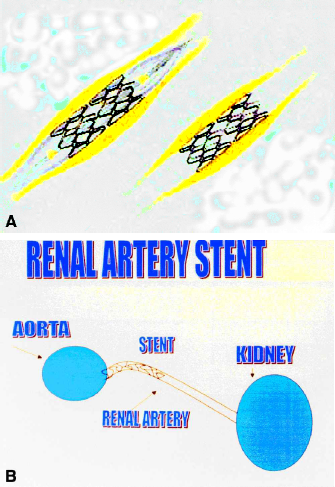
(A) After the angioplasty balloon is positioned within the renal artery, the balloon is inflated to expand the stent and then withdrawn from the artery, leaving the stent permanently in place within the vessel. (B) Diagram demonstrating the stent within the proximal renal artery.
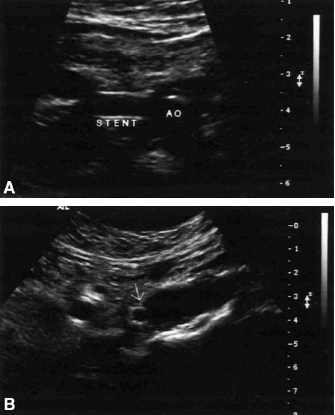
(A) B-mode image of a wall stent within a proximal right renal artery. Note the echogenicity of the stent walls. (B) Cross-sectional B-mode image of a Palmaz stent within a proximal right renal artery (arrow).
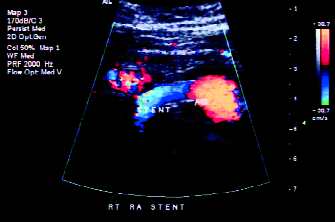
Color flow image of a proximal right renal artery demonstrating the echogenic stent walls and absence of disturbed flow within the stent.
Doppler Evaluation
The Doppler interrogation of the stented vessel is identical to that used for the preprocedure study. The sample volume is swept from within the lumen of the aorta into the proximal renal artery, paying careful attention to the flow patterns in the region of the renal artery orifice. Marked flow disturbance within the aorta at the renal orifice may indicate that the stent is protruding into the aortic lumen too far and that aortic blood flow patterns are disrupted to the point where pressure and flow gradients may ultimately develop (Figure 8). Minimal flow disturbance and a slight velocity increase may be documented throughout the stented segment of the renal artery, because the rigidity of the stent interstices causes reduction in compliance of the stented vessel wall compared with the native vessel. In the absence of luminal narrowing within the stented segment, peak systolic velocities should be only slightly higher than those seen in the normal renal artery.
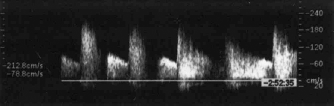
When renal artery stents are placed, the diameter of the stented segment of the vessel may be slightly increased compared with the diameter of the native artery distal to the stent (Figure 9). Under these circumstances, a flow gradient will be present at the distal end of the stent because of the diameter mismatch between the stented segment and the native renal artery (Figure 10). Peak systolic velocity may increase slightly, and disordered flow will be apparent as blood moves from the slightly larger diameter stented segment to the smaller diameter native arterial segment. These findings are analogous to those associated with blood flow through femorotibial arterial in situ saphenous vein bypass grafts. As expected, high-velocity Doppler signals may be encountered at the distal anastomosis of the graft as flow moves from the wider diameter saphenous vein to the small-diameter tibial artery. In the stented renal artery, if the diameter of the stented segment is larger than the artery beyond the stent, the peak systolic velocity will increase at the distal end of the stent (Figure 11). Marked flow disturbance will be present in the Doppler spectral waveform and reflected also in the color flow image. Careful attention must be given to these flow patterns to ensure that they are caused by a vessel diameter-to-stent diameter mismatch and not to flow-reducing stenosis distal to or within the stent. Remember, poststenotic turbulence and increased peak and end-diastolic velocities characterize stenotic disease.
The absence of flow-reducing stenosis of a stented renal artery can be identified by use of the validated renal-aortic peak systolic velocity ratio (<3.5). If high-velocity, turbulent signals are encountered within or distal to the stent, the examiner should document a peak systolic velocity >180 cm/sec and confirm a poststenotic signal. Peak systolic velocities in the distal renal and intersegmental arteries of the kidney may be reduced compared with the contralateral side. Similarly, the parenchymal Doppler spectral waveforms may demonstrate reduced amplitude and delayed systolic upstroke on the stented side compared with the previous examinations.
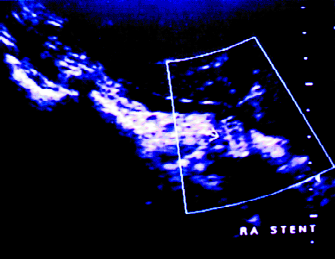
Long-axis B-mode image of a wall stent (arrow) within a proximal right renal artery. Note that the image was created by use of an intercostal scan plane along the distal-to-proximal course of the renal artery.
Doppler spectral waveform from the orifice of a renal artery stent. Note the disturbed flow pattern created by the protrusion of the stent into the aortic lumen.
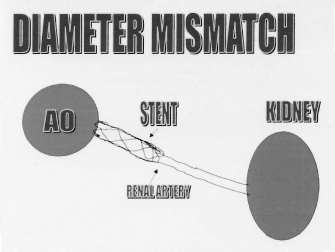
Diagram of a renal artery stent within the proximal segment of the vessel. Note the slight increase in the diameter of the stented segment of the artery compared with the diameter of the native renal artery.
Summary
Renal artery duplex ultrasonography is playing an increasingly important role in the diagnostic workup of patients with renal artery stenosis. Although extremely operator-dependent and volume-dependent, this technology has been applauded as an accurate, cost-effective method for identifying the presence of disease and for helping to define the therapeutic options. For those patients with flow-limiting renal artery stenosis who are revascularized using percutaneous transluminal angioplasty and stenting of the renal artery, duplex ultrasonography offers a means of ensuring correct placement of the stent, ongoing patency of the renal artery, and appropriate blood flow patterns.
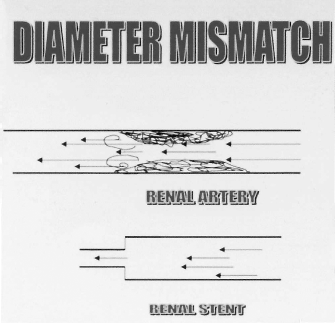
Diagram illustrating development of a blood flow gradient when there is a mismatch between segments of the vessel lumen. The mismatch may be the result of narrowing of the lumen by stenotic disease or widening of the lumen with placement of an intraluminal stent.
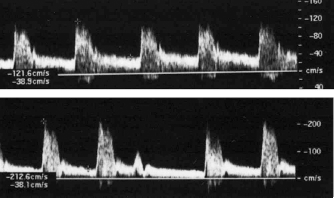
Doppler spectral waveform from (A) within a stented renal artery and (B) at the distal end of a renal stent in the absence of flow, reducing renal artery stenosis. The patient whose study is shown in (B) had intrinsic medical renal disease as evidenced by the low diastolic flow component of the Doppler spectral waveform. The patient also exhibited cardiac arrhythmia.