
Abstract
The role of waveforms in the diagnosis of venous thrombosis and venous insufficiency has changed dramatically during the past few decades. Historically, venous physiologic devices and Doppler waveform analysis attempted to replace venography. Although these indirect testing methods fell short of this goal, direct venous imaging did not. There is still, however, valuable information that can be obtained from Doppler waveform analysis and, in some instances, this information is the most accurate way to answer a particular clinical question.
Introduction
Technology that allows investigators to peer directly into vessels without injecting dyes and exposing the patient to radiation has not always been available. This seems hard to believe now, when duplex ultrasound allows such an easy and accurate method for the evaluation of veins and arteries. Before the advent of noninvasive testing, a patient with a suspected venous thrombosis was diagnosed by clinical assessment, which was notoriously unreliable, or by venography. Venography (Figure 1) was accurate but was painful, expensive, involved the injection of a contrast material, and exposed the patient to radiation. There were inherent risks with this invasive procedure, and the recipient of a venogram was not likely to agree to a follow-up. Because of these limitations, forward-thinking investigators began exploring ways of evaluating venous blood flow without injections or radiation. The initial efforts seem comical in this day and age but were actually quite brilliant advances, some of which carry over into our everyday practice even now.
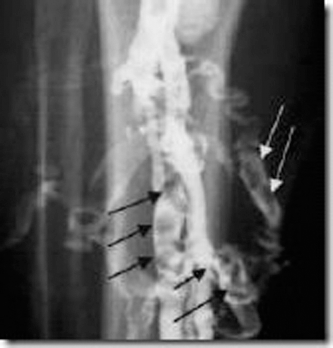
An abnormal venogram. Note segments of the calf veins in which the contrast material does not fill the veins.
Plethysmography
In the 1970s noninvasive vascular techniques to evaluate venous blood flow were focused on use of plethysmography. Once developed, this technique was quite effective at detecting the presence or absence of major deep venous obstructions. There were a number of different plethysmographic devices, but they all shared similar strengths and limitations. The biggest limitation was their poor reliability in detecting partially obstructive thrombus. This limitation often meant the plethysmographic study was used primarily as a screening tool. Venography was still needed to confirm the diagnosis and, if positive, provide information about the location of the thrombus before any treatment was implemented. Although plethysmographic devices did eliminate the need for many needleless venograms, it fell short of the goal of eliminating them.
Impedance Plethysmography
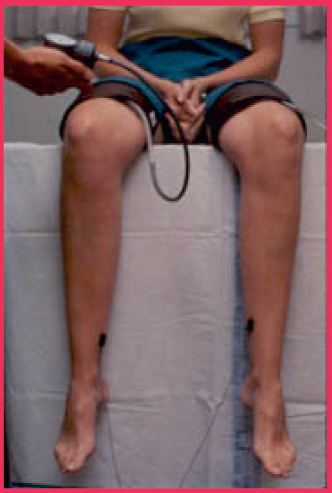
One of the most popular of the early plethysmographic techniques was impedance plethysmography (Figure 2). This technique uses circumferential electrodes positioned around the calf. The electrodes measure electrical impedance changes that are reflective of venous blood volume changes and generate venous capacitance and outflow curves.
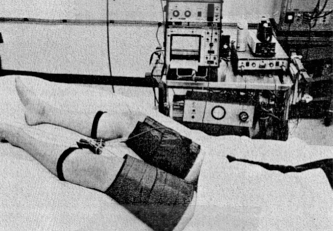
Impedance plethysmography study being performed. Legs are elevated to allow venous outflow. Occluding cuffs are placed on the thigh, whereas sensors are placed on the calf
An occlusive cuff is positioned on the thigh and inflated to a pressure that occludes venous outflow (typically 50 mmHg) but not arterial inflow. The cuff remains at the occlusive pressure until maximum venous volume is reached, typically within 2 minutes, but is dependent on arterial inflow, venous obstruction, and the baseline venous pressure. When the occlusive cuff is released, venous blood rushes out of the leg toward the heart. If there is no obstructive thrombus, venous blood will be evacuated very quickly—within 3 seconds of cuff deflation. If there is a deep venous obstruction, venous blood moves through collateral vessels. Venous outflow occurs at a prolonged rate (>3 seconds), and a positive result is produced (Figure 3).
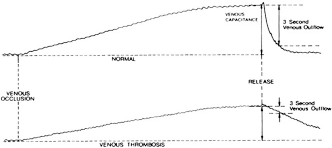
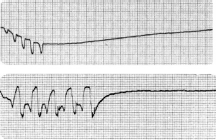
Impedance plethysmography tracings. The top tracing is normal. The bottom tracing suggests venous thrombosis. Notice how blood flows from the normal leg quickly (returning to normal levels within three seconds). Flow in the abnormal tracing takes much longer to leave the leg because thrombus is obstructing the main deep veins forcing blood to leave through collaterals.
This technique was relatively simple and reliable but was prone to missing thrombus that did not totally obstruct the vein. This flaw is potentially lethal because nonobstructive thrombus is frequently poorly attached to the vein wall and prone to embolize. To make matters worse, impedance plethysmography was only accurate in the detection of deep vein thrombus (DVT) in the common femoral and femoropopliteal system; calf thrombi and thrombi in the profunda femoris (deep femoral) vein were routinely undetected. In addition, a false-positive diagnosis of DVT was common if the patient was poorly positioned or tensed the musculature of the extremity.
Phleborrheography
Phleborrheography was another venous plethysmographic technique that was standard in the vascular laboratory of the 1970s. Developed by Jack Cranley, MD, this device was dependent on respiratory oscillations to diagnose venous thrombosis. 1 This technology involved the use of multiple recording cuffs: one around the thorax, one mid-thigh, and three on the calf in close proximity to each other, the last around the foot. Foot cuff compression propelled venous blood up the leg (Figure 4) as the thoracic and lower extremity sensor cuffs detected and recorded respiratory oscillations propagating synchronously with each breath. A calf cuff compression evaluated the degree of venous blood emptying from the extremity.
A phleborrheogram being performed. Notice the sensing cuffs on the thigh and calf. The cuff on the foot is used to push blood past the sensing cuffs.
Respiratory oscillations detected throughout the lower extremity implied a normal deep venous system. Diminished or absent respiratory oscillations suggested that the propagation of these signals was being impaired by obstructive thrombus. Poor or absent venous emptying during calf cuff compression created an abnormally elevated venous waveform (Figure 5) as the result of increased venous pressure resulting from blood trapped in the extremity. An elevated venous waveform in combination with poor or absent respiratory waveform oscillations was suggestive of DVT.
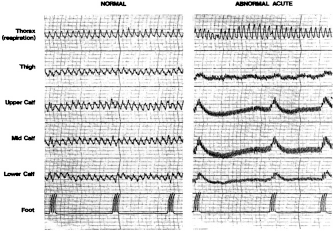
Normal phleborrheogram tracings on the left side. Abnormal tracings are shown on the right. Notice the thorax waveforms resulting from the patients' breathing. On the left, note how the “respiratory” wave is transmitted all the way down the leg. Note how the foot cuff is used to augment venous flow. On the right, note the absence of respiratory waves. Also note how the flat baseline rises when the foot cuff propels blood up the leg. This is suggestive of a deep vein obstruction.
Similar to impedance plethysmography, this technique was best at detecting major deep vein thrombosis; however, it was more sensitive in defining the level of obstruction as well as detecting calf vein thrombus. Limitations of this study included a tendency to be messy because of the use of ink for the plethysmographic recording paper, which meant it was also prone to recorder stylus ink clogs and spillage. Furthermore, the patient had to be positioned perfectly. False-positive findings were an everyday occurrence because of positioning issues and, as with impedance plethysmography, this technology was prone to missing non-occlusive thrombus.
Continuous-Wave Doppler
Around the same time that plethysmography was being used, advances were being made in the use of continuous-wave (CW) Doppler to detect venous obstructions (Figure 6). CW Doppler had been initially developed to provide information arterial blood flow, but some investigators began to develop protocols by the use of venous signals to diagnose venous thrombosis.
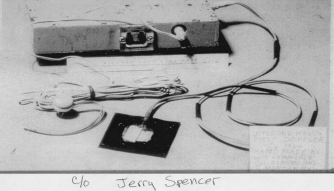
One of the earliest continuous wave Doppler devices.
Doctor Robert Barnes developed a venous CW Doppler training manual that was accompanied by a cassette tape with audio Doppler recordings of normal and abnormal venous blood flow. Venous Doppler signals were interpreted audibly and were rarely accompanied by waveforms. It was not until the advent of venous duplex in the early 1980s that spectral, range-gated pulsed Doppler waveforms became part of the standard venous protocol. Several characteristics of the venous CW Doppler signals were shown to have clinical value, including:
Spontaneity: Venous flow that occurs without compression or supplementary maneuvers.
Phasic: Flow that varies in response to respiratory changes; decreasing with inspiration and increasing with expiration. 2
Patent: Any flow that can be elucidated within the vein.
Nonpulsatile: A lack of pulsatile flow in the venous signal (a pulsatile signal suggests venous hypertension and may indicate a cardiac problem, a state of fluid overload, or, if unilateral, the presence of an arteriovenous fistula).
Augmentation: Increased venous flow in response to distal limb compression.
Competent: Flow stops and does not reverse direction with Valsalva (or with the patient standing after release of distal limb compression).
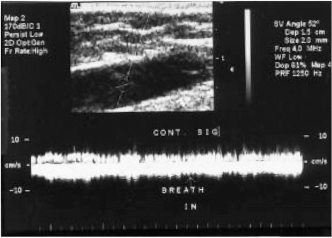
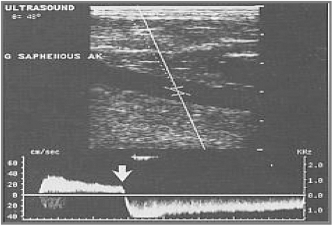
Spontaneous and patent flow simply means that the vein being examined is not totally occluded. Phasic flow suggests that there is no obstruction above the level of insonation. Augmentation suggests no obstruction between the level of limb compression to the level of insonation (Figure 7). Competent flow suggests that valves are patent. A pulsatile signal in the legs suggests venous hypertension, e.g., congestive heart failures, pulmonary hypertension or tricuspid insufficiency (Figure 8). In such cases, the signal will be noted bilaterally. A unilateral signal may indicate the presence of an arteriovenous fistula in that limb. A pulsatile signal in the subclavian or internal jugular vein may be normal because of their close proximity to the heart.
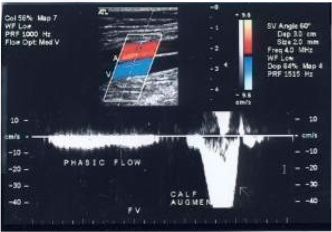
Pulsed Doppler spectral waveform taken from the femoral vein. Note how the flow ceases with inspiration and resumes with exhalation (phasic flow). Also note the increase in flow when the calf is compressed (augmentation).
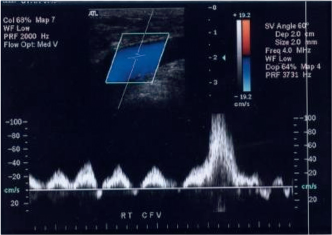
Pulsed Doppler signal taken at the level of the common femoral vein showing a pulsatile flow pattern suggesting a state of fluid overload.
Experienced CW Doppler examiners often achieved similar accuracy to that achieved using plethysmography devices in detecting or ruling out major deep vein obstructions. Many institutions often combined Doppler with plethysmography protocols to enhance accuracy in detecting venous obstruction in veins above the knee.
Venous Duplex Imaging
The advent of venous duplex imaging in the early 1980s changed everything 3 ; thrombus could now be imaged directly. The pressing need for Doppler and plethysmographic information for the detection of venous thrombosis went much the way of the landline phone. Not only could thrombus be seen directly, it could be characterized and precisely localized anatomically in the limb. Nonobstructive thrombi that previously eluded plethysmography and CW Doppler were now easily identified.
Although plethysomographic techniques were mostly abandoned, Doppler analysis persisted in tandem with B-mode imaging. Although no longer the primary diagnostic tool, Doppler information continues to serve as an adjunct to information being gathered from the image, e.g., when poor augmentation is heard with Doppler, the image will demonstrate the thrombus that is obstructing venous outflow.
Venous Doppler signals that have good phasicity, augmentation, are nonpulsatile, patent, and have spontaneous flow are likely to be noted in conjunction with veins that have normal imaging characteristics. When venous Doppler and imaging agree, the chances the test will yield accurate results are high. When used in combination with a good medical history, the venous duplex study will add additional confidence that a correct diagnosis has been made.
There are some instances in which Doppler information adds more to the duplex examination than imaging. For example, a continuous (versus phasic) Doppler signal in the femoral vein can alert the examiner to the presence of an obstruction in the veins above the groin (common femoral) level that may otherwise have gone un-detected (Figure 9). A quick spot check of the contralateral common femoral vein during a unilateral venous duplex may uncover a problem in that limb, prompting the examiner to expand the unilateral venous duplex to a bilateral study. In the upper extremity, a lack of cardiac pulsatility in a Doppler waveform from the subclavian vein may hint to the possibility of a more central obstruction. The accuracy of this method for the detection of a more central obstruction may be diluted if the obstructed area has had time to form significant collaterals or has recanalized.
A pulsed Doppler spectral signal taken at the level of the common femoral veins that show continuous flow. Note how having the patient take a breath does not stop the blood flow. This finding suggests the possibility of an obstruction above the level of the transducer.
Diagnosing Venous Reflux
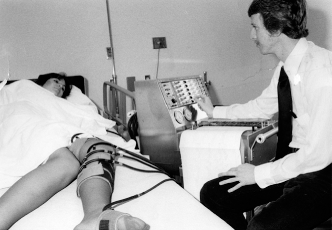
Venous photoplethysmography (PPG) has also been used to identify reflux, although to a lesser degree since the advent of duplex imaging. In this test, the patient is positioned with the legs dangling (Figure 10). PPG sensors are placed 5–10 cm above the medial malleolus. Dorsiflexion of the foot or manual calf compression propels venous blood flow up the leg.
Patient undergoing PPG venous reflux test. Note occluding cuffs on the thighs and PPG's on the calf.
In a normal subject blood pumped from the extremity will take a long time (>20 seconds) to return. If, however, the valves are not functioning, venous refilling will occur in less than 20 seconds (Figure 11). A tourniquet can be applied to differentiate between deep and superficial reflux, as well as estimate the level of reflux. This technique is still in use in some institutions today.
PPG tracings looking for venous reflux. The top waveform is a normal response where, after calf compression maneuvers, the waveform shows blood being pumped out of the calf and slowly returning to per-compression levels. The bottom show how the calf fills back up with blood quickly as the leaky valves allow the blood to fall right back into the leg.
Even after the venous duplex imaging revolution for diagnosing thrombus, spectral Doppler waveform (and its close cousin, color Doppler imaging) is still more useful in one arena than the imaging component. Although vein valves can be easily imaged (Figure 12), their functionality cannot be accurately assessed by the use of only imaging (B-mode) technology. Spectral Doppler analysis, with or without color flow, provides a graphic representation of venous valvular function (as opposed to the visual identification of pathology). Spectral Doppler waveform and color flow analysis are essential to planning surgical vein stripping, ligation, sclerotherapy, and endovenous procedures, such as laser and radiofrequency ablation.
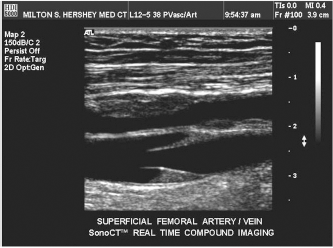
Longitudinal view of a healthy venous valve. Note the stagnant blood trapped in the cusp.
Although the idea behind using Doppler waveform analysis and color flow imaging to identify reflux is quite simple (to verify if blood flow reverses), the art of performing this evaluation is a minefield of potential technical errors. Heated controversy exists regarding which of two methods best evaluates this condition: standing, the use of distal calf compression, or reversed Trendelenburg's) position and the Valsalva maneuver.
When the standing method is used, the probe is placed over a vessel and the patient's calf is squeezed either manually or by a rapid inflation-deflation cuff device. Forward flow is initially observed. As the compression ceases, the blood eventually loses its forward momentum and the blood flow reverses as it is pulled back into the leg by gravity. When valves are competent, the reversing of blood stops in less than 0.5 seconds. When reflux is present the reversing flow lasts longer (Figure 13).
Venous reflux demonstrated with blood being squeezed out of the leg of a standing patient (flow above the line). Then the squeeze (of the calf below the level of this sample) is released and blood falls backward through incompetent valves. Note how long the reflux continues.
When using the reversed Trendelenburg's position, the patient is asked to strain so the stomach muscles push up toward the ceiling. When this method is used, blood will flow backward as long as the patient strains.
When testing for reflux, there are four ways of assessing valve competency:
direct visualization of the valve with the gray scale image;
use of Doppler waveforms to detect flow;
use of color Doppler imaging to detect flow; and
use of direct imaging of blood flow using grayscale to detect flow.
One might think that direct imaging of the valve with grayscale would be the most accurate of the four. However, it is the least accurate. Although some valves that are severely damaged can be judged incompetent easily (Figure 14), many valves that appear to close completely (Figure 15) are actually leaking (something that is only discovered when color or Doppler is added).
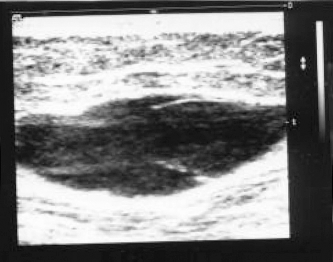
Incompetent valve. The leaflets are thickened and the valve sinus area is dilated even when the patient is not standing or straining.
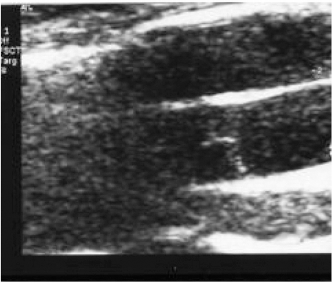
Valve that appears to be closing completely in response to standing but in reality, once color is added; it is discovered to be leaking.
Spectral Doppler waveforms are extremely accurate for the detection of severe and moderate reflux. They can, however, miss very mild or minimal reflux because the very minimal refluxing flow must reach a certain velocity before it can be detected and displayed as a Doppler waveform deflection. The same problem also limits color's ability to display extremely minimal reflux (Figure 16). The most accurate method for detecting minimal reflux may be in utilizing the gray scale image to directly visualize packets of blood cells in motion (Rouleaux flow).
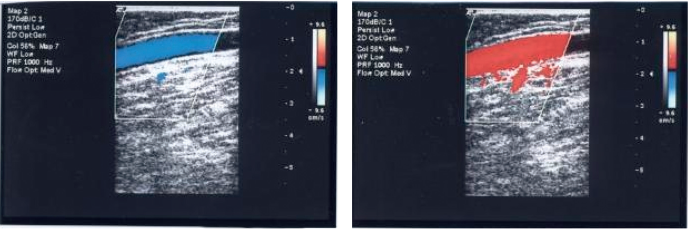
Using color flow imaging to identify reflux. Forward flow is identified by blue color at rest. With a Valsalva maneuver, the flow reverses as displayed by red color. Using color is useful for detecting severe and moderate reflux but may miss minimal reflux because flow must reach a certain velocity before color will be displayed.
There are several technical considerations that have to be monitored constantly to ensure the evaluation for reflux is performed accurately. Reflux can be missed if the:
the Valsalva maneuver is not accurately performed; Doppler scale is too high (Figure 17);
Doppler wall filters are set too high;
srite priority setting is set too low (Figure 17);
Doppler gain is set too low;
vessel angle of insonation is not appropriate; and
the examination bed is not tilted enough.
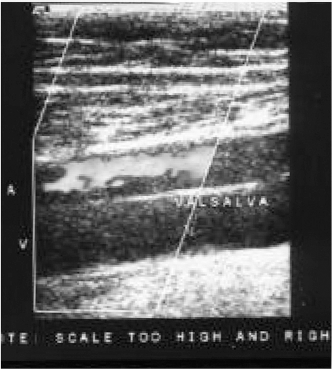
Checking for reflux in the femoral vein. Reflux is occurring but the color does not register it because of two technical errors: the scale is set too high and the write priority is set too low.
As you can see, a simple reflux evaluation can become very complicated and should be considered a very examiner dependant evaluation.
Summary
The role of waveform analysis in the diagnosis of venous thrombosis and venous insufficiency has evolved throughout the years. Although waveform information has largely taken a back seat to imaging technology, it should not be ignored or forgotten. There is enormous value to be gained in paying attention to the information contained therein, particularly in venous reflux evaluations.