
Abstract
Introduction
Doppler ultrasound (US) is extensively validated for classification of vascular disease based on velocity calculations. Although widely used to evaluate dialysis access arteriovenous fistulas (AVF), accurate volume flow measurements have proved more elusive, with significant variability resulting in large thresholds for differentiation of normally functioning from failing fistulae. We sought to compare in vivo measurements of AVF blood flow volume measured by the Transonic transit-time ultrasound flow device with those of Doppler US.
Methods
Bilateral femoral AVFs (n = 6) were created in swine (n = 3). Comparative volume flow measurements were made at baseline, 15, 30, 60, and 120 minutes after the creation of AVFs with the Transonic device and with Doppler US using an estimated time averaged velocity and the diameter of the vessel to calculate volume flow using the formula: Q = v A = v (πr2), where Q = volume flow, v = time and spatial averaged mean velocity, A = cross-sectional area, and r = radius of the vessel. Repeat measurements (minimum 3) were performed at each time point. Linear and multiple linear regression analyses were performed.
Results
Linear regression analyses showed a weak correlation (R2 = 0.103, p = 0.002) between Transonic and Doppler volume flow measurements. Doppler consistently showed greater volume flow over all time points than Transonic data. Average Transonic values had less variability over time (R2 = 0.9505) compared with average Doppler measurements (R2 = 0.7601). Average flow increased over time, regardless of the flow measurement device, consistent with reported clinical observation of AVF maturation process. Multiple linear regression analysis demonstrated correlation between Doppler and Transonic data (R2 = 0.197, p = 0.013), and provided a formula to estimate Transonic flow measurement from the Doppler data. [Transonic = 113.742 + (0.334 * Doppler)].
Conclusions
Transonic data demonstrated a stronger relationship between volume flow and time than Doppler data, suggesting transit time ultrasound volume flow measurements may be more accurate. Doppler data tended to overestimate volume flow measurements; however, it may be feasible to use a correction factor for Doppler data that predicts Transonic results.
Introduction
Duplex Doppler ultrasound is used widely and has been validated extensively to examine a wide variety of vascular anatomy and pathology. It is used routinely in virtually every vascular bed outside the chest. The combination of high-resolution grayscale imaging depicting normal and abnormal vascular anatomy with Doppler flow data allows one to determine the flow characteristics associated with both the normal and pathologic states. This determination is accomplished primarily by measuring the Doppler-shifted frequency of the backscattered echoes to calculate a blood flow velocity. This technique has been shown to be highly accurate in differentiation of normal versus abnormal vascular anatomy. In addition, as flow velocity increases with increasing degrees of stenosis, this calculated velocity has been successfully used to grade the severity of lesions. The ability to calculate blood flow volume has clear clinical utility but has proved much more elusive. This calculation has been used most extensively in the evaluation of arteriovenous fistulae (AVFs) created for dialysis access.
Although successful, the variability of this application has resulted in rather large thresholds for the differentiation of a normally functioning fistula from a failing AVF.1–4 To a lesser extent, measurement of volume flow also has been attempted with limited success in the evaluation of extremity bypass grafts, but this application has not been widely used. 5 The objective of this study was to evaluate the correlation of AVF blood flow measured by duplex Doppler ultrasound and a transit-time ultrasound volume flow device (Transonic HD01 Hemodialysis Monitor; Transonic Systems Inc., Ithaca, NY).
Study Overview
Volume flow measurements recorded by an ultrasound transit time device is used intraoperatively in a variety of vascular surgical procedures and is widely regarded as the gold standard for volume flow measurements.6–8 It is most commonly used after the construction of an AVF and has been used as a predictor for radiocephalic AVF 9 as well as other vascular reconstructions. 10 However, this device uses a transducer that encases the artery at the time of surgery, is not permanently implantable, and therefore is not acceptable for monitoring flow changes over time. In contrast, Doppler ultrasound has the theoretical ability to determine volume flow and would be ideal for this purpose. The reported data were acquired to supply data to the US Food and Drug Administration comparing the correlation of the Doppler-derived volume flow calculations with those from the Transonic device. In a clinical trial of an investigational drug (PRT-201), both techniques were used to monitor AVF blood volume flow over time for the purpose of assessing AVF maturation. 11 Although obtaining the Doppler ultra sound data intraoperatively from within the open surgical wound would be preferable for optimal data quality, because of the stated purpose, the ultrasound data were obtained transcutaneously.
In addition, surgical model preparations generated as part of this study were evaluated for the purposes of animal model refinement to best compare the Transonic versus duplex Doppler methods of flow measurement. Observations were documented and used to select the most appropriate model for comparing flow measurement techniques. The study used 1 male New Zealand White rabbit and 4 male Yorkshire swine with specifics, as shown in Table 1. Animals underwent surgical procedures to create 1–2 AVFs per subject. Surgical model appropriateness for flow measurement device comparisons was evaluated on the basis of anatomical constraints versus flow measurement device capabilities and imaging output.
Study Design
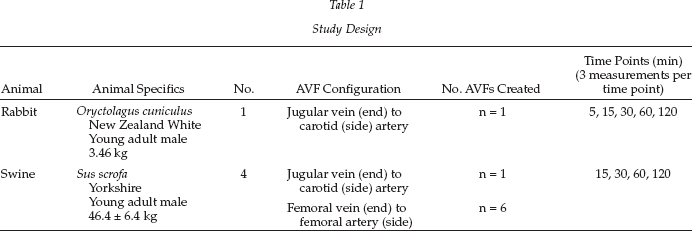
The rabbit AVF jugular vein (end) to carotid artery (side) model initially was chosen on the basis of its acceptance in peer-reviewed literature. However, at the time of this study, duplex Doppler measurements could not be calculated because of system limitations unrelated to the animal model. Additionally, because of the inherently small vasculature, the rabbit model was more difficult to image with the duplex imager and also complicated the acquisition of the Doppler data.
This problem led to the alternate use of the swine AVF jugular vein (end) to the carotid artery (side) model, which also proved to have limited utility despite the larger vasculature. The carotid and jugular vessels were enclosed in a region 6–8 cm beneath densely echogenic musculature, making the duplex Doppler measurements more difficult to obtain. Additionally, in the initial test animal, considerable turbulence in the AVF outflow vein was encountered. It was uncertain whether this was attributable to anatomical or technical reasons. We also thought that the presence of turbulence could induce greater error in duplex Doppler-derived flow measurements.
Finally, swine bilateral AVFs were created via anastomoses of the femoral veins (end) to the femoral arteries (side). This model preparation allowed adequate ultrasonic visualization and comparatively good measurements between the types of flow measurement technologies and also more closely resembles a human AVF, which typically is placed in an extremity. It is these data that form the basis of this report.
Housing, Husbandry, and Animal Care
The Test Facility was registered with the US Department of Agriculture to conduct research in laboratory animals. All procedures and conditions of testing were in compliance with the Animal Welfare Act and its amendments. The Test Facility also follows the guidelines as described in the Guide for the Care and Use of Laboratory Animal. 12 The animals were quarantined, housed, fed, and watered as per protocol number I00030. Standard veterinary practices were performed during quarantine, including physical examinations (a record of general condition and physical state, body temperature, respiratory rate, heart rate, and capillary refill time) and clinical pathology (hematology and serum chemistry) to determine health assessment before assignment to study. These data were reviewed, and the Study Director assigned animals deemed acceptable to the study as appropriate. Randomization was not required for this study.
Anesthesia and Preoperative Procedures
The swine received tiletamine HCl/zolazepam HCl (4–6 mg/kg, intramuscularly) as a preanesthetic. Preoperative nifedipine (10 mg, sublingual) also was given. Each animal was prepared by first clipping the surgical area of all hair. An ophthalmic lubricant was applied to the eyes to prevent corneal damage during the procedure. Each animal was intubated, and isoflurane was administered via inhalation at 0.1–5% to effect for maintenance anesthesia. Vascular access was obtained via placing a peripheral intravenous catheter (i.e., ear vein or other acceptable peripheral vessel). Intravenous fluids were administered as necessary to maintain catheter patency and as fluid support for the animal at a rate of ~5 mL/kg/hr. The animal was transported to the procedure table and positioned in dorsal recumbency with the neck hyper extended. Warm water heating pads or other devices were used to help the animal maintain adequate body temperature while they were under anesthesia. Limb-leads were placed for electrocardiography (ECG) monitoring. Heart rate and ECG were monitored continuously during the surgical procedures. Anesthetic management drugs were administered if indicated according to each animal's physiologic status. The drug, dose, route, and site of administration were documented in the procedural records. After all measurements were obtained as specified, all animals were euthanized as per protocol. 13
Surgical Procedure: Femoral Vein to Femoral Artery Anastomosis in the Swine
Bilateral AVFs were created via anastomoses of the femoral veins (end) to the femoral arteries (side) and the time of reestablishment of flow was noted. A 3-mm or 4-mm Transonic probe was placed on the femoral vein for a baseline measurement and then again to the outflow vein after the completion of the AVF. The probe size selected was one that contacted the vessel wall on opposing sides without pronounced pinching of the vessel (Figure 1). A physiologic saline solution was used as the device-vessel coupling agent. For the purposes of this experiment, the Transonic probe was enclosed within the incision site under two tissue layers and the wound filled with saline to allow for the external Doppler measurements to occur simultaneously. The wound was subsequently closed with running sutures.
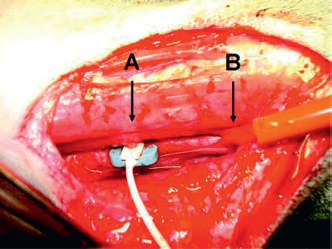
Transonic flow probe (A) surrounding vessel (B).
Transit Time Ultrasound and Duplex Doppler Measurements
The Transonic probe (PSB-series probe) connected to a flow meter (400 Series) was calibrated in a plastic syringe. Quantitative measurements using the Transonic device were manually recorded at predetermined intervals of approximately 15, 30, 60, and 120 minutes after blood flow was established in the AVF. Quantitative measurements of the AVF outflow vein blood flow rate were also made transcutaneously through the closed incision using a commercially available duplex color Doppler ultrasound instrument using an 8–5 MHz linear array transducer (Siemens Acuson Sequoia, Siemens Healthcare Solutions, Malvern, PA). The volume flow measurement technique used in this study is outlined as follows. The fistula was identified and the vein was followed as far distally from the anastomosis as the anatomy would permit in order to allow flow to become as laminar as possible but not past any notable venous tributaries. The vein was then imaged without color Doppler in both cross-sectional and longitudinal planes. Care was taken in order to intersect the vessel at 90° and avoid oblique angles of incidence that would induce error in the diameter measurements. Because Doppler data were obtained in a longitudinal plane, diameter also was measured from a frozen image in the longitudinal plane to ensure identical locations however confirmatory cross sectional images were noted. Because the vessel diameter increases significantly with the passage of each systolic pulse, care was taken to freeze the image at peak systole. Optimally, an ECG trigger could be used; however, we did not have such a trigger available. The innermost reflector of the vessel wall was used measurement purposes. Pulsed-wave Doppler insonation of the vessel was performed with the sample gate opened to encompass the entire lumen without including the wall to minimize any effect from the wall vibration or adjacent vessels. Spectral analysis was performed with the angle of insonation maintained at a constant 60° angle parallel to the vessel wall. No attempt was made to correct for non-axial flow vectors. Color Doppler was used sporadically to ensure proper anatomic orientation but was not used for any other purpose. Spectral waveforms were obtained for multiple cardiac cycles and a time averaged mean velocity was calculated from 3 consecutive high quality waveforms using the instruments internal software. Using these parameters, the instrument automatically calculated the volume flow rate in mL/min. A minimum of 3 measurements were recorded manually at approximately 15, 30, 60, and 120 min after blood flow was established in the outflow vein. As data collection over time was approximate at specific time points, the following data groupings were applied:
15-min time point = 10–20 min post-AVF
30-min time point = 25–35 min post-AVF
60-min time point = 55–65 min post-AVF
120-min time point = 115–125 min post-AVF
The ultrasound transducer and instrument settings used were recorded. To avoid any potential bias, the sonographer was blinded to the Transonic device flow data. Flow (mL/min) data from this study were categorized by flow measurement device, animal, limb, and type of AVF preparation. The 60-min Transonic measurements for one animal (#25023) were excluded because of a loss of Transonic probe apposition with the wall of the outflow vein. All flow measurements were grouped by device (Transonic or duplex Doppler) and within each group pooled for analysis. Linear and multiple linear regression analyses were performed using SigmaStat Version 3.5 (Systat Software, San Jose, CA).
Results
The swine femoral AVF preparation proved a superior model for this study because of improved data quality with both gray scale duplex imaging and Doppler and therefore better data consistency than either the rabbit or swine jugular-carotid AVF preparations. Linear regression analyses showed that both Transonic and duplex Doppler ultrasound measurements had time as a predictive independent variable: average flow increased over time, regardless of the flow measurement device (Figure 2). This finding is consistent with the reported clinical observation of an AVF maturation process. Additionally, one can note that the average Transonic and Doppler results trended together. However, an R 2 of 0.95 was obtained for the average Transonic flow values over time, whereas the R 2 for average duplex Doppler flow values was 0.76, suggesting that the transit time flow meter is more accurate or at least more consistently reproducible. In 5 of 6 preparations, duplex Doppler data consistently recorded a greater flow rate at all time points than simultaneously gathered Transonic flow data.
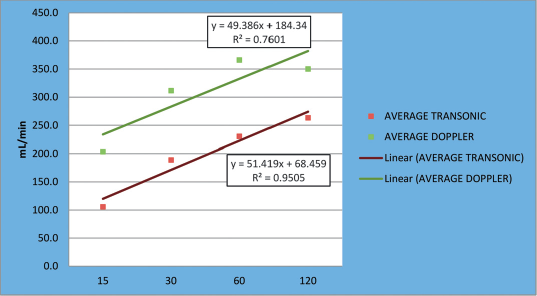
Average femoral AVF Flow by time point.
Multiple linear regression analysis demonstrated a correlation between duplex Doppler and Transonic data and provided a correction factor [Transonic = 71.193 + (0.256 * Doppler) + (1.079 * time)] that could be applied to Duplex data to predict the Transonic results. Conversely, these determined that the dependent variable “Doppler” also can be predicted from a linear combination of the independent variables “Transonic” and “time.” The following equation can be applied to duplex Doppler data to obtain results approximating Transonic values and vice versa: Doppler = 252.550 + (0.260 * Transonic) + (0.442 * time). Finally and perhaps most useful, the transit time volume flow value could be predicted by applying the following formula to the Doppler-derived flow volume result: Transonic = 113.742 + (0.334 * duplex Doppler). The ability to transform duplex Doppler data into Transonic data may be clinically important because it is not practical to use implanted Transonic probes over time in patients.
Discussion
This study was designed to better define the relationship of flow measured by a transit-time ultrasound flowmeter and duplex Doppler methods. Vascular surgeons commonly use a hand held, nonimplantable, transit-time ultrasound flow transducer at the time of vascular surgery to determine blood flow rates immediately after construction of a vascular anastomosis. Flow measured at this time gives functional information on the technical success of the procedure. In the case of AVF surgery, blood flow measured during this perioperative period has been shown to be a good predictor of successful AVF maturation or nonmaturation. 9
Once a surgical incision is closed, a transit time ultrasound transducer cannot be reapplied without opening the wound and re-exposing the vessels. This is obviously neither practical nor desirable. Therefore, follow-up flow measurements typically are obtained using transcutaneous duplex Doppler ultrasound or a thermodilution technique, the latter usually obtained at a dialysis session. In a patient with a functioning AVF, the duplex Doppler ultrasound technique is preferred for both early postoperative and long-term surveillance. With the use of this technique, it has been recognized that flow through the AVF increases, as do inflow artery and outflow vein diameters in the days and weeks after surgery in a process often referred to as AVF “maturation.” These changes begin immediately after AVF creation. The increase in AVF blood flow observed in the current study with both Transonic and duplex Doppler methods is consistent with this previous understanding. Immediate changes in blood flow can be measured in animals by surgically implanting a transit-time ultrasound transducer like those used in this study. Unlike the handheld probes used by surgeons, the probe can be fixed to the vessel and the wound closed around the probe. Once the incision is closed, a duplex Doppler probe can be used transcutaneously and acquire blood flow volume data simultaneously with the transit time flowmeter.
A transit-time ultrasound flow transducer uses a wide ultrasonic beam projected through the vessel of interest and measures the ultrasound wave transit time, which is affected by the volume flow through the vessel. Transonic flow sensors consist of a body that houses two ultrasonic transducers, which are positioned on one side of the vessel and an acoustic reflector, positioned midway between the transducers on the opposite side. 14 The downstream transducer emits a plane ultrasound wave that intersects the vessel in the upstream direction, bounces off the acoustic reflector, and is received by the upstream transducer, where it is converted into an electrical signal. The flow meter measures this transit time, that is, the time for the ultrasound wave to travel from one transducer to the other. A similar transmit-receive sequence is repeated but in a downstream direction by reversing the transmit and receive functions. Again, from this transmit-receive sequence, the flow meter derives and records an accurate measure of transit time (Figure 3). The transit time of the ultrasound wave is affected by the flow of fluid through the vessel. During the upstream cycle, the sound wave travels against flow and total transit time is increased by an amount dependent upon flow. During the downstream sequence, the sound wave travels with flow and transit time is decreased by the same flow-dependent amount. The downstream transit time is subtracted from the upstream transit time and the difference of integrated transit times is a measure of volume flow rather than velocity. This technique has been validated extensively and found to be highly accurate, reproducible, and can be considered the gold standard.6–8
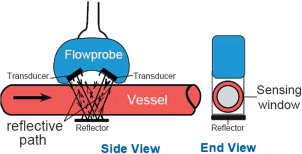
Diagram of a transit-time ultrasound flowmeter flow probe.
Duplex Doppler can be used to derive volume flow within a blood vessel by a variety of techniques, including time average velocity (either peak velocity or more widely accepted a mean velocity), time domain correlation, quantitative color velocity index, and most recently a 3-dimensional surface integration technique.15,16 The latter method uses newly developed transducer arrays and signal-processing shows much promise but is not yet in widespread use, has not been tested on high-volume flows, and is not thoroughly validated. The most common and widely used method was used in the current study, in which the diameter of the vessel is imaged and measured with high-resolution ultrasound and the cross-sectional area of the lumen is then calculated from this measurement. Time-averaged mean velocity is then measured in the same location by Doppler techniques. Volume flow can then be calculated using the time- and spatially averaged velocity multiplied by the lumen cross-sectional area at the site of velocity measurement. Most high-quality, duplex Doppler systems have integrated software packages that make these flow calculations possible.
Zierler et al., 17 using a timed blood collection technique, had validated this technique in 1992 in a study of baboons. For flow rates of less than 300 mL/min, this technique was found to have a good correlation (r = 0.9) and an average error of 13%. Unfortunately, similar validation data do not exist for the high-volume, highly disturbed flow conditions present in arteriovenous access conduits. Despite strong clinical implications, accurate, reproducible measurement of volume flow with conventional duplex Doppler scanners has been elusive. In his exhaustive text Ultrasound Physics and Instrumentation, Miele 18 outlines 3 major sources of potential error in calculation of volumetric flow: (1) Limitation in accuracy of diameter/area measurement; (2) a Doppler-derived mean velocity does not necessarily accurately represent the true mean flow; and (3) angle effects for both the Doppler and area measurements add further error.
Measurement of Diameter
Although the cross-sectional area of the vessel viewed in a transverse section can be traced, the most commonly used method is to measure the diameter of the vessel and then calculate the area from this measurement. An assumption made in this calculation is the lumen cross section is circular, which would clearly not always be the case. Although a circular cross section of an artery would not expected to be a significant factor, evaluation of the venous system likely proves more challenging, because veins are less likely to be a perfect circle. Irrespective of the shape of the vessel, measurement of the diameter of the vessel or tracing the cross section to derive the vessel's cross-sectional area is perhaps the largest potential source of error in this calculation. The ability of the sonographer to accurately and reproducibly measure the diameter of the vessel is limited. Resolution of the structures is dependent upon the instrument, the transducer frequencies used, and the ultrasound through transmission characteristics of the tissue, and these factors greatly affect the calculated area. In theory, maximum resolution is dependent on the wavelength of the carrier frequency which for 5 MHz ultrasound is ≈0.3 mm or ≈0.2 mm for a 7.5-MHz ultrasound. However in practice, resolution is more likely to be significantly less. Additionally, when one is measuring the vessel diameter, 2 interfaces need to be determined so these ranges could theoretically be doubled, and errors in the 0.5- to 1.0-mm range are certainly not unreasonable. Equally relevant is the fact that the cross-sectional area of the vessel is time variable, that is, it changes with the pressure wave moving through the vessel segment. The ability of the sonographer to consistently obtain the image at true peak systole also is limited, therefore making this area calculation inherently inaccurate. Any errors are then increased geometrically (given the area calculation from the diameter measurement [πr 2 ]). As can be perceived, the smaller the vessel, the larger the percent error. This is also a potentially significant factor in our data in that the swine femoral vein diameters ranged between 2 and 4 mm, and therefore very small errors in diameter measurements would potentially result is very significant difference in the area and subsequent volume flow calculation (Figure 4).
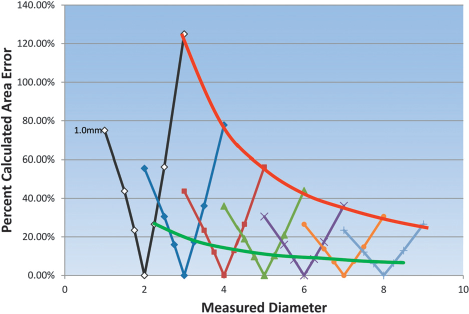
This graph depicts the practical minimum (green) and maximum (red) percentage error in calculated vessel area given the limitations of theoretical resolution and sonographer reproducibility. Each mark on the measured diameter line represents 0.25, 0.5, or 1.0 mm total cumulative error in measured diameter for both interfaces.
Measurement of Blood Flow Velocities
Accurate volume flow calculation requires an accurate calculation of blood flow velocity. Duplex Doppler instruments calculate blood velocity using the Doppler equation and the estimated angle of incidence of the ultrasound beam to the target. Several factors influence the ability of duplex Doppler to calculate velocity. First is the limitation of the instrument to accurately detect and measure the Doppler frequency shift and hence the velocity calculation will be affected. The bandwidth of any back-scattered Doppler signal depends partly upon the actual range of blood-flow velocities present within the sample volume. In theory, in the absence of flow, the Doppler frequency shift should be zero. A pulsed Doppler instrument does not emit a single frequency but in fact typically emits a range of frequencies in every pulse. This range of emitted frequency introduces a variation in back scattered Doppler frequency. This increase in bandwidth or artificial spectral broadening is called intrinsic spectral broadening. First described by Daigle et al. 19 in 1990, this can result in an overestimation of the Doppler-shifted frequency and hence the velocity. Interestingly, this phenomenon is significantly more evident in newer multielement arrays. Hoskins 20 used a string phantom to perform a direct comparison between the Doppler estimated maximum velocity and the true filament velocity in 6 commercial Doppler systems. Measurements were made in a standard clinical fashion and also varied ultrasound beam—filament angle, filament depth, filament velocity, and Doppler aperture position. Under imaging condition, the maximum velocity was overestimated in all cases (0–29% error) and for all variations, maximum velocity errors ranged from −4 to 47%.
Determination of Flow Vector
Accurate blood flow velocity calculation during in vivo investigations is most significantly limited by the difficulty of assessing the blood flow velocity vector. Traditionally, because this vector is unknown, flow is “assumed” to be parallel to the walls of the blood vessel, the operator directs the ultrasound beam to intersect the vessel axis at 60°, and the instrument uses the Doppler equation to calculate flow velocity. In fact, however, flow is often not axial and parallel to the vessel wall and therefore a major error in velocity calculation is inherent. Although the 60° angle of incidence was somewhat arbitrarily chosen during the development of the duplex Doppler technology, it has remained the preferable angle of incidence specifically for reasons of consistency because the true flow vector is indeterminate by traditional methods.
Flow patterns typical of functioning AVFs would certainly impact these calculations as well. Assumptions made in this calculation are that blood flow is laminar or minimally disturbed and axially symmetric at the recording site. In a clinical situation, a small sample volume placed centrally in a vessel with laminar flow would generally record only the highest frequencies (calculated velocities) and the resulting time-velocity spectrum would be narrow. In stark contrast, flow through a properly functioning AVF would be highly disturbed if not frankly turbulent, in which there is a random direction and speed of the flow particles with respect to space and time. This makes an accurate estimation of even a mean velocity vector impossible to determine. As well as increased maximum frequency, the back-scattered frequencies would have great variation, i.e., the time-velocity spectrum would be broadened. Under these conditions, it would be expected that duplex Doppler-derived velocity calculation are even less accurate. For volume flow calculations, the sample volume is increased to encompass the entire lumen of the vessel that would, by definition, create a broadened spectral envelope but does not however change the velocity vector issue. When the true velocity vector is unknown, using the angle correction in the Doppler equation realistically provides more of a “correction factor” than a calculation of true velocity when using various carrier or transmit frequencies or Doppler shifted frequencies measured at various angles of insonation. Although the Doppler equation predicts a consistent velocity calculation Doppler frequency shifts obtained at various angles, this methodology fails in practice. This was well demonstrated by Primozich et al. in numerous classic presentations that showed dramatically different velocity calculations obtained in vivo under identical conditions (Figure 5).
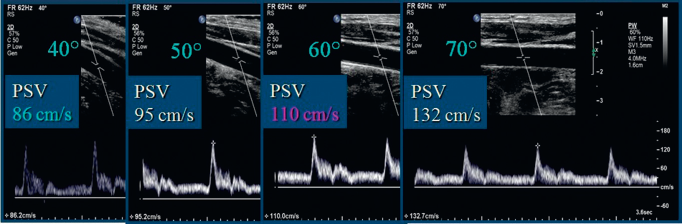
Four different high-quality spectral waveforms obtained under identical conditions with varied angle of incidence with the vessel wall resulting in significantly varied velocity calculation.
There is additional evidence that the calculated “velocity” does not really represent the actual speed of blood movement through the vessel. Cardiologists have been able to use this velocity data to calculate the pressure gradient across a heart valve with clinically acceptable accuracy and reproducibility. Importantly however, in this application, the Doppler insonation angle is always 0 degrees. Simplified, this calculation is p = 4V 2 (pressure equals 4 × velocity squared.) Using this calculation, one can plot the pressure gradient required for given velocity (Figure 6).
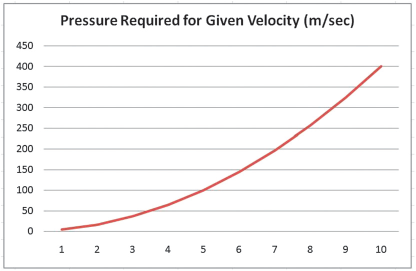
Plot of the pressure gradient required to generate a given velocity.
If we consider the aforedescribed calculation in practice, we can see that the velocities obtained in peripheral vessels can be clearly erroneous. The image in Figure 7 obtained with current instrumentation with good technique shows a severe internal carotid artery stenosis with a peak systolic velocity of 600 cm/sec. To create a velocity of 600 cm/sec, the pressure gradient must be at least 144 mmHg. The true pressure gradient is transient in nature largely impossible to measure but can certainly be estimated. To measure absolute pressure, one needs to know the pressure on one side of the measurement or the other, for example, the central venous pressure from the neck veins, or the brachial artery pressure measurement, with the assumption that there is no difference from this peripherally measured pressure to the centrally (extrapolated) calculation. This patient's systolic blood pressure was 128/60 mmHg obtained approximately 15″ prior to this image, a gradient of approximately 68 mmHg and therefore a velocity of 600 cm/sec would be physiologically impossible.
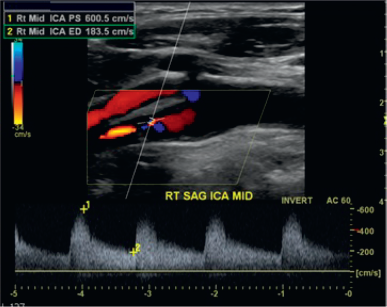
An internal carotid artery stenosis with a calculated peak systolic velocity of more than 600 cm/sec.
If in fact, we believe the Doppler equation, the primary variable must be the unknown velocity vector, which therefore precludes an accurate velocity calculation. Using the mean velocity would tend to minimize some of these issues but does not negate the effects of the flow profile in the calculations nor reliably improve the velocity estimations.
Volume Flow Measurements
Given the multiple issues that impact the ability of duplex Doppler to accurately calculate measure diameter and calculate “velocity,” it is not surprising that overall, there is a rather poor validation of the volume flow technique. Winkler et al. 21 performed a study assessing the accuracy of volume flow determinations by 5 commercially available duplex scanners using a flow phantom with volume flow ranging between 150 and 823 mL/min. They used 3 different methods, including peak velocity, mean velocity, and a time domain correlation method. Both velocity techniques correlated poorly with the flow phantom whereas the time domain method was found to be the most accurate. The time domain function does not use the Doppler equation but instead uses a method of pattern recognition in the time domain to determine absolute velocity using an algorithm known as quantitative color velocity imaging. No assumptions regarding the flow profile across the vessel are made, which should result in more precise results under different flow conditions. This study showed reasonable agreement between the ultrasound dilution and time domain techniques, but the Doppler-derived calculations routinely were overestimated. This technique has been validated by several other investigators and generally, a good correlation between time domain correlation and invasive measurements of volume flow has been found in both flow modals and in canine and human arteries. Unfortunately, this software has not routinely been available on most ultrasound systems during the past decade.22–25
Several studies comparing duplex Doppler-derived volume flow calculations in high-flow states have shown similar results. Licht et al. 26 performed a linear regression of 89 paired observations in 11 anesthetized swine and determined that the standard error was inappropriate for individual measurements. Zanen et al. 27 compared an ultrasound dilution technique with Doppler-derived volume flow calculations in a series of 38 dialysis AVFs. The duplex Doppler-derived volume flow calculations were obtained in a similar manner to what was described previously. The ultrasound dilution technique involves temporarily reversing the dialyzer lines and the blood pump speed set to 300 mL/min with ultrafiltration left on. Isotonic saline was infused for 4–5 sec without clamping off the arterial line. Arterial and venous dilution curves were derived from calibrated clamp-on sensors on the bloodlines and access flow was computer calculated using the average of three consecutive flow measurements. The authors found the duplex Doppler-derived calculations consistently overestimated volume flow compared with other techniques and that the overestimation worsened with increasing velocities.
In contrast, Vieli 28 found reasonably good correlation coefficients ranging from 0.80 to 0.95 using the same methodology but in adult cardiac applications. Error limits of less than 20% were consistently possible but required a skillful investigator, a high-quality instrument, and an appropriate subject and strongly cautioned the technique was only reliable when directing the ultrasound beam parallel to the flow, by measuring the true cross-sectional area instead of the diameter, and in the presence of well-behaved transluminal blood velocity distributions. This technique would of course be impossible in the evaluation of an AVF and most peripheral vascular applications.
Hoyt et al. 29 performed one perhaps of the most detailed studies of a modern duplex imager's ability to accurately assess volume flow. Five commercially available duplex imagers were used by 3 experienced blinded operators to obtain data using a flow phantom with flow rates ranging between 100 and 1,000 mL/min. Overall, they found exceptionally good inter- and intraobserver variability but strongly emphasized that “Users need adequate training and experience to perform multiple measurements and use appropriate techniques to minimize errors in flow measurement.” Several differences, however, with in vivo investigations become clear. The internal diameter of the tubing, while measured by the sonographer, was known, and most likely circular. They do not specify the elasticity of the tubing and, therefore, the transient variations in diameter are likely negligible if present at all. Most critical would be the more fully developed laminar flow and therefore, velocity vectors more likely to be parallel to the vessel wall. Lui et al. 30 conducted a careful study to assess the error and variability that results from human factors making subjective adjustments while measuring Doppler-derived peak velocity measurements. The positioning of the Doppler sample volume in the vessel, adjustment of the Doppler gain and angle, and choice of waveform display size were investigated. They used 4 experienced vascular technologists in a laboratory accredited by the Intersocietal Commission for Accreditation of Vascular Laboratories (now IAC) and avoided problems of patient variability by using in vitro pulsatile flow model with nonstenosed and 61% stenosed tubes. They found that Doppler angle, sample volume placement, and the Doppler gain were the most significant sources of error and variability and these errors were increased in the stenotic model.
Early work with the previously mentioned new ultrasound technology suggests it is possible to accurately measure the velocity of blood flow and would represent a significant advancement for hemodynamic research and diagnosis. This system design allows simultaneous interrogation of the same volume element from varied angles that overcomes the above Doppler angle ambiguity. Using this system, Ricci, et al. 31 reported results showing a velocity measurement accuracy of 0.5% and a precision of 7%. In another recent study, Richard et al. 32 used a 3-dimensional ultrasound method for measuring time-average volumetric blood flow under both steady-state and pulsatile flow conditions. These data showed very good correlation with gold standard techniques but, unlike other methods, is independent of Doppler angle, flow profile, and vessel geometry. This technology however, is not widely available and, if adopted, would likely require a complete revalidation of diagnostic criteria in nearly every application.
Given these numerous technical considerations, it is not surprising that the Transonic and duplex Doppler-derived flow data were not well correlated. The Transonic data are likely to be more accurate than the duplex Doppler data, which based on numerous previous observations and confirmed in this study, tended to significantly overestimate volume flow calculation. This finding does not mean that the duplex Doppler technique is not valuable, because it is clearly an indispensible tool for the evaluation of AVFs in addition to every vascular bed outside the chest. The purpose of this discussion is to highlight potential shortcomings in the volume flow calculations to allow careful and consistent acquisition of data, which has a clearly defined role if the evaluation of AVFs. In fact, duplex Doppler is endorsed by the National Kidney Foundation and is widely and routinely used to determine whether an AVF has matured, for surveillance of AVFs, and has proved its ability in predicting access failure. 33
Although this application traditionally has used a rather wide range in the threshold for defining normally functioning fistulas, serial measurements and a trending of volume flow rates over time have also emerged as an important interpretive criterion. 1 Because serial volume flow measurements are important, we would highlight the importance of use of meticulous consistency when using duplex ultrasound to calculate volume flow data for any application. We also would recommend these measurements are obtained at specifically notated segments so that serial measurements are obtained at precisely the same location. Additionally, with an end-to-side AVF configuration, measurements could also be obtained in the artery, which may be more circular in shape and flow significantly more laminar. With the understanding that a percentage of volume continues into the arterial circulation and not through the fistula, this location could prove more reproducible and therefore potentially superior for observing trends in serial measurements. Finally, duplex Doppler ultrasound allows evaluation of pertinent anatomy as well as identification of a stenosis at or within proximity to the fistula anastomosis and can also detect the presence of abscess, seroma, hematoma, pseudoaneurysm, and intraluminal thrombus.2,3
Thus, both Transonic and duplex Doppler, have their own clinical utility. The Transonic is best suited to determining the technical success of AVF surgery, detecting changes in flow secondary to the local application of pharmacological therapies (e.g., vasodilators) administered at the time of surgery, and identifying individuals at time of surgery who are at high risk for AVF maturation failure. Duplex Doppler is best suited to monitor AVF maturation over time and detect AVF dysfunction caused by developing stenosis or other complication. However, it is not advisable to compare data from the 2 methods in individual subjects. Nonetheless, it appears to be possible to predict a Transonic value from duplex Doppler data and vice versa in groups of subjects using a mathematical formula. However, this should be done with the caveat that the data may be inaccurate because of its variability, especially of duplex Doppler, and the low correlation between the 2 methods.
Conclusions
Although no animal model will exactly duplicate clinical AVF, the swine bilateral femoral AVF model was suitable for meeting the primary objective of this study. Our very small numbers do seriously limit drawing any strong conclusion. The Transonic data demonstrated a stronger relationship between time and resultant flow than duplex Doppler data, suggesting that Transonic measurements are more accurate than duplex Doppler measurements. Doppler data tended to overestimate volume flow measurements; however, it may be feasible to use a correction factor for Doppler data that more accurately estimates flow volume transcutaneous calculations and further study may be warranted.
Footnotes
Acknowledgments
Proteon Therapeutics funded the facility, study materials, and William B. Schroedter to perform the ultrasound studies. These data were supplied to the US Food and Drug Administration to explore the ability of ultrasound to follow changes in AVF blood volume flow over time.