
Abstract
P3a is an event-related potential that reflects the involuntary orienting of attention to salient stimuli. Abnormalities in P3a have been described in schizophrenia, but it is not known when they arise over the course of illness and whether they are progressive. Previous longitudinal studies of P3a have been inconclusive because of the heterogeneity in the diagnosis of psychotic patients, lack of follow-up data on controls, and relatively short follow-up periods. P3a, elicited by novel sounds, was assessed in 21 patients with first-episode schizophrenia and 36 healthy controls at baseline and reassessed in 14 patients and 23 controls after an average follow-up of six years. The longitudinal evaluation showed that the P3a amplitude was reduced in patients compared to controls at baseline but did not differ between groups at follow-up. Although P3a was reduced over the six-year interval in both groups, the reduction was greater in controls compared to patients. Longitudinal findings suggest that the P3a amplitude deficit is present at the onset of schizophrenia. Normalization of P3a amplitudes in patients at follow-up may reflect the premature aging effect on P3a at the onset of illness, a floor effect in P3a amplitudes of both groups at follow-up, or the reversal of the P3a deficit in patients over time. Interestingly, at baseline, the P3a amplitude in patients without follow-up data did not differ from controls and was greater than in patients with follow-up data. Baseline findings indicate a heterogeneity within the first-episode schizophrenia group.
Introduction
Abnormalities in attentional processes represent a cardinal feature in schizophrenia. 1 Event-related potentials (ERPs) are real-time measures of brain activity that can delineate neural dynamics of attention deficits in schizophrenia. P300 (P3) family of ERPs, characterized by positive voltage deflections peaking around 300 ms after the onset of infrequent salient stimuli, reflects attentional processes. 2 P3b has a parietocentral scalp distribution and reflects the voluntary allocation of attentional resources to task-relevant stimuli.3,4 P3a has a more anterior scalp distribution than P3b and reflects involuntary orienting of attention to task-irrelevant unexpected or distractor stimuli, which are either novel or otherwise salient.5–7
Several studies, but not all,8–16 reported P3a amplitude reduction in patients with chronic schizophrenia,10,17–27 in patients with first-episode psychosis28–36 and in subjects at ultra-high risk for psychosis (UHR).8,21,22,28,34,37 Few studies reported P3a latency prolongation in schizophrenia.12,24
It is not known whether P3a processes have a progressive deteriorating course after the onset of schizophrenia. To date, there are only four P3a studies in first-episode schizophrenia (FES), with two reporting reduced P3a28,32 and the other two reporting intact P3a.10,13 Cross-sectional studies investigating P3a responses in patients at different stages of schizophrenia yielded mixed results. Some studies reported the emergence or progression of P3a deficit over the course of illness,10,12,22 but some others reported no difference in P3a deficit between UHR subjects and FES patients or young schizophrenia patients.21,28
To date, there are only two longitudinal P3a studies in psychosis and they reported reduced P3a, with no progressive reduction at 19-month 31 and 12-month follow-ups. 33 However, they have been inconclusive because of the heterogeneity in the diagnosis of patients (schizophrenia-spectrum, bipolar disorder), lack of follow-up data on controls, and relatively short follow-up periods to detect progressive changes.
Accordingly, this study examined auditory P3a in FES patients and healthy controls (HCs) longitudinally, with a follow-up period of six years, to track changes in automatic attentional processes after the onset of illness. The longitudinal course of P3a, with an adequate follow-up period, has never been evaluated in FES patients compared to HCs. Several studies,38–42 but not all, 43 reported a reduction in auditory P3a amplitude with normal aging. If we find a greater P3a reduction in patients compared to controls over time, this will suggest a deteriorating course in automatic attentional processes in schizophrenia.
Methods
Participants
The present study comprised a subsample of participants from our previous study, reporting on the P3b and P3a responses in acutely ill FES patients. 10 The baseline sample consisted of 21 patients with FES and 36 HCs. Fourteen patients and 23 HCs were re-evaluated after an average follow-up of six years. Seven patients and 13 HCs had baseline data only because of unknown address, refusal to participate, or being unavailable (moved to another city, long working hours) at follow-up. Patients were during the post-acute phase of their first psychotic episode (Being rated ≤3 on all items of the Brief Psychiatric Rating Scale-Expanded (BPRS)-positive subscale for at least two weeks). The mean time elapsed from admission for the acute phase of the first episode to the baseline evaluation during the post-acute phase was 2.6 ± 2.4 and 3.3 ± 2.6 months for the baseline and longitudinal samples, respectively.
Patients were diagnosed with schizophrenia at a consensus meeting incorporating clinical, and Structured Clinical Interview for DSM-IV (SCID) data.44–46 SCID was repeated to confirm the schizophrenia diagnosis at the sixth month of follow-up. Duration of untreated psychosis (DUP) was calculated as the time interval between the onset of continuous positive symptoms and treatment.
Psychopathology was evaluated with BPRS, 47 Scale for the Assessment of Positive Symptoms (SAPS), 48 and Scale for the Assessment of Negative Symptoms (SANS) 49 at the first admission, baseline and follow-up. Global Assessment of Functioning (GAF) 50 scores of patients were determined at the first admission when they were acutely ill and at the first year of disease.
Within the patients of the baseline sample, 3 were receiving typical, 1 was receiving both typical and atypical (quetiapine), and 17 were receiving atypical antipsychotics either risperidone (n = 7), olanzapine (n = 7) or quetiapine (n = 3). Within the patients of the longitudinal sample, 2 were receiving typical and 12 were receiving atypical antipsychotics either risperidone (n = 5), olanzapine (n = 4), or quetiapine (n = 3) at baseline. At follow-up, all patients were receiving atypical antipsychotics either risperidone (n = 4), olanzapine (n = 4), aripiprazole (n = 4), quetiapine (n = 1) or amisulpride (n = 1). One patient was receiving haloperidol 5 mg/day in addition to aripiprazole. In seven patients the antipsychotic received at follow-up was the same as the one received at baseline. During both evaluations, patients were on the same antipsychotic medication for at least 15 days and were clinically stable.
Medication adherence was inquired at monthly visits in the first two years and bimonthly thereafter. Patients who used less medication than prescribed or completely skipped the medication for 10 consecutive days were regarded as nonadherent. All patients were adherent to medication in the majority of follow-up. The decision about the adherence status was based on the patient's and/or relatives’ reports.
All but one patient met the remission criteria proposed by Andreasen et al 51 in the period between the two evaluations. Four patients kept the remission status throughout the follow-up period. The remaining nine patients experienced the first relapse on average at the 21st month. During the follow-up period, one patient had two and two patients had three relapses. Relapse was defined using the criteria described by Nuechterlein et al. 52
Controls were screened by using the Structured Clinical Interview for DSM-III-R-Non-Patient Edition. Controls having a first-degree relative with a psychotic disorder were excluded. There was one left-handed participant in the control group. All participants were excluded for head trauma, neurological disorders or medical illnesses compromising the central nervous system. The study was approved by the Ethics Committee of Istanbul University, Istanbul Faculty of Medicine.
ERP Testing
Auditory ERPs were elicited using a novelty paradigm consisting of standard (1000 Hz), deviant (1500 Hz) and novel stimuli with probabilities of 0.6, 0.2, and 0.2, respectively. Participants were not required to respond actively to any stimuli. Novel stimuli were a collection of environmental sound samples. Eighteen different novel sounds were presented three or four times throughout the recording. Participants were not informed about the occurrence of the novel stimuli. All stimuli were 80 dB and 1000 ms in duration. Three hundred stimuli were presented binaurally in a random series with an interstimulus interval (ISI) of 2 s.
ERP Recording
The electroencephalogram (EEG) was recorded from 11 Ag-AgCl electrodes at F3, Fz, F4, T3, C3, Cz, C4, T4, P3, Pz, P4 (10-20 system), referenced to linked earlobes. The electro-oculogram (EOG) was recorded by two electrodes, placed just below the infraorbital ridge and above the eyebrow of the right eye. Electrode impedances were below 10 kΩ. The impedance of the earlobe electrodes was matched within 1 kΩ. The EEG was recorded with a band-pass filter of 0.5-70 Hz and digitized with a sampling rate of 256 Hz. EEG epochs were 1500 ms in length including 500 ms prestimulus baseline.
Data Analysis
The trials in which the EEG/EOG voltages exceeded ±75 μV were automatically excluded. The remaining trials were inspected visually for additional minor artifacts. Novel trials were baseline corrected using the 100 ms prestimulus baseline. ERP averages were digitally low-pass filtered at 30 Hz. Individual ERP averages were based on a minimum of 20 trials. P3a was identified as the most positive peak between 220-400 ms after stimulus onset. Peak amplitudes and latencies were measured.
Statistical Analysis
Demographic and inter-EEG interval differences between groups were evaluated using the Mann-Whitney U-test or χ2-test. Changes in clinical scales and chlorpromazine (CPZ) equivalent doses53,54 of patients from baseline to follow-up were determined by the Wilcoxon signed-rank test.
P3a data were tested for normality in each group at each time point using the Kolmogorov-Smirnov one-sample test (all P > .05). P3a amplitudes and latencies were analyzed with two main repeated measures ANOVAs. In the first analysis, the between-subjects factor was group (patients vs controls of the baseline sample). The within-subjects factors were anteroposterior region (frontal: F3, Fz, F4; central: C3, Cz, C4; and parietal: P3, Pz, P4) and laterality (left: F3, C3, P3; midline: Fz, Cz, Pz; and right: F4, C4, P4). In the second analysis, longitudinal changes in P3a were assessed. The between-subjects factor was group (patients vs controls of the longitudinal sample). Besides the anteroposterior region and laterality, the within-subjects factors included time (baseline vs follow-up). Greenhouse-Geisser correction was applied when factors had more than two levels, with only the corrected probability values reported. Difference contrasts were used to assess the significant main and/or interaction effects.
Percent change in P3a amplitude and latency (percent change = (follow-up − baseline P3a)/baseline P3a×100) were correlated with inter-EEG interval separately for patients and controls using Pearson correlation analysis. In addition, P3a amplitude and latency were correlated with age separately for controls and patients for baseline and follow-up.
Because previous studies reported shorter DUP was related to better illness outcomes,46,55 we examined correlations of DUP with P3a amplitude and latency separately for baseline and follow-up and the percent change in P3a amplitude and latency in patients using Spearman correlation analysis. The correlation analyses were performed on P3a at midline channels.
Results
Demographic and Clinical Data
Baseline Sample
At baseline, patients were not different from controls in education level at the first admission, age and sex (Table 1).
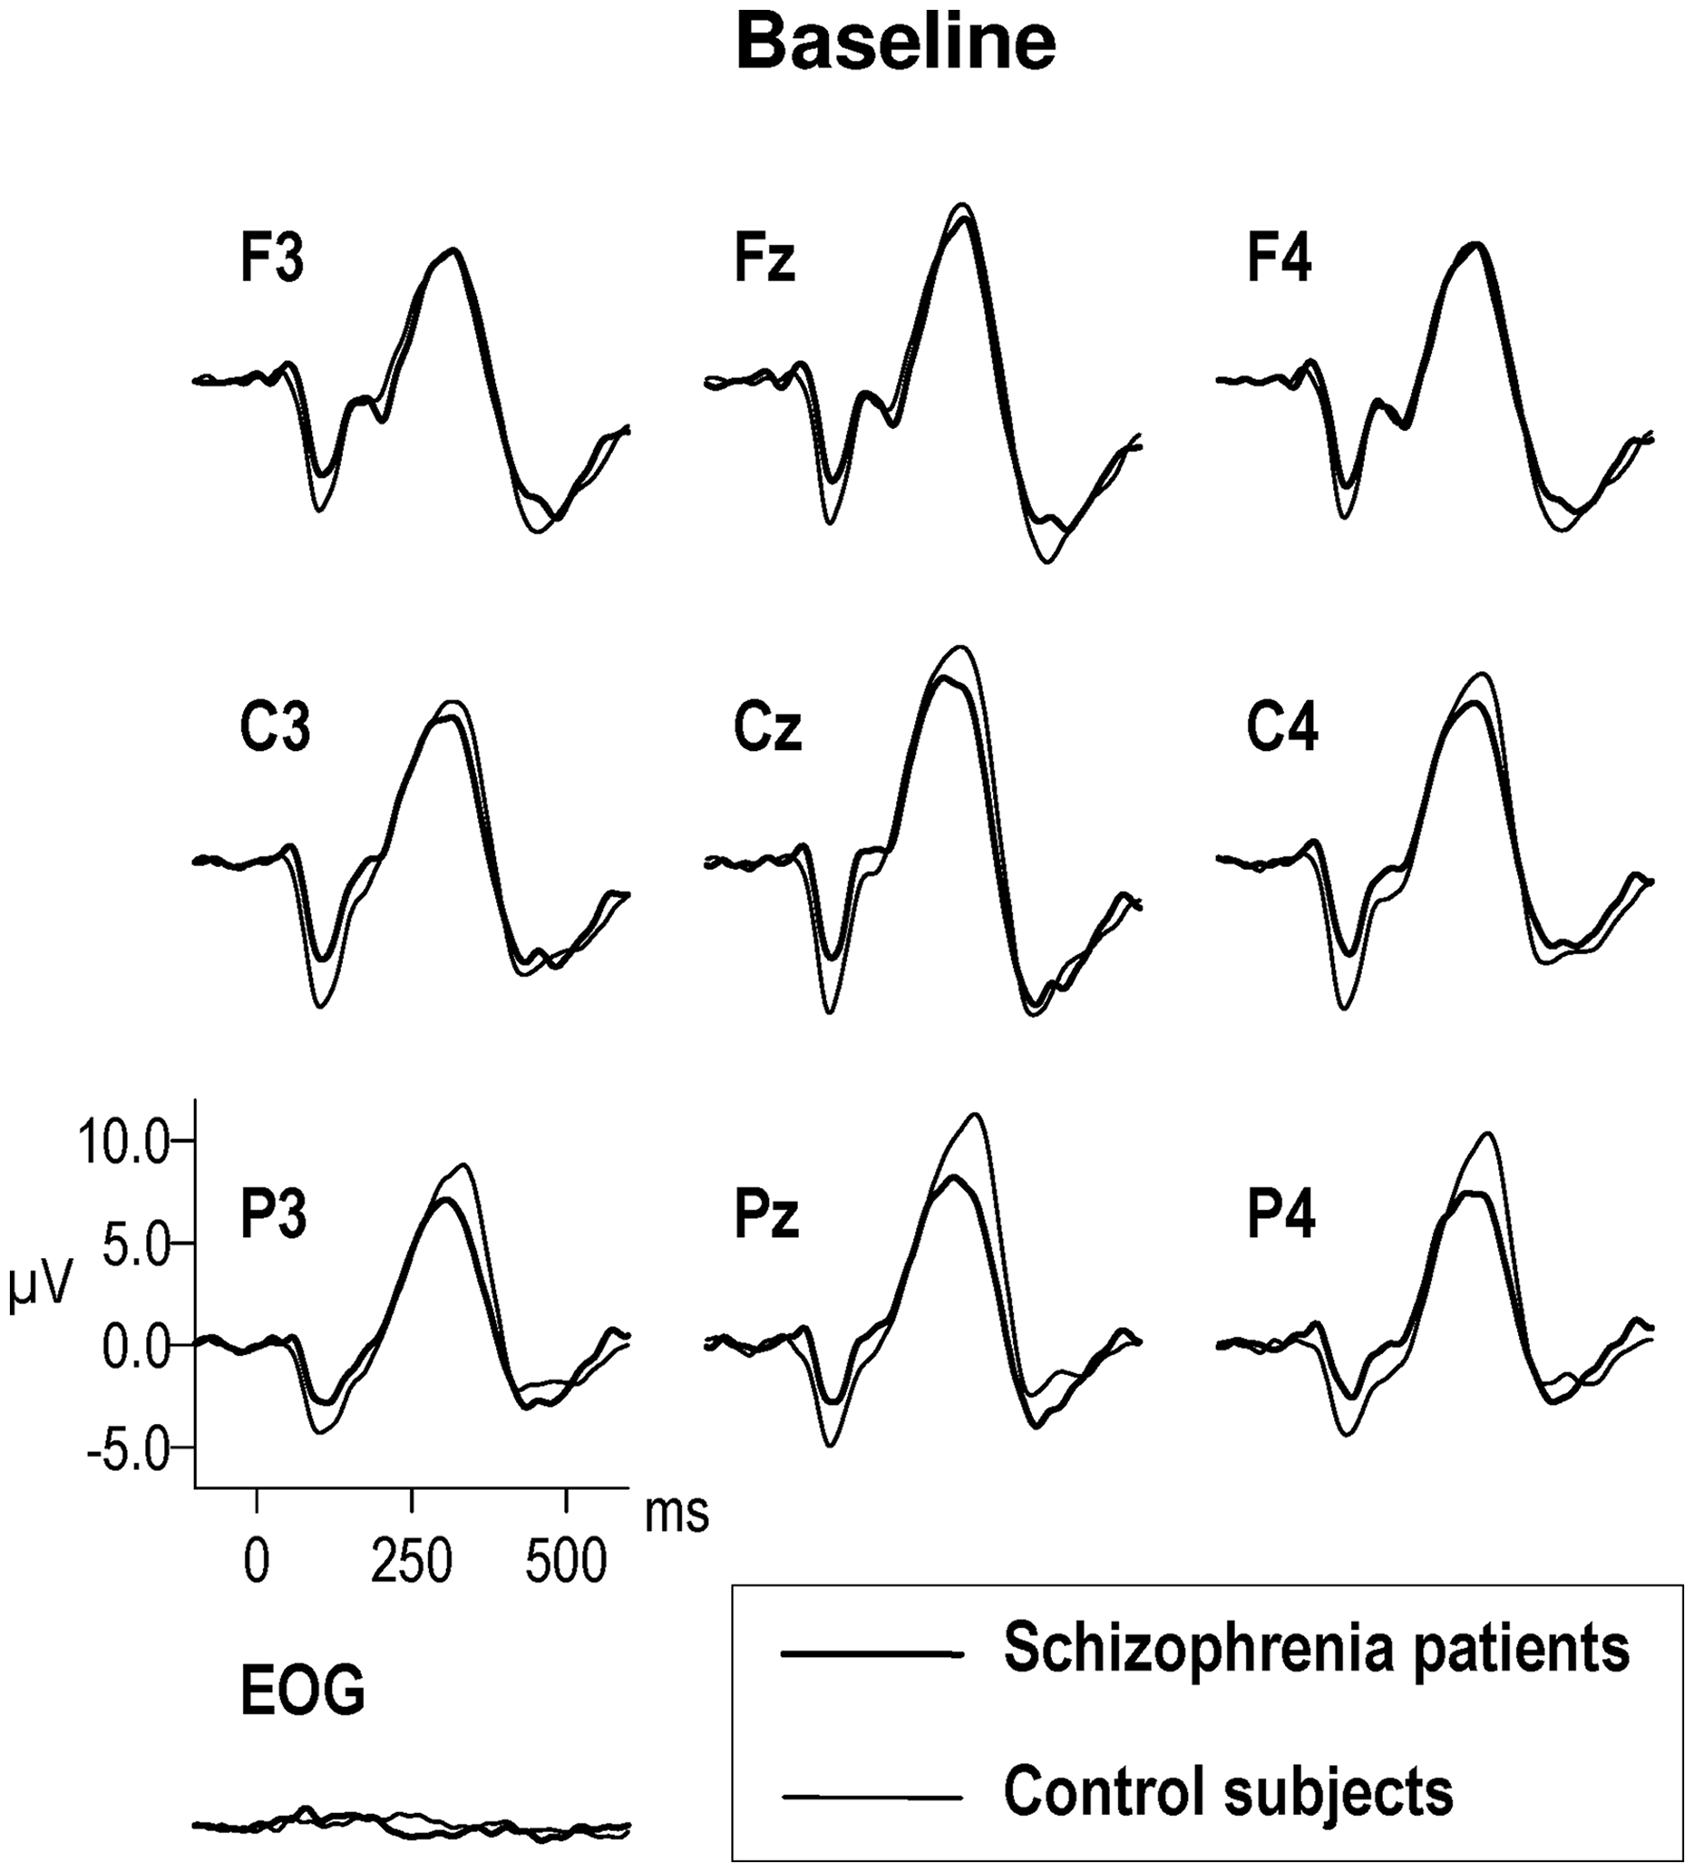
Group Demographic Characteristics and Clinical Scales of the Patients.
HC, healthy control; FES, first-episode schizophrenia; BPRS, Brief Psychiatric Rating Scale-Expanded; SANS, Scale for the Asssessment of Negative Symptoms; SAPS, Scale for the Assessment of Positive Symptoms; GAF, Global Assessment of Functioning.
Data are given as mean ± SD.
*Data at the first admission were reported. **Comparison between baseline and follow-up data of longitudinal FES group. ***GAF scores of two patients at the first admission and three patients at the first year were missing in the baseline sample. GAF scores of one patient at the first admission and two patients at the first year were missing in the longitudinal sample.
Longitudinal Sample
Patients were not different from controls in age at baseline and follow-up, education level at the first admission and inter-EEG interval. Sex was different between groups (P = .020) (Table 1) and therefore included as covariate in group comparisons.
The clinical scales and CPZ equivalent doses of patients were not different between baseline and follow-up. The GAF scores at the end of the first year were higher than 60 in all but two patients (whose GAF scores were 55 and 60) and were higher compared to the first admission (P < .001).
ERP Data
Baseline Sample
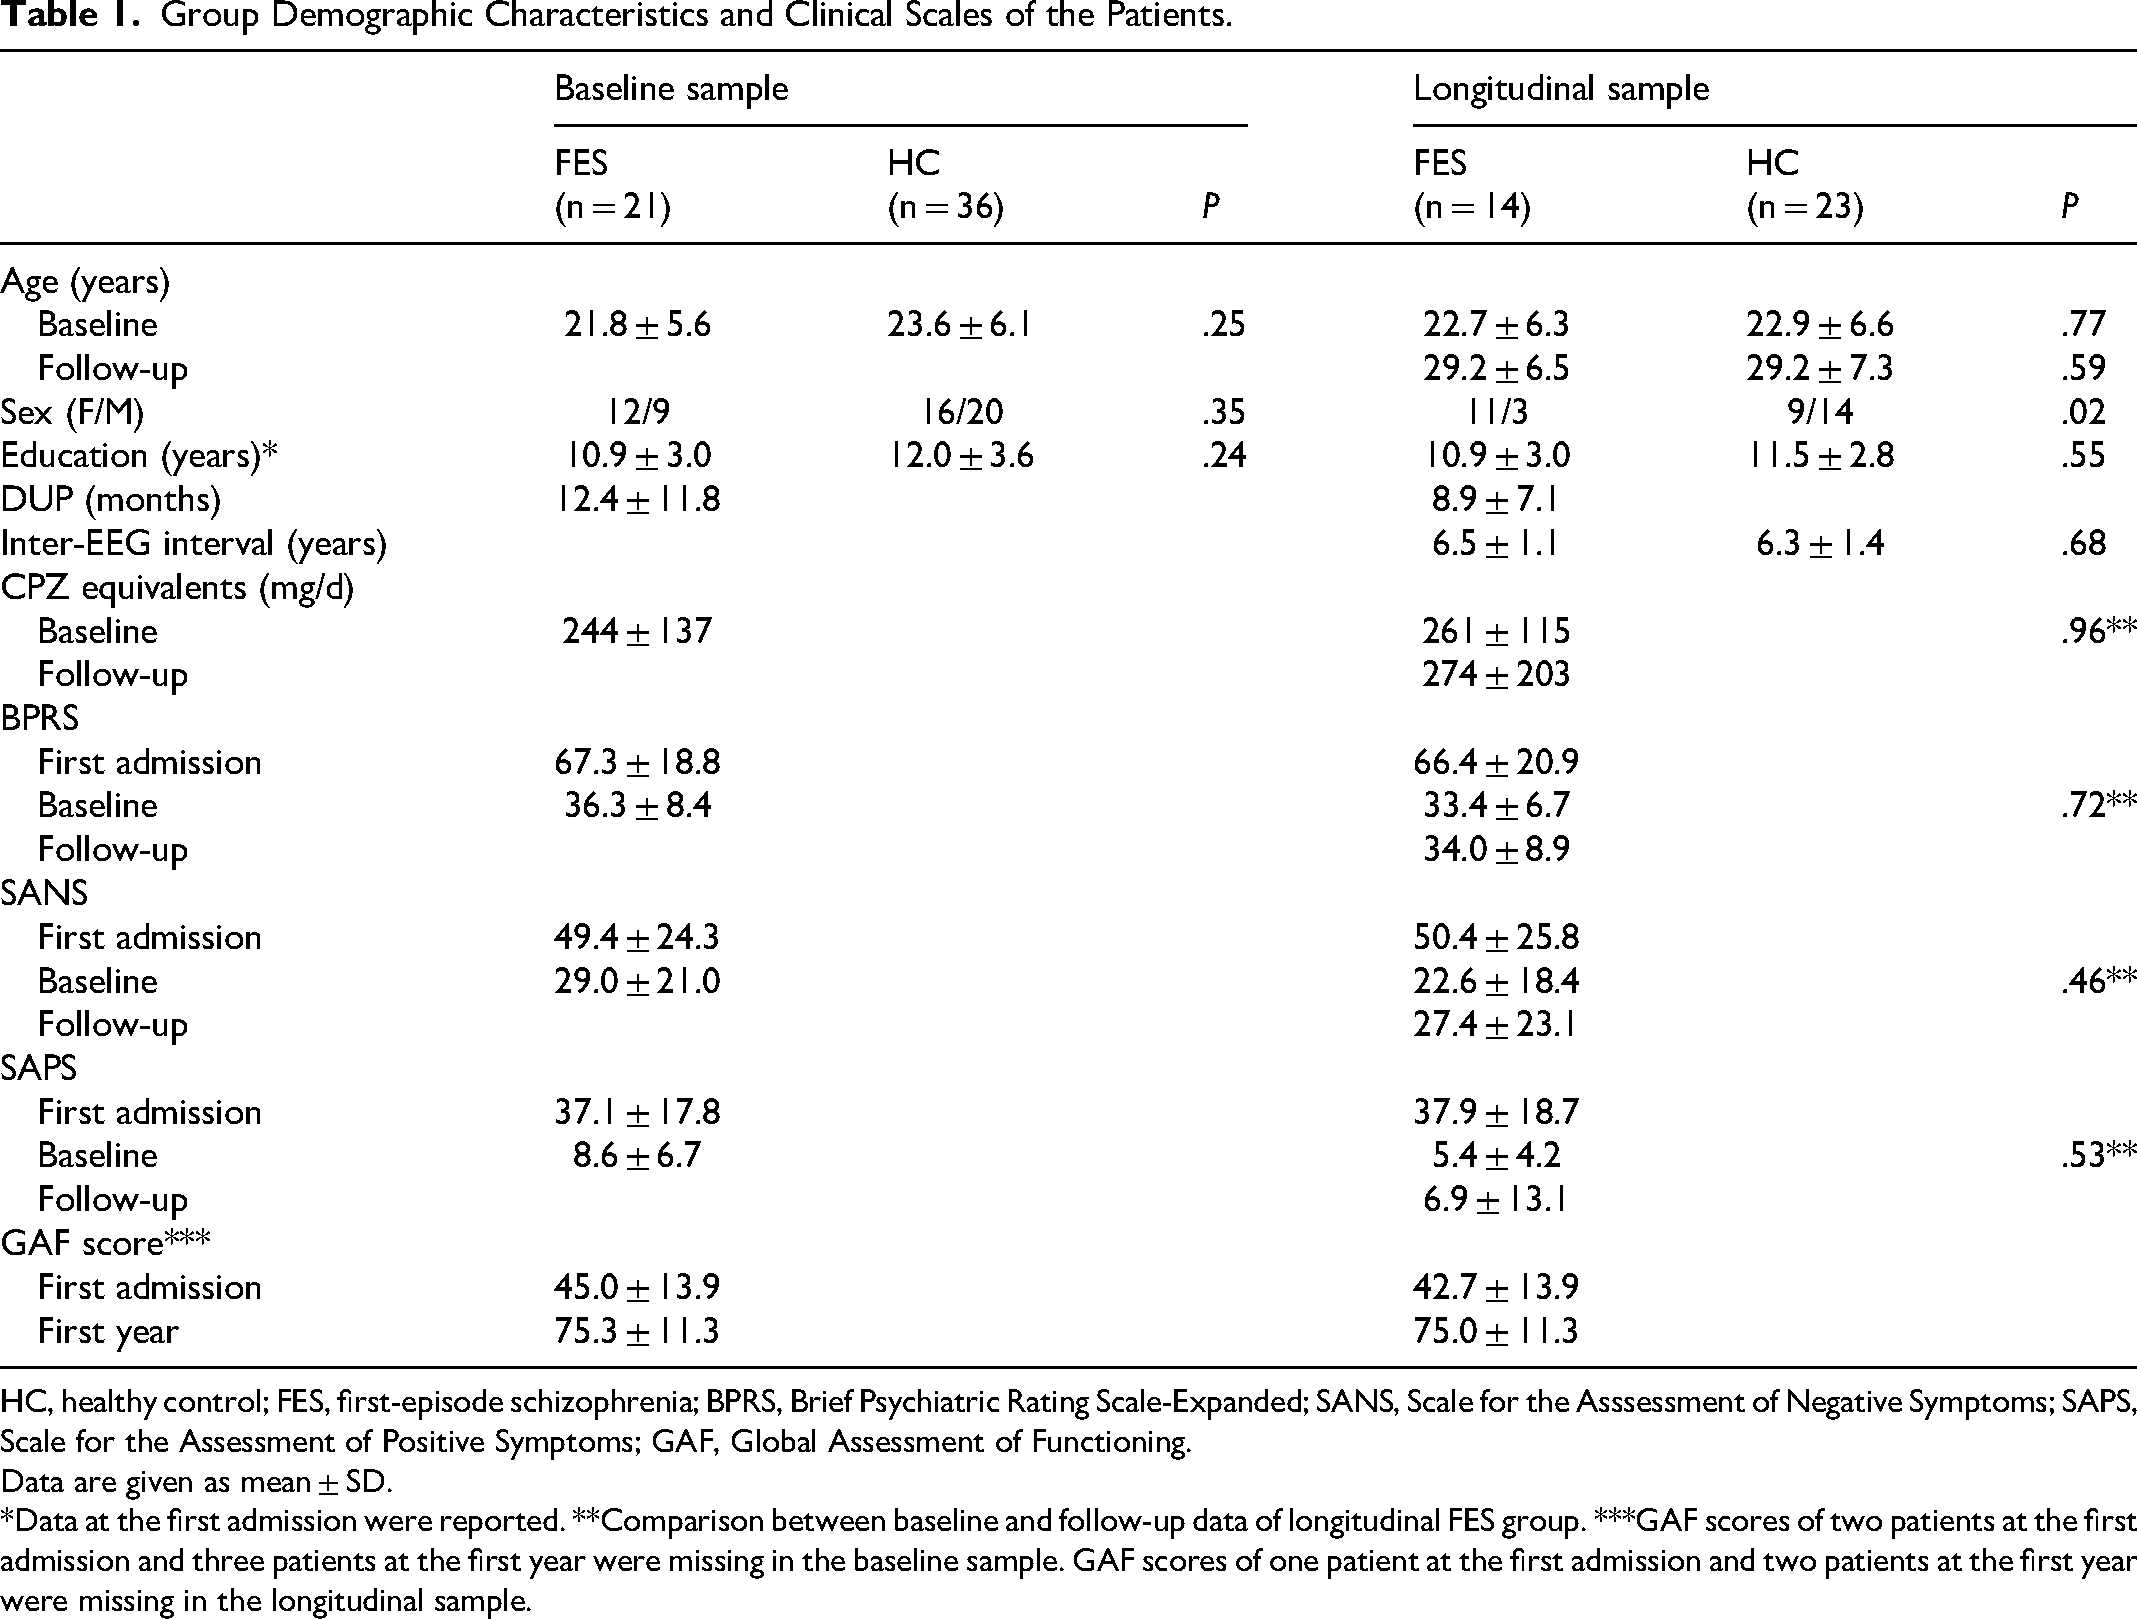
Overall P3a had a centroparietal distribution [F(2110) = 14.32, P < .001]. P3a amplitude did not differ between patients and controls (P = .17) (Figure 1, Table 2). P3a latency was longer in parietal region compared to frontal and central regions [F(2110) = 14.25, P < .001]. P3a latency did not differ between groups.
Event-Related Potential Responses to Novel Stimuli at Baseline in the Baseline Sample of Patients with Schizophrenia (n = 21) and Control Subjects (n = 36).
Means for P3a Amplitude and Latency.
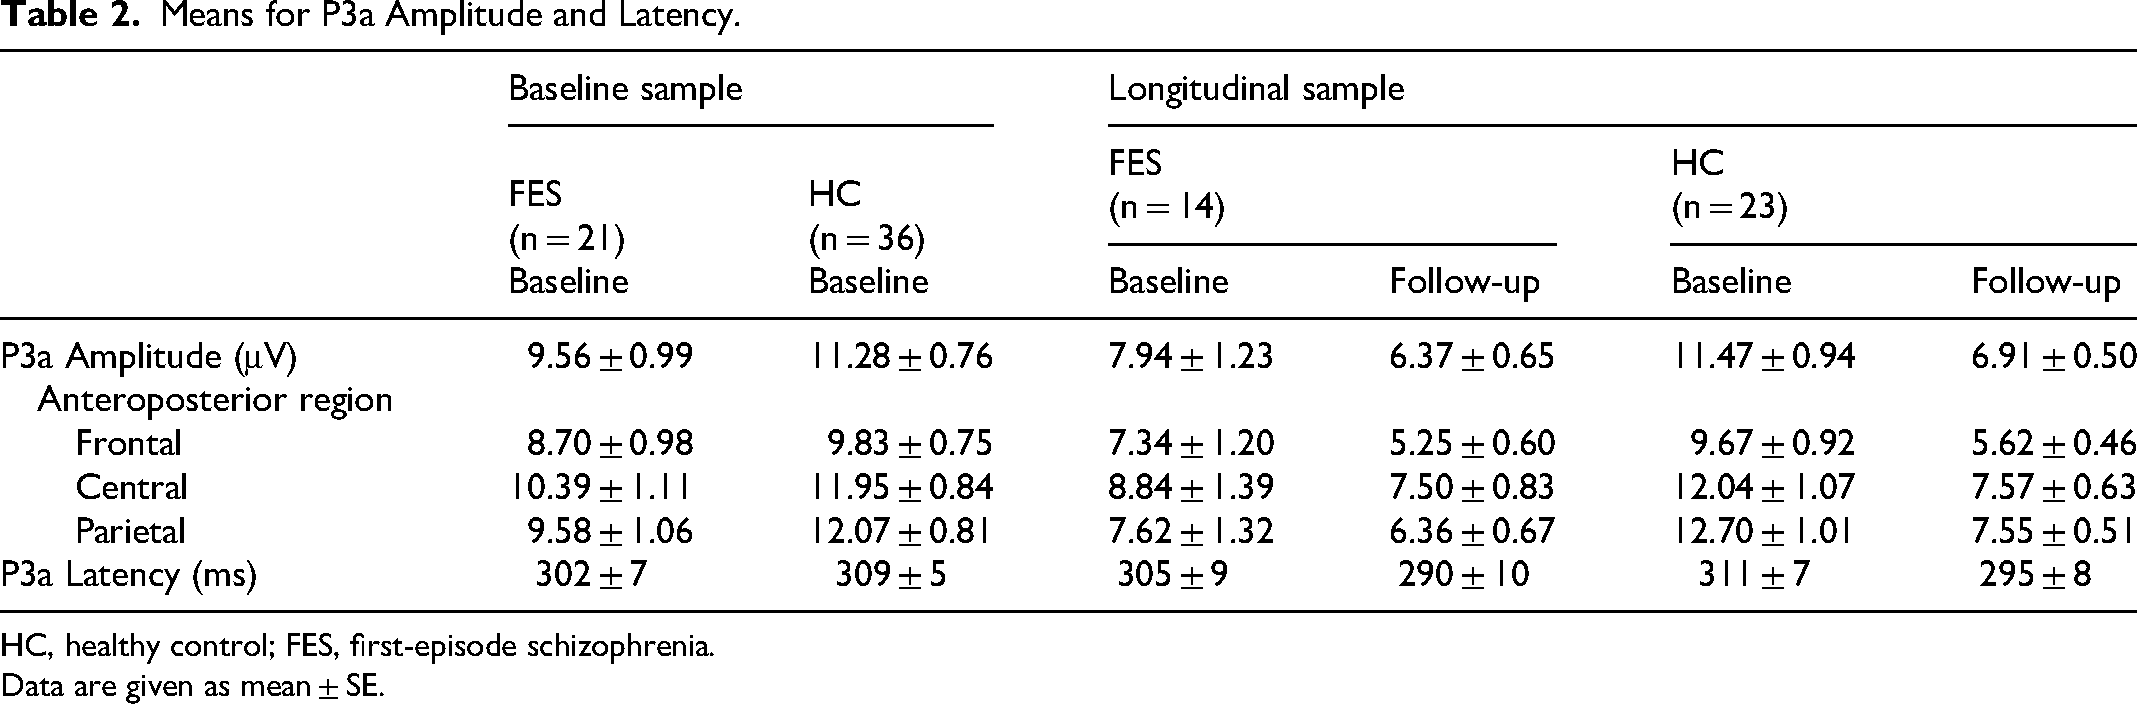
HC, healthy control; FES, first-episode schizophrenia.
Data are given as mean ± SE.
Longitudinal Sample
Overall P3a had a centroparietal distribution [F(2,68) = 5.70, P = .009]. P3a amplitude tended to reduce in patients compared to controls [F(1,34) = 3.57, P = .067] (Figure 2, Table 2). Group by time interaction was significant [F(1,34) = 4.73, P = .037]. Follow-up repeated measures ANOVAs revealed that over the six-year interval, P3a amplitudes were significantly reduced in controls [F(1,22) = 27.29, P < .001] but only tended to reduce in patients [F(1,13) = 4.61, P = .051]. P3a amplitudes between groups were also analyzed separately for baseline and follow-up. P3a amplitude was reduced in patients compared to controls at baseline [F(1,34) = 4.89, P = .034], but did not differ between groups at follow-up [F(1,34) = 0.41, P = .53].
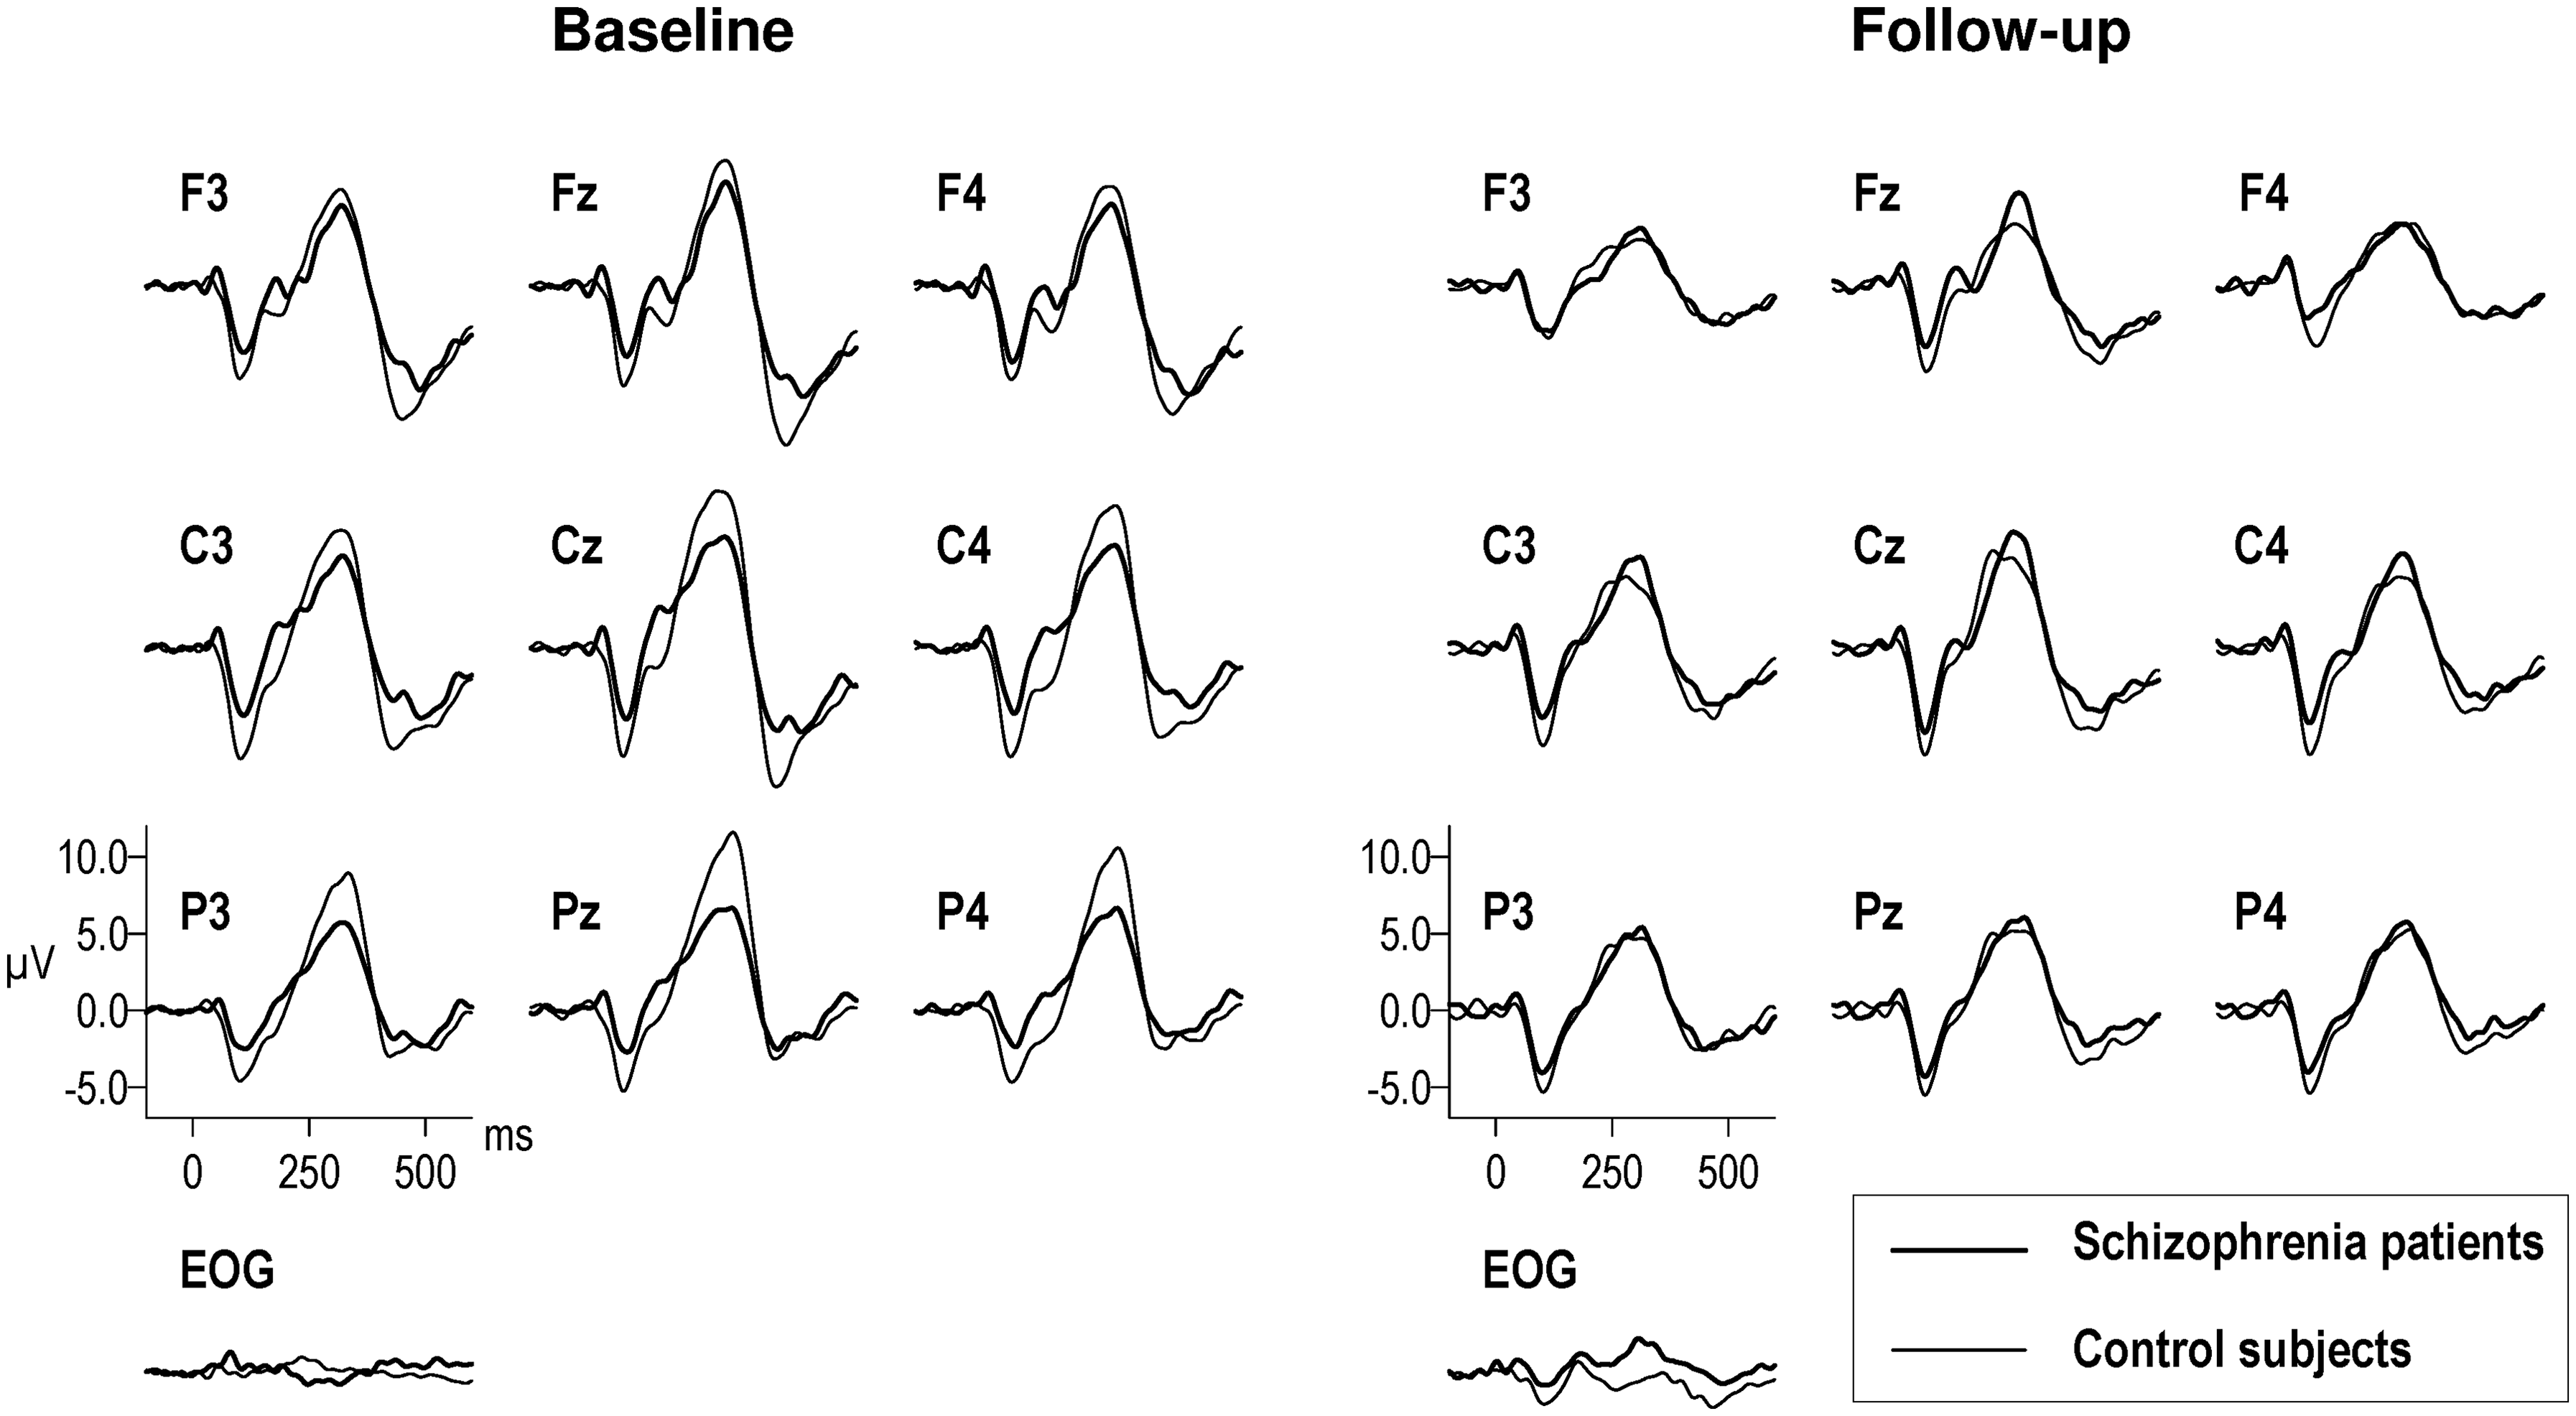
Event-Related Potential Responses to Novel Stimuli at Baseline and Follow-up in the Longitudinal Sample of Patients with Schizophrenia (n = 14) and Control Subjects (n = 23).
Group by anteroposterior region interaction was significant [F(2,68) = 3.63 P = .042]. Post-hoc contrasts demonstrated that this effect originated from the parietal region (parietal vs frontal and central: [F(1,34) = 5.29, P = .028]; frontal versus central: [F(1,34) = 0.25, P = .62]). Data were normalized using the root mean square method 56 and statistically reanalyzed to assess scalp distribution of P3a independent of overall amplitude differences between groups. Group by anteroposterior region interaction was significant at trend level on the normalized data [F(2,68) = 3.00, P = .064]. Results of post-hoc contrasts were similar to those obtained with the original data (parietal vs frontal and central: [F(1,34) = 4.67, P = .038]; frontal versus central: [F(1,34) = 0.01, P = .92]). Additionally, the group effect was assessed separately for frontal, central and parietal regions. Although P3a amplitudes were reduced in patients compared to controls in all anteroposterior regions, the group effect was significant only in the parietal region [F(1,34) = 7.13, P = .012].
An additional repeated measures ANOVA was conducted to determine whether the change in P3a amplitude over time differed between patients, who received the same antipsychotic at baseline and follow-up (n = 7) and those who did not (n = 7). DUP, age at baseline, clinical scales at baseline and follow-up, inter-EEG interval and CPZ equivalent doses at baseline and follow-up did not differ between groups. Sex was different at trend level (P = .078) between groups and therefore included as covariate. No significant group effect (P = .42) or group by time interaction (P = .54) was observed.
For P3a latency, group and time effects and group by time interaction were not significant.
Baseline Comparison of Patients With and Without Follow-up Data
We conducted a repeated measures ANOVA to assess the difference in P3a amplitude at baseline between patients with follow-up data (FU, n = 14), patients without follow-up data (non-FU, n = 7) and controls (n = 36). As the P3a amplitude at baseline did not differ between controls with (n = 23) and without follow-up data (n = 13) (P = .99), we combined the control groups for analysis. Groups did not differ in age and education level, but they differed in sex (P = .014). The FU group included mostly female patients compared to non-FU (P = .005) and control groups (P = .030). Thereby, sex was used as covariate. P3a amplitude differed between groups [F(2,53) = 3.72, P = .031] (Mean ± SE amplitudes, FU: 7.74 ± 1.23; non-FU: 12.76 ± 1.72; HC: 11.36 ± 0.74). Post-hoc tests showed that the P3a amplitude at baseline was smaller in the FU group compared to the non-FU group (F(1,18) = 5.32, P = .033) and the control group (F(1,47) = 6.00, P = .018). The non-FU group did not differ from the control group (P = .64).
BPRS, SANS, SAPS and GAF scores at the first admission, GAF score at the first year, CPZ equivalent doses at baseline and DUP did not differ between FU and non-FU groups. But, BPRS (P = .044), SANS (P = .044) and SAPS scores (P = .004) at baseline were higher in non-FU group compared to FU group. Repeated measures ANOVAs were conducted to determine whether the changes in psychopathology from admission to baseline differed between the patient groups. Only the change in SANS score tended to differ between groups [F(1,19) = 4.32, P = .051]. From admission to baseline, SANS scores reduced in FU group but did not change in non-FU group.
Correlations
Percent changes in P3a amplitude and latency were not correlated with inter-EEG interval in either controls or patients. P3a amplitude and latency at baseline or follow-up were not correlated with age in either controls or patients.
P3a amplitude and latency at baseline and follow-up and the percent changes in P3a amplitude and latency were not correlated with DUP in patients.
Discussion
To our knowledge, this is the first longitudinal auditory P3a study in patients with FES and HCs with a relatively long follow-up period of six years to assess progressive changes. Longitudinal data showed that the P3a amplitude was reduced in patients compared to controls at baseline but was not different between groups at follow-up. Although the P3a was reduced over the six-year interval in both groups, the reduction was greater in controls compared to patients.
Our patients were clinically stable during both evaluations, and their scores on clinical scales did not differ between baseline and follow-up. Also, the change in P3a over time did not differ between patients who received the same antipsychotic at baseline and follow-up and those who did not. Therefore, longitudinal data were not confounded by the clinical state of the patients or the switching of patients to another antipsychotic at follow-up.
Our longitudinal findings can be explained in three ways. First, a substantial reduction in P3a might have already occurred, bringing the amplitudes close to their biological minimum by the onset of schizophrenia; therefore, further reduction would be minimal during the follow-up period. The lack of P3a difference between patients and controls at follow-up might represent a floor effect in the amplitudes of both groups. Second, the aging effect on P3a reduction might have been premature in first-episode patients. In line with this suggestion, imaging studies reported that brain aging was accelerated during the early years of the onset of schizophrenia but decreased over time 57 and reached about a normal rate five years after illness onset. 58 Third, the deficit in P3a processes, evident at the onset of schizophrenia, might have had a reversible course, resulting in normalization of amplitudes at follow-up. In line with this suggestion, Torgalsboen et al 59 reported greater improvement in cognitive functioning in FES patients compared to controls at the 6-year and 10-year follow-ups, and there are neuroimaging studies indicating a reversible course in brain volume abnormalities, associated with good illness outcome in FES.60,61 Our patients also seem to represent a cohort with good outcome since 70% of them had only one or no relapse throughout the follow-up period and they had high functioning and good adherence to treatment. Normalization of P3a processes might be related to long-term exposure to antipsychotic medications. Other than the two patients who were receiving typical antipsychotics at baseline, all patients were receiving atypical antipsychotics at baseline and follow-up. To our knowledge, the effects of antipsychotics on P3a have not been studied. However, atypical antipsychotics were shown to have neurotrophic, 62 neurogenic 63 and neuroprotective effects. 64 Besides, some studies reported that atypical antipsychotics improved selective attention-related P3b ERP,65–67 cognitive functions68,69 and had beneficial effects on brain volume changes in schizophrenia.70–73
Interestingly, patients in the baseline sample did not show P3a amplitude deficit at baseline, in contrast to patients in the longitudinal sample. There are only four P3a studies in FES; two of them, in line with our findings on the baseline sample, reported intact P3a10,13 and the other two, in line with our findings on the longitudinal sample, reported reduced P3a.28,32 Further analyses of our baseline data revealed that the P3a amplitude in non-FU patients did not differ from controls and was greater than in FU patients. Interestingly, psychopathology was also greater in non-FU compared to FU patients. Mathalon et al 23 reported that the P3a amplitude within patients tracked psychopathology, decreasing with symptom exacerbations. We suggest that there might be other factors than psychopathology influencing P3a in schizophrenia. There are two studies with conflicting findings that compared P3a at baseline in FU and non-FU patients with psychosis; one reported smaller amplitudes in FU patients 33 and the other in non-FU patients. 31 Kaur et al 31 reported that the group, showing smaller P3a amplitude, consisted of more patients with schizophrenia compared with bipolar disorder, and had lower cognitive functioning and IQ. Our study consisted of only patients with schizophrenia and did not evaluate cognition and IQ. Importantly, due to small sample sizes of the FU and non-FU patient groups, our findings should be interpreted with caution. Yet, our findings suggest a heterogeneity within the FES group. This fact can be the reason for the controversial findings of previous studies on P3a in schizophrenia. Future studies can examine patient characteristics related to P3a deficit in FES.
In longitudinal evaluation, the overall P3a reduction in patients was greater in the parietal region compared to the central and frontal regions. P3a has frontal and posterior generators. 6 Lesion studies demonstrated that the prefrontal cortex and hippocampus contributed to the frontal aspect of auditory P3a, and the temporoparietal junction contributed to its posterior aspect.74–76 By electromagnetic tomography, Barry et al 77 showed that the cortical sources of P3a were in the frontal and parietal lobes. In light of these studies, our findings suggest that schizophrenia disease affects particularly the posterior aspect of P3a.
The present study has several limitations. First, the sample size for the FU patients was small. Second, the duration of stimuli was longer than in other studies. Long-duration stimuli lead to stimulus-off potentials, but this possible confound was mitigated by our ISI of 2 s. Third, in contrast to FU patients, P3a was normal at baseline in non-FU patients. Therefore, the evolution of P3a over time in non-FU patients may also differ from FU patients. Fourth, sex was different between patients and controls in the longitudinal sample. In the baseline sample, the P3a amplitude did not differ between sexes in patients (P = .87) and controls (P = .41). Also, in the longitudinal sample, the P3a amplitude and its change from baseline to follow-up did not differ between sexes in patients (P = .22, P = .82) and controls (P = .40, P = .77). Schall et al 15 also reported no difference in P3a between sexes in both schizophrenia patients and controls. Additionally, we used sex as covariate when the groups differ in sex to control its effects on P3a.
In conclusion, P3a amplitude deficit was present at the onset of schizophrenia in patients who were followed longitudinally. Normalization of P3a amplitudes in patients at follow-up may reflect the premature aging effect on P3a at the onset of illness, a floor effect in P3a amplitudes of both groups or the reversal of the P3a deficit in patients over time.
Footnotes
Acknowledgments
We thank the patients and the healthy volunteers for their participation.
Ethical Considerations
The study was approved by the Ethics Committee of Istanbul University, Istanbul Faculty of Medicine (No. 2006/1844) on 10/11/2006. All participants gave written informed consent before participating in the study.
Author Contributions
Müge Devrim-Üçok: conceptualization, formal analysis, funding acquisition, investigation, methodology, project administration, resources, visualization, writing – original draft, review & editing. Betül Kıvanç-İnanöz: formal analysis, writing – review & editing. Yasemin Keskin-Ergen: investigation, methodology, writing – review & editing. Alp Üçok: conceptualization, investigation, methodology, resources, writing – review & editing.
Funding
The authors disclosed receipt of the following financial support for the research, authorship, and/or publication of this article: The present study was supported by the Istanbul University Research Projects Unit (Project Number: BYP-1897).
Declaration of Conflicting Interests
The authors declared no potential conflicts of interest with respect to the research, authorship, and/or publication of this article.
Data Availability Statement
All data generated and analysed during this study are included in this article. Further inquiries can be directed to the corresponding author.