
Abstract
Single-cell RNA sequencing (scRNA-seq) techniques for measuring gene expression in individual cells have developed rapidly. Recently, the identification of cell types in scRNA-seq analysis has been accomplished using deep learning. Most methods utilize a dataset containing cell-type labels to train the model and then apply this model to other datasets. However, the integration of multiple datasets leads to unexpected batch effects caused by differences in laboratories, experimenters, and sequencing techniques. As the batch effect interrupts the biological signal of interest, an effective batch correction method is essential. In this article, we present scUDAS, a cell-type prediction model for scRNA-seq that utilizes unsupervised domain adaptation and semi-supervised learning (SSL) to reduce the differences in distributions between datasets. First, we pretrain the proposed model based on the source dataset, which contained cell-type information. Subsequently, scUDAS is trained on the target dataset by leveraging adversarial training to align the distribution of the target dataset with that of the source dataset. Finally, scUDAS was retrained to improve its performance through SSL by leveraging both the source and target datasets with consistency regularization. scUDAS outperformed the other deep learning-based batch correction models by appropriately removing the batch effect. scUDAS is publicly available at https://github.com/cbi-bioinfo/scUDAS.
Keywords
INTRODUCTION
Recently, single-cell RNA sequencing (scRNA-seq) techniques (Gierahn et al., 2017; Picelli et al., 2013; Zheng et al., 2017; Hashimshony et al., 2016) have developed rapidly, enabling researchers to study the transcriptome heterogeneity in various tissues and diseases at the individual cell level. The critical step in scRNA-seq analysis is the identification of cell types (Regev et al., 2017; Trapnell, 2015), which typically clusters the cells and then annotates them using marker genes for each cell cluster (Soneson and Robinson, 2018). However, this approach requires the identification of cluster-specific marker genes and their comparison with known marker genes, which is a demanding and time-consuming task (Abdelaal et al., 2019).
With the growing availability of scRNA-seq datasets containing cell-type annotations, machine learning techniques have been developed to automate and improve the accuracy of cell type identification in new datasets. Traditionally, unsupervised learning methods—such as principal component analysis (PCA) and clustering algorithms—have been employed to identify marker genes for each cell type using reference datasets and to annotate subgroups of cells. For example, RaceID (Grün et al., 2015) distinguished different cell types in complex mixtures using k-means clustering, while shared nearest neighbor (SNN)-Clip (Xu and Su, 2015) clustered single-cell transcriptomes through SNN graph construction. To reveal hierarchical biological structures, DendroSplit (Zhang et al., 2018) proposed an interpretable clustering framework based on a separation score with feature selection. Other approaches like SIMLR (Wang et al., 2018) and MPSSC (Park and Zhao, 2018) utilized multiple kernel learning and spectral clustering to infer cell-to-cell similarities in heterogeneous samples. RAFSIL applied a random forest model in an unsupervised manner to learn cell-type similarities for exploratory analysis (Pouyan and Kostka, 2018), and SinNLRR (Zheng et al., 2019) identified cell types by extracting non-negative, low-rank representations of gene expression matrices from candidate subspaces.
Despite the advantage of not requiring predefined cell-type labels, unsupervised methods often perform poorly when marker genes are inadequately selected due to limited prior knowledge (Zhao et al., 2020). To address this limitation, several supervised machine learning approaches have been introduced for more accurate and robust cell type annotation. Scmap selected the top N residuals from a linear model—designed to capture the relationship between gene expression values and dropout rates in the reference dataset—as informative features (Kiselev et al., 2018). Based on these features, new cells were projected into the reference space to identify the most similar cell subtype. CaSTLe selected features with the highest mean expression and mutual information between genes and cell subtypes (Lieberman et al., 2018), then built a classification model using XGBoost, enhanced with transfer learning, to classify cells in the target dataset. ScPred applied singular value decomposition to decompose the gene expression matrix and extract key features, which were then used to train a support vector machine for classification Alquicira-Hernandez et al. (2019). CHETAH constructed a classification tree using reference profiles averaged over each cell subtype (De Kanter et al., 2019); cells were classified by traversing the tree based on similarity to each node. Both Garnett (Pliner et al., 2019) and CellAssign (Zhang et al., 2019) performed cell subtype assignment using user-defined marker gene sets and raw scRNA-seq counts. Garnett trained a classifier using elastic-net regularization, while CellAssign employed a probabilistic model to assign each cell to a subtype.
More recently, deep learning-based methods leveraging representation learning have been widely adopted due to their ability to capture informative features in latent space. ACTINN (Ma and Pellegrini, 2020) used a deep neural network for direct cell type assignment, while scDAE (Choi et al., 2021) employed a denoising autoencoder to extract representative features for classification. sigGCN (Wang et al., 2021b) introduced a graph convolutional network framework that integrates gene expression data with gene interaction networks to improve feature extraction and cell type prediction.
Although existing approaches have improved cell-type annotation accuracy, their performance often relies on the assumption that training and test datasets share similar data distributions. In practice, however, scRNA-seq datasets are frequently generated across different laboratories, sequencing platforms, and experimental protocols, which introduce batch effects and lead to distribution shifts between datasets (Li et al., 2026). As a result, supervised models trained on labeled reference datasets may generalize poorly when applied to new datasets generated under different experimental conditions (Luecken et al., 2022). Conversely, while unsupervised approaches do not require labeled data, they remain sensitive to technical variation and noise, particularly when clustering structures are influenced by batch effects rather than true biological differences (Hrovatin et al., 2025). Despite advances in sequencing technologies and data processing pipelines, batch effects remain a major challenge in large-scale single-cell data integration (Andreatta et al., 2024; Nesari et al., 2026). With the rapid expansion of public single-cell atlases and multi-study datasets, researchers increasingly integrate data generated from diverse experimental sources. Differences in library preparation protocols, sequencing platforms, and sample handling procedures can introduce systematic technical variation that shifts gene expression distributions across datasets (Tzec-Interián et al., 2025). These batch-driven discrepancies may obscure true biological signals and lead to inaccurate clustering, cell-type annotation, and downstream analyses if not properly corrected (Tirosh, 2026). Therefore, effective strategies for mitigating batch effects are essential for reliable integration and analysis of multi-dataset scRNA-seq data.
Batch effect removal methods based on pairwise analyses have been proposed. MNNCorrect (Haghverdi et al., 2018) assumes that the batch effect is orthogonal to the biological manifold and calculates correction vectors in a high-dimensional log-expression space by finding the mutual nearest neighbor (MNNs) pairs of cells. BBKNN (Polański et al., 2020) is a graph-based algorithm that identifies MNNs in a batch-corrected neighborhood graph. Harmony (Korsunsky et al., 2019) projected cells into a PCA space and clustered similar cells from different batches by calculating a correction factor based on the centroids of each cluster. Seurat 3.0 (Stuart et al., 2019) used a canonical correlation analysis (Hardoon et al., 2004) approach to find anchor cell pairs between the reference and target datasets.
To address these challenges, domain adaptation techniques have been introduced to reduce distribution discrepancies between datasets. In particular, unsupervised domain adaptation (UDA), which is closely related to transfer learning (Weiss et al., 2016), enables models trained on a labeled source dataset to be adapted to an unlabeled target dataset with a different distribution. By learning domain-invariant representations, UDA aims to mitigate the impact of batch effects while preserving biologically meaningful information across datasets. For UDA, the DANN (Ganin et al., 2016) and ADDA (Tzeng et al., 2017) utilize an adversarial objective with a discriminator and feature extractor. The discriminator distinguishes whether the feature is from the source or target domain. In contrast, the feature extractor deceives the discriminator by generating similar source and target feature distributions. It attempts to reduce the discrepancy between the distributions of source and target domains by learning domain-invariant features.
UDA was used to alleviate the differences caused by batch effects. iMap (Wang et al., 2021a) is a deep learning-based method that uses an autoencoder and generative adversarial networks. The MNN pairs are used to integrate data across batches. scANVI (Xu et al., 2021) leverages variational inference to integrate multiple datasets with a single generative model correcting batch effect. Specifically, scANVI extends the scVI framework by incorporating semi-supervised learning (SSL) to jointly model cell-type labels and batch variation in a unified probabilistic latent space. This approach enables the transfer of cell-type annotations from labeled datasets to unlabeled datasets while accounting for technical variability across experiments. scNym (Kimmel and Kelley, 2021) presented a semi-supervised adversarial neural network-based framework to effectively learn representations of cell identity that transfer annotations across datasets obtained from different experiments. The model employs adversarial domain adaptation and mixup-based SSL to encourage domain-invariant feature representations between source and target datasets. As a result, scNym improves the generalization of cell-type classifiers when applied to new datasets affected by batch effects. scSemiCluster (Chen et al., 2021) integrates reference and target data for training via structural similarity regularization. In this framework, domain adaptation is achieved by encouraging consistency between the structural relationships of cells across datasets, thereby aligning the latent representations of the source and target domains. This strategy enables the model to leverage labeled reference datasets while preserving the intrinsic structure of unlabeled target datasets. scAdapt (Zhou et al., 2021) is a virtual adversarial domain adaptation network that trains a feature generator utilizing both labeled source and unlabeled target datasets and aligns the centroids of each dataset. However, a shared feature generator for two separate domains renders the optimization poorly conditioned (Tzeng et al., 2017). More recently, additional approaches have been proposed to further improve cross-dataset cell-type annotation under batch effects. For example, CellPredX (Liu et al., 2026) introduces a deep learning framework that integrates domain adaptation and deep metric learning to align embeddings across datasets while incorporating an attention mechanism to enhance discriminative representation learning. HiCat (Bi et al., 2025) proposes a semi-supervised annotation framework that performs batch correction using Harmony (Korsunsky et al., 2019) and constructs embeddings by combining multiple low-dimensional representations derived from PCA, UMAP, and clustering results, which are subsequently used by a CatBoost classifier for cell-type prediction. MNN-based methods (Haghverdi et al., 2018; Polański et al., 2020; Korsunsky et al., 2019; Stuart et al., 2019; Wang et al., 2021a) assume that batch effect variation is smaller than biological differences in order to find the mutual nearest neighboring pairs of cells between different domains (Haghverdi et al., 2018). Therefore, when the domains are highly dissimilar, MNN-based methods tend to misidentify the nearest neighbors for cells from the same cell type across batches (Yang et al., 2021; Wang et al., 2022).
Motivated by these challenges, we propose scUDAS, a framework for cell-type prediction in scRNA-seq data based on UDA and SSL. Our motivation is to address the distribution shift caused by batch effects when transferring knowledge from labeled reference datasets to unlabeled datasets generated from different experimental conditions. Although various deep learning-based cell-type prediction methods have been proposed, the challenges of a shared feature extractor and the assumption of smaller biological differences remain. Considering these challenges, we constructed a network for separate domains to include information on each domain and facilitate optimization. First, we pretrained our model with a source dataset containing cell type information. Subsequently, UDA was applied to the target dataset via adversarial training (AT) to eliminate batch effects by aligning the target dataset with the domain and class distributions of the source dataset. Finally, scUDAS was retrained using a source dataset with ground truth cell types and a target dataset with consistency regularization (Bachman et al., 2014; Laine and Aila, 2016; Sajjadi et al., 2016) through SSL (Berthelot et al., 2019b; Sohn et al., 2020; Zhang et al., 2021). Experimentally, scUDAS matched the distributions of the source and target datasets and improved the cell-type prediction performance compared with existing deep-learning-based batch correction models.
METHODS
Data collection
We used multiple publicly available scRNA-seq datasets to evaluate the performance and generalizability of scUDAS. First, human peripheral blood mononuclear cell (PBMC) and human pancreas datasets were obtained from the SeuratData package (Stoeckius et al., 2017). For the PBMC data, seven batches generated using different sequencing platforms were included (Table 1): Smart-seq2, CEL-Seq2, 10x Chromium v2, 10x Chromium v3, Seq-Well, Drop-seq, and inDrop. The human pancreas dataset consists of five studies generated using distinct platforms: Baron (inDrop) (Baron et al., 2016), Muraro (CEL-Seq2) (Muraro et al., 2016), Xin (SMARTer) (Xin et al., 2016), Segerstolpe (Smart-seq2) (Segerstolpe et al., 2016), and Lawlor (Fluidigm C1) (Lawlor et al., 2017). These datasets provide diverse batch effects arising from differences in experimental protocols and sequencing technologies.
Datasets Used for scUDAS Evaluation
Datasets Used for scUDAS Evaluation
To further evaluate model performance under more complex and realistic biological settings, we additionally incorporated bone marrow and lymph node datasets from the Tabula Sapiens atlas (Consortium et al., 2022). Compared with the PBMC and pancreas datasets, these tissues contain larger numbers of cells and more diverse cell-type compositions, thereby providing more challenging evaluation scenarios. For model training, datasets with larger sample sizes—Drop-seq (PBMC), Baron (pancreas), and 10x Chromium v3 (bone marrow and lymph node)—were used as source datasets, while the remaining datasets were treated as target datasets.
Using the bone marrow dataset, we further constructed four experimental scenarios to explicitly model practical complexities commonly encountered in real-world applications. These scenarios include imbalanced sample sizes between source and target datasets (larger, where the source dataset is twice the size of the target, and smaller, where it is half the size), as well as settings with partial label overlap and skewed cell-type distributions. Specifically, we considered a balanced setting, in which each cell type has equal representation in both source and target datasets, and an imbalanced setting, in which cell-type proportions follow a decreasing sequence with a ratio of 0.8. These configurations simulate realistic conditions in which certain cell types may be overrepresented or underrepresented across datasets. In addition, we conducted cross-tissue experiments to assess the robustness and generalizability of scUDAS under substantial biological variation. In this setting, a peripheral blood dataset from Tabula Sapiens atlas was used as the source, and the bone marrow dataset was used as the target, representing a challenging domain shift across related but distinct tissues. A detailed summary of the dataset is provided in Table 1. To examine the batch effects presented in the dataset, UMAP visualization of the dataset were provided in Supplementary Data S1, which reveals that cells primarily cluster according to sequencing platform rather than biological cell type prior to batch correction, indicating the presence of substantial batch-driven differences among the datasets.
Our model framework comprises four phases: (1) preprocessing, (2) pre-training, (3) AT, and (4) SSL. The overall framework of scUDAS is shown in Figure 1. Our model consists of feature extractors
Illustration of the proposed framework via adversarial training and semi-supervised learning utilizing single-cell RNA sequencing.
Preprocessing
scRNA-seq datasets were normalized using the Seurat R package (Stuart et al., 2019). Normalization with the log-transformation formula is
Pretraining
To train the classifier for cell-type prediction, we pretrained a feature extractor for source Adversarial training
After pretraining, the feature extractor for the target 
The feature extractor for the target
Although we matched the domain distributions for source and target datasets, the class distributions for each cell type were not considered. To address this problem, we define the constraint loss for the class alignment, which considers the distribution of each class. Because the target dataset does not contain ground-truth labels, pseudo-labels are first generated using the classifier trained during the source pretraining stage. Specifically, for each target cell 
The class alignment loss is defined as follows:
Semi-supervised learning

After matching the distributions of the source and target datasets, we retrained the classifier using the source and target datasets to generalize and improve the performance of scUDAS. The source dataset was based on ground truth cell types, and the target dataset was based on consistency regularization. Because pseudo-labels may contain noise, we incorporate a SSL stage with consistency regularization to improve the robustness of the model. Consistency regularization encourages the classifier to produce stable predictions under different perturbations of the same input sample, which helps reduce the influence of incorrect pseudo-labels. Consistency regularization assumes that the classifier output is invariant to input perturbations. Therefore, we applied Gaussian noise as a data augmentation strategy to generate perturbed versions of the target samples. Gaussian noise is added to the normalized input features, where the injected noise acts as a small perturbation on the normalized feature space rather than altering the underlying raw count structure of the data. This perturbation encourages the model to produce consistent predictions for slightly different representations of the same cell, thereby improving model robustness and stabilizing pseudo-label predictions. Similar stochastic perturbation strategies have been explored in deep learning frameworks for single-cell transcriptomic analysis to improve representation learning and generalization performance (Han et al., 2022; Xu et al., 2026). Specifically, Gaussian noise is added to the target input with different noise intensities to generate weak and strong augmentations. The noise rates were set to 0.2 for weak augmentation and 0.8 for strong augmentation.
The loss for the source dataset 


In scUDAS, both the source and target feature extractors and the domain discriminator consist of two fully connected layers. The feature extractors use 1024 and 512 hidden units, while the discriminator uses 128 and 64 hidden units. The classifier comprises three fully connected layers with 256, 128, and 64 hidden units, followed by a softmax output layer. Hyperparameters—including the number of layers, the number of hidden units for each module, and the regularization parameter
RESULTS
Performance evaluation of scUDAS with competing methods
We evaluated the performance of scUDAS in predicting cell types across multiple target datasets using publicly available scRNA-seq data generated from diverse sequencing platforms, as described in the “Data collection” section. To assess its effectiveness in mitigating batch effects, we compared scUDAS with six representative cell-type prediction methods: CellPredX (Liu et al., 2026), HiCat (Bi et al., 2025), scAdapt (Zhou et al., 2021), scSemiCluster (Chen et al., 2021), scNym (Kimmel and Kelley, 2021), scANVI (Xu et al., 2021), Seurat (Butler et al., 2018), and scmap (Kiselev et al., 2018). All competing methods were evaluated using their default or recommended hyperparameter settings, while scUDAS was applied with consistent hyperparameter values across all datasets. Model performance was assessed using accuracy and weighted F1-score.
We first evaluated scUDAS and the competing methods on four tissue datasets: PBMC, pancreas, bone marrow, and lymph node. As shown in Table 2 and Supplementary Data S3, S4, scUDAS consistently outperformed other batch correction and cell-type prediction models across these datasets, achieving the highest accuracy and F1-score in most cases. The only exception was the 10x Chromium v2 PBMC target dataset, where scUDAS achieved a competitive average F1-score of 93.24%, ranking second to scAdapt (95.38%).
Average F1-Scores for Cell-Type Classification Performance of scUDAS and Competing Methods over Five Repeated Experiments
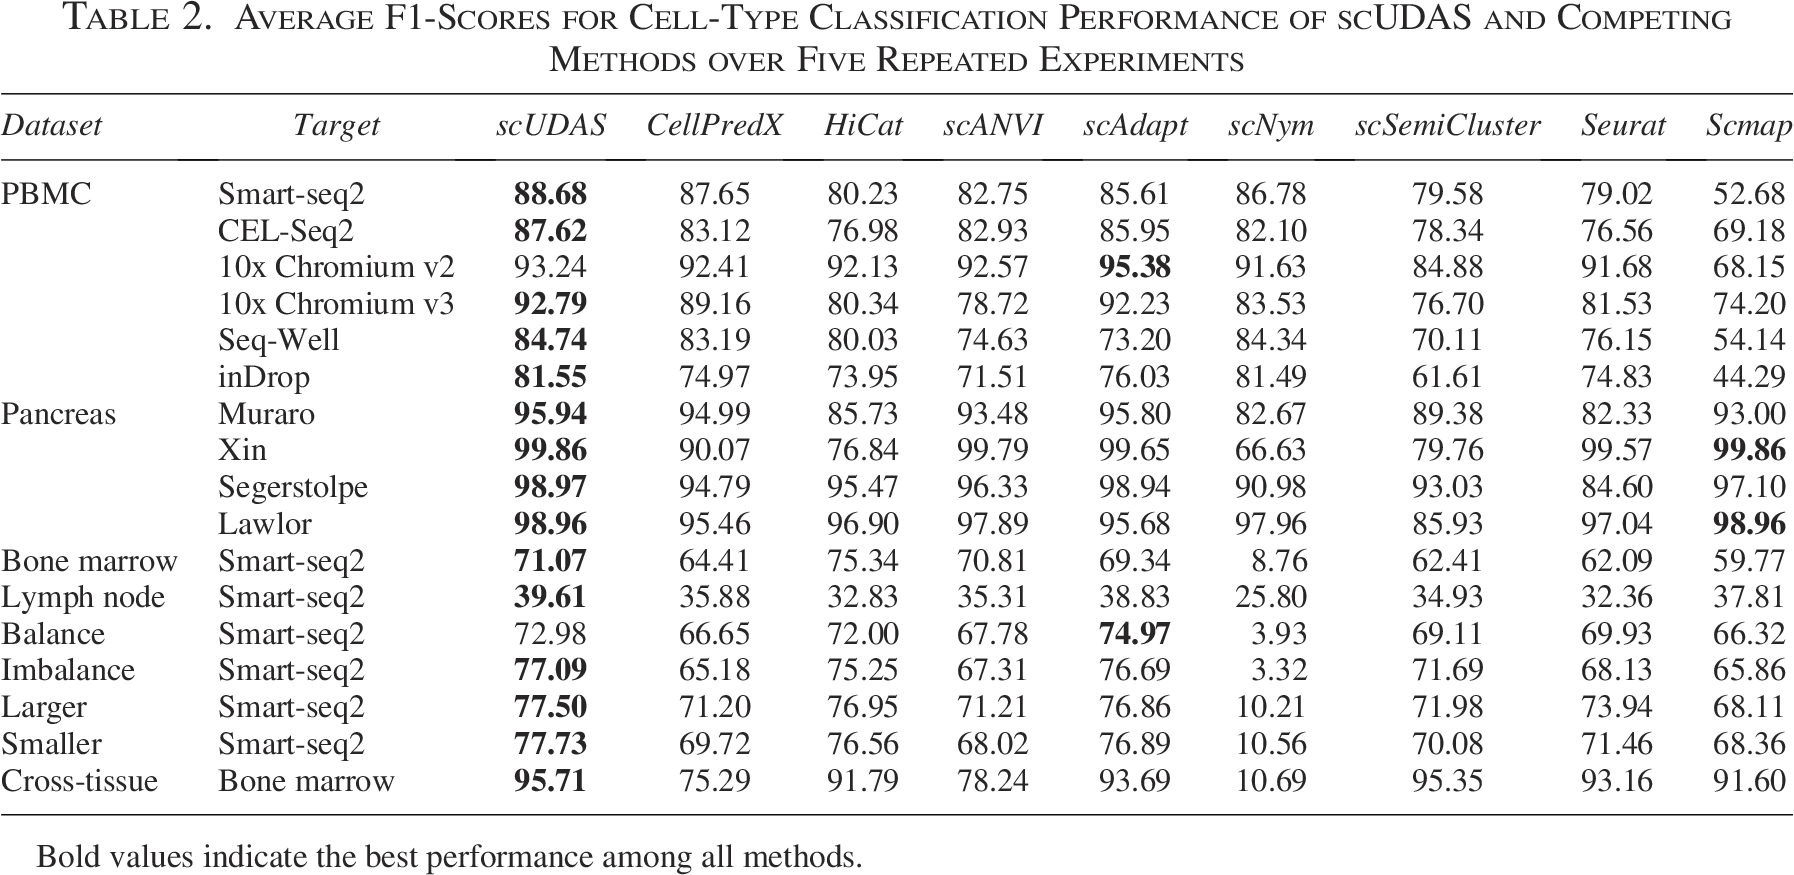
Average F1-Scores for Cell-Type Classification Performance of scUDAS and Competing Methods over Five Repeated Experiments
Bold values indicate the best performance among all methods.
Notably, several competing methods, including CellPredX, HiCat, and scAdapt, exhibited reduced discriminative ability for closely related cell types when the cell-type distributions between the source and target datasets differed substantially, such as in the inDrop and Seq-Well target datasets. For example, in the Drop-seq source dataset, the number of CD14 + monocytes were 357, whereas the corresponding target datasets contained substantially more CD14 + monocytes (2,038 in inDrop and 1,255 in Seq-Well). As a result, the limited number of CD14 + monocytes in the source dataset constrained the ability of several models to correctly distinguish these cells in the target datasets. To further investigate these effects, we added Sankey plots illustrating the cell-type assignment results of scUDAS and competing methods. These visualizations explicitly demonstrate how each method assigns target cells across closely related cell types. In the inDrop dataset, scUDAS accurately distinguished CD14+ and CD16+ monocytes, achieving average cell-type–specific accuracies of 88.04% and 93.32%, respectively, whereas most competing methods misclassified approximately half of the CD14+ monocytes as CD16+ monocytes (Fig. 2). A similar pattern was observed in the Seq-Well target dataset, where competing methods incorrectly reassigned a substantial fraction of CD14+ monocytes to dendritic cells and CD4+ T cells, while scUDAS largely preserved the correct cell-type identities (Supplementary Data S5).
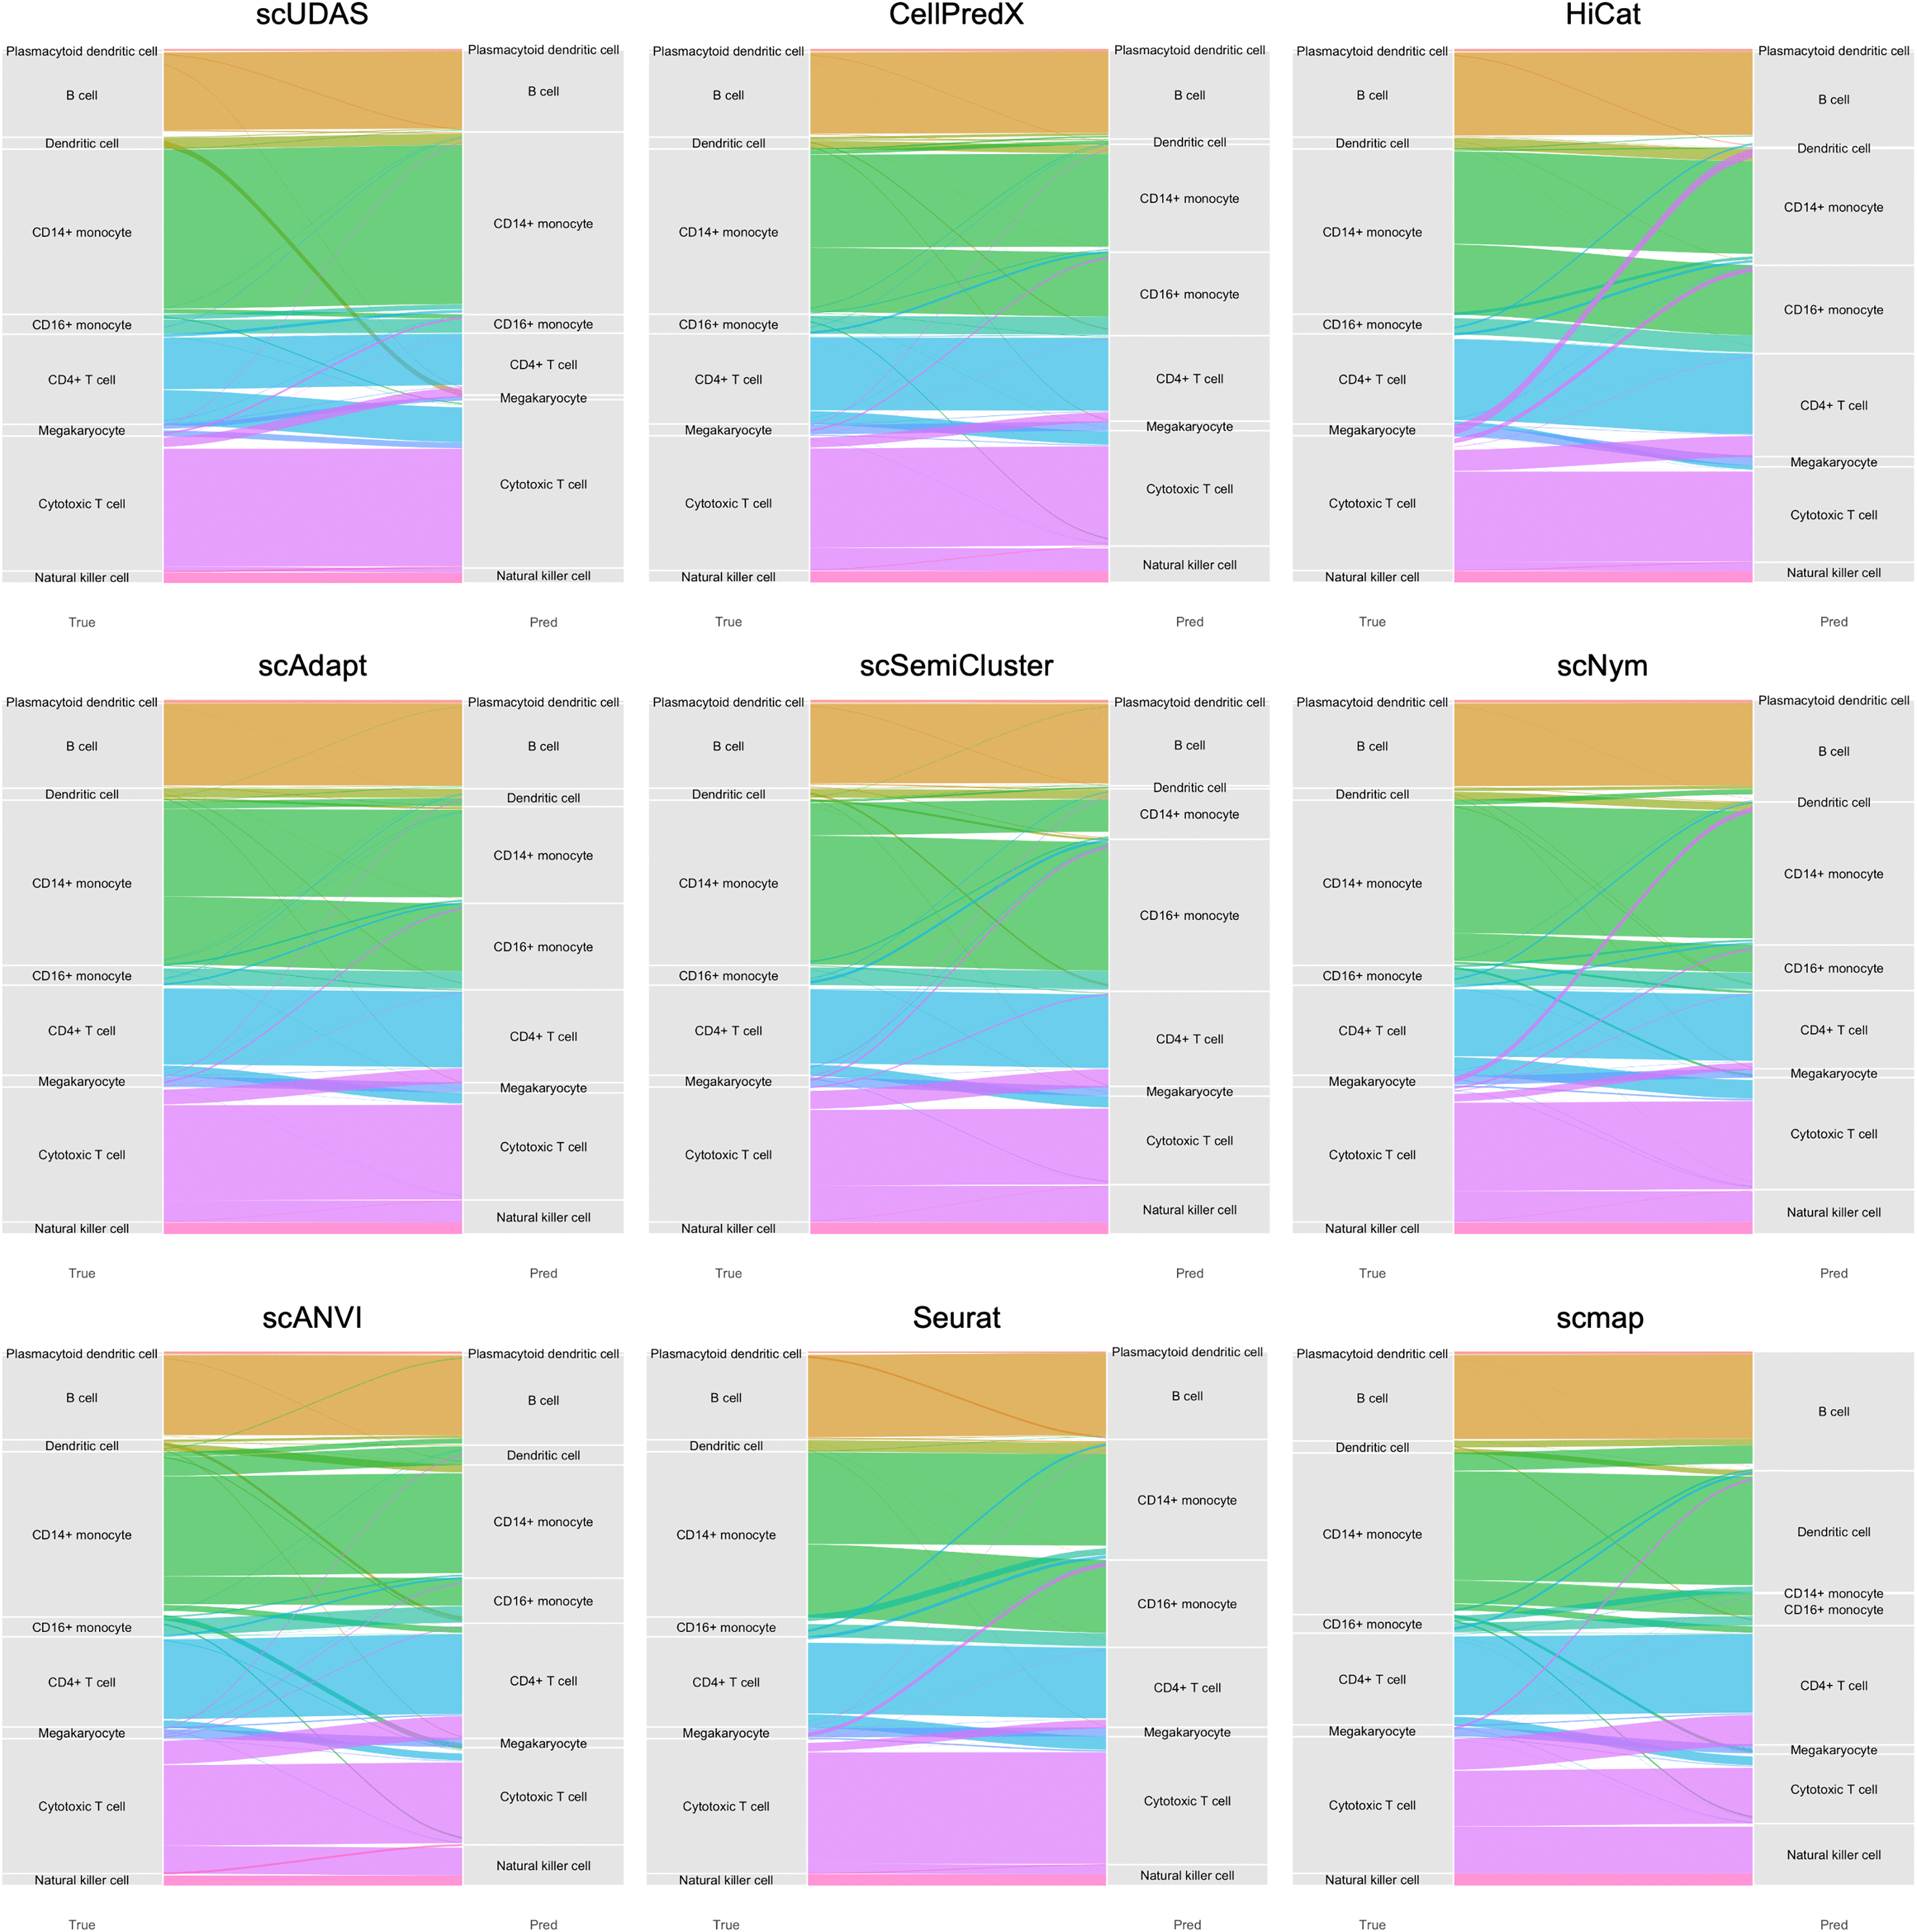
Sankey plots comparing scUDAS and other methods for inDrop target dataset.
We further evaluated scUDAS under realistic and challenging experimental scenarios using the bone marrow dataset, explicitly modeling practical complexities commonly encountered in real-world applications. These scenarios included imbalanced sample sizes between source and target datasets, partial label overlap, and skewed cell-type distributions. In addition, to assess robustness under substantial biological variation, we conducted a cross-tissue validation experiment in which the source and target datasets were derived from different but biologically related tissues. This setting represents a challenging domain shift, as PBMCs originate from hematopoietic stem cells in the bone marrow but exhibit distinct transcriptional profiles due to tissue-specific differentiation and physiological conditions (see Data collection section for details).
As summarized in Table 2 and Supplementary Data S3 and S4, scUDAS achieved the best overall prediction performance across these scenarios, demonstrating strong generalizability across domains with pronounced biological and distributional differences. In scenarios with imbalanced sample sizes (Imbalance, Larger, and Smaller), scUDAS consistently achieved the highest average F1-score (approximately 77%) across most settings, whereas competing methods exhibited greater performance variability. In the cross-tissue experiment, scUDAS again achieved the highest average F1-score (95.71%). In contrast, scNym showed consistently lower performance across these challenging scenarios, failing to correctly discriminate several major cell types—including natural killer cells, monocytes, naïve B cells, memory B cells, and erythrocytes—and instead misassigning a large fraction of target cells to the erythrocyte class. These results highlight the inherent difficulty of cross-tissue domain adaptation and further underscore the robustness and discriminative capability of scUDAS under such conditions.
To intuitively observe the effectiveness of the UDA, we used a UMAP (McInnes et al., 2018) plot to visualize the representation space of batch correction methods. Figure 3 and Supplementary Data S6 show the representation space of raw, scUDAS, CellPredX, HiCat, scAdapt, scSemiCluster, scNym, scANVI, and Seurat. Raw represents the original data that did not remove the batch effect between the Drop-seq and Smart-seq2 datasets. We found that each dataset was clustered separately, and the cell types were mixed. scUDAS and scAdapt reduced the differences in distribution between datasets, and the cell types were clearly separated. In contrast, CellPredX also demonstrated reasonable cell-type separation but still exhibits noticeable batch-specific clustering patterns. HiCat showed stronger batch mixing across datasets, indicating effective batch correction; however, the resulting representation space does not clearly separate several cell types. scNym and scSemiCluster showed some degree of cell type clustering; they were less effective in mitigating batch effects, as batch-specific distinctions remained prominent. For example, CD14+ monocyte and CD16+ monocyte cells were too close to each other on Smart-seq2 and far away from the same cell types on Drop-seq and Smart-seq2. scUDAS trains the features of the target to match the features of the source and generates a classifier with clear boundaries. scANVI and Seurat also reduced batch-driven distinctions; however, scANVI exhibited multiple sub-clusters within the same cell type, indicating fragmented representations, while Seurat produced more dispersed and scattered embeddings, resulting in less compact cell-type clusters (Supplementary Data S6). This demonstrates the ability of scUDAS to effectively remove the batch effect and align the distributions of the same cell types between different sequencing techniques.
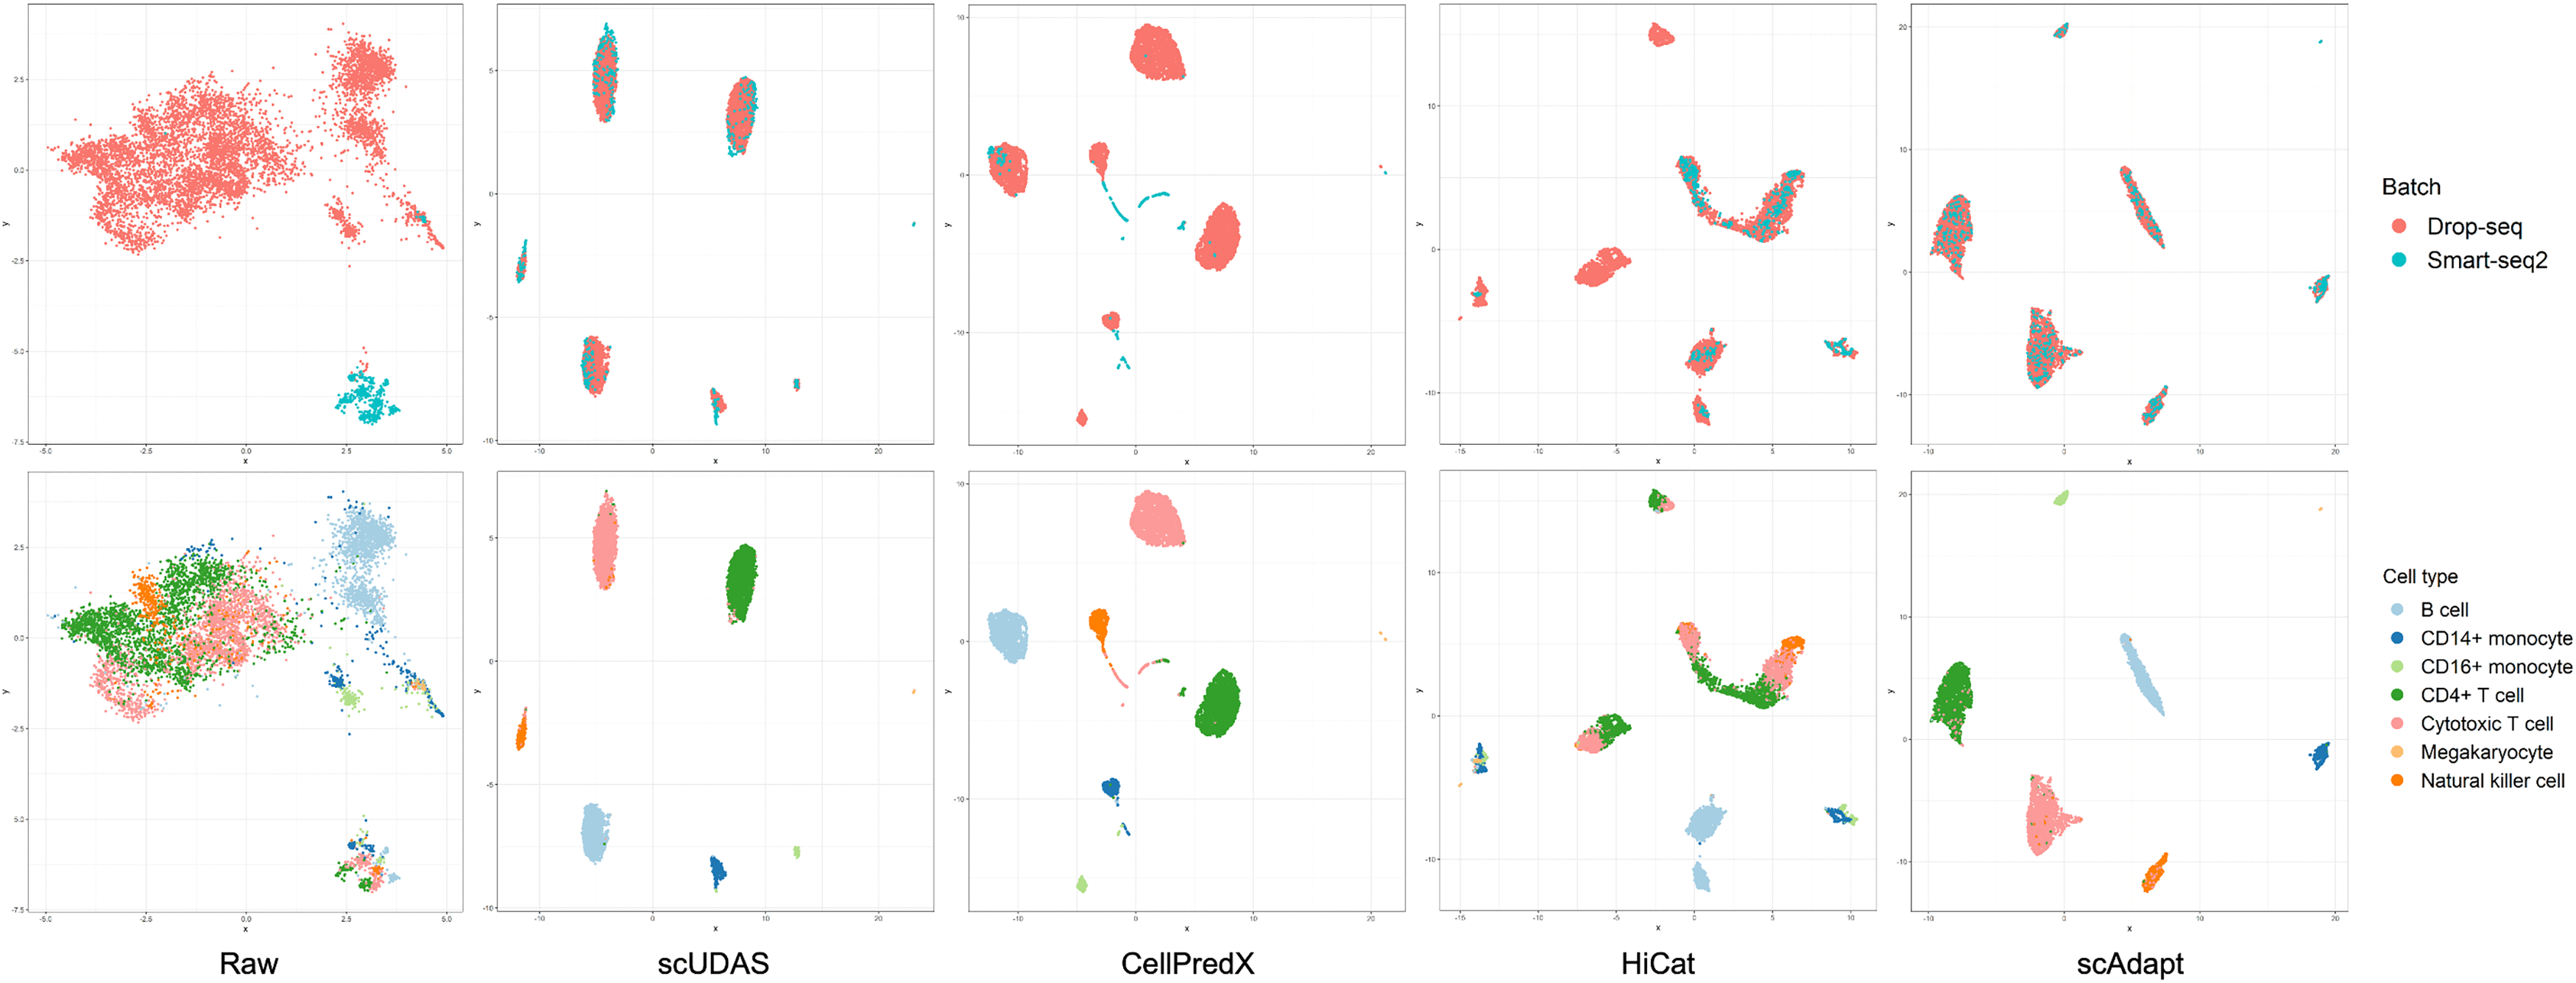
UMAP visualization plots of the batch (top row) and cell type (bottom row) between Drop-seq and Smart-seq2 compared to other batch correction models.
We assessed the ability of scUDAS to accurately predict cell types when the available source datasets were limited. We evaluated the performance of the model using various training set sizes including ratios of 10%, 15%, 20%, 25%, and 30% of the source dataset. For comparison, we also included a baseline model, which consists of a classifier trained solely on the source dataset using Eq. (2), without AT or SSL. The results of training on Drop-seq for the source dataset and applying it to Smart-seq2 and Seq-Well for the target datasets are shown in Figure 4. CellPredX, scUDAS and scAdapt showed stable performances for each sample size. However, HiCat, scSemiCluster, and scANVI variabilities depended on the sample size. In Smart-seq2, the accuracy of scUDAS was over 88.4% for each sample size. scNym and the baseline model relied on the number of samples from the source because the higher the number of source samples, the better the accuracy. scUDAS was not significantly affected by the sample size, with 88.4% accuracy, even at a 10% sample size.
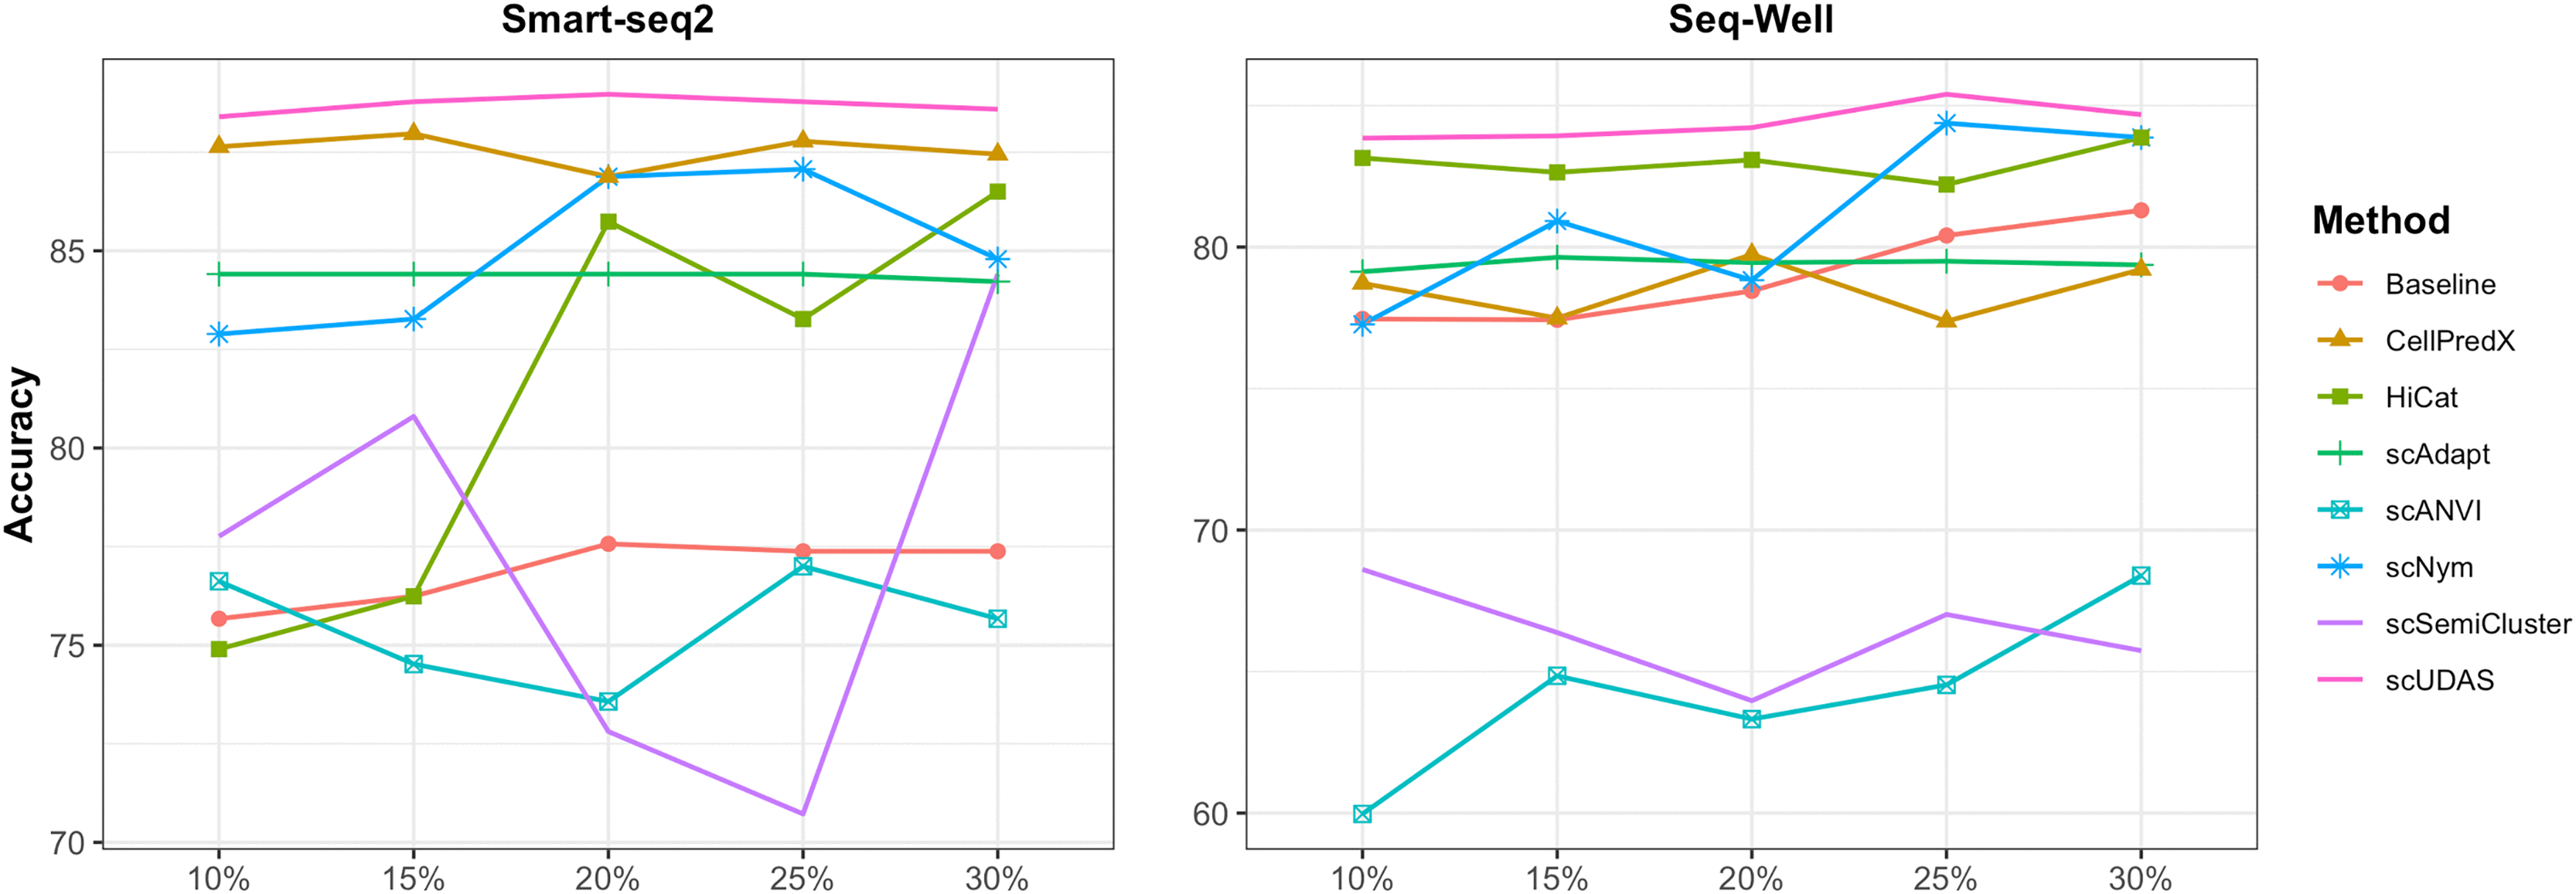
Accuracy variation with increasing source sample size in the target datasets of Smart-seq2 and Seq-Well.
In Seq-Well, scUDAS performed well, achieving an accuracy of over 83.85% across all sample sizes tested. The baseline model increases from 77.43% to 81.3% as the sample size increases. Moreover, it outperformed other batch correction models when the sample size was >25%. We observed that the accuracy of scUDAS was further improved after applying AT and SSL compared with the baseline model. These results indicate that AT and SSL substantially enhance model robustness under limited labeled data.
To assess the contributions of AT and SSL, we conducted a series of ablation experiments in which individual components of scUDAS were removed. The results are summarized in Table 3. The baseline model corresponds to a pre-trained classifier trained solely on the source dataset using Eq. (2) and directly applied to the target dataset without any domain adaptation. In Table 3, w/o SSL denotes the removal of the SSL component in Eq. (9), while retaining AT. w/o AT indicates the exclusion of AT in Eq. (6), while keeping SSL. w/o CA refers to the removal of the constraint loss in Eq. (5), which is used for pseudo-label–based class alignment during AT.
Ablation Study Results Showing the Average F1-Score with 95% Confidence Interval of scUDAS and Its Variants
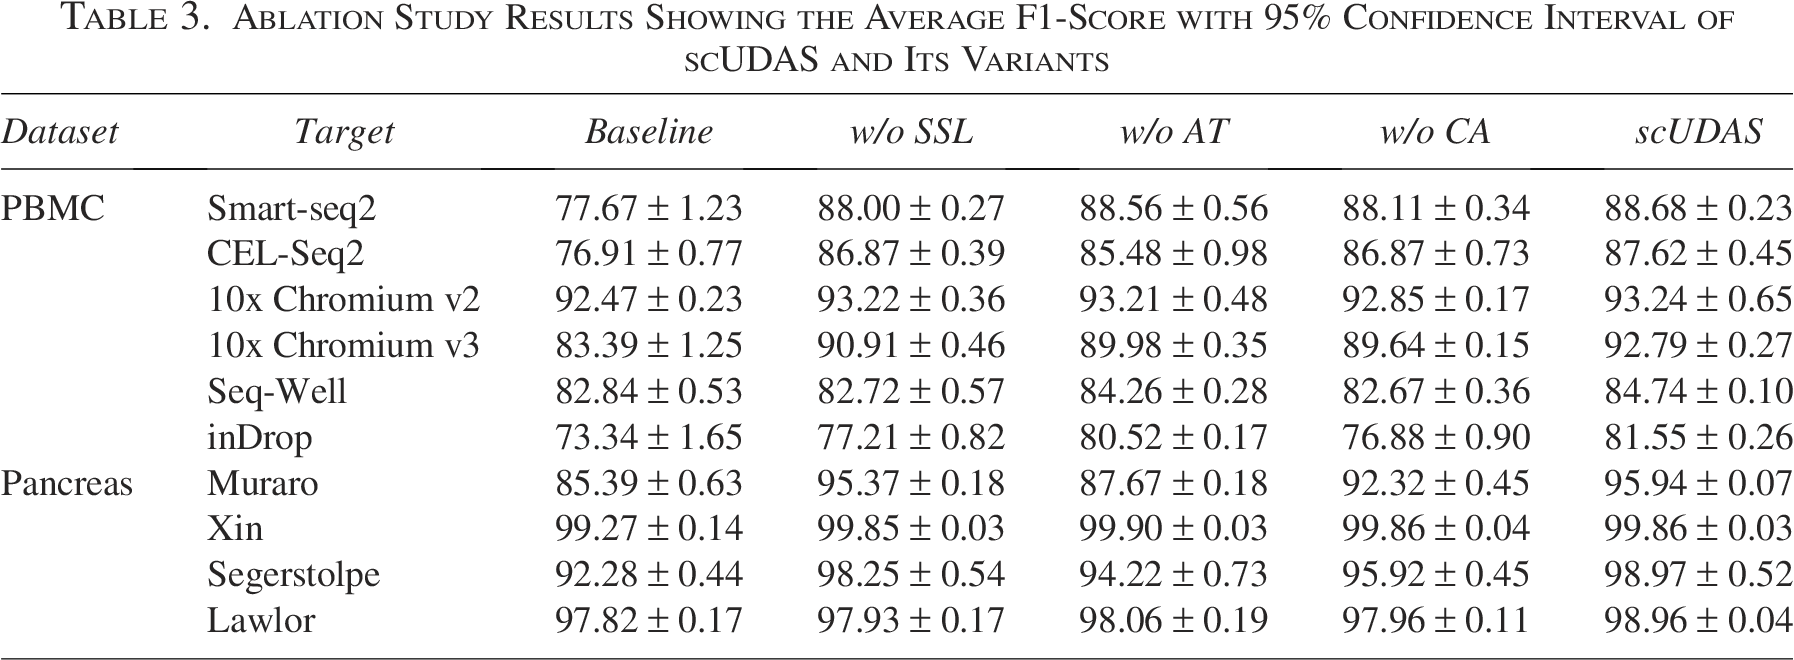
Ablation Study Results Showing the Average F1-Score with 95% Confidence Interval of scUDAS and Its Variants
scUDAS combined with AT and SSL obtained the highest average accuracy and F1-score on most datasets, and the contributions of AT and SSL differed depending on the datasets. From the results (Table 3, Supplementary Data S7), we found that SSL was effective in inDrop, which has a large number of samples. The performance was significantly improved by SSL of 80.52% compared with AT of 77.21%. This is a reasonable result because deep learning models tend to improve their performance when using more data during training. Therefore, the effect of SSL, which trains a classifier using both source and target datasets, is significant for improving performance. A comparison of these two components confirmed that both AT and SSL play crucial roles in mitigating batch effects and enhancing model performance. As expected, the baseline model—which was trained only on the source dataset—yielded the lowest performance. Even without the constraint loss, the model significantly outperformed the baseline across most target datasets. For example, average F1-score increased from 77.67% to 88.11% on Smart-seq2 and from 76.91% to 86.87% on CEL-Seq2. Incorporating the constraint loss further boosted accuracy slightly, reaching 88.68% and 87.62% on Smart-seq2 and CEL-Seq2, respectively. These results indicate that while class alignment via AT contributes to performance gains, its effect is incremental rather than dominant.
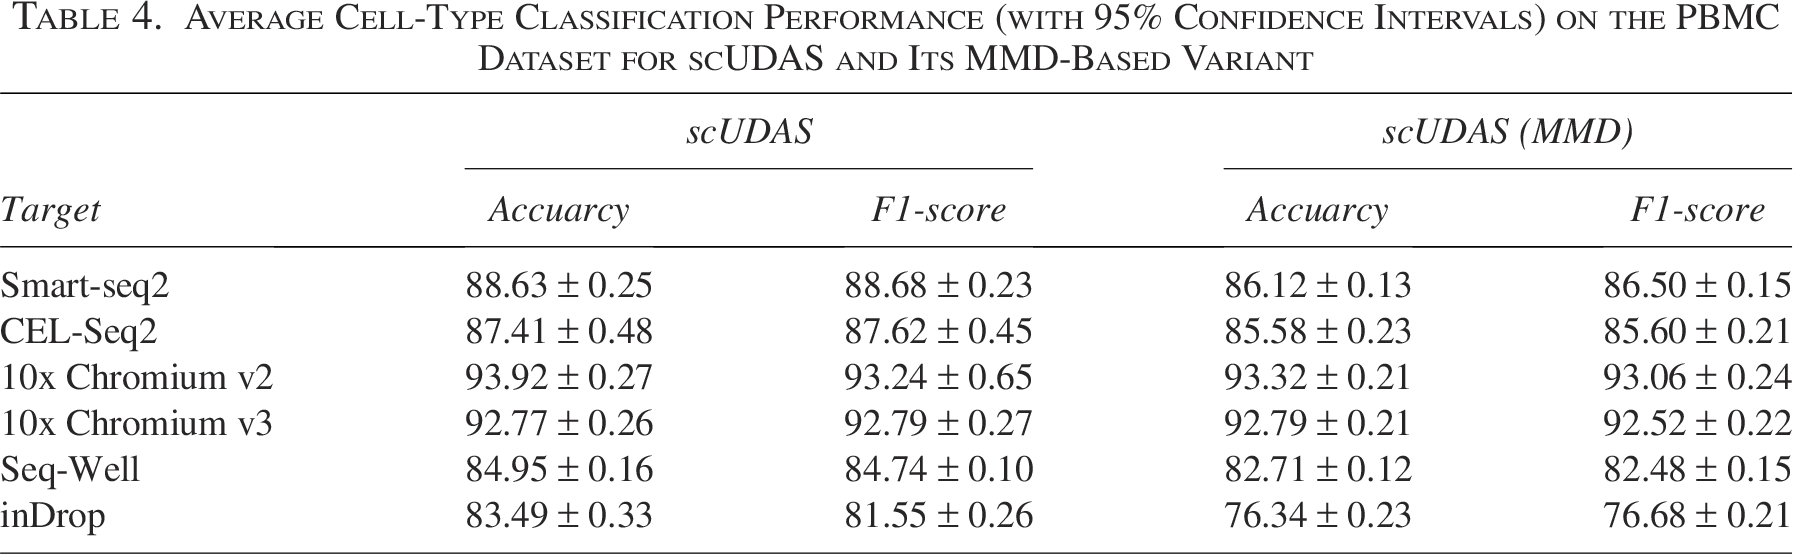
To further examine the choice of latent centroid-based alignment (LCA) over alternative alignment strategies, we conducted additional experiments comparing LCA with a class-conditional maximum mean discrepancy (MMD)–based alignment variant. Specifically, we implemented a variant of scUDAS in which the LCA term (Eq. [5]) was replaced by a class-wise MMD objective. Rather than aligning class centroids, this variant aligns the source and target feature distributions for each class by minimizing the discrepancy between their kernel mean embeddings using an RBF kernel, thereby enforcing distributional similarity through all pairwise relationships. We evaluated the variant on the PBMC datasets, repeating each experiment five times and reporting average accuracy and F1-scores. As summarized in Table 4, the LCA-based scUDAS consistently achieved higher cell-type identification performance than the MMD-based variant across most target datasets. These results indicate that explicit centroid alignment provides stronger preservation of class structure under batch shifts than implicit distributional alignment via MMD, which does not explicitly enforce intra-class compactness or inter-class separation. Moreover, we observed that without centroid compactness, the MMD-based alignment exhibited reduced discriminative ability, particularly for closely related cell types. For example, in the inDrop (target) experiment, the average cell-type–specific accuracies for CD14+ and CD16+ monocytes were 88.04% and 93.32%, respectively, using LCA-based scUDAS, whereas the MMD-based variant achieved 81.81% and 90.26%. In summary, while MMD-based alignment provides a mechanism for matching class-conditional distributions, our results demonstrate that explicit centroid alignment via LCA more effectively preserves discriminative class structure and yields more reliable cell-type identification under batch variability.
Average Cell-Type Classification Performance (with 95% Confidence Intervals) on the PBMC Dataset for scUDAS and Its MMD-Based Variant
To evaluate the computational efficiency and scalability of scUDAS on larger datasets, we measured both runtime and average memory consumption using a large-scale bone marrow dataset. Each experiment was repeated five times, and average values were reported. scUDAS was compared with representative deep learning–based methods under the same experimental conditions. For all competing methods, we followed the default or recommended configurations provided in their original implementations. We note, however, that most competing methods do not explicitly specify or expose key hyperparameters—such as learning rate and batch size—which are known to directly influence both runtime and memory usage. Therefore, although we strictly adhered to the authors’ recommended settings to ensure fairness and reproducibility, differences in computational efficiency across methods should be interpreted with this limitation in mind. As summarized in Table 5, scUDAS demonstrated computational efficiency and scalability on the large-scale dataset, with an average runtime of 1,171.48 s and an average memory consumption of 2,887.04 MB. Overall, these results indicate that scUDAS does not exhibit a substantial difference in efficiency or scalability when applied to large datasets compared with other deep learning-based models evaluated under similar experimental settings.
Average Runtime and Memory Consumption with 95% Confidence Intervals for Bone Marrow Cell-Type Identification Using scUDAS and Other Deep Learning–Based Methods, Averaged over Five Runs
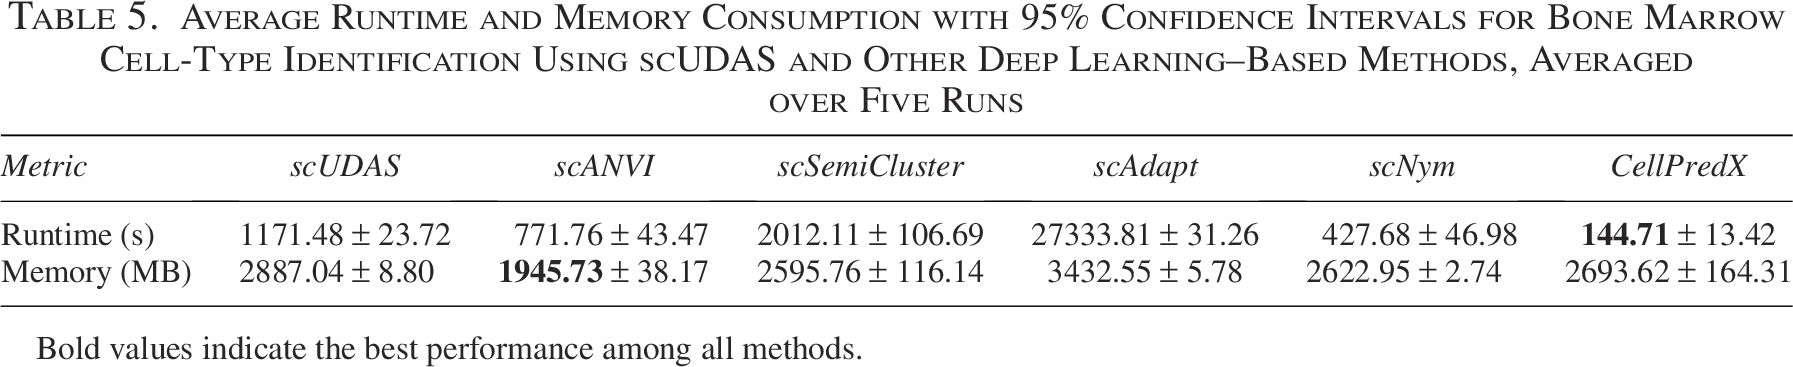
Average Runtime and Memory Consumption with 95% Confidence Intervals for Bone Marrow Cell-Type Identification Using scUDAS and Other Deep Learning–Based Methods, Averaged over Five Runs
Bold values indicate the best performance among all methods.
In this study, we proposed scUDAS, a cell-type prediction model based on AT and SSL. scUDAS matched the distributions of datasets generated by different scRNA-seq techniques and improved classification accuracy.
We first evaluated the cell-type prediction performance of scUDAS. Through a comparison with the baseline model, we demonstrated that removing batch effects improved the cell-type prediction performance across all datasets. The results of scUDAS outperformed those of the other single-cell batch correction models, achieving the highest accuracy. These results demonstrate that scUDAS is an effective model for alleviating the batch effect and accurately predicting cell types from scRNA-seq data. The ablation experiments, combined with AT and SSL, were effective in removing the batch effect and improving the classifier performance.
We visualized the representation space using a UMAP plot. We validated that AT and SSL matched the distribution of target datasets as a source data distribution and properly transferred the cell types from the source dataset to the target dataset.
In addition, we investigated the stability of scUDAS based on sample size. In the experiment with reduced sample sizes, scUDAS was not significantly affected by the sample size compared to the other models, indicating that the model is stable and can be trained sufficiently even with a small sample size.
Overall, scUDAS can predict cell types of scRNA-seq without ground truth labels by transferring cell type information from the source dataset to the target dataset. In future work, we will consider expanding our model to combine datasets from multiple target domains to alleviate the efforts to predict cell types in each domain.
AUTHORS’ CONTRIBUTIONS
C.P.: Conceptualization, methodology, software, investigation, writing—original draft, visualization; J.M.C.: Conceptualization, data curation, software, investigation, writing—original draft, writing-review and editing; H.C.: Writing—review and editing, supervision, project administration, funding acquisition.
Footnotes
ACKNOWLEDGMENT
AUTHOR DISCLOSURE STATEMENT
No competing financial interests exist.
FUNDING INFORMATION
This research was supported by the “Korea National Institute of Health” (KNIH) research project (project No. 2024-ER-0801-01), by the Bio&Medical Technology Development Program of the National Research Foundation (NRF) funded by the Korean government (MSIT) (No. RS-2025–18732993), and by the National Research Foundation of Korea (NRF) grant funded by the Korea government(MSIT) (No. RS-2026–25476743).
Supplemental Material
References
Supplementary Material
Please find the following supplemental material available below.
For Open Access articles published under a Creative Commons License, all supplemental material carries the same license as the article it is associated with.
For non-Open Access articles published, all supplemental material carries a non-exclusive license, and permission requests for re-use of supplemental material or any part of supplemental material shall be sent directly to the copyright owner as specified in the copyright notice associated with the article.