
Abstract
This article describes the development of a joint display in a mixed methods research case study, using a theoretical framework as the start point. A case study of professional development on Web 2.0 technologies for teachers of Spanish illustrates how the qualitative results from interviews, observations, and documents, and quantitative results from pre, post, and follow-up surveys were integrated via a joint display using the TPACK model. The discussion focuses on the role of joint displays in data merging and how they facilitate the representation of fit of data integration, enriching the results in convergent designs.
In convergent designs, merged data analyses encompass the use of strategies for “merging the results, assessing whether the results from the two databases are congruent or divergent, and, if they are divergent, then analyzing the data further to reconcile the divergent findings” (Creswell & Plano Clark, 2011, p. 223). One of these strategies is the use of a joint display, which is a figure or table where both qualitative and quantitative data are presented with the purpose of directly comparing the two databases.
Even though mixed methods research is becoming a significant methodology in multiple disciplines, “meaningful integration of qualitative and quantitative data remains elusive and needs further development” (Guetterman, Fetters, & Creswell, 2015, p. 554). It has been found in mixed methods studies that although both qualitative and quantitative data may be collected, they are often not integrated (Bryman, 2007; O’Cathain, Murphy, & Nicholl, 2008), or integration is limited (Bryman, 2006; Fetters, Curry, & Creswell, 2013; Lewin, Glenton, & Oxman, 2009). In fact, integration has been regarded as one of the most challenging elements to execute in mixed methods research (Guetterman, Creswell, & Kuckartz, 2015).
The use of joint displays facilitates integration by bringing data together in a visual form. Guetterman, Fetters, et al. (2015) searched for empirical articles that included joint displays and analyzed what each display communicated and how it represented a mixed methods analysis. They found that the most predominant types of joint displays were statistics-by-themes and side-by-side comparisons. They described as “innovative” the joint displays that connected results to theoretical models.
In light of this innovation, the purpose of this article is to illustrate the development of a joint display in a mixed methods research case study using the Technological Pedagogical Content Knowledge (TPACK) theoretical model (Mishra & Koehler, 2006). More specifically, a case study of professional development on Web 2.0 technologies for teachers of Spanish is used as an illustration. Qualitative results from interviews, observations, and documents, and quantitative results from pre, post, and follow-up surveys were integrated in a novel joint display using the TPACK model as the starting point. This facilitated the analysis for congruencies and discrepancies in both sets of results.
This article begins with a summary of relevant literature on data integration via joint displays in convergent designs. The illustrative mixed methods research case study, theoretical model, and methods are then presented, followed by a detailed description of the development of the joint display and analysis of integrated results. Last, the role of joint displays in data integration is discussed.
Integration of Qualitative and Quantitative Data Using Joint Displays in a Convergent Design
In studies that use a convergent design, quantitative and qualitative data are collected and analyzed during the same phase of the research process and later mixed into an overall interpretation. This design is used “to obtain different but complementary data on the same topic” (Morse, 1991, p. 122).
Data integration in a convergent mixed methods study “provides strengths that offset the weaknesses of both quantitative and qualitative research” (Creswell & Plano Clark, 2011, p. 12), for example, through the validation of quantitative results using qualitative results. Integration via merging of data, an approach to integration at the method level, follows when the two databases are brought together for analysis and comparison. At the interpretation and reporting level, integration may be achieved via three approaches (Fetters et al., 2013): (1) integration through narrative, or the description of quantitative and qualitative results in a report; (2) integration through data transformation, or the conversion of qualitative data into quantitative data or vice versa, followed by an integration with the other set of data; and (3) integration through joint displays, which is the focus of this article.
Guetterman, Creswell, et al. (2015) described four variations of joint displays in convergent designs: (1) A comparing results display presents convergent and divergent results side-by-side, and it might be useful to bring attention to multiple perspectives or present evidence in test validation; (2) a side-by-side display presents a combination of quantitative and qualitative results thoroughly. It may have a focus on research questions, results, themes, or a theoretical framework; (3) a statistics-by-themes display uses a matrix to present the qualitative results as one dimension and the quantitative results as another dimension, for example, arraying quantitative categorical data by qualitative themes; and (3) a geocoding-by-themes display combines in a visual image quantitative data in the form of geographical location references and qualitative results in the form of text from interviews or observations, or images (see Guetterman, Creswell, et al., 2015, for examples). Merged integration strategies typically involve “assessing whether qualitative findings and quantitative results converge or diverge, and reconciling divergent results” (Guetterman, Creswell, et al., 2015, p. 155) for mixed methods studies that use a convergent design.
Fetters et al. (2013) referred to “fit” of data integration as the coherence of the quantitative and qualitative results, leading to three possibilities: (1) if the results from both databases confirm the results of the other, having therefore greater credibility, confirmation occurs; (2) if the results from both databases diverge and expand understanding of the phenomenon, expansion occurs; and (3) if the results from both databases are inconsistent or contradict each other, discordance occurs. In this last case, discordant results may lead to “gathering additional data, re-analyzing existing databases to resolve differences, seeking explanations from theory, or challenging the validity of constructs” (p. 2144).
The following section describes the convergent mixed methods research case study and the theoretical model used to illustrate the development of the joint display.
Mixed Methods Research Illustrative Case Study: Professional Development on Web 2.0 for Teachers of Spanish
The Case
Based on an eminent need for the integration of technology in foreign language classrooms in the United States (Clausen, 2007; Gray, Thomas, & Lewis, 2010; Moore-Hayes, 2011), the University of Nebraska–Lincoln secured funding through a Teacher Quality Grant (Postsecondary Commission on Education & U.S. Department of Education) to develop an online professional development program for teachers of Spanish for Grades 7 to 12 on integrating Web 2.0 tools into the Spanish language classroom called Web 2.0 for Teachers of Spanish. In this study, professional development is defined as the expansion of skills or expertise to succeed in a particular profession, through continued education.
This professional development program was offered online, as the participants were spread across different urban and rural areas of Nebraska. The program was organized by 16 weekly modules, in which participants learned about and created products—in the same way that their students would—using a variety of Web 2.0 tools. The term Web 2.0 refers to the second generation of the Internet and its main characteristics are the promotion of creativity, information sharing, and collaboration (Schrum & Levin, 2009). Examples of Web 2.0 tools are blogs, wikis, podcasting, and poster, video, or comic generators, all of which were included in the professional development program in this study.
This research was guided by the following qualitative questions: (1) What are the experiences of the participants during the program? (2) What are the experiences of the participants integrating technology in their classrooms? In addition, the quantitative research questions were the following: (1) Are there significant differences in participants’ technology, pedagogy, and content knowledge from pre to post to follow-up measures? (2) Are there significant differences in participants’ technology integration into their classrooms from pre to post to follow-up measures? These questions led to a mixed methods research question: To what extents do the qualitative results from the participants’ experiences confirm the measurement data on participants’ knowledge and technology integration?
Theoretical Model
The TPACK model (Mishra & Koehler, 2006) is a framework for technology integration and teacher knowledge that integrates technology, pedagogy, and content, and it was the theoretical model used in this study. This framework was built on the work of Shulman (1986), who introduced the idea of pedagogical content knowledge (PCK). PCK represents the combination of content and pedagogy to understand how particular aspects of content matter are adequately represented for instruction, arguing that having knowledge of content and general pedagogical strategies separately was not sufficient for generating the knowledge of good teachers. Advancing Shulman’s (1986) construct one step further, the TPACK model emphasizes the interactions between and among content, pedagogy, and technology, arguing that for effective integration of technology into the classroom, teachers’ experiences with technology need to be discipline specific (Mishra & Koehler, 2006). The components of this model not only served as the guiding constituents for the professional development program but also as the theoretical lens that guided the data analysis in this study.
The TPACK construct has gained acceptance as a theoretical model that guides researchers in thinking about the use of technology in education (Doering, Veletsianos, Scharber, & Miller, 2009). Accordingly, several methods to assess teachers’ TPACK have emerged. TPACK assessments are based mostly on survey data, with the majority of studies conducted being quantitative in nature (Baran, Chuang, & Thompson, 2011; Hofer, Grandgenett, Harris, & Swan, 2011). Even though a few studies using qualitative methods have been published in an effort to better understand the complexity of the knowledge envisioned in this model for both preservice and in-service teachers (Jaipal & Figg, 2010; Niess & Gillow-Wiles, 2010; Stoilescu & McDougall, 2010), mixed methods empirical research using the TPACK model has been very limited in general, and not evident in the area of foreign language.
Whereas quantitative surveys produce numerical data for measurement that can describe the magnitude of a problem, on their own they do not describe experiential issues related to the phenomenon in question (Creswell, 2002). The utilization of both quantitative and qualitative methods can consequently generate results that are enriched in ways that a single method does not permit (Tashakkori & Teddlie, 1998). This mixed methods research case study aimed for the in-depth understanding of a TPACK-based professional development program for foreign language teachers that would be only possible through the integration of qualitative and quantitative methods.
The case selected for this study, the Web 2.0 for Teachers of Spanish professional development program, had three basic goals for the 18 teacher-participants: to become technology literate with Web 2.0, to expand Spanish language and culture knowledge, and to create standards-based lessons that reflect best pedagogical practices, goals that are aligned with the components of the TPACK model (Figure 1).
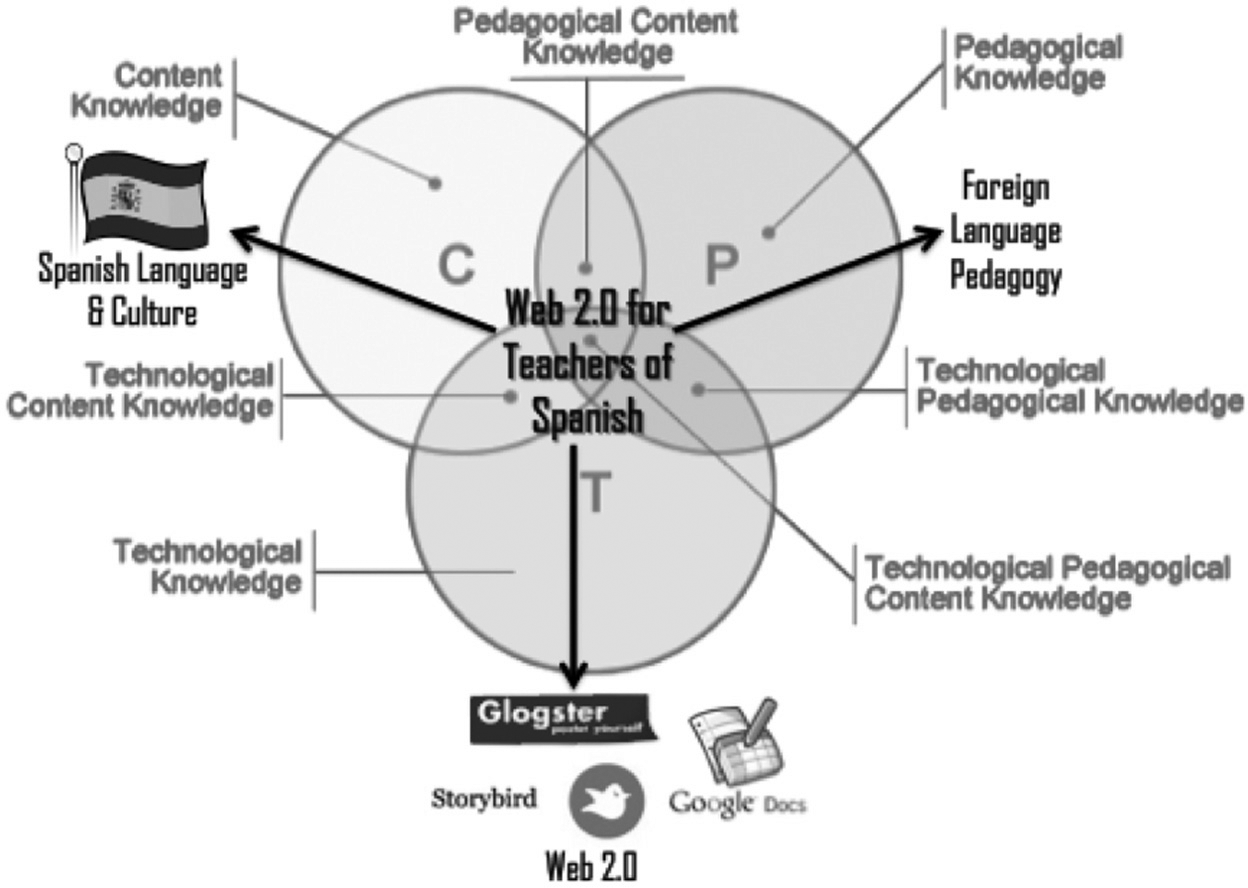
Alignment between the Web 2.0 for Teachers of Spanish program and the TPACK model.
Qualitative and Quantitative Methods
This research examined a professional development program on Web 2.0 technologies for teachers of Spanish, both from the experiences of the participants and the measured outcomes of the program. Eighteen teacher-participants took part in this study. A mixed methods research case study design was used, as detailed exploration of this unique program was needed. Specifically, qualitative and quantitative data were collected and analyzed to examine the case. Scholz and Tietje (2002) stated that case studies “are considered an appropriate approach to real, complex, current problems that cannot be treated simply by one of the known analytic methods” (p. 5). Particularly in this study, a convergent design was used in order to enhance the understanding of the case.
A procedural diagram (Creswell & Plano Clark, 2011; Miller & Bustamante, 2016) of the study is provided (Figure 2). The primary qualitative strand is represented in white to the left of the figure. The secondary quantitative strand is depicted in black to the right, which is shown concurrent with the qualitative data collection and analysis procedures, indicated as well by the timeline to the left. The gray ovals indicate the links between the qualitative and quantitative data at the merging and interpretation levels.
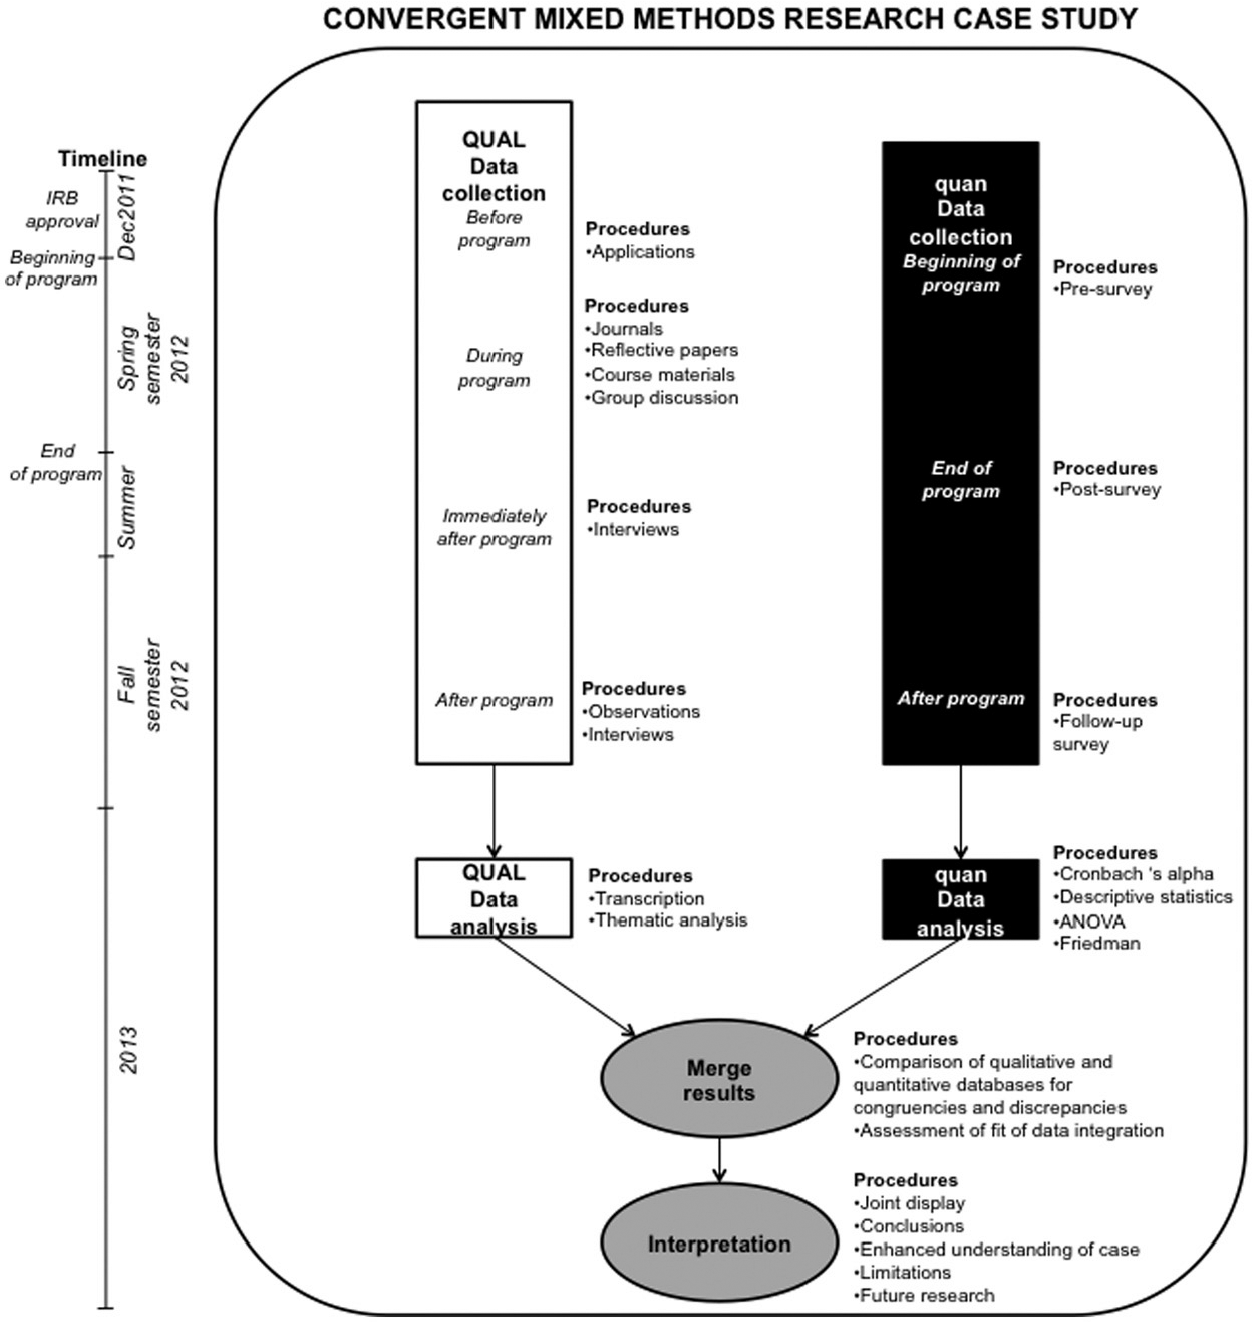
Procedural diagram (Bustamante, 2014).
A case study describes in depth how things are at a particular place and time, with the purpose of allowing the reader to gain an experiential understanding (Stake, 1995). Consistent with Stake’s (2003) approach of selecting information-rich, unique cases, the Web 2.0 for Teachers of Spanish program was selected for this case study because of its unique and innovative features to provide professional development on technology for foreign language teachers, while integrating best pedagogical practices and promoting Spanish culture and language development in an online format.
Luck, Jackson, and Usher (2006) provided a definition for a flexible, pragmatic use of case study, “a detailed, intensive study of a particular contextual, and bounded, phenomena that is undertaken in real life situations” (p. 104), where “any set of methods that will help to develop understanding can be used” (p. 105). Other scholars also recognized the value of using qualitative and quantitative approaches in a case study (Jensen & Rodgers, 2001; Yin, 2003), considering observations, surveys, questionnaire, documents, archival records, interviews, written accounts by participants, artifacts, and researcher’s descriptions as valid data sources for this type of research (Yin, 2003). In this convergent mixed methods research case study (Creswell & Plano Clark, 2011), the qualitative and quantitative strands were concurrent and not dependent on the results of the other.
Qualitative Strand
Consistent with case study design (Stake, 1995), multiple data sources were used for analysis. Data from interviews, observations, and documents were gathered. Data collection occurred at different points during the study, as reflected in the procedural diagram’s timeline (Figure 2). During the professional development program, participants wrote a weekly journal and a final essay documenting their learning experience. The last day of the program, a 50-minute group discussion took place, which was recorded. Immediately after the program, participants were individually interviewed about their learning experiences. Last, the semester after the program, the researcher observed participants while integrating the technology tools learned during the program into their teaching. Immediately after each observation, the participants were interviewed again regarding the activities they conducted in the observed class periods, their use of Spanish when talking about technology to their students, students’ motivation when working with Web 2.0 tools, their access to technology in the school, and integration of Web 2.0 throughout the school year.
The two sets of interviews and group discussion were transcribed. These data, together with the documents and observation protocols, were imported into MAXQDA software. Following the theoretical lens that guided this research, the TPACK model (Mishra & Koehler, 2006), the codes were initially categorized according to its three main components: technology, pedagogy, and content. A code map for each component was devised in order to create the themes. Taking into consideration the last stage of analysis in the study—integration of qualitative and quantitative results—within the code maps for technology, pedagogy, and content, the titles of the scales from the ACLTI survey (Moeller, Plano Clark, & Hustad, 2011) used in the quantitative strand were added to each of the three corresponding maps as subcategories. Within each subcategory in the three maps, codes were collapsed into emerging themes, and tables of themes, codes, and passages from the qualitative data sources were generated to sort the results.
To legitimate this analysis, multiple sources of data were used (documents, interviews, observations) in order to cross-validate the results. In addition, the description of the case and the results were sent via email to the participants to check for accuracy. Eleven participants responded to the request for confirmation of accuracy of the results, and all responded affirmatively. A rich, detailed description for each of the themes was developed as well (Creswell & Miller, 2000).
Quantitative Strand
Since this research study aimed to provide an in-depth description of the case, the same sample was used for the quantitative strand, with the intent of measuring the outcomes of the program. This research included pre, post, and follow-up tests. The pretest measured knowledge of technology, pedagogy, and content, and technology integration before the teachers participated in the professional development program, administered during the first day. The posttest measured again the assessed attributes for the participants at the end of the program. Pretest–posttest comparisons provide a clearer reading on the attributes measured than the posttest alone (Creswell, 2002). The follow-up test was administered 6 months after completion of the program. It was intended to measure the effects of the professional development over time, not only after the treatment was immediately completed, when it is more expected to have an effect on the participants. The quantitative analysis was conducted using 17 participants, since one participant did not respond to the follow-up measure.
Two instruments were used to measure the participants’ knowledge in technology, pedagogy, and content, and integration of technology in their classrooms. The first instrument contained items adapted from the Chinese Language Teaching Institute survey (ACLTI; Moeller et al., 2011), which measured knowledge of teaching, pedagogy, and technology specifically for language teachers. The survey consisted of Likert-type scale items for several domains: (1) within pedagogy, classroom practices, assessment, pedagogical beliefs, and methodologies; (2) within technology, technology beliefs, technology proficiency, and technology integration; and (3) within content/Spanish, content knowledge or Spanish proficiency, and professional community with Spanish teachers. The scales in this instrument were organized according to the three main domains within the TPACK model, technology, pedagogy, and content (Mishra & Koehler, 2006).
The second instrument was the TPACK survey (Schmidt et al., 2009), which was based on the TPACK framework, and created to assess teachers’ knowledge of teaching and technology in all discipline areas. This survey collected data using a Likert-type scale on the seven domains within the TPACK: technology knowledge (TK), content knowledge (CK), pedagogical knowledge (PK), pedagogical content knowledge (PCK), technological content knowledge (TCK), technological pedagogical knowledge (TPK), and TPACK.
Again, the ACLTI and TPACK surveys were administered at three different points during the study (pre, post, and follow-up measures), as reflected in the procedural diagram’s timeline (Figure 2). Both instruments were tested for internal consistency reliability.
To analyze the numerical item scores obtained from the surveys, descriptive statistics were obtained to summarize the data. A repeated-measures ANOVA was conducted to determine significant differences from the beginning of the program to the end to the following semester when teachers were implementing the technologies learned in their Spanish classrooms. Because of the small sample size (N = 17) and number of time points (3), a univariate approach with corrected degrees of freedom was employed when necessary. Mauchly’s test of sphericity was used to investigate the violation of the sphericity assumption, which implies that the variances of the differences between all pairs of groups are equal. For scales that consisted of only one item in the TPACK survey, a Friedman test was used. SPSS software was used for all procedures.
Integration of Results and Development of Joint Display
After qualitative and quantitative data collection and analysis occurred, the results from the two forms of data were integrated in order to conduct a mixed methods data analysis (Creswell & Plano Clark, 2011), so inferences from the separate qualitative and quantitative strands as well as meta-inferences across both strands could be made (Teddlie & Tashakkori, 2009). The integration involved comparing the quantitative and qualitative results and assessing whether they were congruent or discrepant (Creswell & Plano Clark, 2011), and determining fit of data integration (Fetters et al., 2013). Results were illustrated using a joint display inspired by the visual representation of the TPACK model. These procedures facilitated thickness and richness of data, or significance enhancement, a rationale for mixing qualitative and quantitative data stated by Collins, Onwuegbuzie, and Sutton (2006).
The joint display developed for this mixed methods research case study is a mixture of a side-by-side display and a comparing results display (Guetterman, Creswell, et al., 2015), since it presents a combination of qualitative and quantitative results to provide a single visual representation of the data, and at the same time indicates congruencies and discrepancies in the two databases. It integrates the TPACK model as the basis for its development, which was identified by Guetterman, Fetters, et al. (2015) as an innovation in the use of joint displays. For each TPACK-based category from the data analysis, an assessment of fit of data integration was conducted (Figure 3).
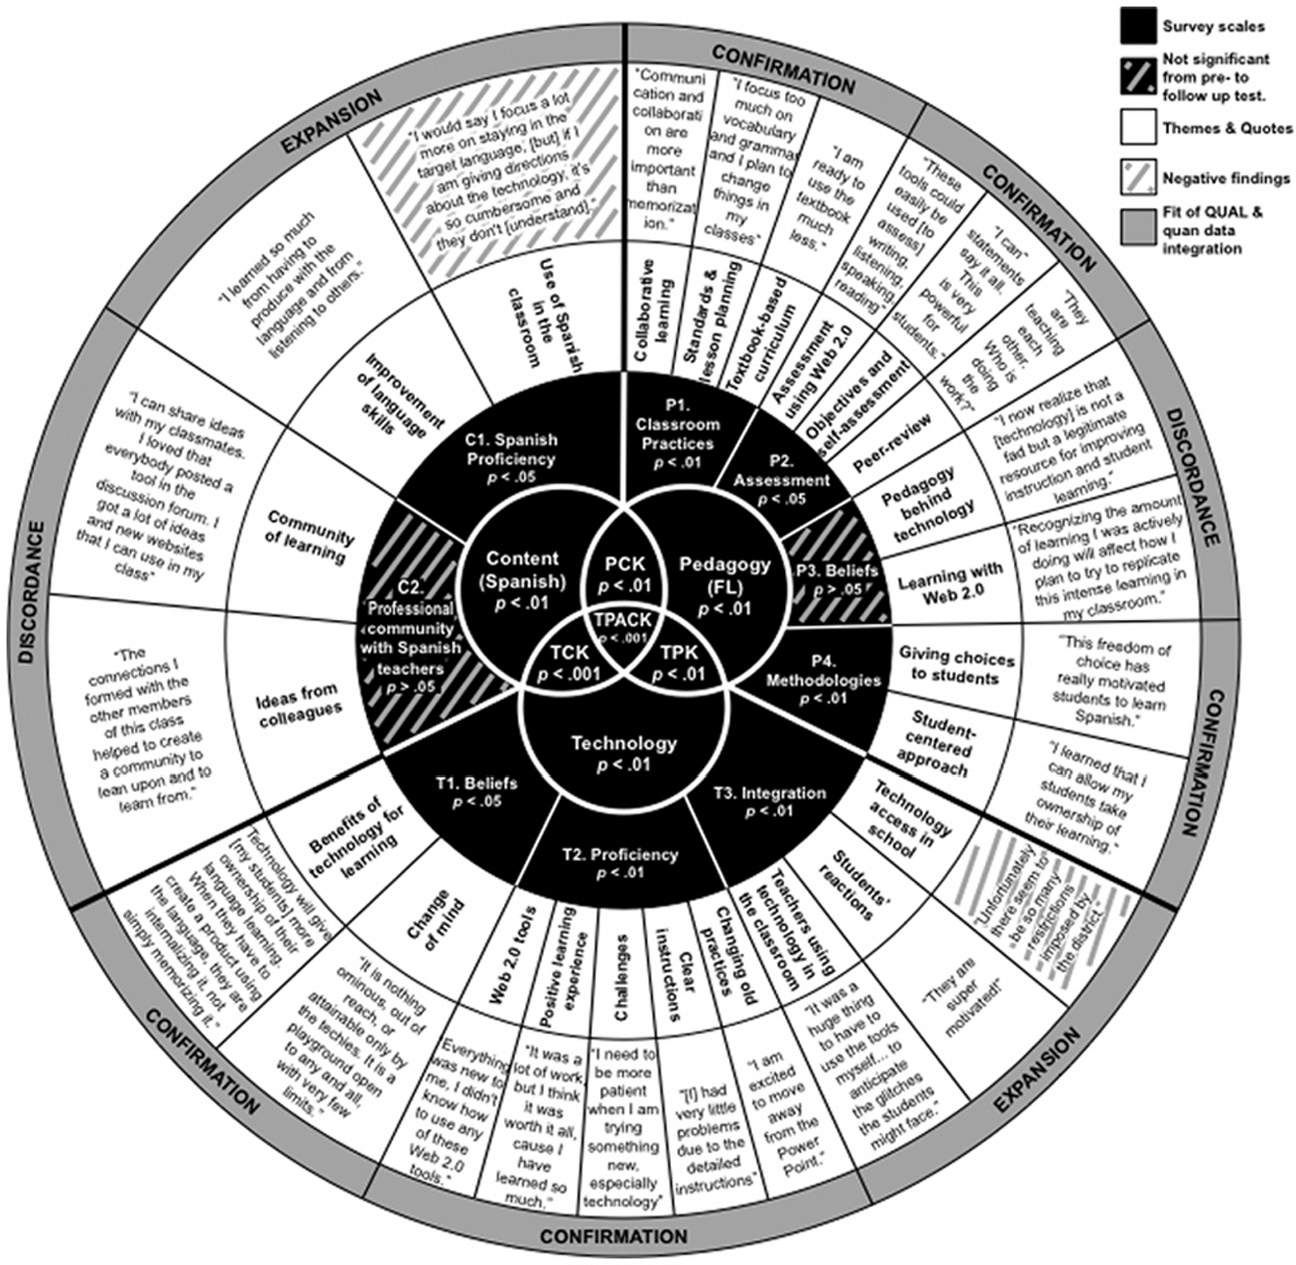
Joint display: TPACK-based integration of qualitative and quantitative data.
The elements of the TPACK model, embedded already in the TPACK survey, were used both for categorization of the scales in the ACLTI instrument, as well as the categorization of codes and themes in the qualitative analysis. This intentional choice in the research process led to integration and to the development of a joint display.
The graphic representation of the three components, technology, pedagogy, and content, was taken into account for the design of the display in order to accurately represent their interrelatedness, as intended by the original theoretical model (see Figure 1). Consequently, developing a circular visual joint display as opposed to a table or matrix made more sense to accurately represent both the results and the underlying theoretical lens.
This joint display is formed by concentric rings that grow around the TPACK model as the starting point and guiding principle for the data analysis (Figure 3). Beginning in the middle and in black, the scales from the TPACK survey (Schmidt et al., 2009) are represented in each component of the TPACK model. Since the survey scales directly match the components of the model, it seemed logical to include the quantitative results at the initial point. The first ring, also in black, included the scales from the ACLTI survey, together with corresponding significance values, distributed according to the components of the TPACK model as well, following the categorization from the data analysis. These values indicate growth from the baseline in participants’ knowledge of technology, pedagogy, and content.
The second and third rings, in white, include the corresponding themes and quotes that emerged from the qualitative data in each TPACK-based category representing the participants’ experiences. Scales that produced not significant results from the baseline (pretest measure) and negative qualitative results are indicated in a line pattern as a way to represent lack of confirmation or congruency.
Last, the outward ring, in gray, indicates the convergence of the qualitative and quantitative results, based on fit of data integration, by using the words confirmation, expansion, and discordance (Fetters et al., 2013). The structure of the diagram visually conveys merging of data as opposed to connecting data, so it is consistent with a convergent design.
The same as with the procedural diagram, black represents quantitative data, white qualitative data, and gray represents the mixing of black and white, in this case, integration of quantitative and qualitative data. The key on the right-upper side clearly indicates whether data are qualitative or quantitative, and fit of data integration.
Guetterman, Creswell, et al. (2015) identified the visual representation of the integration of qualitative and quantitative data as a difficulty, due to the lack of software applications that facilitate it. Qualitative software such as MAXQDA® (http://www.maxqda.com/) includes mixed methods tools to create tables and figures to visually represent data integration. However, when a theoretical framework is also integrated, as in the case of the joint display presented in this article, a more graphics-oriented software is needed. A graphic design or simpler visual software such as PowerPoint® (http://office.microsoft.com) has been identified as a useful tool to represent visual elements in mixed methods research, for example, procedural diagrams (Miller & Bustamante, 2016). In this case, PowerPoint® was used to develop the joint display, using basic shapes, lines, and fill effects.
Summary of Results From the Integration Phase, Based on Fit of Data
Regarding the fit of the qualitative and the quantitative data, the merging of results culminated in confirmation, expansion, and discordance (Fetters et al., 2013) at diverse points, based on the three components of the TPACK model (Mishra & Koehler, 2006). If participants’ experiences in the professional development program as revealed in the qualitative results were positive, and the corresponding quantitative scales reported significant growth in participants’ knowledge, then integration of data culminated in confirmation. If participants’ experiences were positive, but the corresponding quantitative scales did not report significant growth in participants’ knowledge, integration of data culminated in discordance. Last, when participants’ experiences were negative, but the corresponding quantitative scales reported significant growth in participants’ knowledge, integration of data culminated in expansion, since in this particular case the results revealed the need for further exploration.
Pedagogy
The benefits of this type of professional development were positively discussed by the participants, as reflected in all themes and corresponding quotes in the qualitative data in the joint display. Indicated in the outer integration ring, confirmation of qualitative and quantitative results was evident in classroom practices, assessment, and methodologies, via positive quotes and significance levels on the corresponding scales.
However, the analysis revealed discordance in the area of pedagogical beliefs. The qualitative results indicated the connection between technology and pedagogy made by the participants, thanks to the readings and discussions during the program. This connection generated a change in appreciation about technology and helped the teachers talk to others about the benefits of well-planned activities with Web 2.0 in the language classroom. Nevertheless, the quantitative scale reported no significant growth in this area (M pre = 44.941, M post = 46.471, p > .05; M pre = 44.941, M follow-up = 46.765, p > .05). Scores were strong from the baseline. When re-examining the items in the scale, this discrepancy between the qualitative and the quantitative data might have been expected. The learning reported in the qualitative data is based on the relationship between pedagogy and technology, but the items in the scale did not include any technology-related words. Also, it might be considered normal that a teacher who believes in sound pedagogy would want to participate in professional development specific for teachers in his/her area and improve his teaching practices, therefore the strong scores from the baseline.
Even though the scale from the ACLTI survey did not report significant growth, the results from all pedagogy-related scales from the TPACK survey, support the qualitative results (Pedagogical Knowledge: M pre = 28.588, M post = 30.176, p < .05; M pre = 28.588, M follow-up = 31.941, p < .01; Pedagogical Content Knowledge: M pre = 3.940, M post = 4.235, p > .05; M pre = 3.940, M follow-up = 4.353, p < .01; Technological Pedagogical Knowledge: M pre = 32.294, M post = 41.059, p < .001; M pre = 32.294, M follow-up = 40.471, p < .01).
Although the qualitative results and quantitative results regarding pedagogical beliefs revealed discordance, the qualitative results provided evidence for the effectiveness of the professional development program. In this case, the discrepancy is more related to the wording of the items in the scale than to a lack of learning from the participants, as it was evident in the qualitative data. In this regard, the integration of data in a convergent design was beneficial not only for complementarity, but also to illuminate issues in a quantitative instrument. In this specific case, the scale pedagogical beliefs generated contradicting results with the results from the qualitative strand, showing that there were problems with the wording of the items.
Technology
The participants reported positive learning experiences in all analyzed areas in the qualitative data, as reflected in all but one theme in the joint display. Indicated in the outer integration ring, confirmation of the qualitative and the quantitative results was evident in technological beliefs and technology proficiency, again via positive quotes and significance levels on the corresponding scales. However, the integration of results revealed expansion in the area of technology integration in the teachers’ classroom. Although results from the qualitative data indicated an effective integration of technology, as well as very positive students’ reactions to the integration of these tools, participants had varied experiences regarding technology access. Most urban districts restricted significantly the access to the Web 2.0 sites. Also, some teachers complained about lack of computers available for the students or the difficulties to reserve laptop carts or computer labs that are shared with multiple teachers and need to be reserved weeks in advance. In contrast, most teachers in rural areas had better access to technology.
Even though the quantitative results reported significant growth in technology integration (M pre = 37.353, M post = 71.235, p < .01; M pre = 37.353, M follow-up = 67.412, p < .01), which indicates that the professional development program was effective in preparing the participants to do so, the large variation in technology access in the schools evident in the qualitative results—although not controlled by the participants or related to their knowledge of technology—affected technology integration in the classroom. The integration of qualitative and quantitative results illuminated an issue that needs further exploration in future studies in order to expand understanding of the phenomenon of technology integration in the classroom.
Content
The merging of results revealed both expansion and discordance. In the area of Spanish proficiency, indicated as expansion in the outer integration ring, the qualitative results indicated that the program not only helped the participants improve their teaching practices, but also their Spanish language skills. Supporting these results, significant growth was indicated by the quantitative data (M pre = 15.235, M post = 16.706, p < .01; M pre = 15.235, M follow-up = 17.059, p < .05). However, these data were self-reported. Inconsistent use of spoken Spanish by the teachers was observed in the classroom. Since the participants were not tested for Spanish proficiency before and after the program, there is no evidence of the effect that the professional development program had on this specific aspect.
Because of the discrepancy between what was reported by the teachers and what was observed in the classroom by the researcher regarding the use of Spanish, it is concluded that the qualitative and quantitative results regarding content knowledge are partially congruent, resulting in expansion as far as fit of data. The integration of data illuminated another area worthy of exploration in future studies in order to expand the understanding of improvement of language proficiency as a result of participation in a professional development program.
In the area of professional community, indicated as discordance in the outer integration ring, the qualitative results indicated the development of a professional community as a very important aspect of the program, regarded as especially beneficial by the participants in rural areas. However, the quantitative scale from the ACLTI survey reported no significant growth in this area (M pre = 14.706, M post = 14.588, p > .05; M pre = 14.706, M follow-up = 15.588, p > .05). A possible explanation is that participants already engaged in dialogue with other teachers before the program, but based on how much this aspect was emphasized in the qualitative results, a more likely explanation is problems with the scale. On further examination of the items, there was no mention of the community specifically created with the colleagues from the professional development program. Therefore, participants could have interpreted the wording from these items as community with teachers in their respective schools.
Qualitative and quantitative results regarding professional community with Spanish teachers are discrepant. In this case, the discrepancy is more related to the wording of the items in the scale than to a lack of community development in the program.
Discussion
The integration of the qualitative results from the interviews, journals, discussions, and observations, and the concurrent survey results, enhanced the description and interpretation of this mixed methods research case study on professional development on Web 2.0 for teachers of Spanish. Providing descriptions on the participants’ experiences while learning and integrating technology, together with the measurement of growth in the three areas of the TPACK model (Mishra & Koehler, 2006), provided a more complete picture and thorough evaluation of this professional development program. While the quantitative data assisted in providing a measure of the participants’ knowledge growth, the qualitative data brought depth and texture to the research study through their voices.
Onwuegbuzie and Johnson (2006) have discussed the need to address validation issues that pertain to mixed methods designs. Creswell and Plano Clark (2011) have defined validity in mixed methods research as “employing strategies that address potential issues in data collection, data analysis, and the interpretations that might compromise the merging or connecting of the quantitative and qualitative strands” (p. 239). They have also provided a list of potential validity threats and strategies when merging data in convergent designs. To minimize potential validity threats, several strategies were used in this study: Regarding data collection, the same sample was used for the qualitative and quantitative strands and separate data collection procedures were used; regarding data analysis, a joint display with quantitative and qualitative results was developed to depict congruency and discrepancy; and regarding interpretation, both qualitative and quantitative results were reported.
The integration of data via a theory-based joint display revealed confirmation, expansion, and discordance between the qualitative and the quantitative results (Fetters et al., 2013). This mixed analysis, as opposed to separate quantitative and qualitative analysis, allowed for a better understanding of the phenomenon and brought insights that otherwise would not have been exposed. Whereas data confirmation brought more credibility to the study, data discordance between positive results from the qualitative strand and nonsignificant results from the quantitative strand illuminated issues with the wording of the items in two of the scales, so integration of data in this convergent design was useful to validate a quantitative instrument. In the opposite case, discrepancy between negative experiences from the qualitative strand and significant results from the quantitative strand illuminated issues of expansion that may lead to future research. The theoretical model not only helped the researcher in conceptualizing the integration of data, but it was also useful in visualizing the comparison and fit of the results in the joint display.
Overall, integrating qualitative and quantitative results in this case study was useful to evaluate this professional development program, as it afforded the flexibility to collect data adequately suited for addressing both the development of participants’ knowledge and their experiences. Traditionally, studies that used the TPACK model as a theoretical lens were quantitative in nature, and a few used qualitative methods. In this study, the results from the qualitative strand provided a deeper and more detailed picture of the phenomenon that would not have been possible by the exclusive use of quantitative methods. Also, the integrated results analysis using the joint display revealed congruencies and discrepancies between the qualitative and quantitative data that allowed for a better understanding of the case.
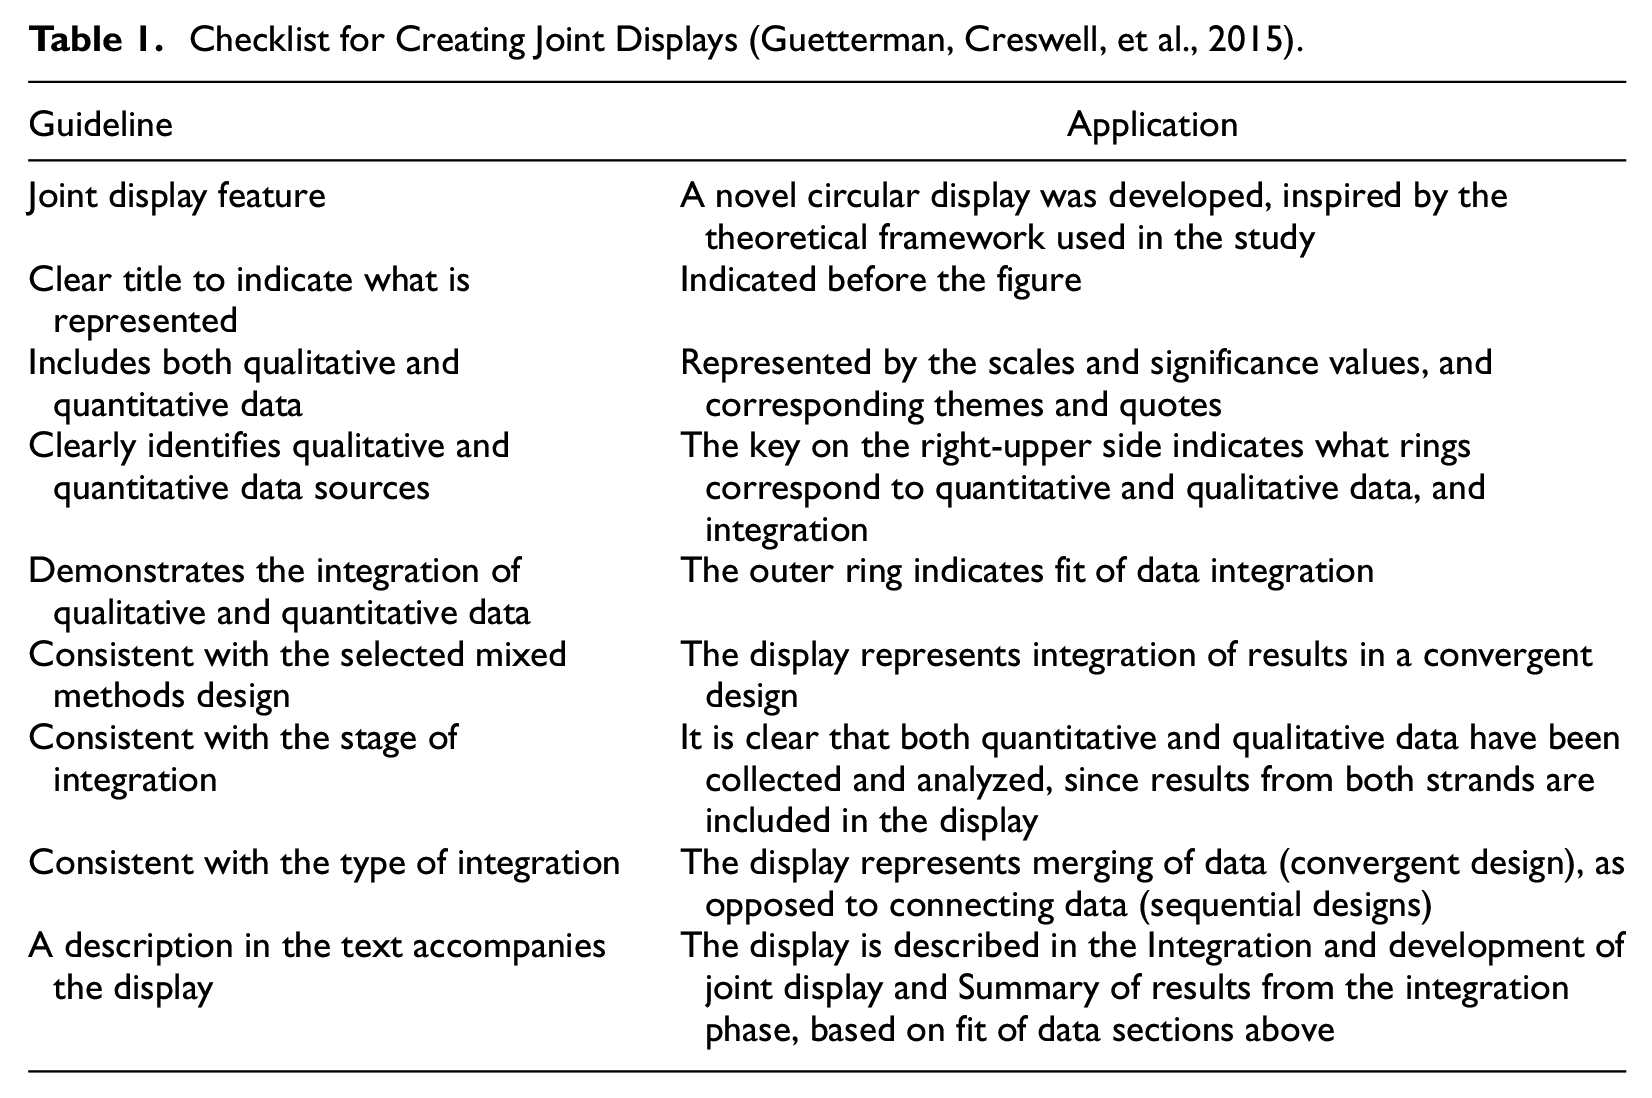
When creating joint displays, Guetterman, Fetters, et al. (2015) recommended the following best practices: “(1) label quantitative and qualitative results, (2) be consistent with the design, (3) be consistent with the integration approach, and (4) identify inferences or insights generated” (p. 560). Furthermore, Guetterman, Creswell, et al. (2015) developed a checklist for creating joint displays that includes all elements necessary not only for the researcher to best represent the integration of data, but also for the reader to gain a better understanding of this mixing stage. These elements were applied in the joint display presented in this article (Table 1).
Checklist for Creating Joint Displays (Guetterman, Creswell, et al., 2015).
In sum, using a theoretical model proved useful not only to guide the qualitative and quantitative data collection and analyses, but also to data integration. As common components were identified for both strands, in this particular case technology, pedagogy, and content, the comparison of qualitative and quantitative results for fit of data was facilitated. In addition, taking into account the original graphic representation of the theoretical model allowed for a coherent organization of both types of data. This resulted in a simplified picture of the results of the study that showed whether congruency or discrepancy occurred, as asked by the mixed methods question.
Conclusion
Empirical research using the TPACK model (Mishra & Koehler, 2006) has been very limited in the areas of foreign language and professional development. Using this framework as a theoretical reference for the evaluation of the program proved valuable, since it guided the categorization of the vast amount of data collected in an effective way, in the initial and separate qualitative and quantitative analyses. In addition, the TPACK model also provided a common framework for data integration using a joint display. The use of displays allows researchers to “be creative as they develop matrixes to fit their needs” (Creswell & Plano Clark, 2011, p. 228). The development of a joint display based on a theoretical model, in this case the TPACK, that visually presents both significant and not significant results, positive and negative results, and that is not represented in a table format, provided an innovation that enhanced the understanding of this particular case.
The joint display presented in this article demonstrated the use of a theoretical framework in the data integration process in a mixed methods research case study, analyzed using fit of data. In addition, it followed recent guidelines for the development of joint displays. It is the hope of the author that this innovative visual representation of qualitative and quantitative integration of results will serve as an exemplar for researchers and readers, and as a springboard for discussion on varied and creative ways to visually represent the data integration process, one of the most challenging elements in mixed methods research.
Footnotes
Acknowledgements
The author would like to thank Dr. Aleidine J. Moeller for the opportunity to participate in this project and her advice and feedback during the research process and Theresa McKinney for her guidance in the data mixing process.
Declaration of Conflicting Interests
The author(s) declared no potential conflicts of interest with respect to the research, authorship, and/or publication of this article.
Funding
The author(s) disclosed receipt of the following financial support for the research, authorship, and/or publication of this article: The author thanks the University of Nebraska–Lincoln for the financial support via the Day Dissertation Award and the National Federation of Modern Language Teachers Associations via the Modern Language Journal Dissertation Support Grant.