
Abstract
Integration is a hallmark of mixed methods research and is constantly evolving. Joint displays have emerged as an effective method of integration at the analysis and interpretation level, facilitating visual comparison of quantitative and qualitative findings to present inferences greater than the quantitative and qualitative findings alone. Although literature reviews and concept analyses frequently precede mixed methods investigations, these are not commonly included in the integration process. To advance mixed methods research, we present a novel method of integrating data sources including rigorous literature reviews using joint display, that builds on the concept of creating a sum that is greater than quantitative and qualitative findings alone, with examples from two research studies.
Introduction
Mixed methods research integrates qualitative and quantitative data and is recognized as the third research paradigm (Creswell & Plano Clark, 2018; Johnson et al., 2007). Utilizing mixed methods often provides more ‘…informative, complete, balanced, and useful research results’ (Johnson et al., 2007, p. 129) compared to quantitative or qualitative methods used in isolation. The application of mixed methods research fosters the understanding of complex issues which is essential for solving real world problems (Molina-Azorin & Fetters, 2019). Mixed methods research has become increasingly popular in recent years, especially in social and behavioral sciences (Timans et al., 2019) and, like all areas of research, is continually evolving (Creswell & Garrett, 2008; Timans et al., 2019).
Integration, which is an essential component in mixed methods research, is a process where researchers intentionally draw together quantitative and qualitative approaches (Creswell, 2015; Guetterman et al., 2015; Younas et al., 2020). Despite being a hallmark of mixed methods research, integration is not clearly developed or practiced and when it occurs, integration varies based on the design used (Guetterman et al., 2015; Halcomb & Hickman, 2015; Ivankova et al., 2006; O’Cathain et al., 2010). While improvements have been made, with new publications to assist researchers to understand and practice integration, issues with suboptimal integration continue to be frequently observed in published empirical mixed methods studies (Fetters & Tajima, 2022; Granikov et al., 2020; Irvine et al., 2019). Fetters and Freshwater (2015) discuss the need to address the ‘integration challenge’ in order to maximize the benefits of integration, that is to achieve a sum greater than the individual qualitative and quantitative parts. Mixed methods researchers create studies that can include integration at the design, methods and interpretation and reporting levels (Fetters et al., 2013).
To characterize how integration occurs, Leech and Onwuegbuzie (2009) suggested three key considerations for mixed methods study designs; the level of mixing, time orientation and the emphasis of approaches. These considerations encompass whether the methods are fully or partially mixed, whether methods are used concurrently or sequentially and whether the quantitative or qualitative approaches have equal versus dominant status (Leech & Onwuegbuzie, 2009). In a literature review of mixed methods design typologies Nastasi et al. (2010) embedded the concepts described by Leech and Onwuegbuzie (2009) into a range of criteria used to classify studies, and summarized the existing typologies as Types I through to VI, distinguishing between basic and complex typologies.
At the methods level, four main systematic integrative techniques are described in the literature: connecting, building, merging and embedding (Creswell & Plano Clark, 2018; Fetters et al., 2013). Connecting is when one type of data links with the other through the sampling frame, building is when one data collection procedure informs the other data collection approach used, merging refers to bringing together and comparing quantitative and qualitative data and embedding involves linking data collection and analysis at multiple points (Fetters et al., 2013). There is recognition that there is often uncertainty about how to integrate the data collected for mixed methods studies (Bryman, 2007; Fetters, 2020). This uncertainty may result in data that are not integrated or limited integration of data (Bryman, 2007).
In order to address this uncertainty, Creswell and Plano Clark (2018) proposed that four key elements are required to achieve integration: (i) the rationale for using data integration, (ii) a clear explanation of the procedures for data analysis and integration, (iii) a description of how the integrated findings will be represented and (iv) interpretations of the integrated results. Younas et al. (2020) suggest that the first two elements (i, ii) can be addressed through narrative discussion in the methods sections and joint display development, and analysis can be utilized to address presentation (iii) and interpretation of integrated results (iv). At the interpretation and reporting level, Fetters et al. (2013, p. 2142) outline three approaches for the integration of data as ‘(1) integrating through narrative; (2) integrating through data transformation; and (3) integrating through joint displays’. This paper focuses on the integration of findings from the literature with quantitative and qualitative data into joint displays.
Integration Using Joint Display
Three main uses of joint display approaches have recently been outlined by Fetters and Tajima (2022) namely, joint displays of mixed methods findings, analysis or integrated data collection. All three forms of joint display can help researchers to visualize integration at different stages of the research process. Joint displays can be used to plan data collection, to assist research teams in the analysis process and to present integrated findings (Fetters & Tajima, 2022). This article focuses on joint display in the context of the analysis and presentation of mixed methods findings.
Analysis of data through joint display involves visual presentation of findings to facilitate side-by-side comparison (Haynes-Brown & Fetters, 2021) and is considered to be an efficient way to compare different data sources (Bazeley, 2018). Published examples of joint displays have included data presented using tables (Johnson et al., 2019), diagrams (Bustamante, 2017), graphs (Haynes-Brown & Fetters, 2021), matrices (Younas et al., 2020) and data presented in multiple joint displays used to consolidate findings illustrated in a circular visual display (Peters et al., 2021). Developing a joint display is an iterative process where the researcher simultaneously compares data sources to assess for ‘fit’ across the sources (Creswell & Creswell, 2018; Fetters et al., 2013; Fetters & Guetterman, 2021; Haynes-Brown & Fetters, 2021). To assess the fit of integration, findings are examined for confirmation, expansion and discordance (Fetters et al., 2013; Younas et al., 2020). Confirmation occurs when findings from data sources confirm the results of each other, expansion occurs when findings from data sources expand insights and discordance occurs when the findings from data sources are inconsistent, contradict or disagree with each other (Fetters et al., 2013). Developing a joint display is key to the iterative process of identifying areas of confirmation, expansion and discordance in the findings (Younas et al., 2020).
When building a joint display Guetterman et al. (2015) recommend four best practices (i) label quantitative and qualitative results, (ii) be consistent with the design, (iii) be consistent with the integration approach and (iv) identify inferences or insights generated. While there is a growing body of literature on how to build joint displays, Haynes-Brown and Fetters (2021) identified that there is a ‘dearth of replicable techniques in the extant literature’ (p. 2). As an evolving area in mixed methods research, examples that demonstrate differing approaches to joint display are needed to provide guidance to researchers. Recent examples of joint displays in the literature have included using bar graphs in joint displays (Haynes-Brown & Fetters, 2021), the pillar integration process (R. E. Johnson et al., 2019), qualitative-quantitative synthesis in mixed methods reviews (Younas et al., 2020), developing a joint display based on a theoretical model (Bustamante, 2017) and using a conceptual framework to develop a meta-joint display from insights of multiple joint displays (Peters et al., 2021). While these publications provide valuable insights and examples for researchers, they focus on integrating quantitative and qualitative results and do not incorporate other data sources, such as robust reviews of the literature.
Literature as a Data Source
At the same time mixed methods research has developed, literature reviews have continued to evolve. Traditional literature reviews tended not to follow a clear methodology, could be subjective and lack transparency and reproducibility (Aromataris & Pearson, 2014; Lockwood & Oh, 2017). The development of methodological designs to conduct literature reviews has provided a more structured and rigorous approach for researchers to follow. The purpose of the review and inclusion criteria help determine the most appropriate type of review to use to synthesize and critically appraise the literature (Noble & Smith, 2018).
The rise of mixed methods research and the need to integrate and review empirical research from quantitative, qualitative and mixed methods designs has driven the emergence of rigorous and transparent knowledge synthesis, including integrative and scoping reviews, systematic reviews, meta-analyses and meta syntheses, review of theories, rapid reviews and meta-narratives (Booth et al., 2016; Haidich, 2010; Lachal et al., 2017; Peters et al., 2020; Thorne, 2019; Tricco et al., 2018; Whittemore & Knafl, 2005; Wong et al., 2013). Similarly, concept analyses have also developed as a methodology to understand and develop definitions of key concepts. Pioneered by the philosopher Wilson (1963), the methodology of concept analysis has spread and is now used across disciplines.
Rigorous literature reviews and concept analyses are valid forms of data in their own right and often proceed mixed methods research. The ability of these designs to evaluate current knowledge, identify gaps in the research and define concepts are essential in guiding meaningful future research (Foley & Davis, 2017; Noble & Smith, 2018). While this is widely acknowledged (Foley & Davis, 2017; Noble & Smith, 2018), the potential for reviews and concept analyses to be used as legitimate data sources in joint displays, integrated with other data sources, has not been explored. Methodological discussions have illustrated a variety of ways to use joint display to assist with integration, yet to the best of our knowledge integration of quantitative and qualitative data with literature reviews and concept analyses as data sources using a joint display is previously unreported as a methodological approach.
The aim of this paper is to demonstrate the integration of literature sources with original mixed methods research data as an emergent form of joint display development. We present examples from two research studies to illustrate this unique use of joint displays. Each case study used a different mixed methods design: a partially mixed, time-lapsed concurrent, equal status design (QUAN + QUAL) (Leech & Onwuegbuzie, 2009), utilizing observational data (Cooper, 2021); and a two-phase, explanatory sequential design (QUAN → qual) (Ivankova et al., 2006; Tashakkori & Teddlie, 2003) utilizing experimental data (Brennan, 2021).
Example 1: The Impact of Organizational Values on Nurse Resilience (Cooper, 2021)
Context
The resilience of health professionals has gained increasing attention in research and practice in recent years. While there is agreement that resilience is an important characteristic to possess, there is limited knowledge about the factors that influence resilience beyond the individual. To address this gap, a mixed methods research study was designed that aimed to investigate the impact of organizational values on the resilience of nurses working in a value-based organization.
Methods
The research consisted of a concept analysis to define nurse resilience (Cooper et al., 2020), an integrative review to critically appraise research that has investigated nurse resilience (Cooper et al., 2021a), and a quantitative survey and qualitative focus groups to investigate the impact of organizational values on nurse resilience (Cooper et al., 2021b). The process described by Walker and Avant (2011) guided the concept analysis (CA) and the integrative review (IR) was conducted using the framework described by Whittemore and Knafl (2005). The relationship between the study objectives and data sources are presented in Figure 1, where literature sources (CA and IR) addressed some of the study objectives, alongside the QUAN + QUAL data (Teddlie & Tashakkori, 2009). The mixed methods study was summarized as a partially mixed, time-lapsed concurrent, equal status design (QUAN + QUAL) (Leech & Onwuegbuzie, 2009). Integration of literature sources in a partially mixed, time-lapsed concurrent, equal status mixed methods design using joint display.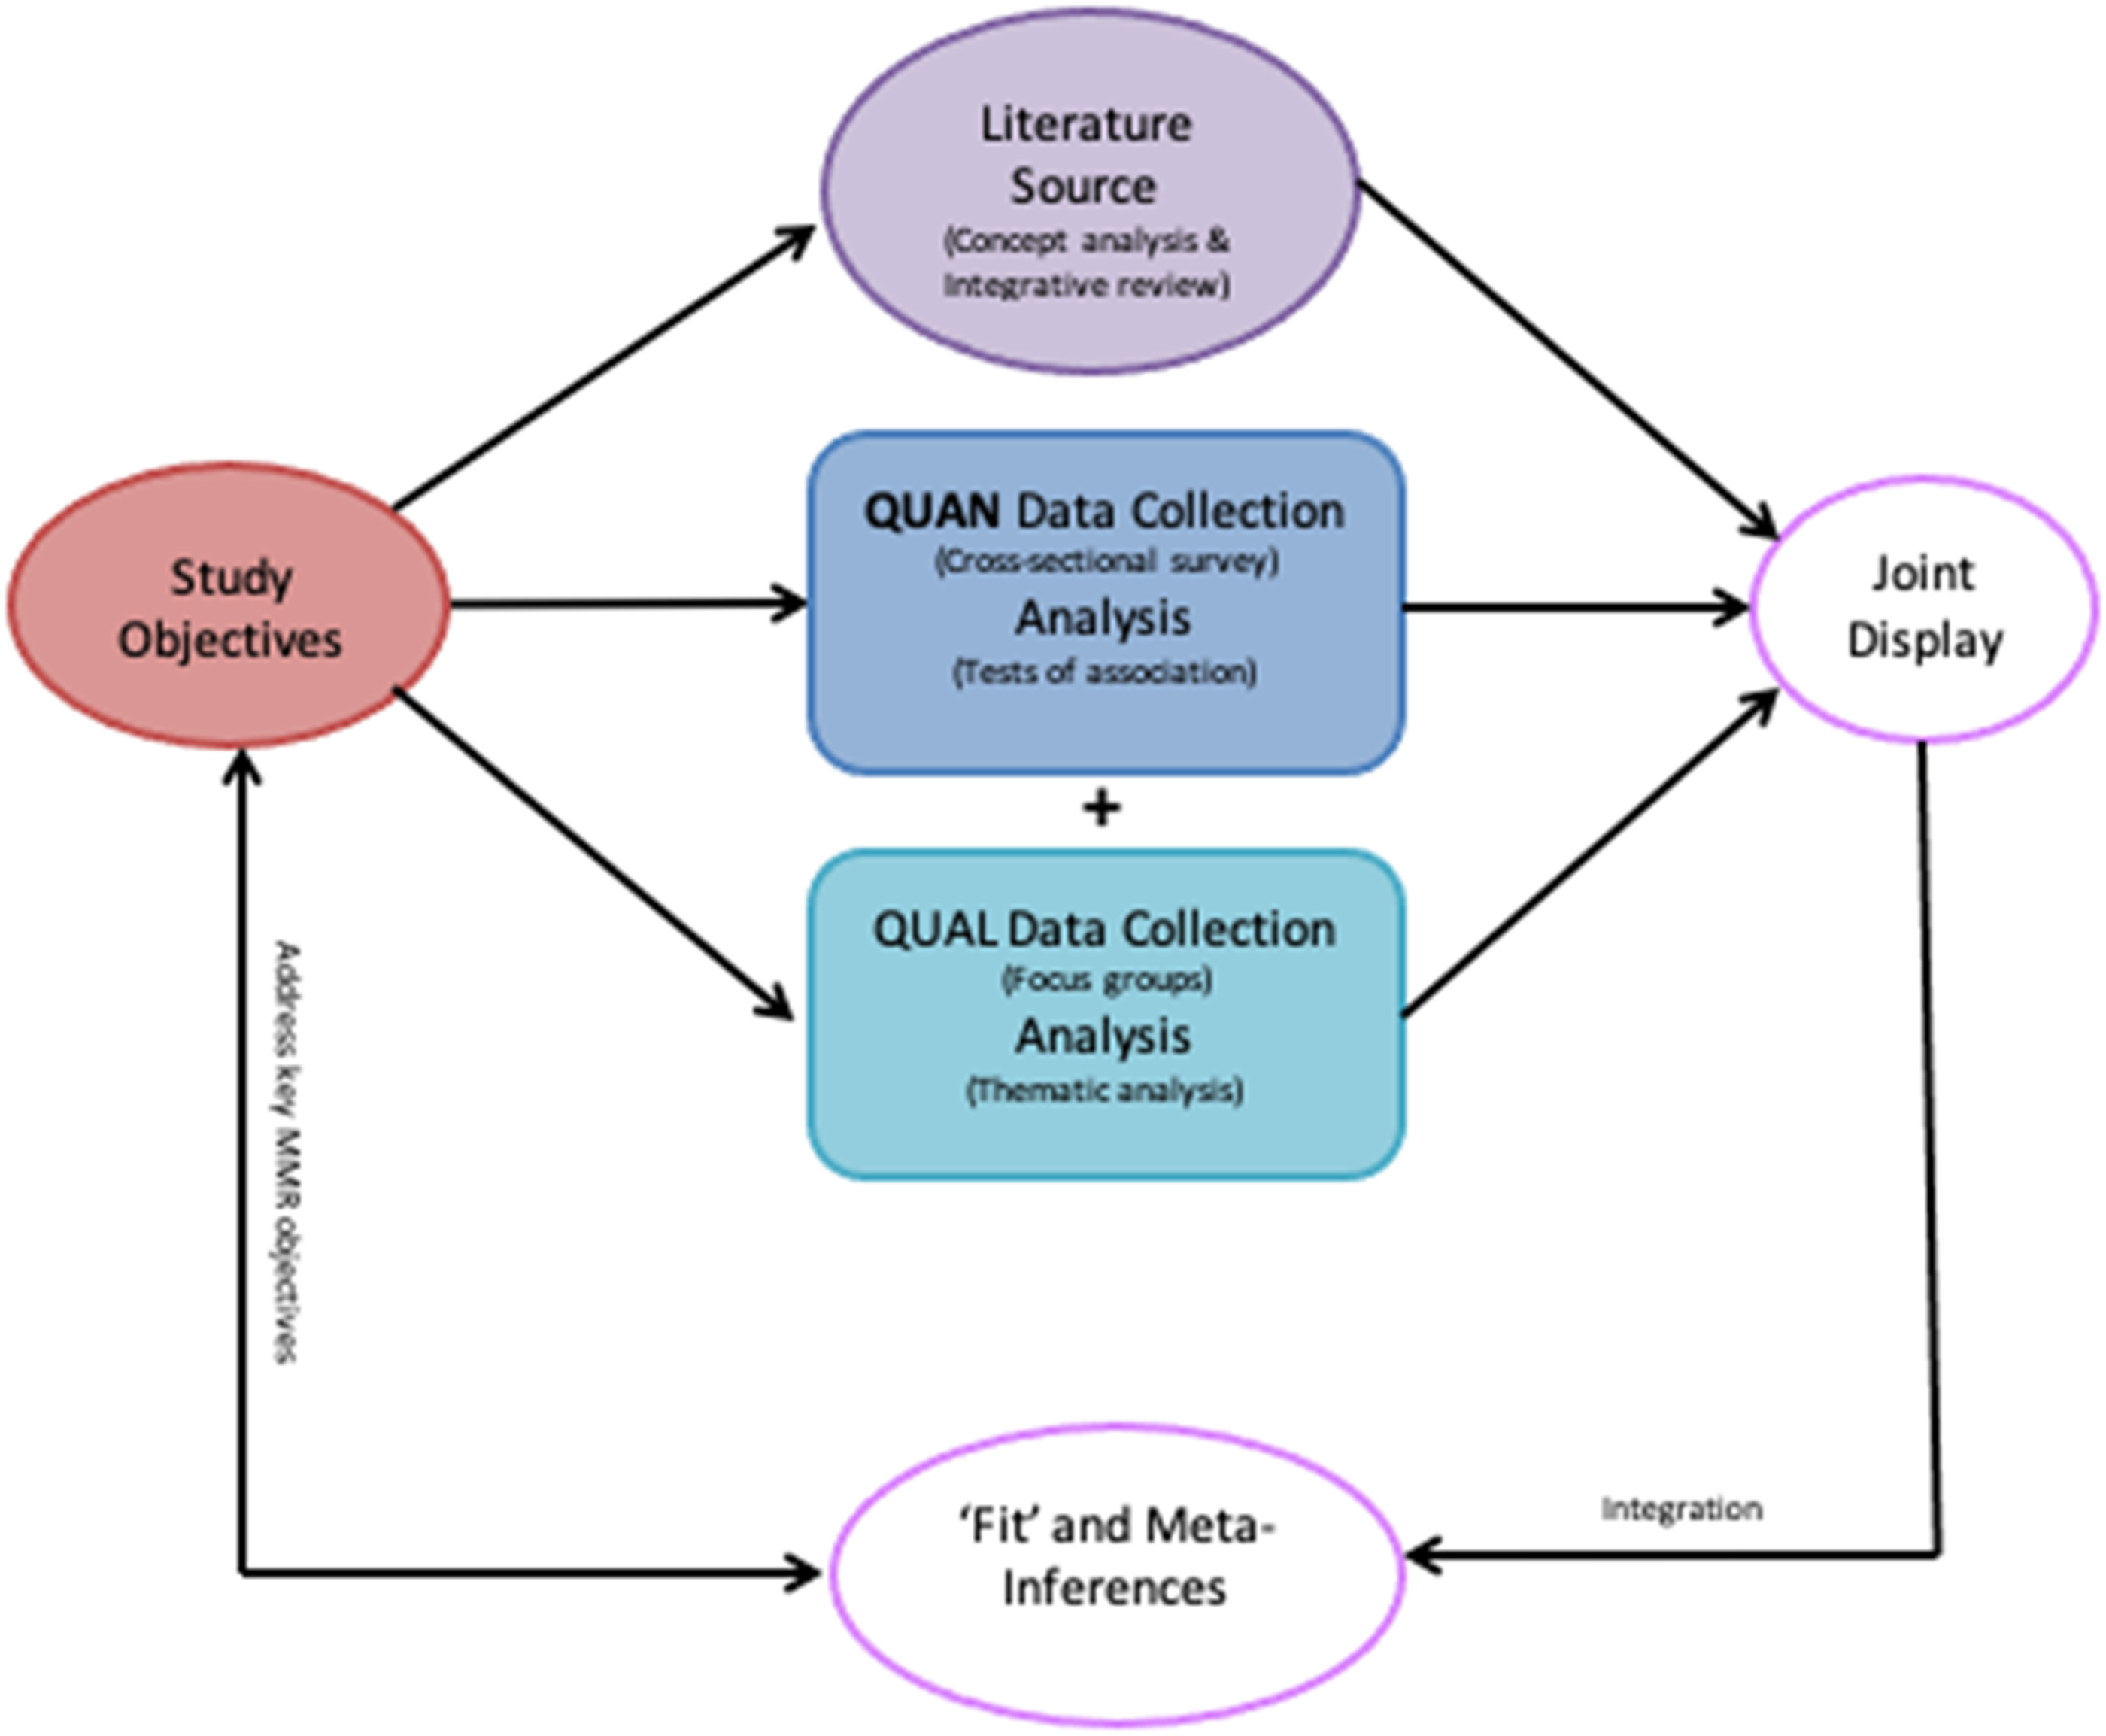
Integration Process
This study utilized integration at the method, interpretation and reporting level, guided by Fetters et al., (2013). Integration occurred at the method level with integration through connecting. Quantitative data were collected via cross-sectional survey in the first phase and qualitative data were collected via focus groups in the second phase. Focus group participants were selected from respondents to the questionnaire. In keeping with the concurrent design, most integration took place after data collection at the interpretation and reporting level, where findings from literature sources, and QUAN, and QUAL results were drawn together (merging). Interpretation and comparison across the four data sources were completed using a joint display.
Cross-Case Analysis Matrix.
Interpretation of the Joint Display
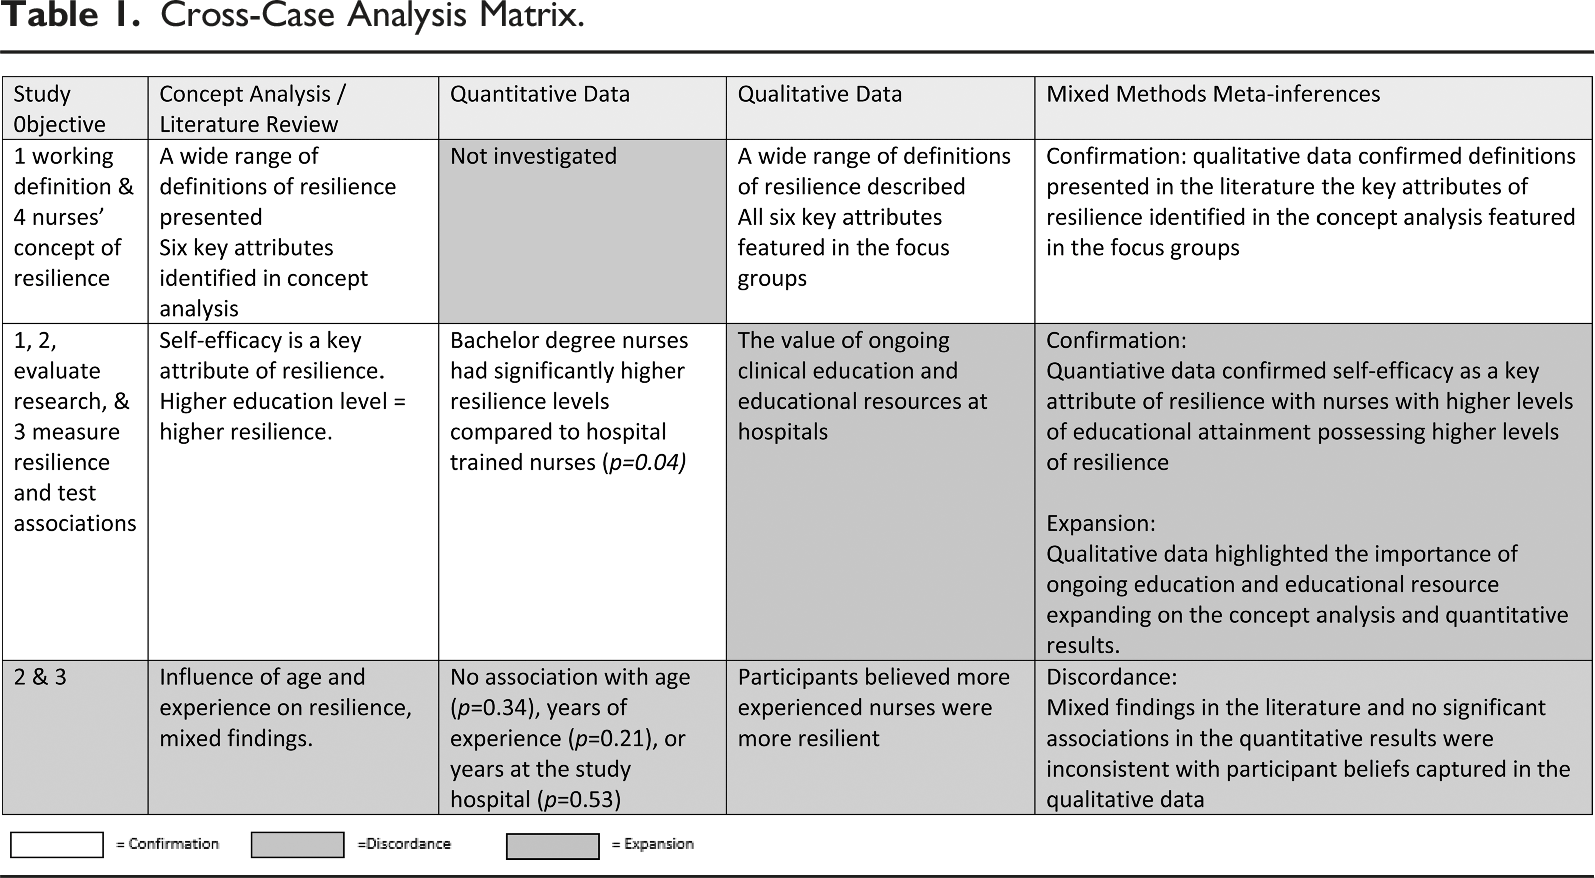
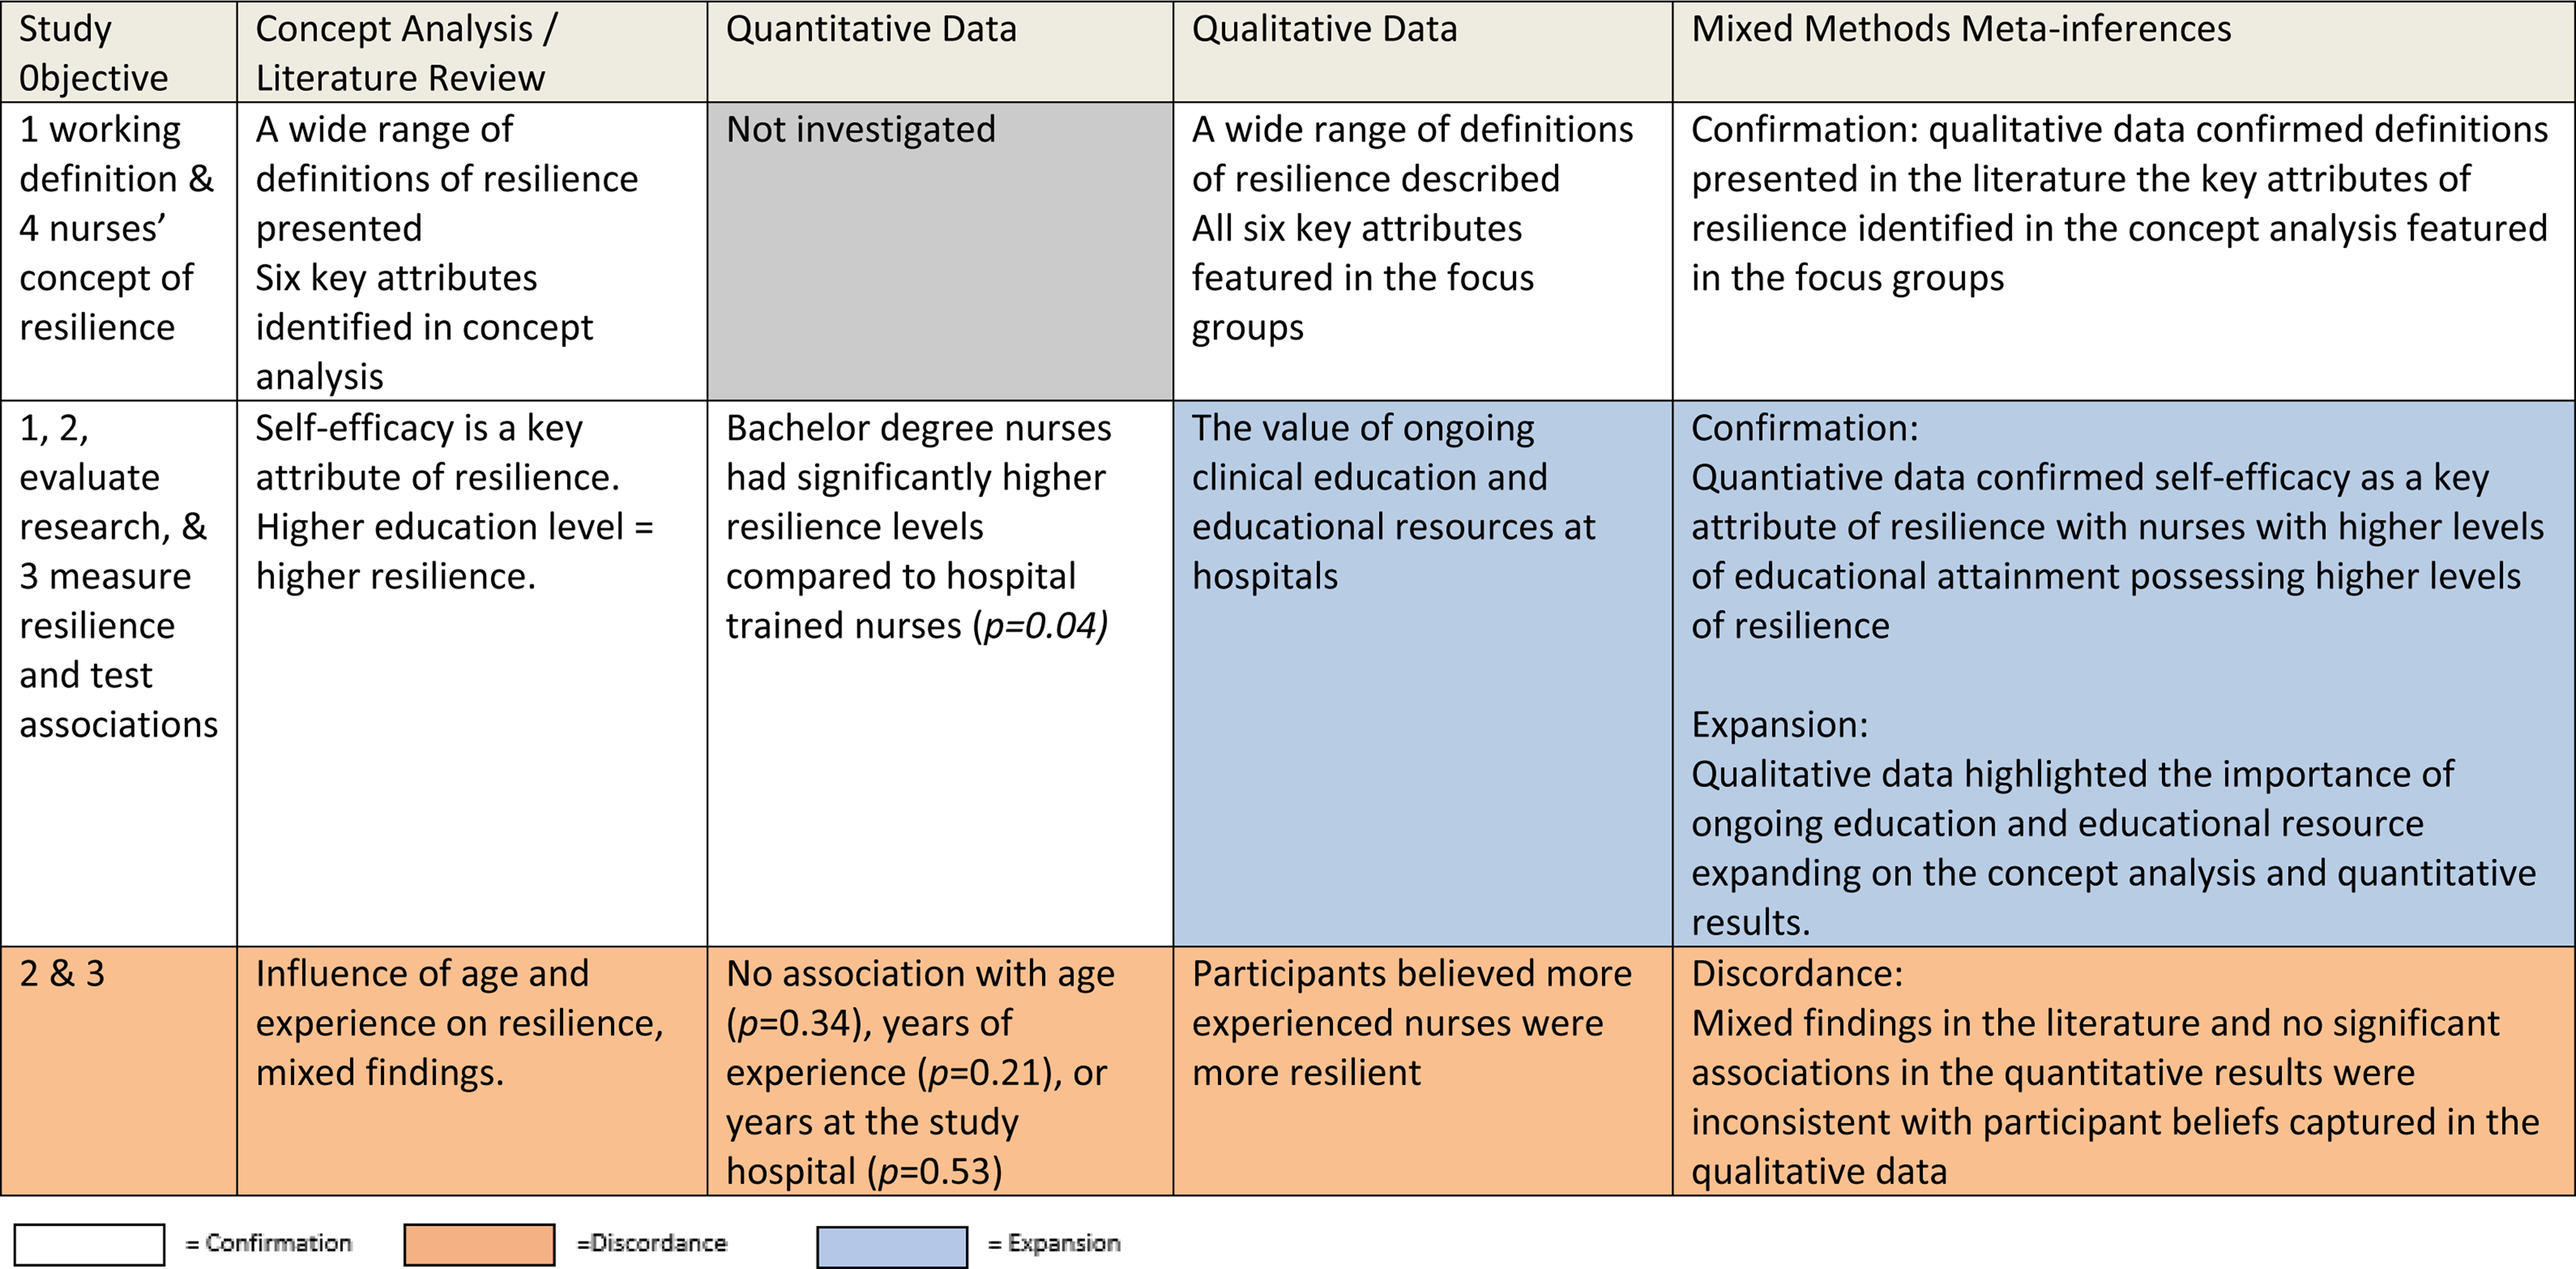
Confirmation was evident between the literature and qualitative data in relation to key findings about definitions of nurse resilience, as displayed in the first row of the excerpt of the joint display (Table 1). Participants’ descriptions of resilience confirmed both the definitions presented in the literature and the key attributes of nurse resilience identified in the concept analysis.
Both confirmation and expansion across data sources was evident with respect to self-efficacy, formal educational attainment and ongoing education, as displayed in the second row of the excerpt of the joint display. The concept analysis found self-efficacy was an attribute of resilience and the integrative review found higher levels of formal educational attainment were associated with higher educational levels. Findings from the quantitative data confirmed Bachelor degree nurses had significantly higher resilience levels compared to hospital trained nurses. The qualitative data expanded on the other sources, with participants highlighting the importance of informal education and access to educational resources at the hospital to sustain nurse resilience.
Discordance across all three data sources was identified in findings relevant to the personal characteristics of age and experience, and nurse resilience, as presented in the last row of the excerpt of the joint display. There were mixed findings about the influence of age and experience on nurse resilience levels in the literature, while the quantitative data found no association between age or years of experience, which was inconsistent with the qualitative data, where participants expressed a belief that resilience increased with experience. The complete joint display was used to finalize the integration process through narrative guided by a comprehensive discussion (Cooper, 2021).
Example 2: Understanding and Addressing Type 1 Diabetes-Specific Barriers to Physical Activity (Brennan, 2021)
Context
Despite the well-founded benefits of physical activity in the type 1 diabetes (T1D) population, rates of inactivity are higher in those living with T1D than the general population (McCarthy et al., 2016; Speight et al., 2011). Due to the complex nature of blood glucose management in response to physical activity, people living with T1D experience unique barriers to activities which may not be addressed using physical activity initiatives aimed for the general population. This research aimed to provide an understanding of the unique barriers and facilitators of physical activity in adults living with T1D and how self-management, group education can be used to address diabetes-specific barriers, specifically fear of hypoglycemia.
Methods
In this example, a systematic scoping review was undertaken to explore the source and quality of existing evidence investigating barriers to and facilitators of physical activity in adults living with T1D (Brennan et al., 2021a), conducted in accordance with the PRISMA-ScR (Tricco et al., 2018) and the Joanna Briggs Institute methodology for scoping reviews (Peters et al., 2020) (Brennan et al., 2020). As shown in Figure 2, the scoping review informed the study objectives of a two-phase, explanatory sequential (QUAN → qual) (Ivankova et al., 2006; Tashakkori & Teddlie, 2003) mixed methods study (Brennan et al., 2021, 2021c). Integration of a literature source in a two-phase, explanatory, sequential mixed methods design using joint display. Note. MMR – mixed methods research, QUAN – quantitative, qual – qualitative, RCT – randomized controlled trial, QA – questionnaire. t1 – Initial workshops, t2 – Booster workshops, t3 – 8 weeks after t2.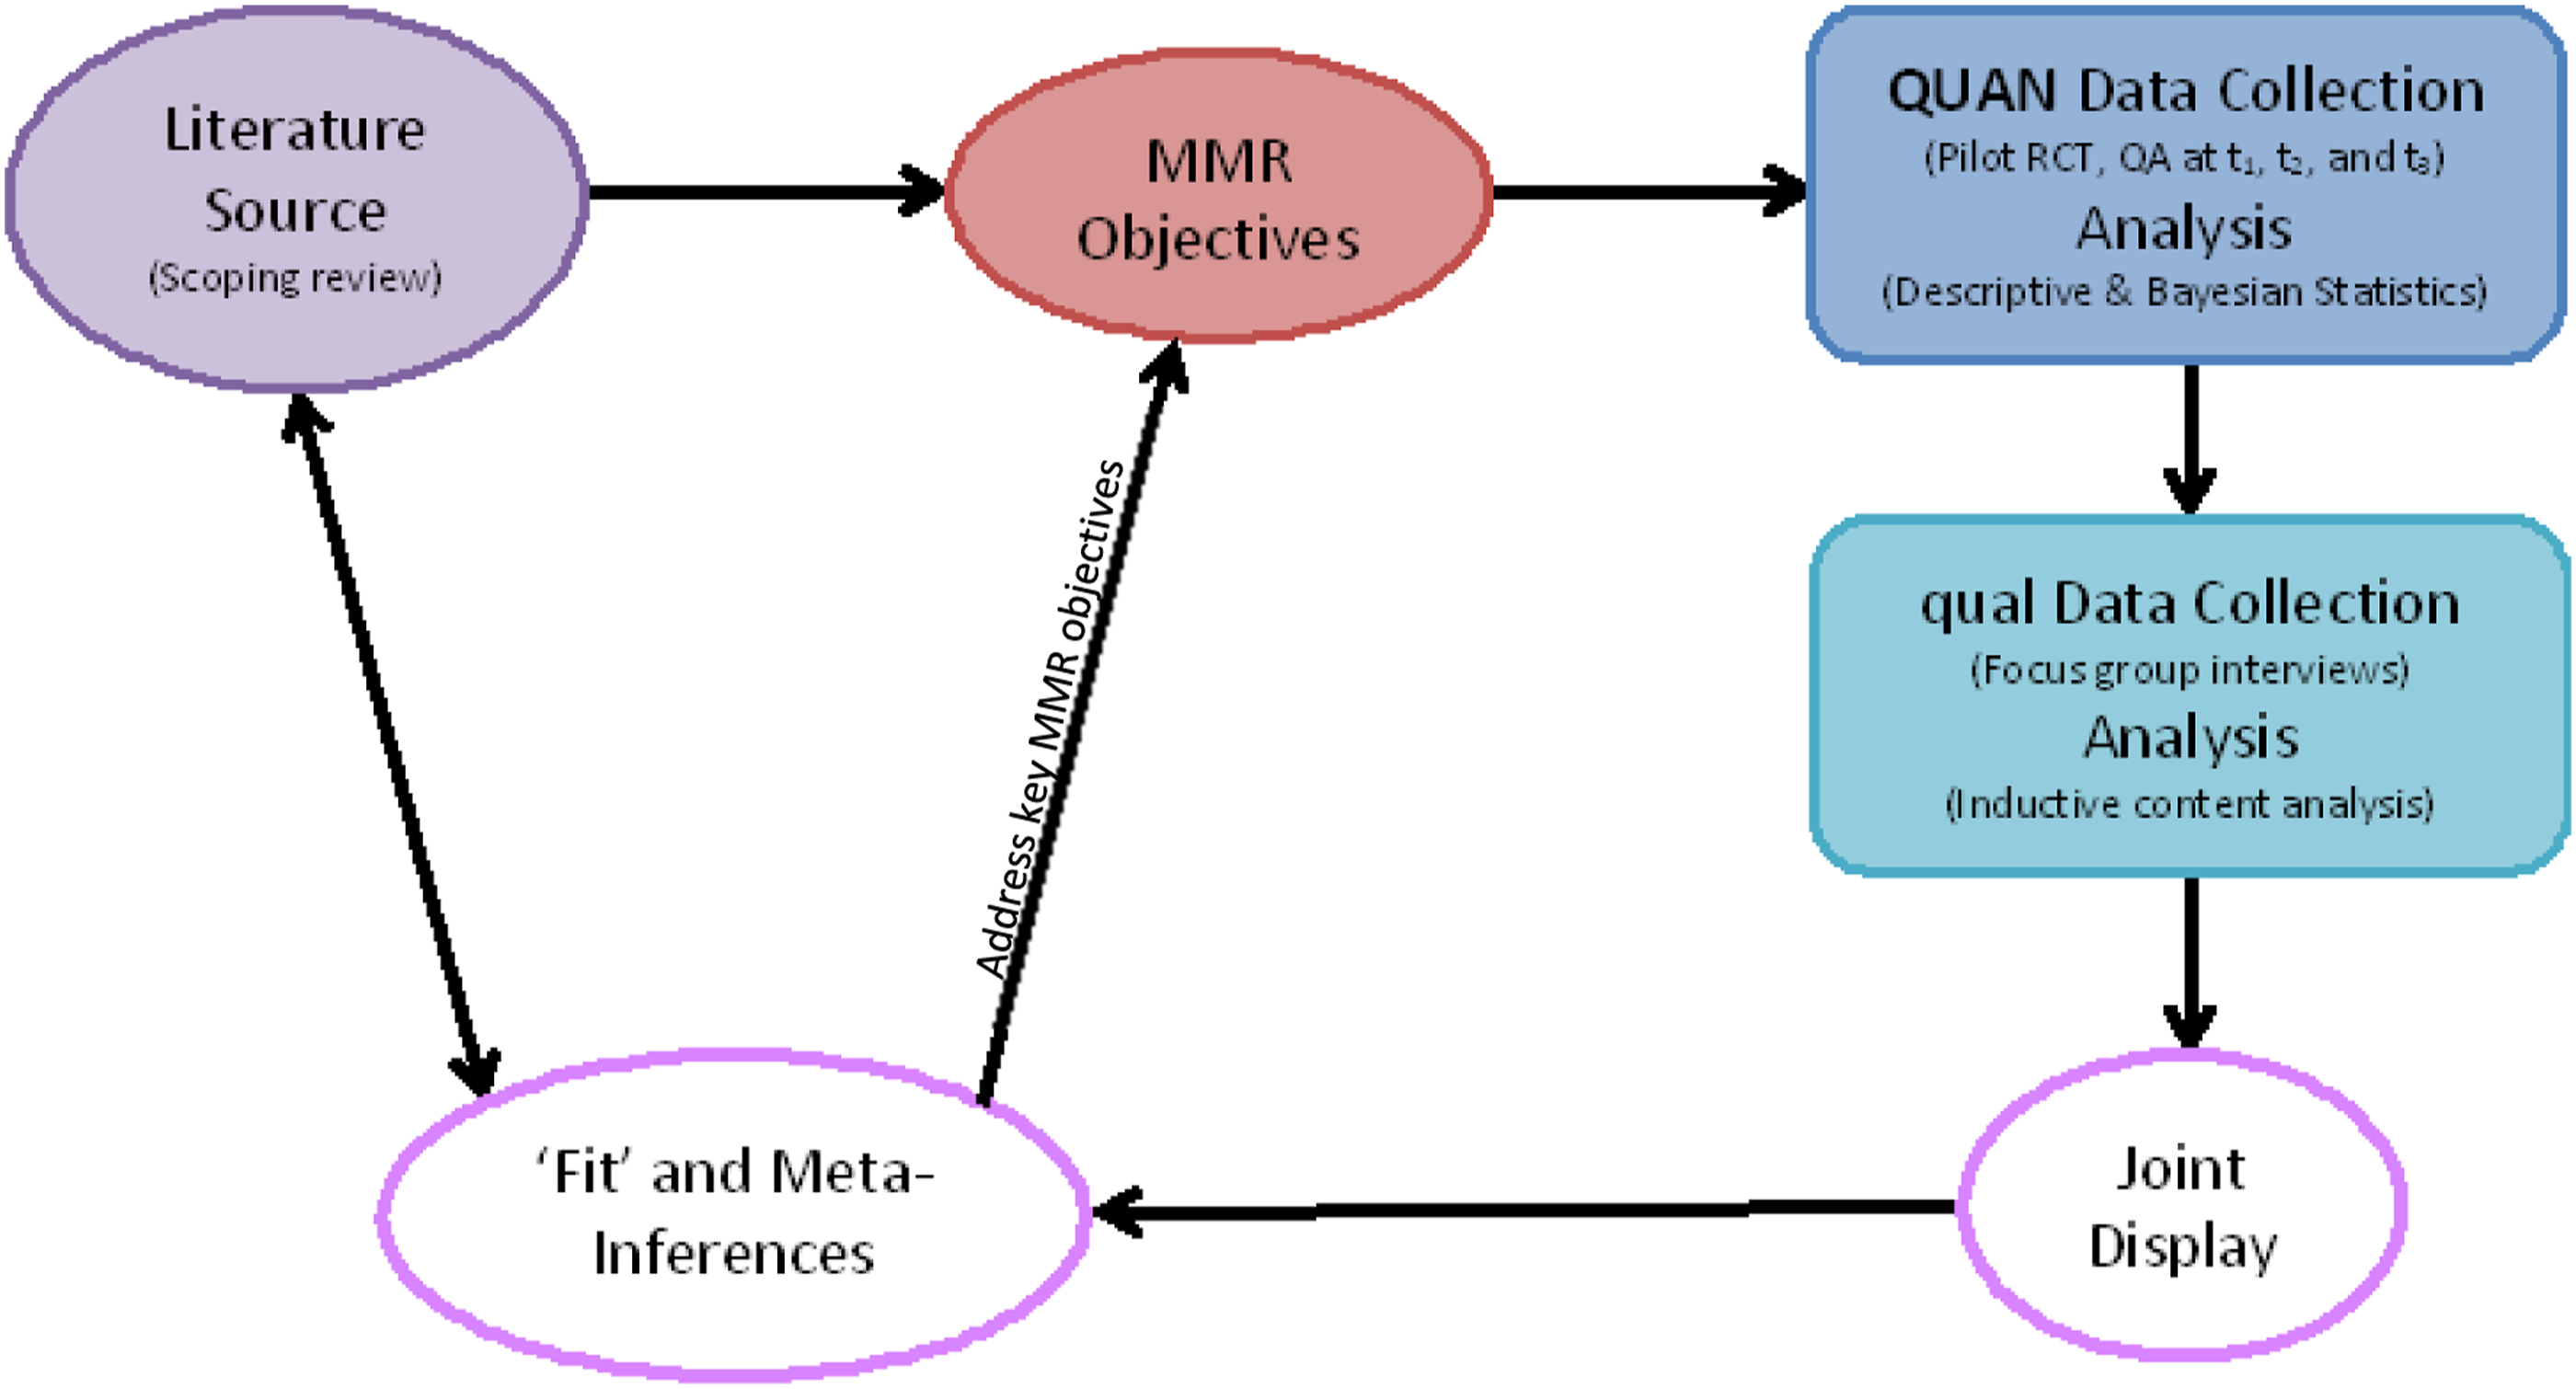
Integration Process
Cross-Case Analysis Matrix.
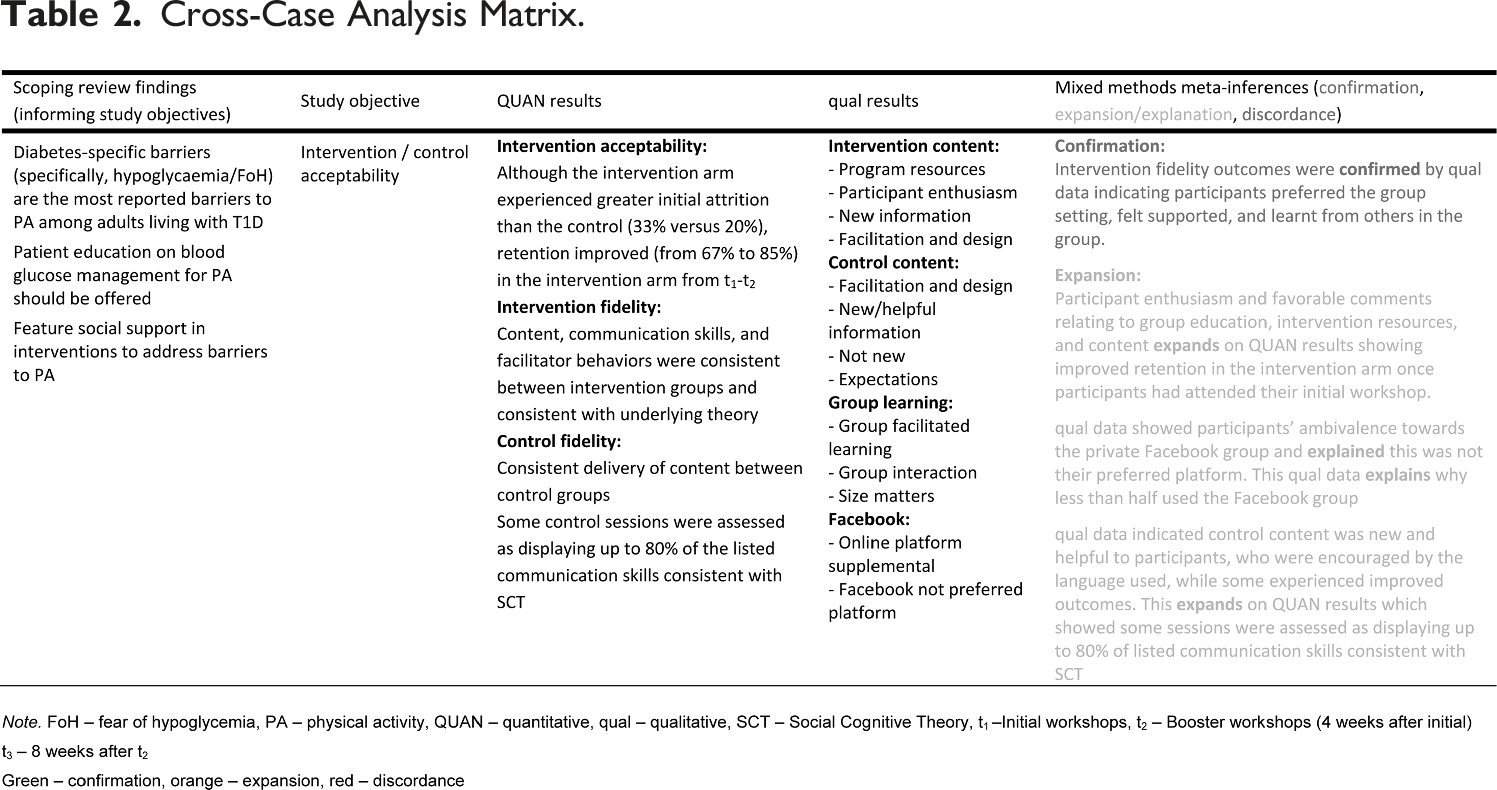
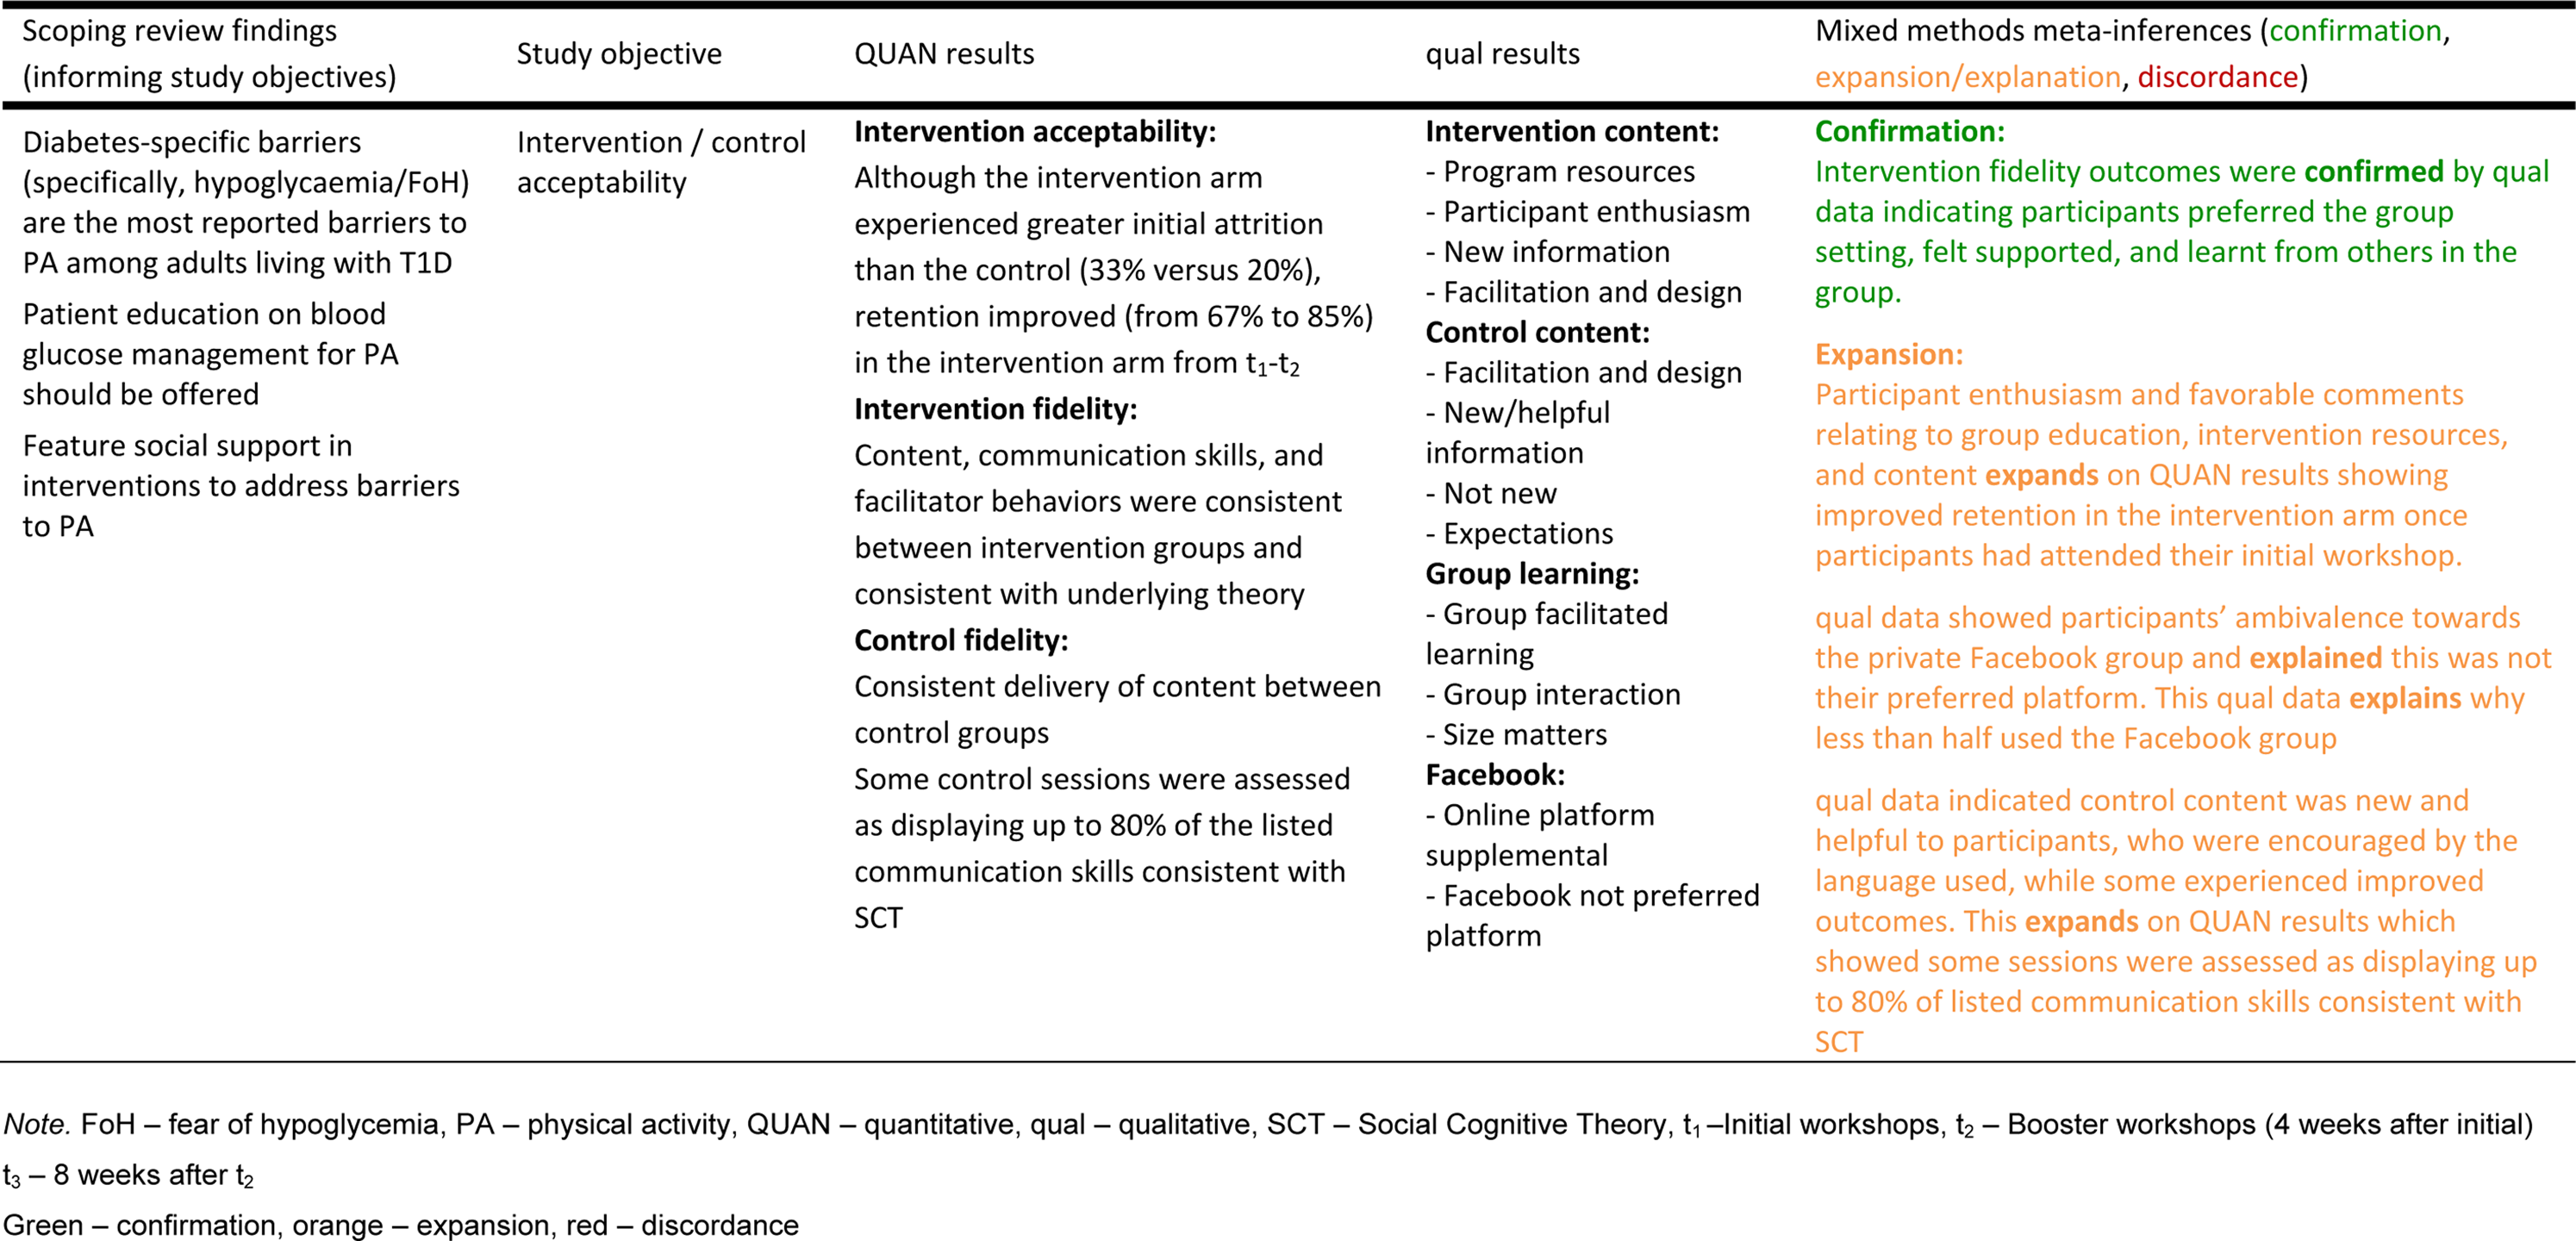
Quantitative and qualitative results were initially analyzed and published separately (Brennan et al., 2021, 2021c). Data were then brought together using a joint display table (partially represented in Table 2). Table 2 first shows how key findings of the systematic scoping review informed the mixed methods study objectives. Quantitative and qualitative results are then presented alongside whole-of-study outcomes and implications. After presenting quantitative and qualitative results side-by-side, the fit of data integration was determined, that is, how the qualitative results confirmed, expanded or in the case of this explanatory sequential design, explained, and or were discordant to quantitative findings (Creswell & Plano Clark, 2018; Fetters et al., 2013). A discussion of how these meta-inferences relate and compare to the original systematic scoping review findings was provided in narrative form (Brennan, 2021).
Interpretation of the Joint Display
As depicted in Table 2, the systematic scoping review called for patient education on blood glucose management and to address diabetes-specific barriers to physical activity in the T1D population. This finding informed mixed methods research objective 2: to determine the acceptability of the intervention and control. Meta-inferences, represented in green, show positive intervention fidelity outcomes were confirmed by qualitative data (see Table 2). Qualitative data expanded on quantitative data pertaining to improved participant retention and infrequent Facebook™ group use, described in orange in Table 2. Finally, qualitative findings expanded (orange) on the quantitative fidelity findings, indicating the control may have provided more than ‘standard care’. This comprehensive mixed methods assessment of intervention acceptability has shown that theory-driven, self-management, group education to address complex diabetes-specific barriers to physical activity was acceptable to adults living with T1D, addressing an important gap identified in the systematic scoping review (Brennan et al., 2021c), displayed in the first column of Table 2.
Discussion
We build on the call from Fetters and Freshwater (2015) to address the ‘integration challenge’ by demonstrating the process and value of integrating literature sources in mixed methods research. The two examples presented in this paper showcase how integration can be achieved in different study designs. Integration of literature sources in mixed methods research is novel and represents an evolution in mixed methods design, requiring a revision of the typologies currently used to describe the level of mixing, time orientation and the emphasis of approaches (Leech & Onwuegbuzie, 2009).
The first example illustrated how data from literature sources (LIT) were synthesized to address study objectives, and could be integrated with QUAN + QUAL data. To clearly articulate the design, this study is best described as a multi-stage, partially mixed, time-lapsed concurrent, equal status mixed methods design, with the new notation expressed as LIT + QUAN + QUAL. This reflects the equal status of each data source and how each data source contributed to addressing the overall study objectives. The second example showed how a literature source was used to inform the mixed methods study objectives and could then be integrated with QUAN → qual data. This design is best described as a multi-stage, explanatory, sequential, mixed methods design, with the new notation lit →QUAN → qual. This reflects the sequential nature of the study with the literature source informing the study objectives and preceding the QUAN and qual phases.
At the methods level researchers need to consider what systematic integrative techniques to use in their study. Connecting, where one type of data links with the other through the sampling frame (Creswell & Plano Clark, 2018; Fetters et al., 2013), is unlikely to apply to the integration of literature sources, but may still exist between the quantitative and qualitative study components. The other three main systematic integrative techniques, building, merging and embedding (Creswell & Plano Clark, 2018; Fetters et al., 2013), can all be used when integrating literature sources. Building was evident in the second example, with data synthesized in the scoping review informing the study design and data collection approach used in the QUAN and qual stages of the study. Both examples demonstrated merging, where literature, quantitative and qualitative data sources were brought together and compared. Embedding occurred in the first example, where qualitative data and literature helped to explain and give context to quantitative results, revealing the contextual factors that could influence nurse resilience and the perceptions and experiences of participants.
For the interpreting and reporting level, we recommend joint display as an effective technique to assist researchers in the side-by-side comparison of literature, quantitative and qualitative data sources. Side-by-side comparison using joint displays enhances the mixed data analysis process and provides a clear representation of the ensuing inferences (Creamer & Edwards, 2022; Fetters & Tajima, 2022; Younas et al., 2020). We describe two examples where this method has allowed comparison of three data sources, to begin an iterative process of determining the ‘fit’ and meta-inferences of the data through confirmation, expansion and discordance (Brennan, 2021; Cooper, 2021; Fetters et al., 2013; Younas et al., 2020). Building on the four best practices for developing a joint display outlined by Guetterman et al. (2015) we recommend an additional best practice when integrating literature sources using joint display is to label the literature source findings with the inclusion of a dedicated column for these findings. This results in five best practices, namely, (i) label quantitative and qualitative results, (ii)
Given the vast amount of data to collate in both examples, joint displays were an effective and efficient method to organize and present a cohesive and systematic comparison of multiple data sources beyond traditional quantitative and qualitative sources. Although the use of joint displays are common, authors are not making adequate use of joint displays as a tool to integrate quantitative and qualitative findings, nor to integrate beyond these traditional data sources (Younas et al., 2020). The examples presented in this paper were from two large projects, submitted individually for the awards of Doctor of Philosophy (Brennan, 2021; Cooper, 2021). The projects required a clear and consistent method to enable the integration and discussion of multiple data sources beyond traditional mixed methods findings.
In presenting these examples we argue that literature reviews and concept analyses are valid sources of data, warranting integration with quantitative and qualitative data, to create a sum greater than quantitative and qualitative findings alone. We promote this method of integration to researchers who seek to link literature reviews to their own original mixed methods data and to communicate complex research conclusions with relative ease.
Effective and efficient communication of research findings is crucial for successful research translation (Straus et al., 2013). Often, the reader must navigate a lengthy narrative discussion to understand how the findings of a mixed method study relate to existing literature and fills knowledge gaps. Presenting and integrating multiple data sources, including findings from the literature, via joint display, positions the reader to think simultaneously about all sources of data, and how they relate to each other (Haynes-Brown & Fetters, 2021), while allowing the reader to appreciate the intent and technique of integration (Guetterman et al., 2015; Younas et al., 2020). Furthermore, presenting data sources in this way is likely to improve the readability and interpretation of the ensuing narrative discussion. The joint displays presented in this article illustrate effective and efficient communication of mixed methods results, while enabling the reader to situate this new knowledge among gaps found in the extant literature (Brennan, 2021; Cooper, 2021).
Systematic (mixed) literature reviews and concept analyses were presented as additional data sources in the examples, but are not an exhaustive list of alternative data sources suitable for integration. Establishing a sound research question to address gaps identified in the wider literature is the foundation of any robust study design (Creswell & Plano Clark, 2018; Moher et al., 2010; World Medical Association, 2013). As such, integrating literature sources has wide-reaching value to all researchers who aim to link the extant literature to their research objectives and research findings. Further, consumers of research and those translating research findings into practice, can be assured that new evidence recommending practice change, has considered the existing concepts and context. We demonstrate through the included examples how joint displays can weave a research ‘story’ together and complete the circle of knowledge, providing a visual representation of the significance of the study in relation to the identified gaps in the literature.
As these two examples illustrate, the integration of literature sources will generate new mixed methods designs that will require new typologies and notation to convey accurate descriptions. Researchers need to carefully consider the purpose of their literature source(s), and as in other designs, describe the level of mixing that will occur, the time orientation and emphasis of approaches (Leech & Onwuegbuzie, 2009). We encourage research students and active researchers to apply our approach to literature integration to their own work, and to explore opportunities to include other, non-traditional sources of data into joint displays. In doing so, further methodological advancements will become apparent, further advancing the field of mixed methods research.
Contribution to the Field of Mixed Methods Research Methodology
Joint displays have emerged as an innovative method to integrate and interpret mixed methods data and have been used across various mixed methods designs to generate new inferences (Guetterman et al., 2015). Over the past decade, mixed methods researchers have begun to use joint displays in more innovative ways, for example, integrating mixed methods results using a theoretical framework (Bustamante, 2017), using the pillar integration process (Johnson et al., 2019), incorporating graphical displays (Haynes-Brown & Fetters, 2021) and using meta-displays that integrate findings from multiple joint displays (Creamer & Edwards, 2022; Fetters & Guetterman, 2021; Peters et al., 2021). We have detailed and expanded upon a method to enrich the integration process by incorporating literature sources for integration using joint display.
While researchers are urged to demonstrate synergy between traditional quantitative and qualitative data sources (Fetters & Freshwater, 2015; Guetterman et al., 2015), there is no guidance, nor examples of integrated mixed methods meta-inferences with literature sources. Aligning these meta-inferences with results from literature reviews and concept analyses using joint displays delivers rich and concise communication of complex research problems. This approach builds on the concept of maximizing the benefit of integration discussed by Fetters and Freshwater (2015) by offering a method to display findings that are greater than the sum of the individual components.
Limitations and Future Research
We acknowledge our discussion is limited to two examples of integrating literature sources using joint display, both in the healthcare field. The use of different mixed methods research designs and literature sources to address real world problems does, however, strengthen this discussion, by highlighting the adaptability of this method. The two examples do not represent all the ways that literature sources can be used in mixed methods research designs. The exemplar joint displays presented above do not clearly demonstrate all the levels at which integration can occur, partly because joint displays are typically used to integrate at the analytic and interpretation level (Guetterman et al., 2015). This may be a limitation of joint displays more broadly, but when coupled with a cohesive narrative, other areas of integration become clear. There are many other ways joint displays can be utilized that are beyond the scope of this discussion; however, the examples presented will allow researchers to consider if and how including literature sources may strengthen integration. Future applications and evaluation of literature sources using joint display in different mixed methods research designs, using different data sources and in disciplines outside of healthcare, are required to advance this method of integration.
Conclusion
We present a novel method of integrating literature sources using joint display that advances the utility of joint display and builds on the concept of creating a sum that is greater than quantitative and qualitative findings alone. The two examples presented address real world problems of sustaining nurse resilience and barriers to and facilitators of physical activity in adults living with T1D. Joint display is an established method of integration at the analysis and interpretation level, that continues to evolve. To maximize the benefits of integration, researchers have begun to use joint display in creative and innovative ways (Bustamante, 2017; Guetterman et al., 2015; Haynes-Brown & Fetters, 2021; Johnson et al., 2019). The inclusion of literature sources at the interpretation and reporting level facilitates a deeper understanding of research phenomenon and assists researchers to address societal problems (Molina-Azorin & Fetters, 2019). Literature sources can also be used to inform mixed methods research designs and address wider study objectives.
Footnotes
Declaration of Conflicting Interests
The author(s) declared no potential conflicts of interest with respect to the research, authorship, and/or publication of this article.
Funding
The author(s) disclosed receipt of the following financial support for the research, authorship, and/or publication of this article: This work was supported by the Curtin University (Curtin Publication Grant 2021 and Research student support funds).