
Abstract
Keywords
Introduction
Carpal tunnel syndrome (CTS) is one of the most common nerve entrapment neuropathies with an approximate incidence of 1 in 10 people developing the condition at some point in their lifetime with higher prevalence in the working population versus the nonworking population.1,2 Carpal tunnel syndrome is often evaluated using electrodiagnostic studies (EDSs) and, more recently, ultrasound (US) has emerged as a potential diagnostic test. 1 Figure 1 provides a visual of ultrasonography of the median nerve at the distal wrist crease. A major disadvantage to EDSs is patient pain and discomfort during the test, making ultrasound a more attractive test, given its comfort and availability at the point of care. 3 Ultrasound has been shown to have a high sensitivity (94%) and specificity (98%), and an increase in cross-sectional area (CSA) is correlated with the diagnosis of CTS based on EDSs.4,5 While CSA has been correlated with the diagnosis of CTS based on EDSs, it remains unclear whether it correlates with the severity of CTS based on EDSs.4,6,7 The purpose of this study is to elucidate whether measurements of CSA of the median nerve correlate with the severity rating of CTS based on EDSs. Our hypothesis is that an increase in the CSA of the median nerve correlates with the severity of CTS based on EDSs.
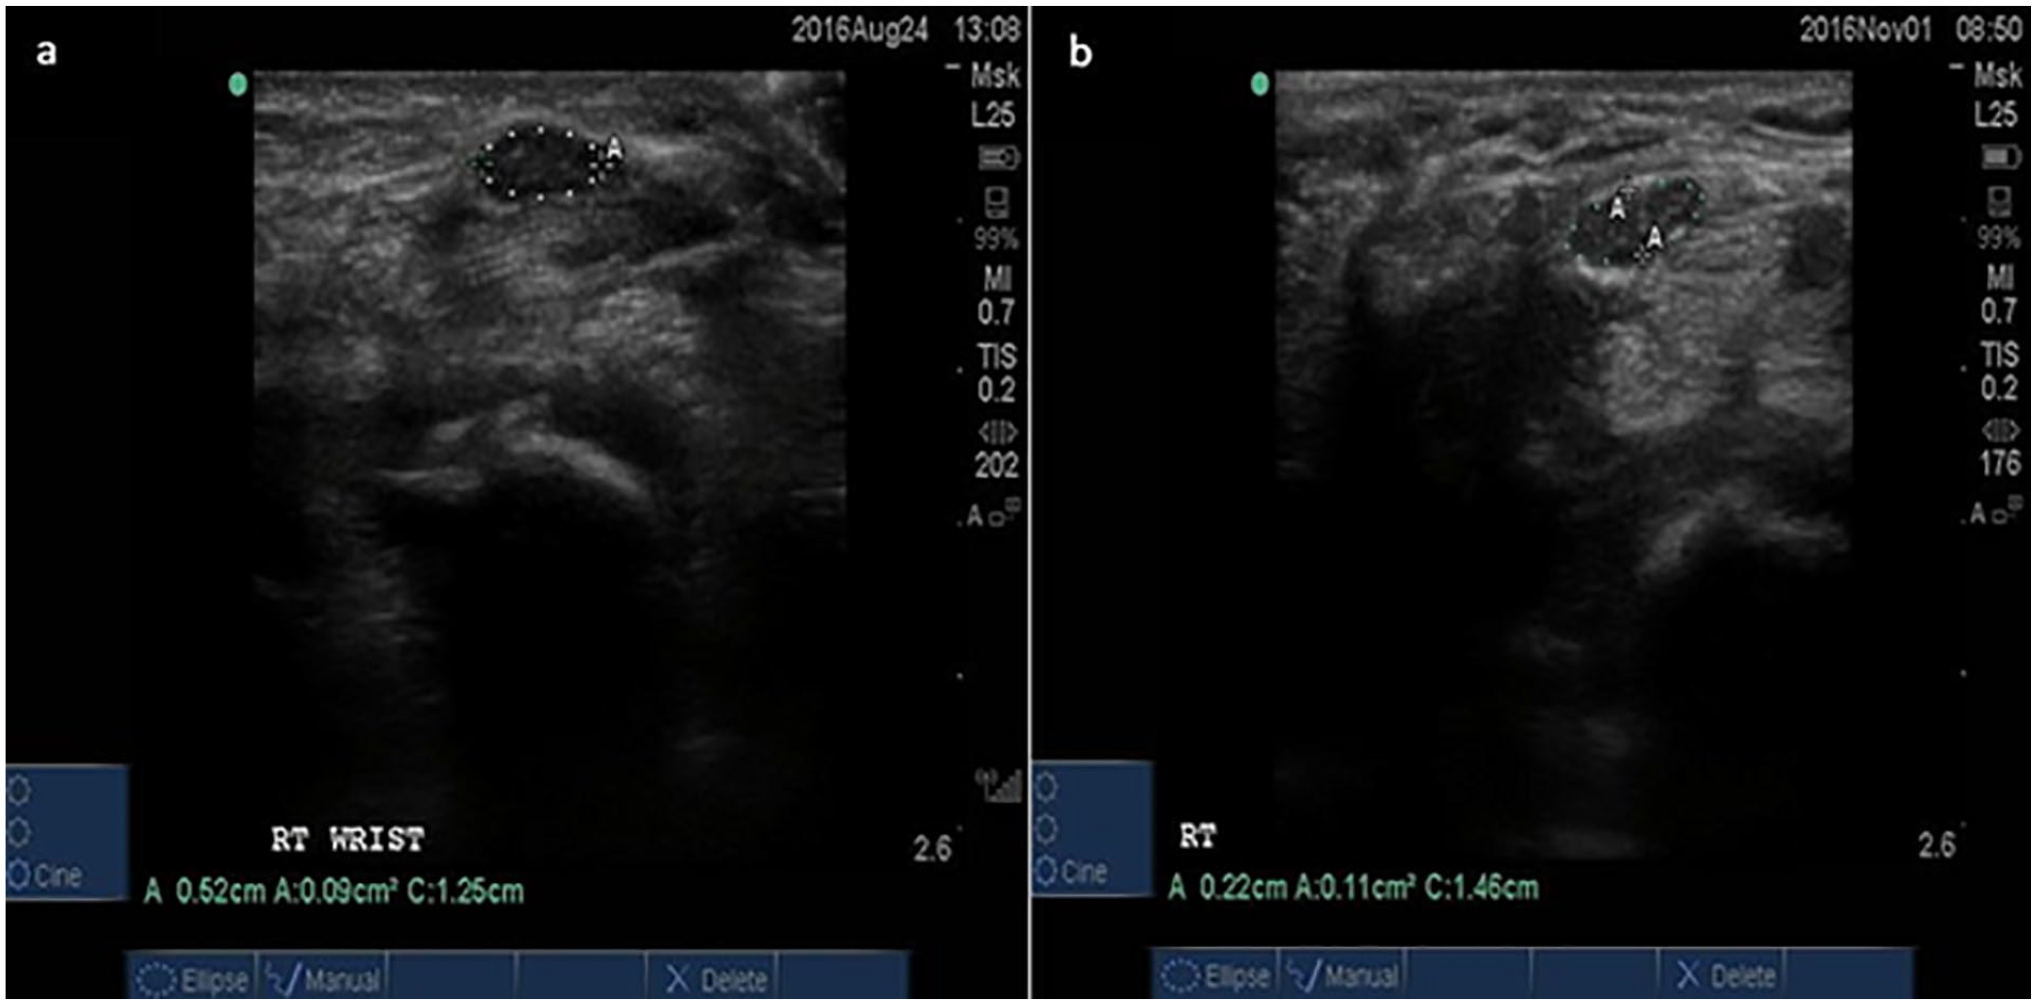
Ultrasonography images of the median nerve at the distal wrist crease showing a median nerve cross-sectional area of 9 mm2 (a) and a median nerve cross-sectional area of 11 mm2 (b).
Materials and Methods
Patient Identification
This study was a retrospective chart review of patients aged 18 years or older who had both median nerve ultrasonography measurements and EDSs performed. All patients in the study presented to a single hospital institution between October 2014 and September 2020, and it was approved by the institutional review board. One of the 3 board-certified orthopedic hand and upper extremity surgeons examined each of the patients on initial presentation, and if there was a clinical diagnosis of CTS based on the presence of typical signs and symptoms, then the patients were referred for further EDS and US testing. In this study, each hand was specified as being 1 independent observation, so patients who had bilateral symptoms were referred for further testing of both hands, each of them being an independent observation. Patients with electrodiagnostic evidence of polyneuropathy, cervical radiculopathy, had bifid median nerves, or had previously undergone carpal tunnel release of the ipsilateral wrist, were excluded from this study.
Ultrasonography examinations were performed by a trained research nurse, who was trained by the senior author and has performed more than 500 evaluations of the median nerve at the wrist. The senior author confirmed that the measurements matched his own measurements for the first 50 ultrasounds to ensure accuracy. The patient was seated across from the examiner with the dorsum of the forearm and hand flat against the examination table, elbow in 60° to 70° of flexion, and fingers in a gentle resting cascade. The CSA of the median nerve was measured at the wrist crease using a 15- to 6-MHz linear array transducer, inside the hyperechoic epineurium at the level of the carpal tunnel inlet (at the level of the pisiform bone) using the trace function. Measurements of the distal wrist crease median nerve were recorded in units of mm2. The research nurse who conducted the US measurements was blinded to the clinical examination as well as the electrodiagnostic data.
Electrodiagnostic examinations were performed by board-certified physicians according to the standards of the American Association of Neuromuscular and Electrodiagnostic Medicine. 8 Compound muscle action potential (CMAP) amplitude, distal motor latency of the compound actional potential (CMAP), and peak latency of the sensory nerve action potential (SNAP) were the 3 main electrophysiological parameters that were examined in this study. Based on the patient’s specific EDS measurements, the EDS severity (i.e. mild, moderate, severe) was identified according to the criteria outlined in the American Association of Electrodiagnostic Medicine (AAEM). 9 According to the AAEM guidelines, mild CTS was identified by a prolonged sensory or mixed nerve actional potential (NAP) distal latency ± SNAP amplitude below the lower limit of normal, moderate CTS was identified by the same abnormal median sensory latencies as in mild CTS plus a prolonged median motor distal latency, and severe CTS was identified by prolongation of both median motor and sensory distal latencies with either an absent SNAP or mixed NAP, or a low amplitude or missing thenar CMAP. 9
Statistical Methods
The relationship between each patient’s US measurement and EDS severity was evaluated using a generalized linear mixed model to assess the dependency of the 2 hands taken from the same patient, and the resulting dependency was negligible, so all hands were treated independently in the analysis. An independent samples Mann-Whitney univariate test was used to test the association between categorical demographic variables and median nerve CSA, and the Spearman rho correlation coefficient was used to test the association between continuous demographic variables and median nerve CSA. Linear regression was performed to assess whether median nerve CSA differed significantly among the EDS severity groups after controlling for the potential covariates. A Šidák correction test was used to evaluate pairwise comparisons between all groups of EDS severity (ie, normal, mild, moderate, severe). The EDS severity was evaluated as a categorical variable and then an F test for linear trend was used to test for a linear relationship across the 4 EDS severity categories. The Pearson correlation coefficient was used to assess the correlations between ultrasound measurements and EDS measurements. Receiver operating characteristic (ROC) curves were generated to determine corresponding cutoff point values of the median nerve ultrasonographic measurements that could differentiate between different levels of EDS severity. The following comparisons were examined with the ROC: (1) normal versus abnormal (mild/moderate/severe EDSs); (2) normal/mild EDSs versus moderate/severe EDSs; and (3) normal/mild/moderate EDSs versus severe EDSs. The Youden index was used to determine the cutoff point based on the maximal point of combined sensitivity and specificity. 10 Sensitivities and specificities were calculated for each of the cutoff points in the 3 ROC curves. Statistical significance for all statistical tests was based on a 2-sided P < .05.
Results
This study consisted of a total of 273 wrists (n = 273) from 188 patients with an average age of 52 years (range, 18-87 years). Among the 188 patients, 103 patients had 1 wrist included in the analysis and 85 patients had both wrists included. Demographic information such as sex, diabetes, and self-reported race for the patient sample is shown in Table 1.
Overall Demographic Information for Patients in the Sample.
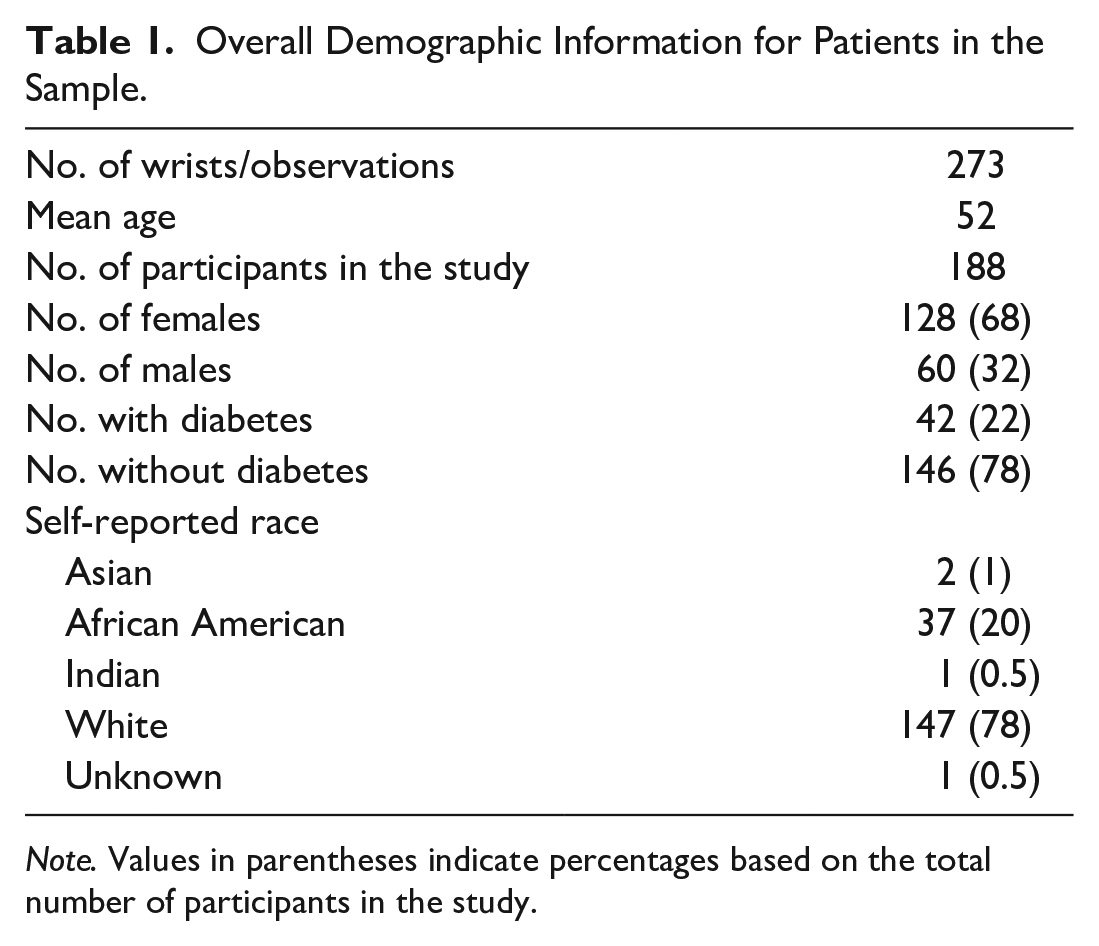
Note. Values in parentheses indicate percentages based on the total number of participants in the study.
Of the 273 wrists, 225 of them had electrodiagnostic evidence of CTS (ie, 99 mild, 82 moderate, and 44 severe), and 48 wrists had normal electrodiagnostic measurements and thus did not meet the criteria for CTS. The mean wrist CSA in normal, mild, moderate, and severe CTS was 7.48 ± 2.00, 10.36 ± 2.53, 12.01 ± 3.64, and 14.34 ± 4.77 mm2, respectively. The average median nerve distal wrist crease CSA for all patients in the sample was 10.99 ± 3.87 mm2. When comparing patients with normal EDS measurements with those that had EDS evidence of active CTS, the mean wrist CSA was 7.48 ± 2.00 mm2 versus 11.74 ± 3.76 mm2 (P < .0001).
There was a significant association between median nerve CSA and EDS severity (P < .0001). Median nerve CSA was not significantly different between white and black patients (P = .321). Median nerve CSA was significantly different between diabetics and nondiabetics (P = .006). Median nerve CSA was significantly different between men and women (P < .019). There was a significant association between median nerve CSA and weight (P < .001) but not height (P = .143). There were statistically significant differences between all groups (i.e. normal vs mild, normal vs moderate, normal vs severe, mild vs moderate, mild vs severe, and moderate vs severe) (all P < 0.007). There was a significant linear relationship between increasing wrist CSA and increasing EDS severity between the 4 groups (P < .0001) (Figure 2).
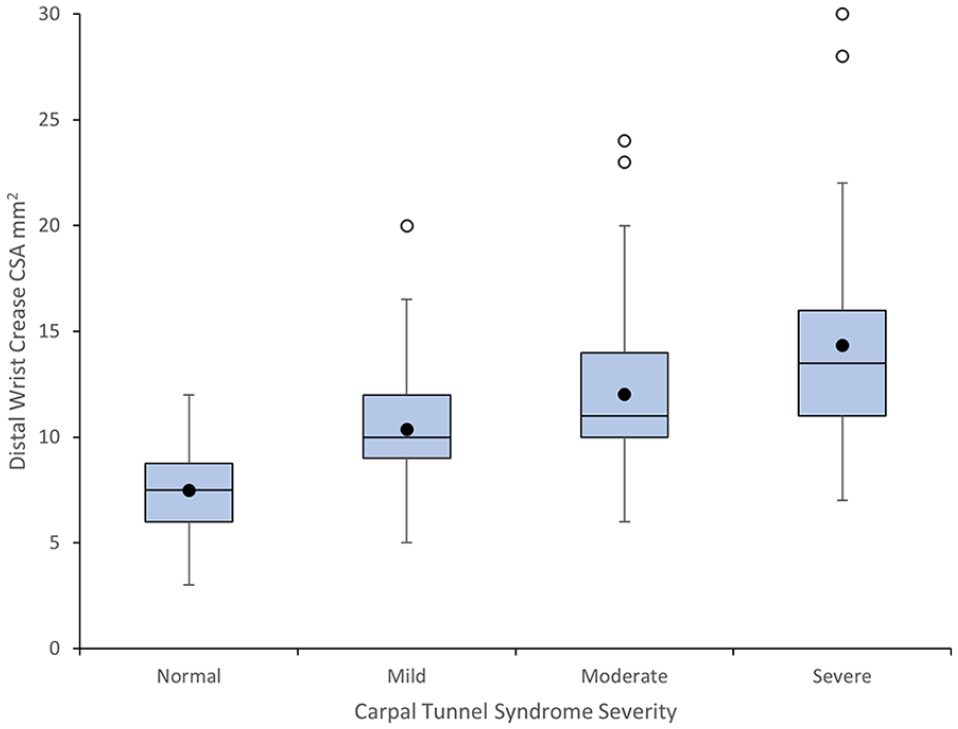
Distal wrist crease CSA demonstrates a linear relationship with electrodiagnostic rating of carpal tunnel syndrome severity.
Increased distal wrist crease CSA demonstrated a strong correlation with various electrodiagnostic measurements such as: (1) distal motor latency of the CMAP; (2) peak latency of the SNAP; and (3) decreased CMAP Amplitude (Figure 3).
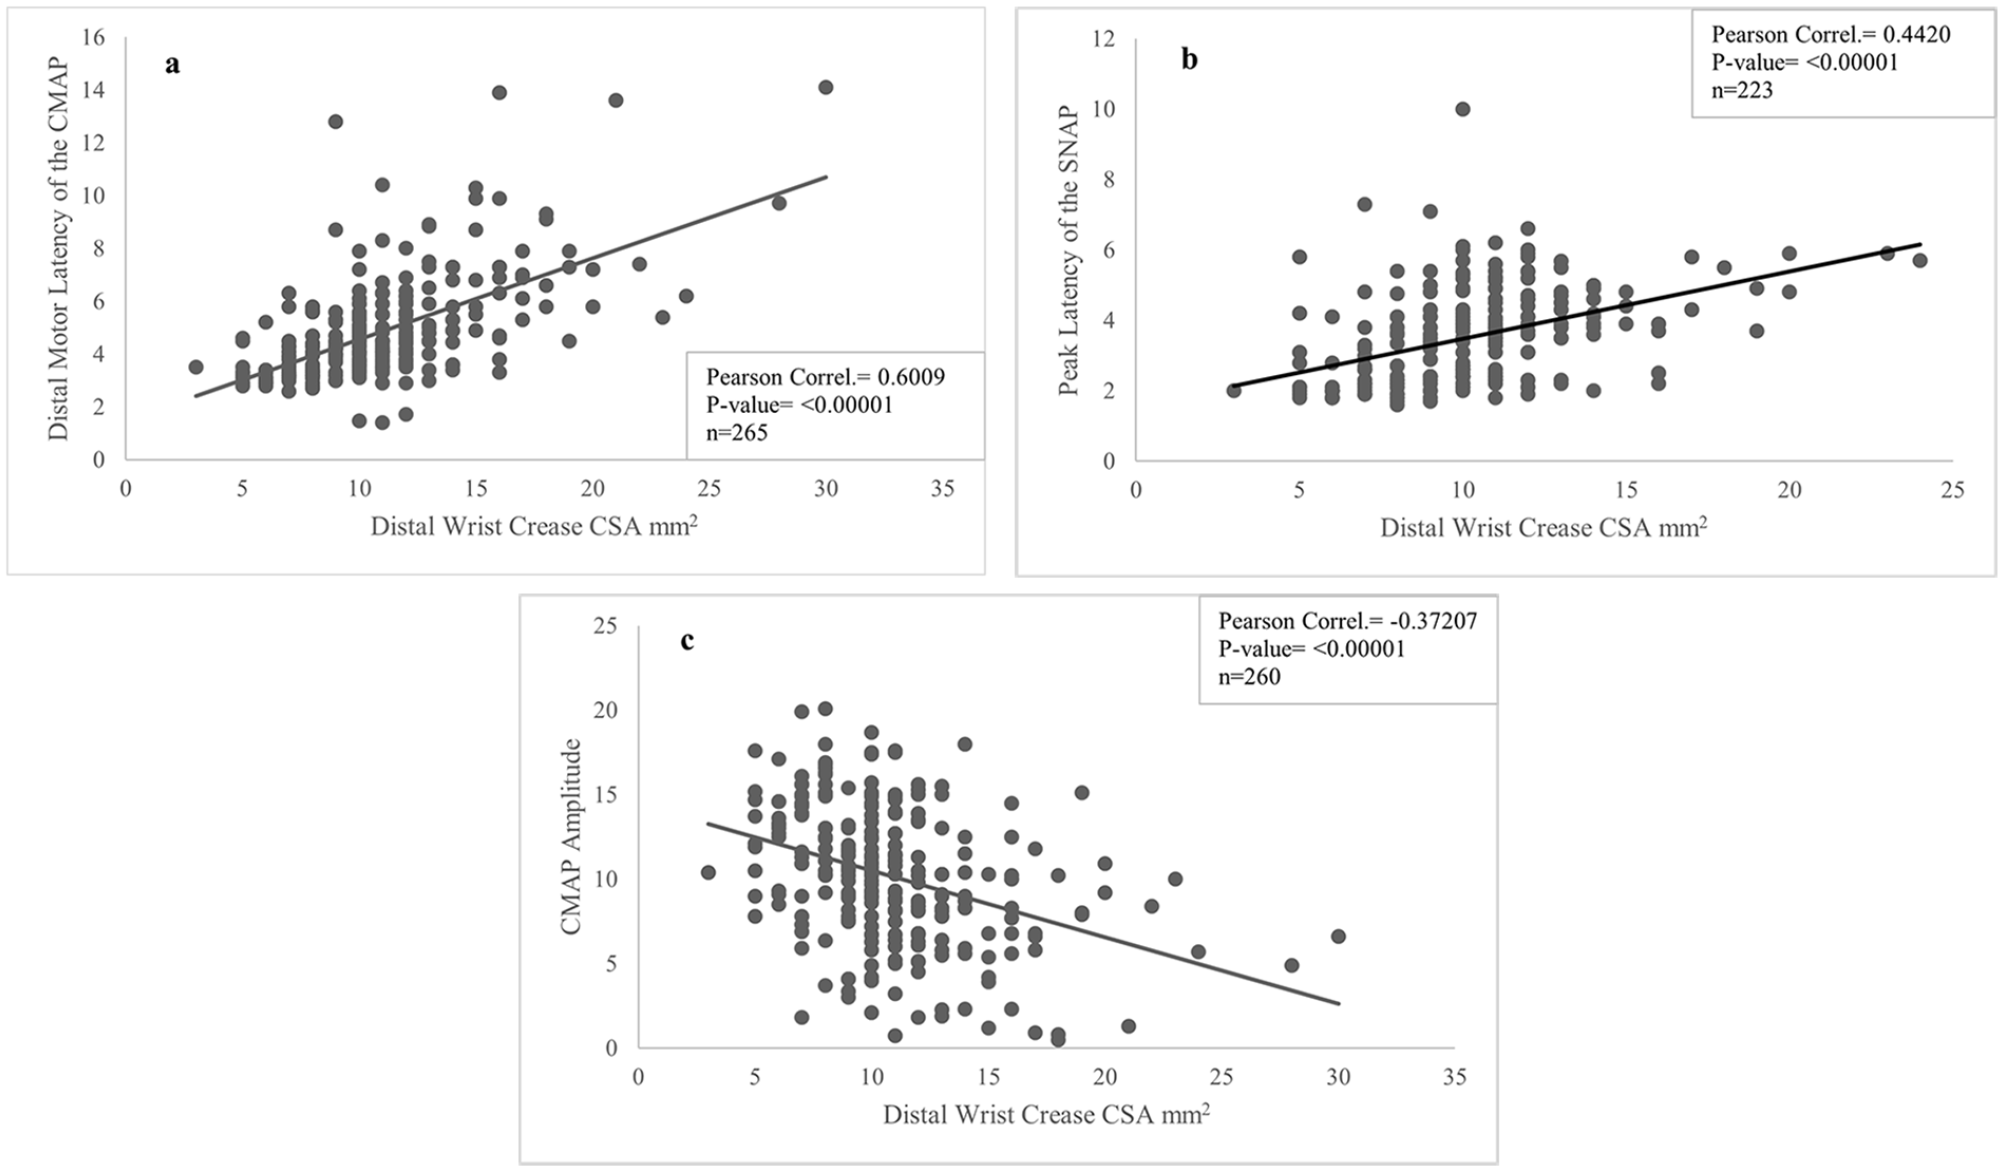
Distal wrist crease CSA correlates with prolonged distal motor latency of the CMAP (a), increased peak latency of the SNAP (b), and decreased CMAP amplitude (c). Pearson correlation coefficients were calculated for each plot and the resulting P values are shown.
The 3 separate receiver operating curve (ROC) analyses were generated to determine whether distal wrist crease CSA can discriminate between different levels of EDS severity: (1) normal versus abnormal (mild/moderate/severe EDSs); (2) normal/mild versus moderate/severe; and (3) normal/mild/moderate EDSs versus severe EDSs. The area under the curve (AUC) was 0.867 (P < .001) when the distal wrist crease CSA differentiated between normal versus abnormal (mild/moderate/severe EDSs). For this comparison, the Youden index indicated an optimal cutoff point of greater than or equal to 10 mm2 with a corresponding specificity of 85.42% and sensitivity of 75.56%. Next, the AUC was 0.755 (P < .001) when the distal wrist crease CSA differentiated between normal/mild versus moderate/severe EDSs. For this comparison, the Youden index indicated an optimal cutoff point of greater than or equal to 12 mm2 with a corresponding specificity of 82.31% and sensitivity of 54.76%. Finally, the AUC was 0.774 (P < .001) when the distal wrist crease CSA differentiated between normal/mild/moderate EDSs versus severe EDSs. For this comparison, the Youden index indicated an optimal cutoff point of greater than or equal to 12 mm2 with a corresponding specificity of 72.05% and sensitivity of 70.45%.
Discussion
This study found optimal cutoff points to discriminate between different levels of EDS severity, particularly that a cutoff value of greater than or equal to 12 mm2 distinguishes mild CTS from moderate to severe CTS. This is an important distinction as many surgeons recommend surgical treatment once CTS progresses to at least moderate severity. 11 Even though this study demonstrated that the optimal cutoff values for moderate and severe CTS were the same (12 mm2), the prognostic value of differentiating between moderate and severe CTS is debatable. Increasing distal wrist CSA showed strong correlations with specific EDS measurements such as increasing peak latency of the SNAP and distal motor latency of the CMAP, as well as with decreasing CMAP amplitude. Pairwise comparison between all 4 EDS severity groups indicated statistically significant differences for each of the comparisons, and the overall trend was consistent with a linear relationship between increasing distal wrist crease CSA and increasing EDS severity, as shown in Figure 2. Furthermore, the data elucidate potential differences in CSA of the median nerve on sex, weight, or diabetes status.
Previous research has demonstrated the utility of ultrasound in the diagnosis of CTS. Fowler et al showed that ultrasound is highly accurate in the diagnosis of CTS, with a sensitivity of 91% (95% confidence interval [CI], 81%-98%) and specificity of 94% (95% CI, 80%-100%), both of which were equivalent to or greater than the sensitivity and specificity of nerve conduction studies, which were 91% (95% CI, 81%-97%) and 83% (95% CI, 66%- 95%), respectively. 12 Other studies have reported similar cutoff points for ultrasound’s ability to discriminate between different levels of EDS severity. Mhoon et al reported that a cutoff value of less than 9 mm2 had a high sensitivity of 99% but a low specificity of 22% to predict normal versus abnormal EDSs in a population of 192 symptomatic wrists. 13 Azami et al found that a median nerve CSA at the tunnel inlet with a cutoff of 9.15 mm2 showed the best diagnostic accuracy for CTS with a sensitivity of 99.2% and specificity of 88.3% in a population of 180 wrists. 14 However, there exists a wide range of distal wrist crease CSA cutoff values within the literature regarding CTS diagnosis, which range from 6.5 to 15 mm2.4,6,13 -17 In a large-scale meta-analysis of 19 different studies (3131 wrists) on using ultrasound for the diagnosis of CTS, the overall sensitivity and specificity for ultrasound to diagnose CTS, using all the studies in the analysis, was 77.6% and 86.8%, respectively. 5
There have been several studies examining the relationship between median nerve US and EDS measurements, many of which report significant associations between increasing CTS severity and increasing median nerve CSA.7,17,18 -23 A meta-analysis investigating median nerve CSA and EDS severity showed that increasing CSA of the median nerve is associated with increasing severity of active CTS: mean CSA of 11.6 mm2 for mild CTS, mean CSA of 13.7 mm2 for moderate CTS, and mean CSA of 16.8 mm2 for severe CTS. 24 However, a number of studies report no correlation between median nerve US measurements and EDS severity.6,13,25 -28 Kele et al reported that a CSA of 11 mm2 could be considered diagnostic for CTS, but that US itself did not show any correlation with EDS or clinical findings. 29 Zyluk et al examined the correlation between EDS and US findings in 113 patients with CTS and reported no correlation between US measurements and EDS parameters. 26
The wide variability in reported median nerve CSA cutoff values in the diagnosis of CTS, as well as for the discrepancies between EDS and US correlation, can be attributed to a number of factors. First, there exists wide variability in US protocols used and diagnostic guidelines followed, how the median nerve measurements are reported, and the training of providers. 17 Also, the skill and experience of examiners may influence the diagnostic accuracy of the test. Cartwright et al showed that the intrarater intraclass correlation coefficient for a measurement of the median nerve CSA was 0.27 for a medical student compared with 1.00 for an experienced surgeon. 30 Fowler et al found that there is moderate agreement among examiners of different experience levels when measuring the median nerve CSA at the carpal tunnel inlet. 31 Recent research has quantified the level of error that is accompanied by US measurements in the diagnosis of CTS. When considering a cutoff value of greater than or equal to 10 mm2, the mean percent error for US measurement of objects with a known CSA was between 6% and 11%. 32 Assuming an error level of 10%, this would mean that there would be a 1-mm2 expected level of error. 32 For example, if a patient had a median nerve CSA of 10 mm2, which meets the diagnostic criteria for CTS, they could potentially have a “real” value of 9 mm2, which would be considered a negative value for CTS. 32 Therefore, caution should be exercised in interpreting the results of US measurements near to or equivalent to the pre-set cutoff values, for there could be a reasonable level of error associated with it. Finally, median nerve CSA values have been shown to be influenced by body mass index, age, sex, and ethnicity, and these variables could potentially explain the large variation in cutoff values suggested for CTS throughout the literature because many such studies are conducted on different populations throughout the world.33,34
Limitations of our study include its retrospective design and the lack of a control group. Second, EDS measurements were obtained by over a dozen different board-certified physicians, mainly in the PM&R clinic, which could potentially introduce variability in the interpretation of the EDS results. Taking interobserver and intraobserver reliability data points could allow us to identify whether there was a significant variation in EDS interpretation depending on who conducted the study. However, the use of multiple examiners could decrease the potential bias that one might see if only 1 or 2 examiners were used. A large multicenter study using similar diagnostic criteria and techniques for EDS and US measurements would help to refine the results of this study.
Conclusions
The results of this study demonstrate that the median nerve CSA at the distal wrist crease shows a significant linear relationship with EDS severity. Increased median nerve CSA is significantly correlated with specific sensory and motor EDS measurements. A cutoff value of greater than or equal to 10 mm2 showed the ability to discriminate between normal versus abnormal EDSs, and a cutoff value of greater than or equal to 12 mm2 indicated the differentiation between mild CTS and moderate to severe CTS.
Footnotes
Ethical Approval
This study was approved by our institutional review board.
Statement of Human and Animal Rights
All procedures followed were in accordance with the ethical standards of the responsible committee on human experimentation (institutional and national) and with the Helsinki Declaration of 1975, as revised in 2008.
Statement of Informed Consent
Informed consent was obtained from all individual participants included in this study.
Declaration of Conflicting Interests
The author(s) declared the following potential conflicts of interest with respect to the research, authorship, and/or publication of this article: J.R.F. is a member of the Integra LifeSciences Nerve Advisory Board; however, this relationship has no conflict with this article.
Funding
The author(s) disclosed receipt of the following financial support for the research, authorship, and/or publication of this article: Statistical analysis for this project was supported in part by the National Institutes of Health through Grant Number UL1-TR-001857.