
Abstract
Indirect bridge health monitoring is a promising measurement technique which has several advantages over the conventional direct method. However, the indirect method still encounters some challenges such as the effect of road roughness and vehicle’s own frequency. Utilizing the scanning vehicle in a stationary state has been proposed to overcome the effects of road roughness. Also, the contact-point response (CPR) has been developed to eliminate the vehicle’s own frequency. However, CPR has been developed for undamped vehicle. Therefore, the first part of this study develops CPR calculation method for a damped vehicle model. The CPR is calculated for a damped stationary vehicle (considering various vehicle frequencies) using the proposed equations. The transmissibility of the CPR is tested by comparing the time and frequency domains between the indirect (vehicle) and bridge direct response (reference). The transmissibility of the vehicle significantly improved by computing CPR, especially for low vehicle frequencies. In the second part of the paper, a frequency-free vehicle is developed in a laboratory set-up. The response of the vehicle does not contain the frequency of the vehicle due to using polyurethane (PU) wheels. Dynamic responses, damping ratios, and mode shapes are compared between the direct and indirect method. Accordingly, the results show that the designed vehicle has high transmissibility of the bridge vibration.
Keywords
Introduction
Failure of bridges could have devastating consequences on human lives, economy, and the environment. Therefore, it is essential to develop regular monitoring techniques to detect bridge damages at early stages. Such monitoring allows authorities and bridge owners to take preventive measures to prevent further deterioration. Direct bridge health monitoring (BHM) method, which involves installing sensors directly on the bridge, has several drawbacks. Firstly, the limited mobility of the sensory system can be a drawback as it cannot be moved to different bridges. Secondly, to cover the entire bridge, a large number of sensors must be installed in a specific arrangement, which can be both costly and time-consuming. This becomes even more challenging when considering the cost of implementing the direct method on a large scale, such as on a national network of bridges. Additionally, the life-service of the sensory system is shorter than that of the bridge, meaning that regular maintenance of the system is required. This can be challenging, especially if the bridge is located in a difficult or dangerous location, making it hard to access and maintain the sensory system.1–6
Given the disadvantages of the direct method for BHM, there is a need to develop more practical, mobile, and advanced methods. Therefore, in 2004, Professor Yang YB and co-workers proposed the use of a scanning vehicle equipped with accelerometers to measure the vibrations of a bridge as it passes over it. 7 The use of an instrumented vehicle for measuring bridge vibrations has several advantages. One advantage is that it is practical, as it only requires a vehicle with one or two sensors to scan the vibration of the bridge. Another advantage is its mobility, as the test vehicle can be used to monitor the health condition of bridge network on a national level. The most significant advantage of the VSM is its cost efficiency compared to the direct method, which requires the installation of sensory system on each bridge.
Despite the various advantages, there are two major challenges for the indirect method. The first challenge is the effects of road roughness on the response of the moving scanning vehicle. The second challenge is the vehicle’s own vibration influence on the recorded signal by the scanning vehicle.8–12 Yang et al.13,14 proposed the use of the scanning vehicle in stationary state to remove the effects of the road roughness to measure bridge frequency. The parked vehicle is considered a reasonable trade-off between the indirect method (moving vehicle) and direct method (fixed sensors). Using the parked vehicle allows for higher quality data collection than the moving vehicle. On the other hand, the stationary vehicle can be located at any point on the bridge easily.
To overcome the effects of the vehicle own vibration, Yang et al. 8 proposed a technique to obtain Contact-Point Response (CPR) of the vehicle rather than the response of the vehicle itself. CPR is the reconstructed vibration response at the wheel–bridge contact point, obtained from measurements taken from the scanning vehicle response. By removing the influence of the vehicle’s own dynamics, CPR represents the bridge motion at the contact location more accurately and is largely free from contamination by the vehicle’s modal frequencies. However, Yang et al. 8 derived the CPR equation while neglecting vehicle damping. Hashlamon et al. 15 showed that when damping is added to the vehicle, the equation proposed by Yang et al. 8 does not accurately represent the bridge frequencies, especially for higher modes. Therefore, this study introduces a simplified method to calculate the CPR while considering the damping effects of the vehicle.
Despite extensive development of CPR technique for indirect bridge health monitoring, existing methods predominantly assume an undamped vehicle model, which limits their applicability in practical settings where damping is unavoidable. Moreover, the performance of stationary vehicles been addressed by experimental investigations. These gaps in the literature necessitate further study to improve the accuracy and reliability of CPR and the use of stationary vehicle.
The novelty of this study lies in the development of a simplified equation for CPR that incorporates vehicle damping, allowing more realistic modelling of stationary scanning vehicles. In addition, this study introduces a frequency-free laboratory vehicle using PU wheels, whose response is shown to closely match the bridge response without the need for CPR post-processing. This dual contribution – a theoretical model for damped vehicles and an experimental demonstration of a high-transmissibility platform – provides a more practical and effective solution for indirect bridge health monitoring.
While this study proposes a novel equation for calculating the CPR by considering the vehicle’s damping, it is important to acknowledge previous studies that have integrated the CPR technique with other methods to enhance bridge property identification and improve damage detection. For example, the study conducted by Yang et al. 16 employed the CPR to extract frequencies of a bridge, considering higher vibration modes by utilizing the Extreme-point Symmetric Mode Decomposition (ESMD). Yang et al. 17 implemented the EMSD on the CPR in a field case study. The authors highlighted that temporarily stopping the trailer on the bridge can improve the accuracy of bridge frequency identification. Yang et al. 18 suggested using Variational Mode Decomposition (VMD) with a band pass filter (BPF) on the CPR to enhance the detection of bridge frequencies. Li et al. 19 used a dual Kalman filter and singular spectrum analysis to enhance the identification of the bridge frequency by using the CPR. They used CPR difference between two successive axles in a numerical and laboratory study. In their research, Zhan et al. 20 employed the difference of CPR from a scanning vehicle to obtain mode shapes of the bridge and use it for damage detection. They found that damage localization can be achieved by applying Wavelet Transform (WT) on the CPR difference. Furthermore, the residual CPR (the difference between the CPR of two successive axles) has been used in an effort to mitigate the negative effects of road surface roughness.20,21 Zhang et al.22,23 proposed a damage detection approach that utilizes the Instantaneous Amplitude Squared (IAS) of the driving component of the CPR. According to the authors, this method does not require a baseline from prior measurements. Corbally et al. 24 used the CPR to detect damages employing the difference in natural frequency of damaged and intact bridge. Moreover, CPR has been used for bridge damage detection and bridge frequency identification using a stationary vehicle.15,25–27 The previous studies used a single degree of freedom system of undamped vehicle in their numerical modelling. Nayek et al. 28 used the CPR for a quarter-car model and suggest a method of estimating the CPR that involves a Gaussian process force model. Additionally, other studies have proposed model-based approaches to structural damage detection that focus on computational efficiency and stiffness separation for large-scale truss bridges.29,30 These methods could potentially be integrated with indirect monitoring techniques to enhance performance on complex structures.
This paper is divided into two parts, theoretical and experimental. In the first part ‘the theoretical part’, a simplified method to calculate CPR of damped vehicle is introduced. Thereafter, in a numerical finite element (FE) model, CPR of a stationary vehicle is calculated by the proposed method and compared with the method provided by Yang et al. 8 while investigating the response of a vehicle of a wide range of vehicle frequencies. Such investigations show the transmissibility of the vehicle and its CPR for various vehicle frequencies. The range of vehicle frequencies is taken from real-world vehicles from previous experimental studies. For example, several studies used the lab model made by the American Carnegie Mellon University which used a vehicle with bouncing frequency of 5 Hz.31–35 The Kyoto University laboratory model in Japan has been used for numerous investigations which used several vehicle frequencies ranging from 2.9 Hz up to 13 Hz.36–41 Singh et al. 42 used a vehicle with frequency of 13 Hz. Lan et al. 43 conducted laboratory experiment to identify bridge frequency where the frequency of the vehicle was visible at the peak of 20 Hz. Moreover, a higher vehicle frequency of 29.37 was used in the lab model for various research.44–48 Yang et al. 13 used a trailer vehicle in a field test which has frequency of 9 Hz.
FEM simulation in this study shows that higher vehicle frequencies do not require the use of CPR to reflect the true response of the bridge. Therefore, in the second part ‘the experimental part’ a frequency-free vehicle is designed for a laboratory experiment. Such vehicle doesn’t require CPR to be calculated as the vehicle’s frequency is not visible in the response. Properties of the vehicle and beam laboratory test are elaborated in the results section. Modal properties such as frequency, damping ratios, and mode shapes are identified by indirect method (stationary vehicle) and direct method (mounting the sensor directly on the bridge). Modal properties are compared between the direct and indirect method to show the transmissibility of the designed vehicle to reflect true response of the bridge.
This paper is divided into theoretical and experimental parts. The first part presents the theoretical derivation of the contact point response (CPR) equations for a damped stationary vehicle and validates them through numerical simulations using a finite element model. The second part focuses on the design and experimental testing of a frequency-free vehicle, demonstrating its capability to accurately capture bridge dynamic responses without being influenced by its own frequency. The paper concludes with a summary of the main findings and suggestions for future research directions.
CPR of damped vehicle
This section is divided into two parts. The first part is the derivation of the simplified method to calculate the CPR of a damped vehicle. In the second part, a numerical FE model is developed for moving and stationary vehicles on a bridge. The moving vehicle works as a source of excitation. The response of the stationary vehicle is compared with that of the bridge at the same location. Also, CPR of the damped vehicle is calculated for using the proposed method and the method proposed by Yang et al. 8
Theoretical derivation
This paper introduces simplified equations for the CPR of damped vehicle. The development of these equations is conducted because the original study did not provide a method to compute CPR of damped vehicle. Figure 1 shows a vehicle with damping component over a bridge. In this stationary vehicle scenario, the vehicle itself is not the source of excitation; instead, the bridge is excited by an external moving vehicle in the numerical model. Equation of motion (EOM) of this system is expressed in equation (1). Damped vehicle on a simply supported beam.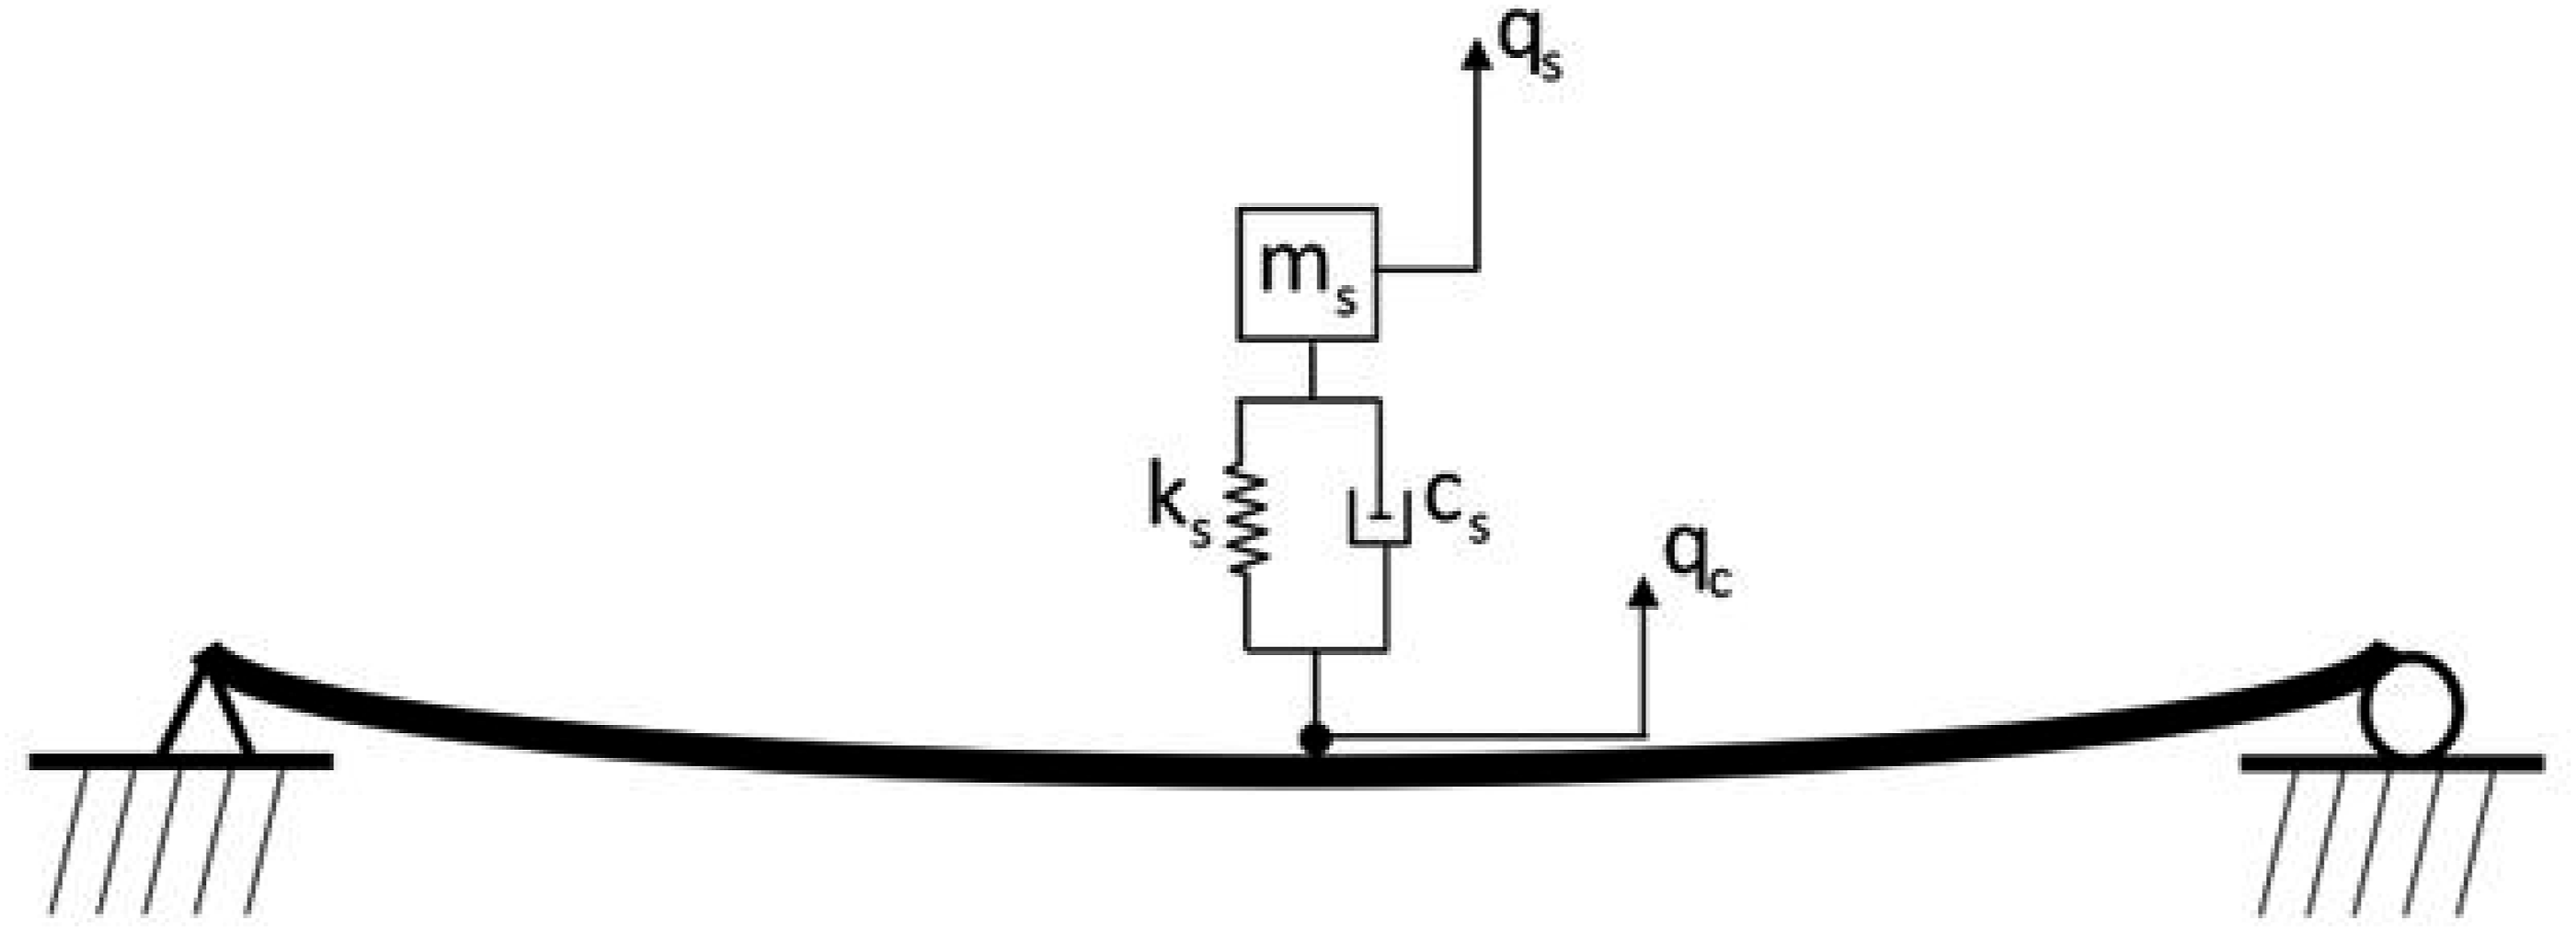

By rearranging and substituting the damping as
Finally, the CPR of a damped vehicle is expressed as:
Numerical case study
Stationary vehicle properties of each case.
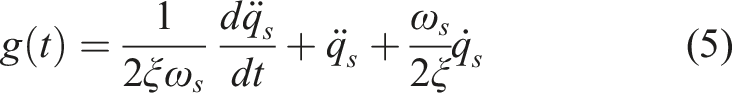
Case 1: Vehicle frequency 1.6 Hz
Figure 2(a) shows the response of the damped stationary vehicle, its CPR calculated by Yang et al., its CPR calculated by the proposed equations in this study, and finally the bridge response at the same point. From the time-domain response, the discrepancy is clear in the CPR calculated using the method by Yang et al. However, the proposed equations provide a CPR which is in good agreement with the reference response. The FFT response is shown in Figure 2(b). Yang et al. equations can’t be used for the damped vehicle of low frequency, as the amplitude of the three modes of vibration disagree with the reference response. Dynamic response of damped 1.6 Hz stationary vehicle, its CPR by Yang equations, its CPR by proposed equations, and bridge (a) acceleration response and (b) their acceleration spectra.
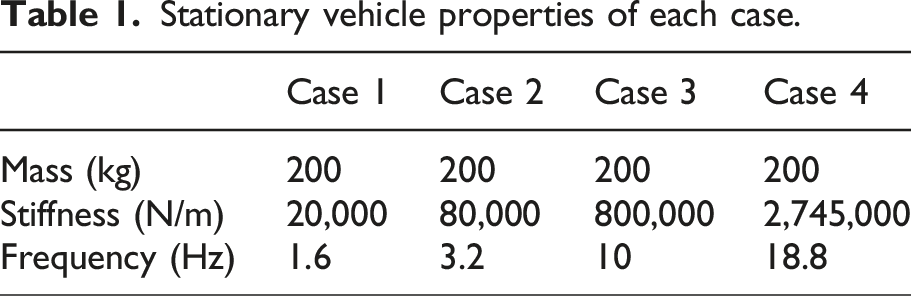
Case 2: Vehicle frequency 3.2 Hz
Figure 3(a) shows the acceleration responses of the vehicle with frequency of 3.2 Hz. From the time-domain response, there is discrepancy in the CPR calculated by Yang et al. However, the proposed equations provide a CPR that in good agreement with the reference response. The FFT response is shown in Figure 3(b). Yang equations show the first mode of frequency in good agreement with the reference; however, the second and third modes are not in good agreement. On the other hand, the proposed equations show the CPR with full agreement with the reference response for all modes. Response of damped 3.2 Hz stationary vehicle, its CPR by Yang equations, its CPR by proposed equations, and bridge (a) acceleration response and (b) their acceleration spectra.
Case 3: Vehicle frequency 10 Hz
In this case, a vehicle with 10 Hz is selected, where this frequency is close to the bridge 2nd mode of frequency of 8.3 Hz. The acceleration spectra shown in Figure 4(b) show that the proposed equations provide more accurate results for detecting 3rd mode of frequency of the bridge comparing with the equations provided by Yang equations. Dynamic response of damped 10 Hz stationary vehicle, its CPR by Yang equations, its CPP by proposed equations, and bridge (a) acceleration response and (b) their acceleration spectra.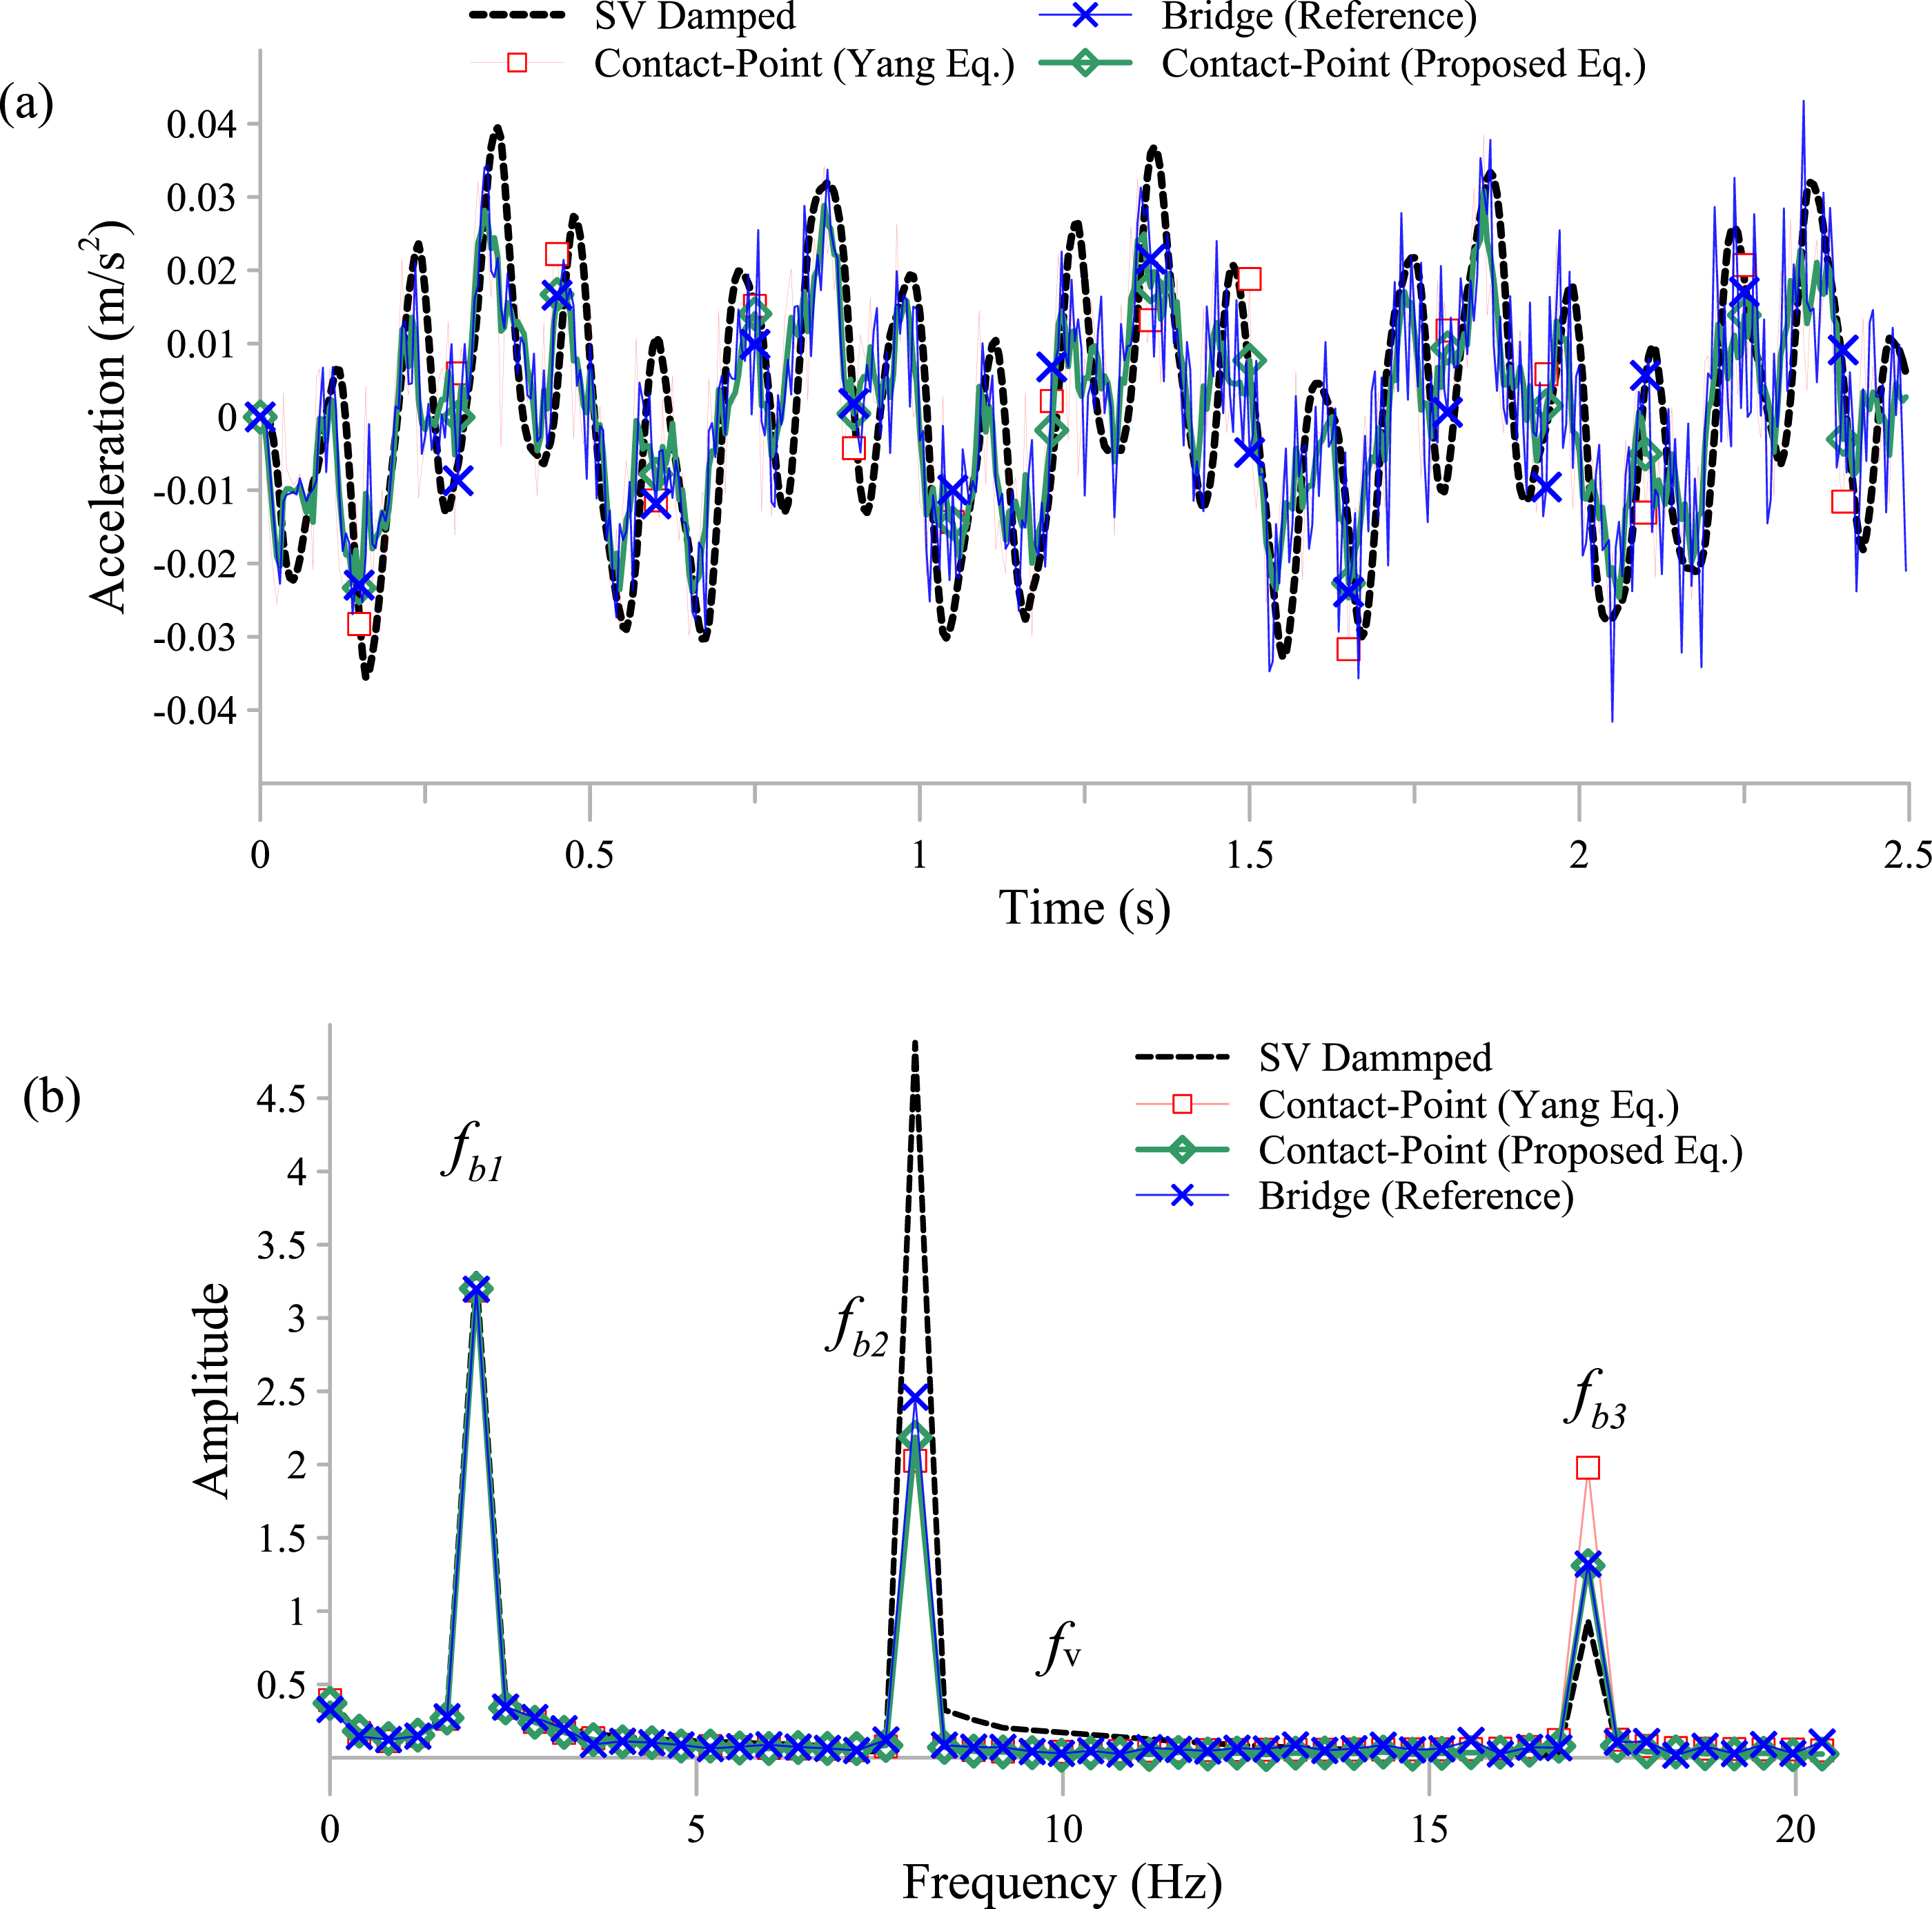
Case 4: Vehicle frequency 18.8 Hz
The final case examines the vehicle with high frequency such as 18.8 Hz. The acceleration and FFT responses are shown in Figure 5. From the FFT response, it is shown that the 2nd and 3rd modes of vibrations are not detected by the response of the damped stationary vehicle. However, the equations by Yang can detect the 1st and 2nd modes accurately. Regarding the 3rd modes, neither equation, Yang nor proposed, agrees well with the reference response. This happens, because the amplification of this vehicle is high around the 3rd modes of the bridge which is 18 Hz. Dynamic response of damped 18.8 Hz stationary vehicle, its CPR by Yang equations, its CPR by proposed equations, and bridge (a) acceleration response and (b) their acceleration spectra.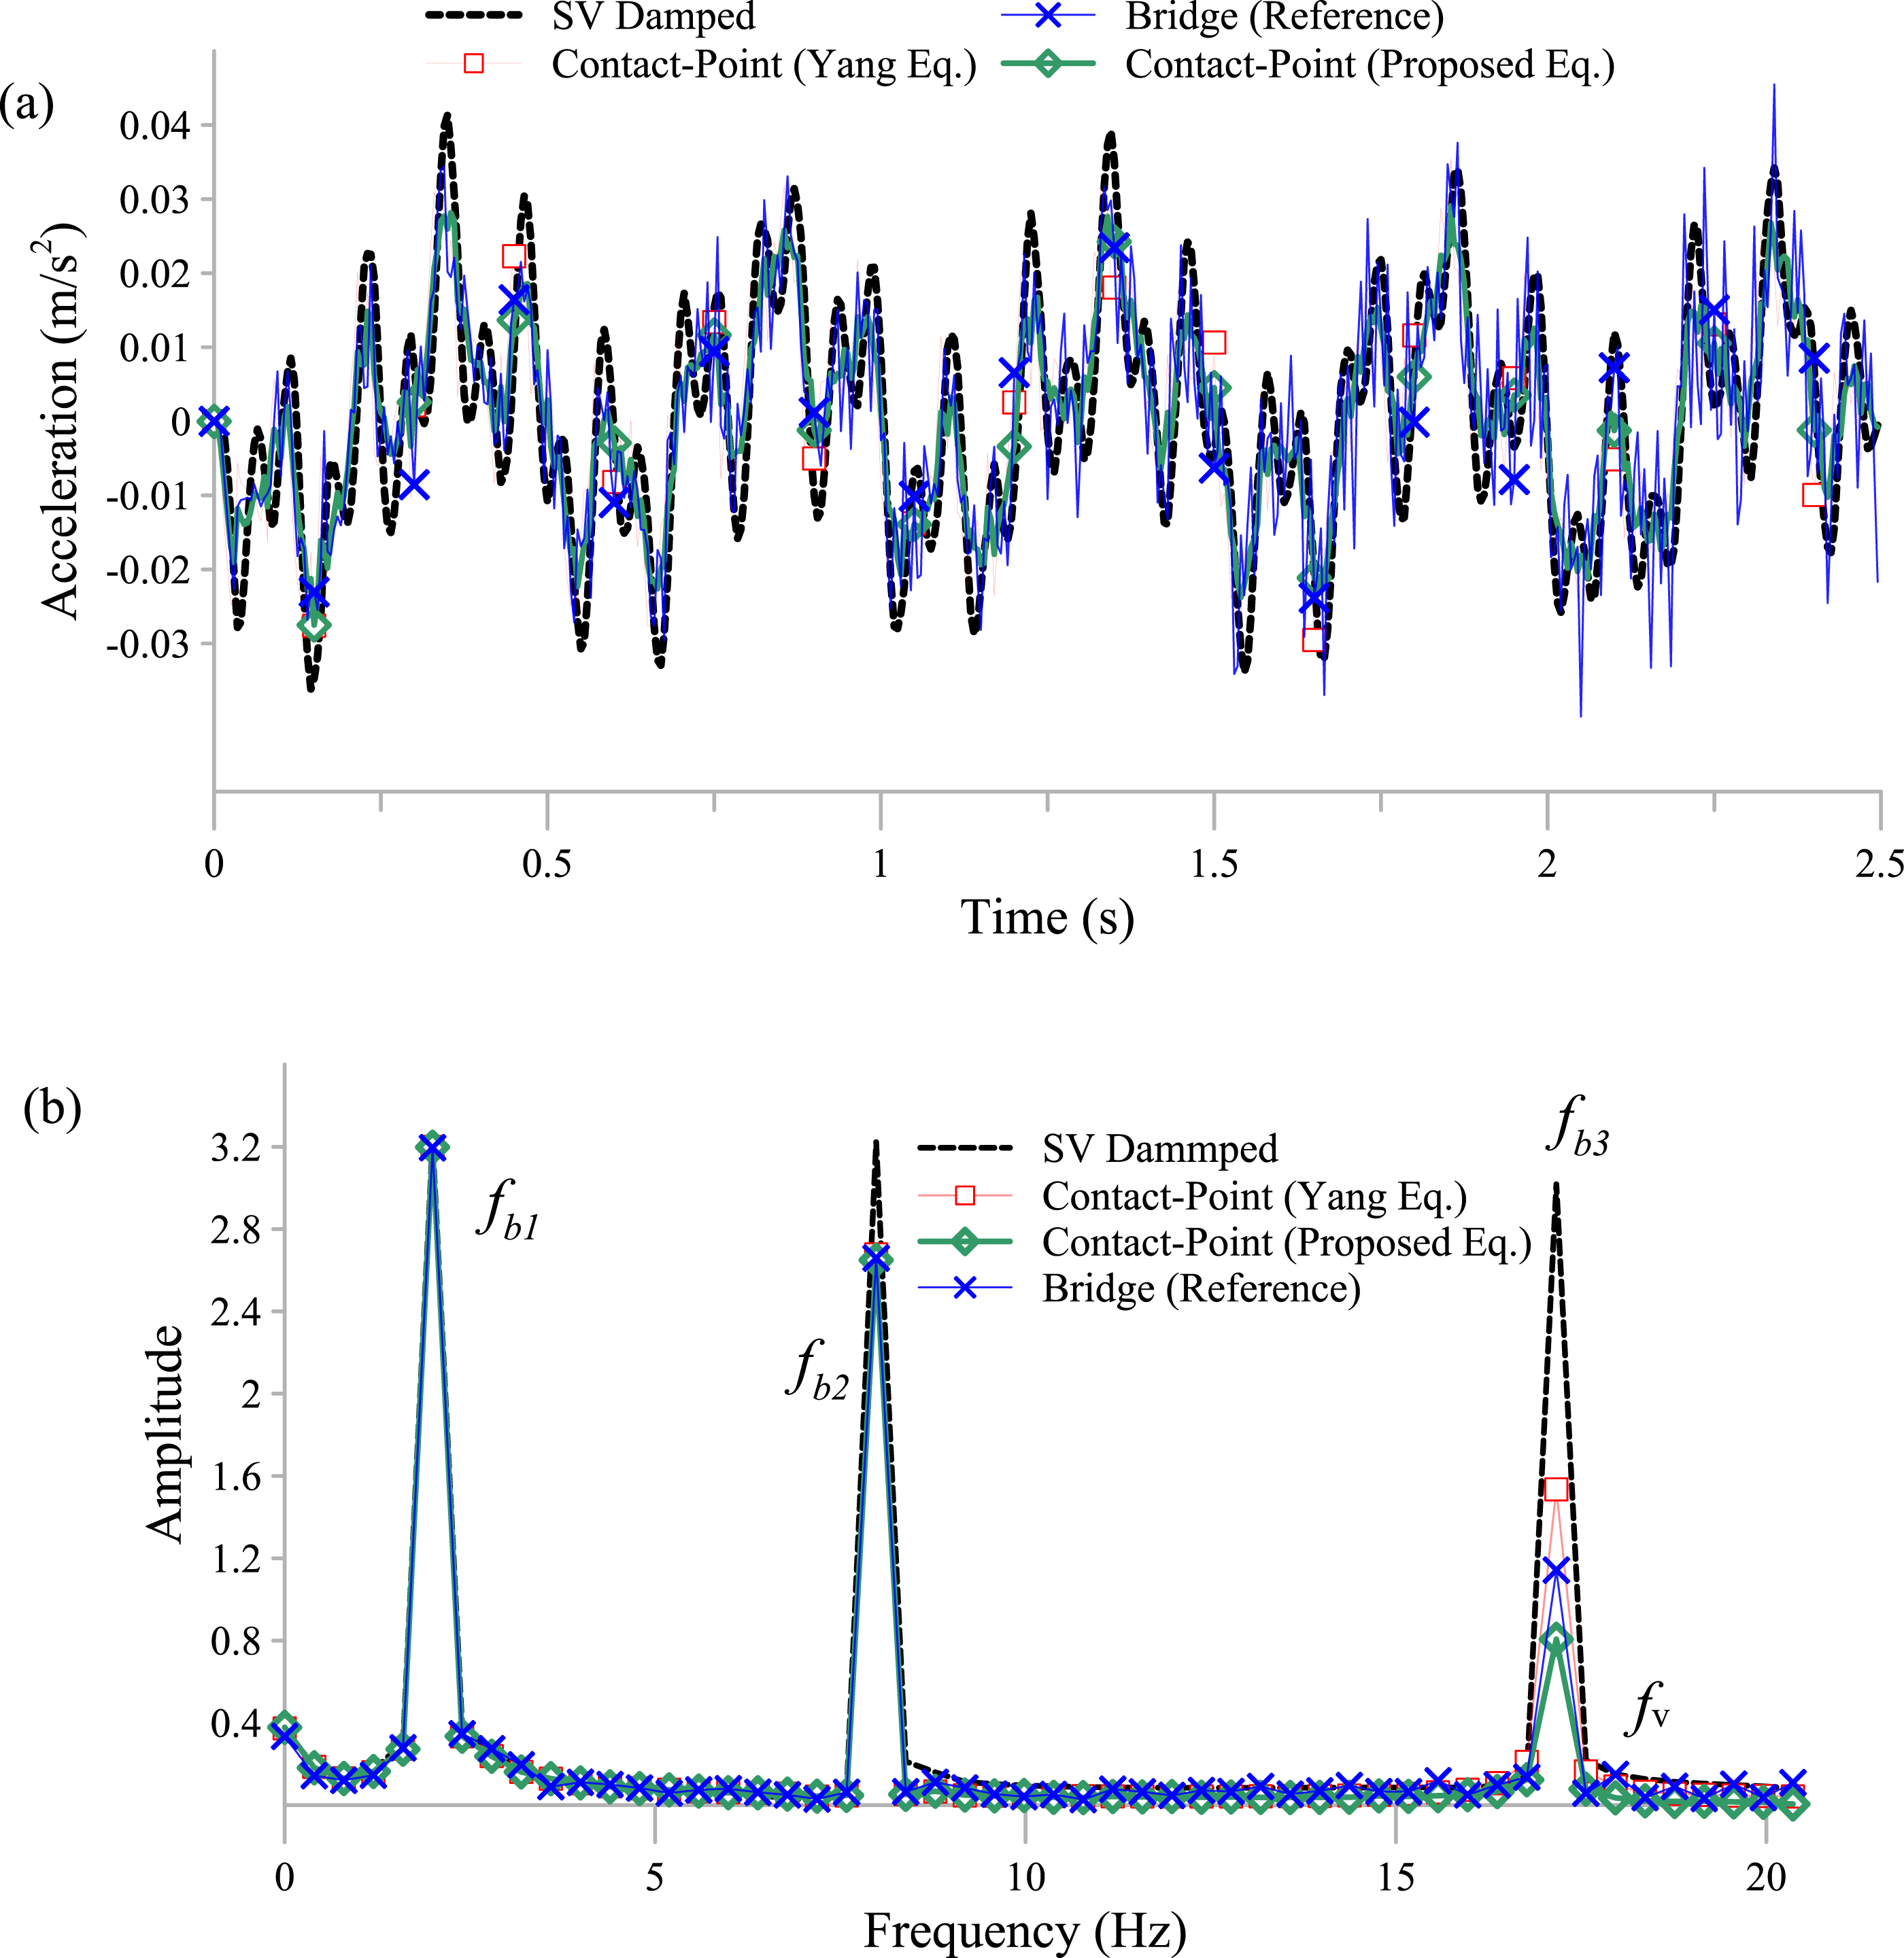
From the FE simulation, it is shown that for higher vehicle frequencies, the CPR proposed by Yang et al. 8 is not suitable for damped vehicle with low frequencies. However, for damped vehicles with higher frequencies, both the proposed equations or equation proposed by Yang et al. 8 can be used. This shows, for experimental work, a vehicle with higher frequency and high damping will have higher transmissibility of the bridge vibration.
Frequency-free laboratory vehicle
The second part of this paper shows the design a frequency-free vehicle which is a vehicle that is free from its own frequency so it can provide high transmissibility of the dynamic responses of the bridge. This means the vehicle’s frequency is so high that it is not captured in its own response. The vehicle should be designed as single axle vehicle as recommended by.
49
Also, the wheels are selected as PU (polyurethane) wheel as shown in Figure 6(b), which are recognized to be superior to other kinds of wheel such as inflated and plastic wheels.13,14,50 For the measurement equipment, the setting is shown in Figure 7. A hammer test is performed to excite the beam, providing a simple and convenient excitation source, with two sensors recording the vibration of the vehicle and beam simultaneously. Proposal of vehicle setting for stationary condition: (a) vehicle and (b) wheel. (a) Equipment of data collection of vibration, (b) Stationary vehicle parked at the first quarter same location with the direct accelerometer, and (c) test hammer.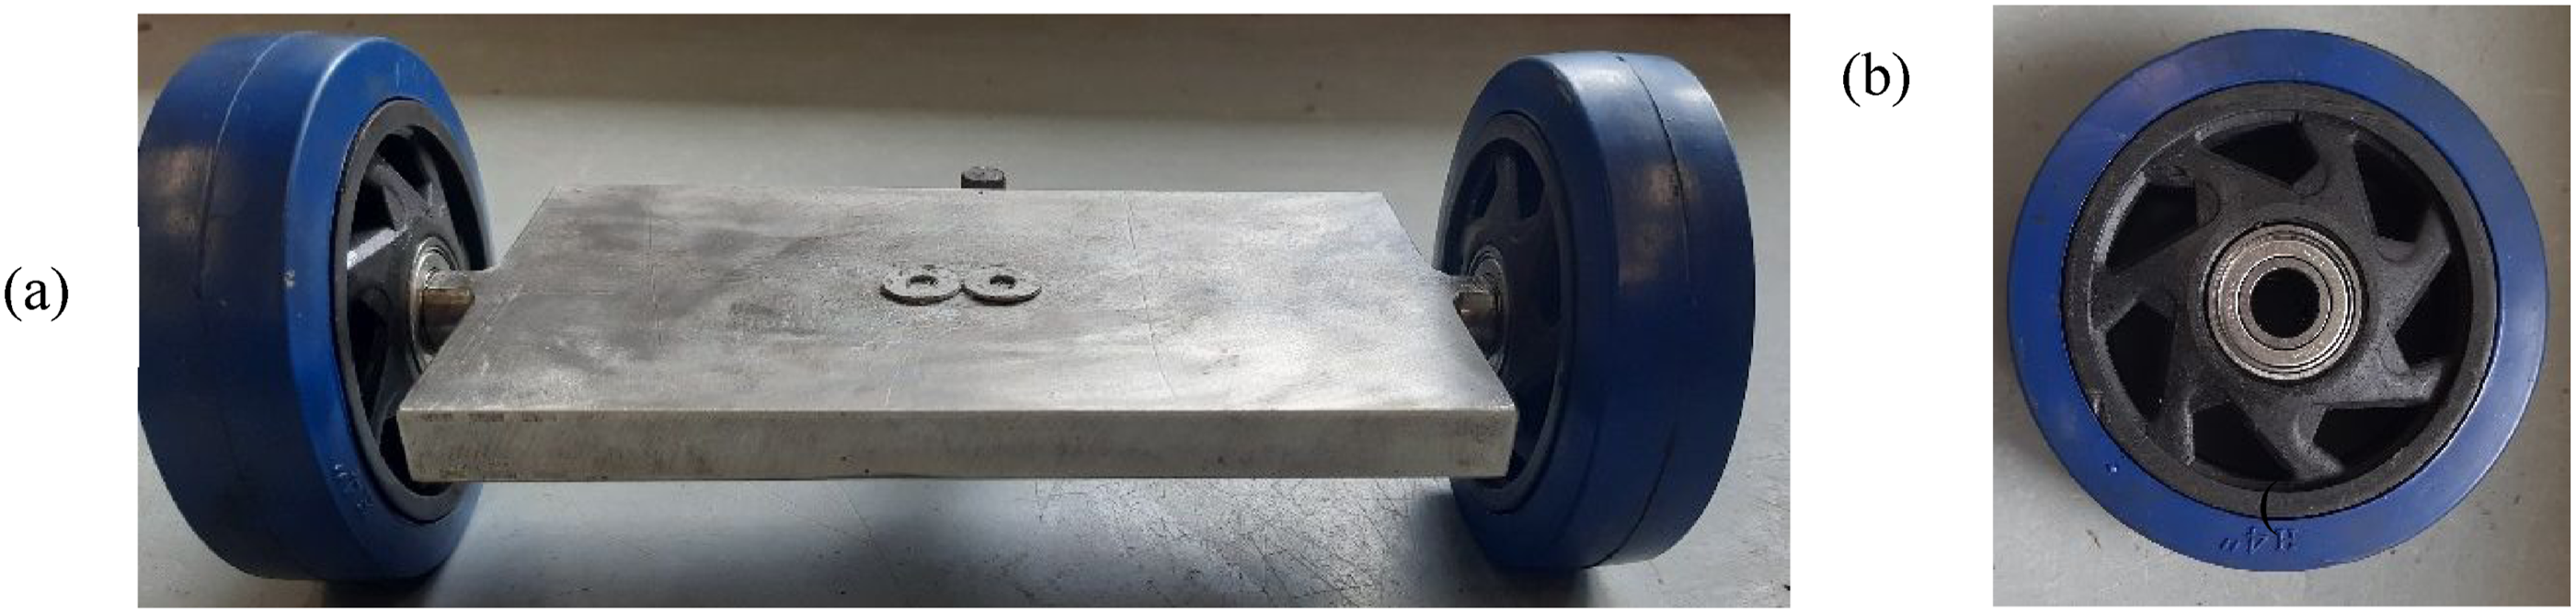
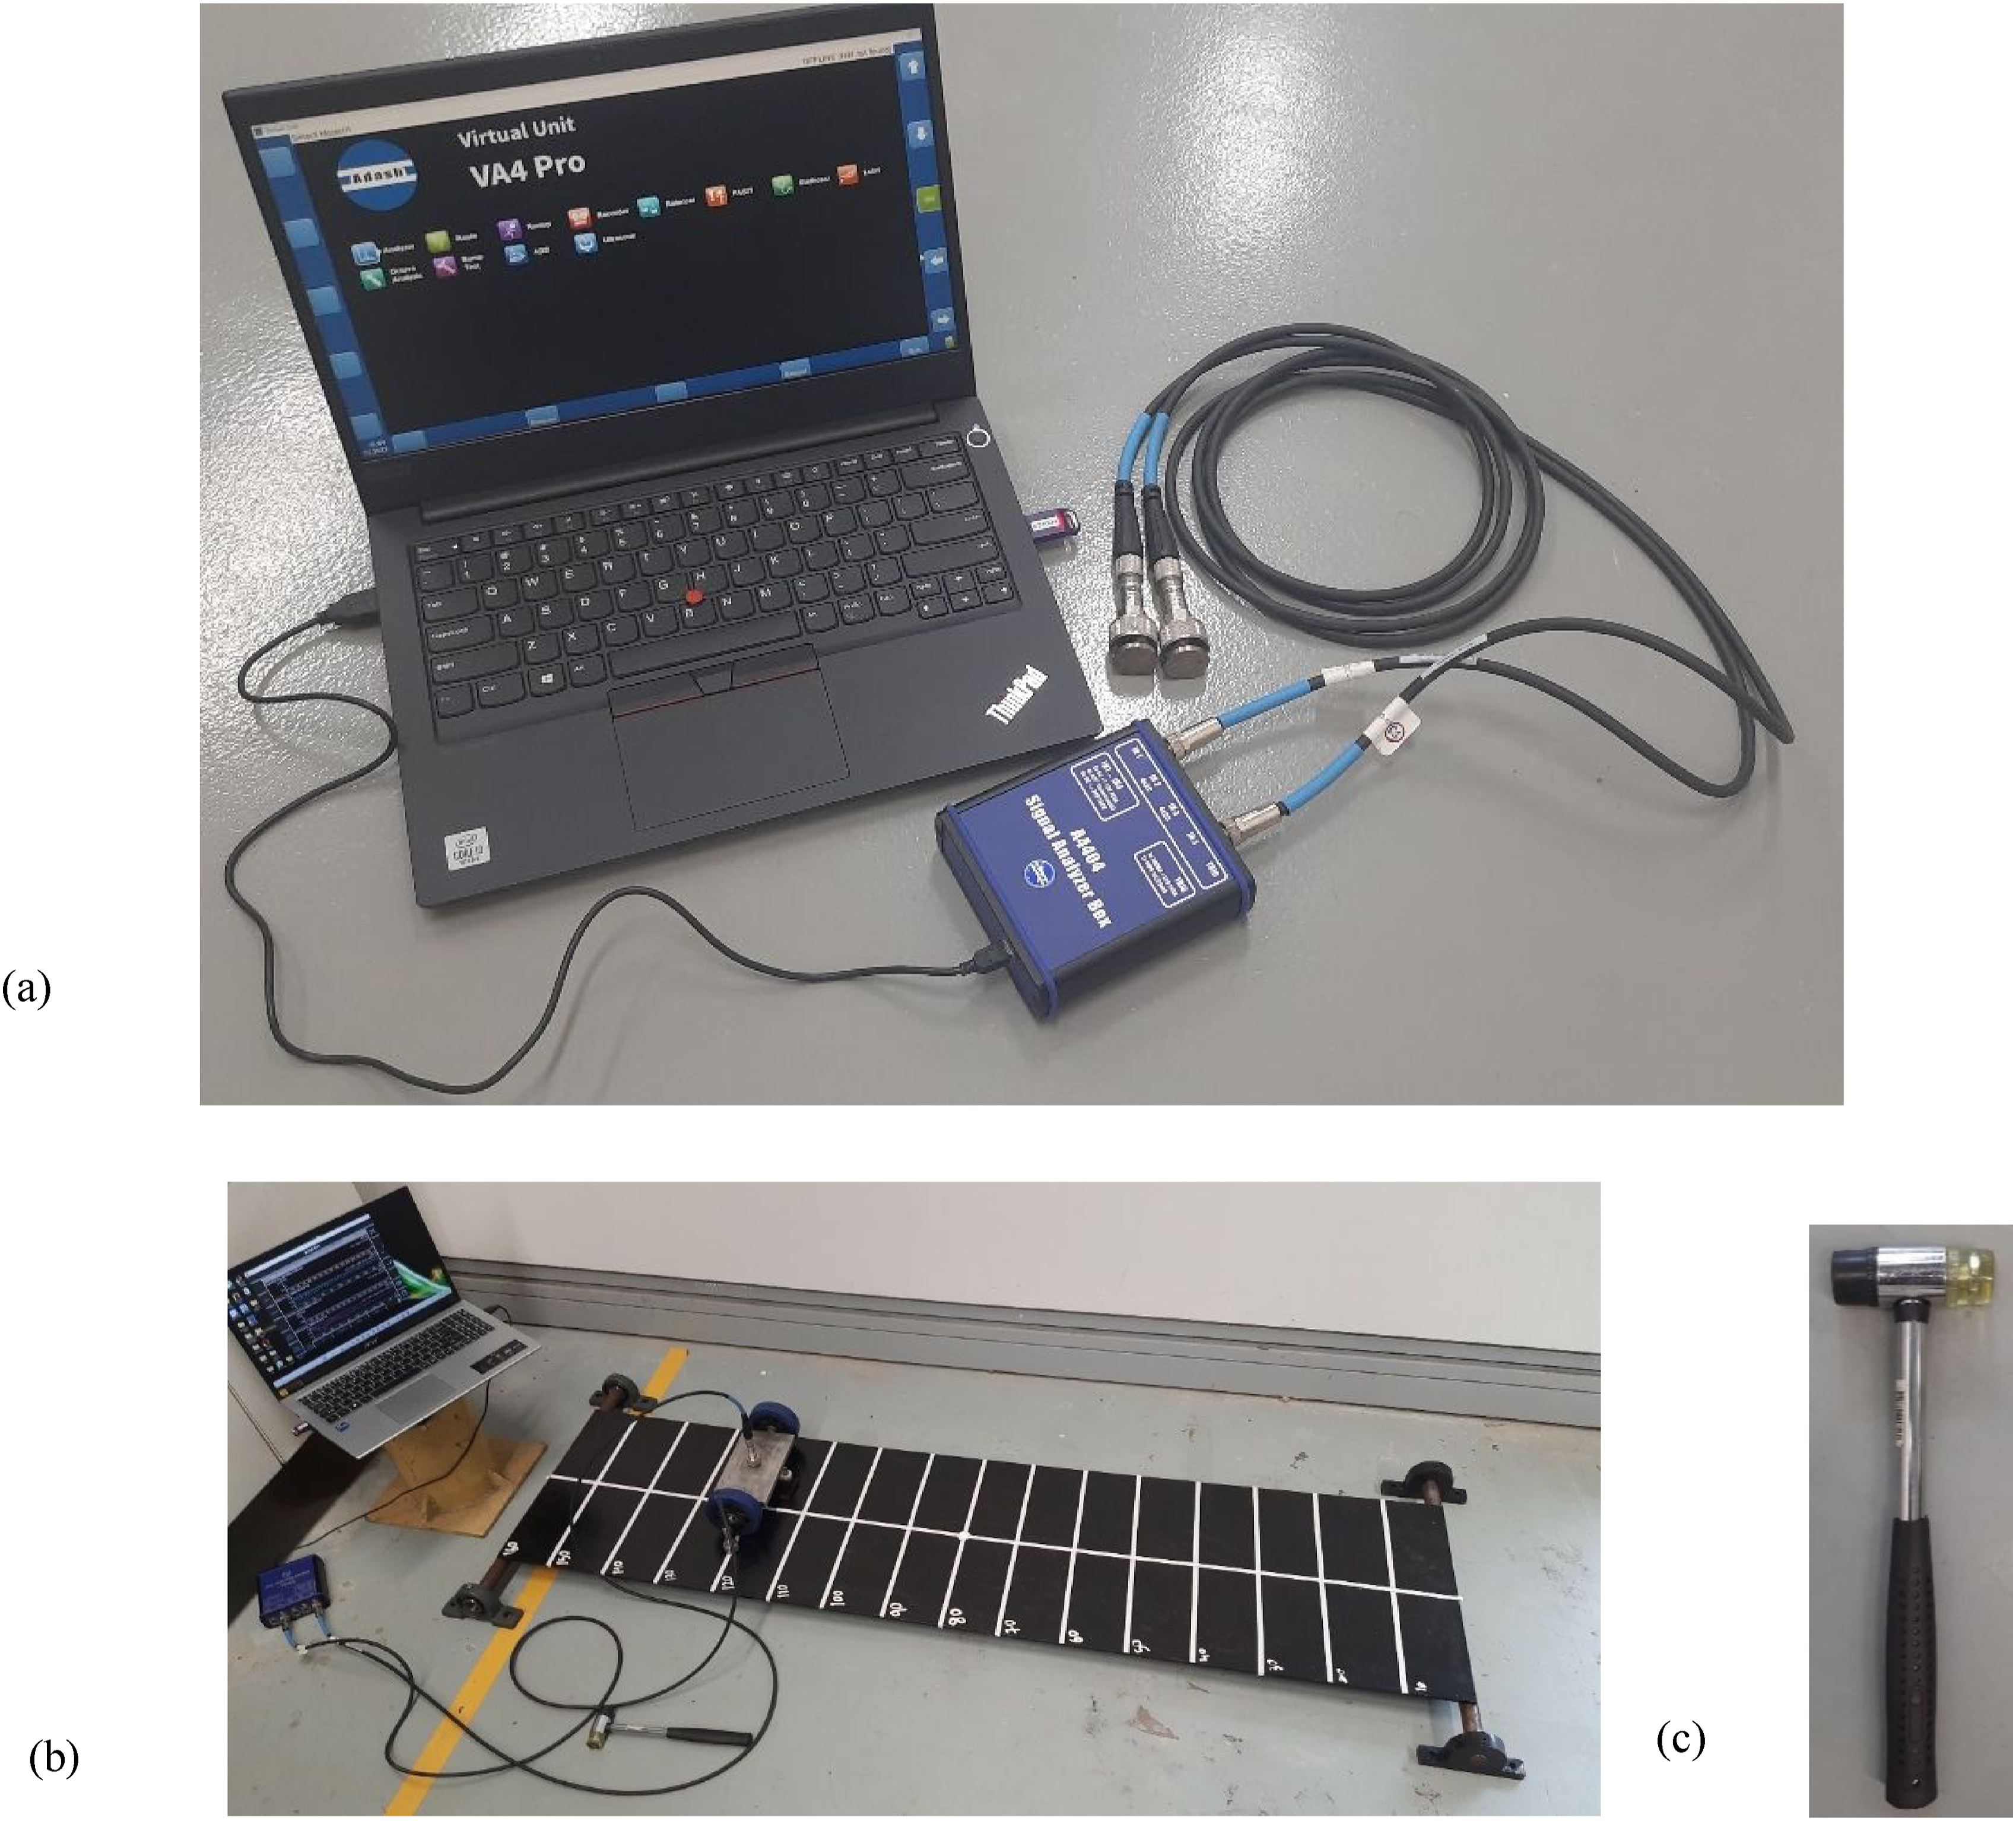
The beam is made of steel with a length of 1600 mm, width of 400 mm, and thickness of 6 mm. The boundary condition of the bridge is simply supported. The dynamic responses (displacement, velocity, and acceleration) are compared on the first quarter of the beam to show all possible frequency modes. One accelerometer is mounted on the vehicle, and the other one is mounted on the beam directly. Comparisons between the direct and indirect measurements are conducted for the time-domain response, frequency-domain response, damping ratios, and mode shapes.
Time-domain comparison
Two accelerometers are used simultaneously for comparison of the dynamic response of the beam induced by the test hammer test. The location of accelerometer is chosen to be at the first quarter of the beam. The displacement, velocity, and acceleration responses comparison between the vehicle and the bridge after the impact test is shown Figure 8. The responses show good agreement between the direct and vehicle measurements as shown in the displacement, velocity, and acceleration responses. Dynamic responses of stationary vehicle at quarter-span versus direct bridge measurements (a) Displacement, (b) Velocity and (c) Acceleration.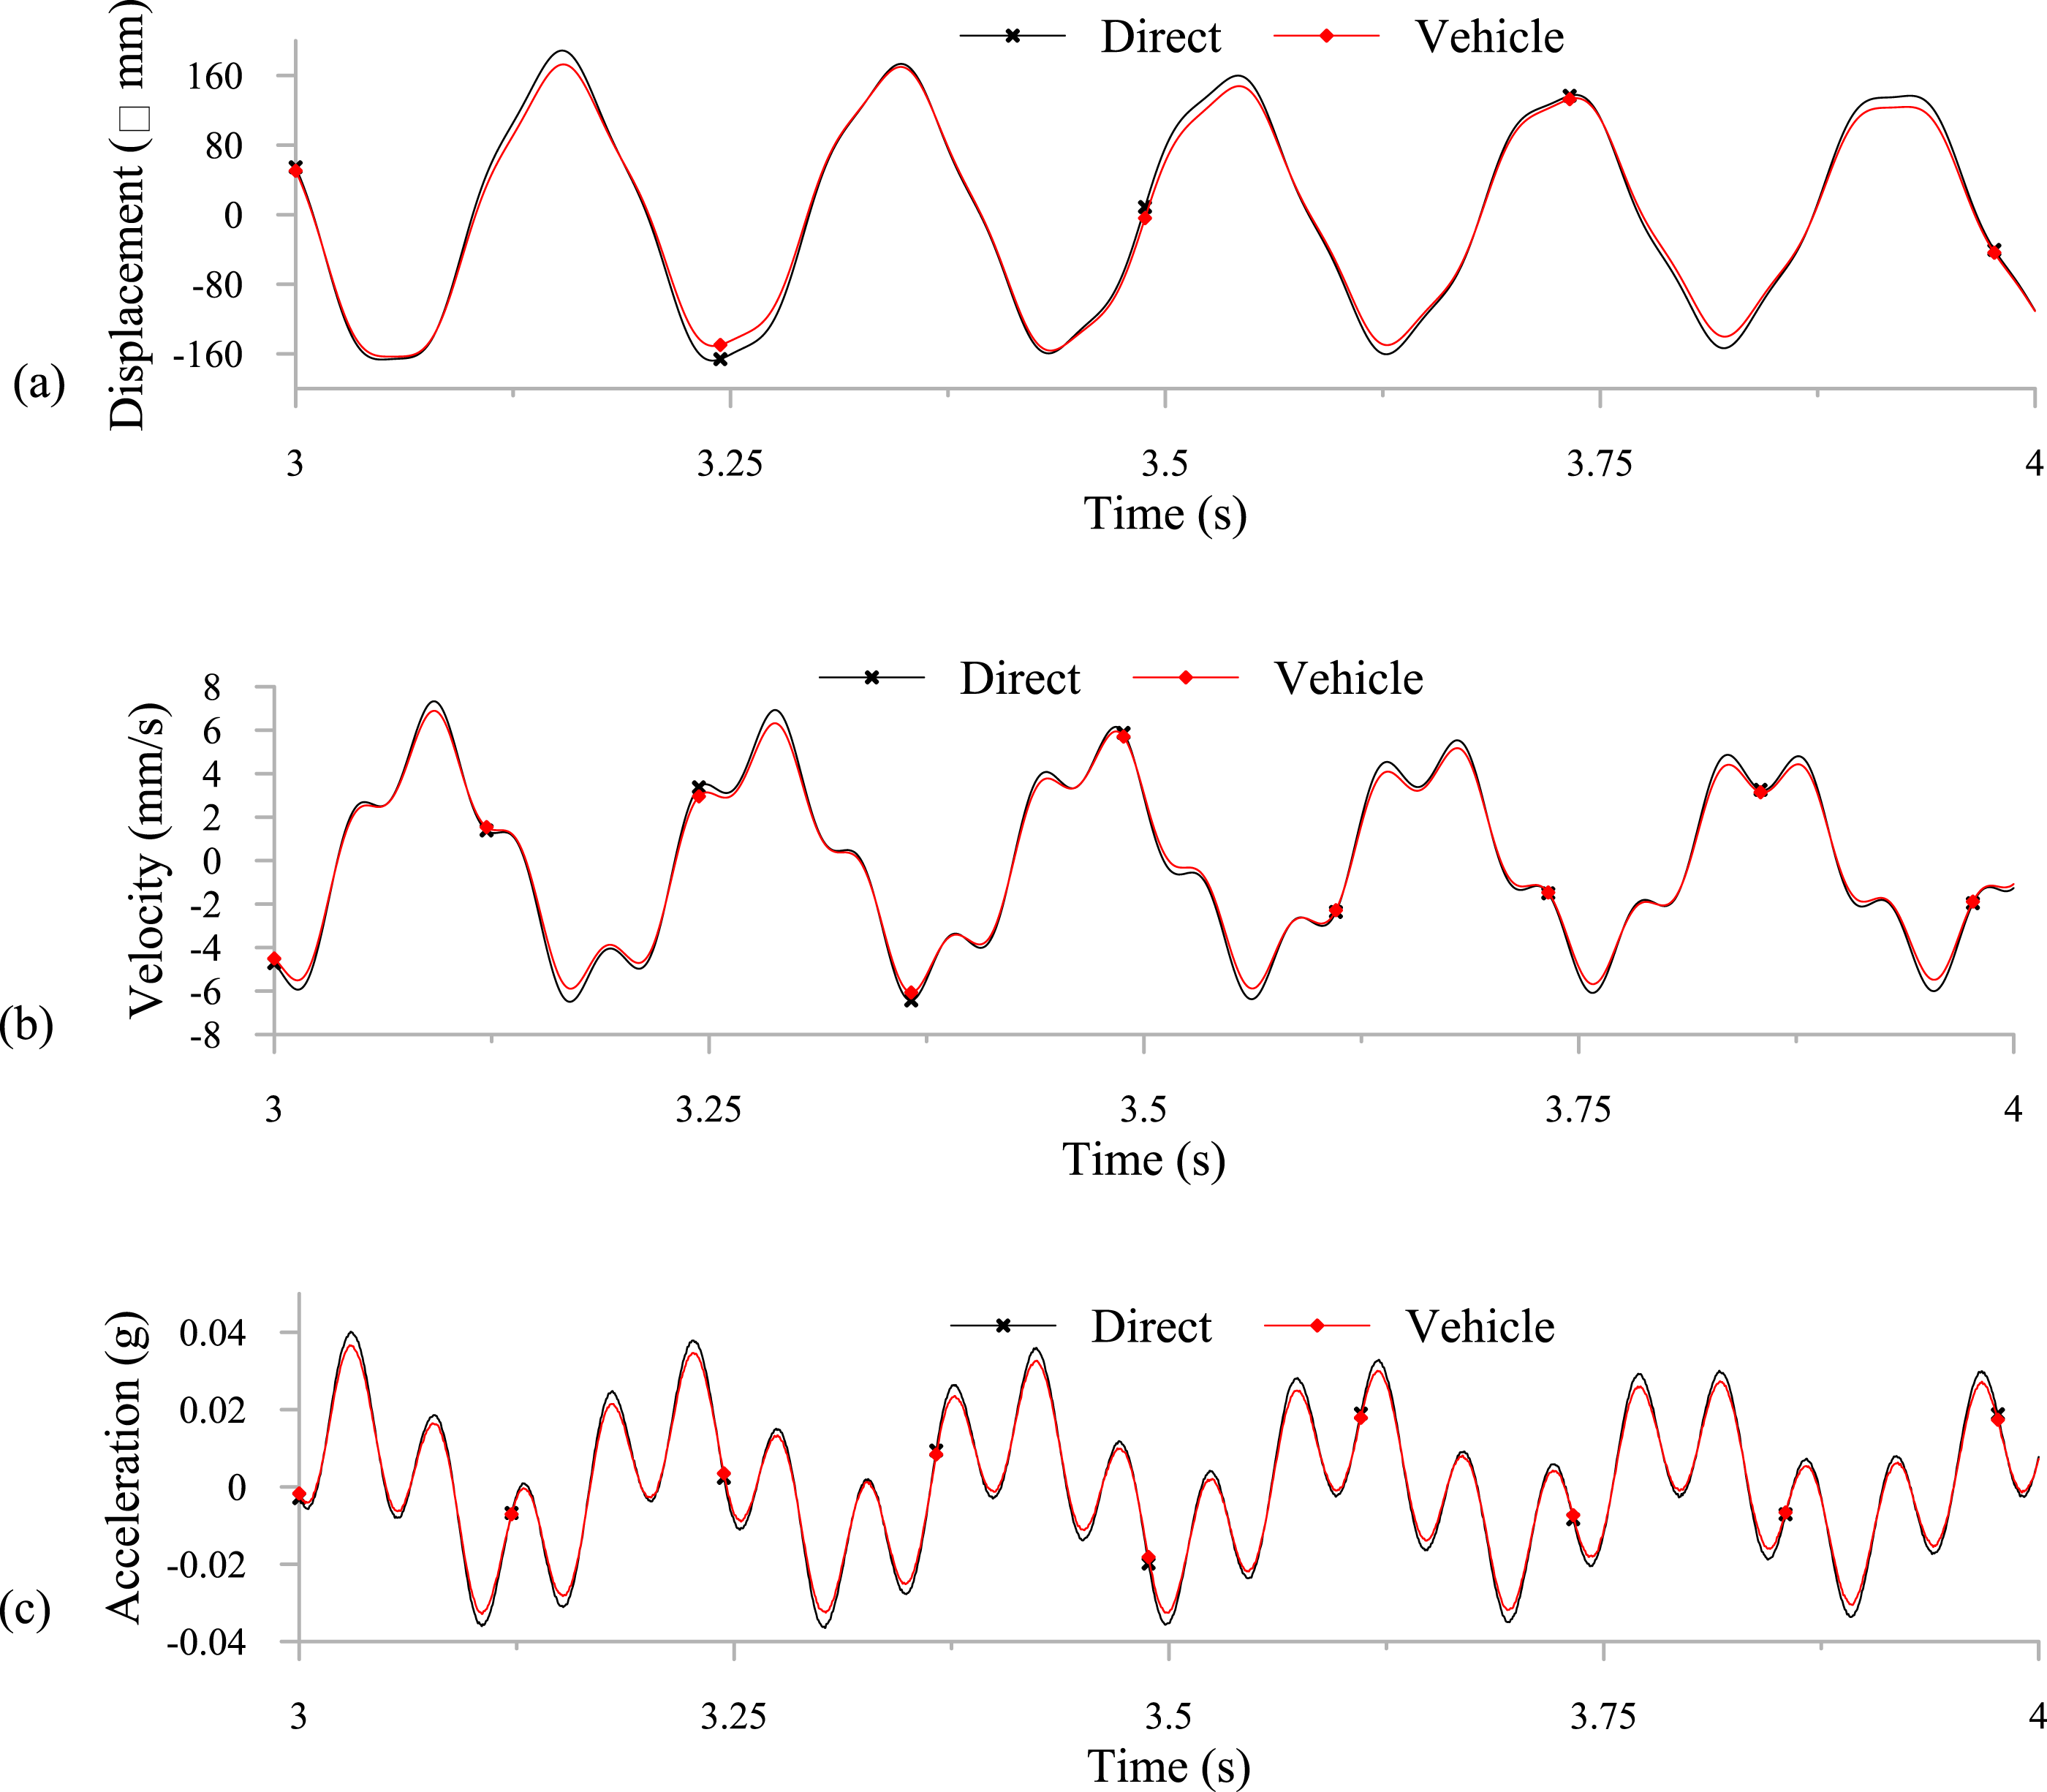
Frequency-domain comparison
After comparing the responses in the time-domain, the responses in the frequency-domain are compared. Figure 9 shows the FFT spectrum obtained from the direct and indirect measurements taken from first quarter of the span. From the time-domain and frequency-domain responses, it is shown that the indirect measurements provide accurate results when compared with the reference response, that is, direct measurements. The 1st mode of vibration is at 5 Hz and the 2nd mode is at 20.5 Hz. It is noticed that the 2nd mode of the bridge is more dominant over the first mode from the measurements taken from quarter span. Frequency-domain response of the stationary vehicle versus direct measurements taken from quarter-span.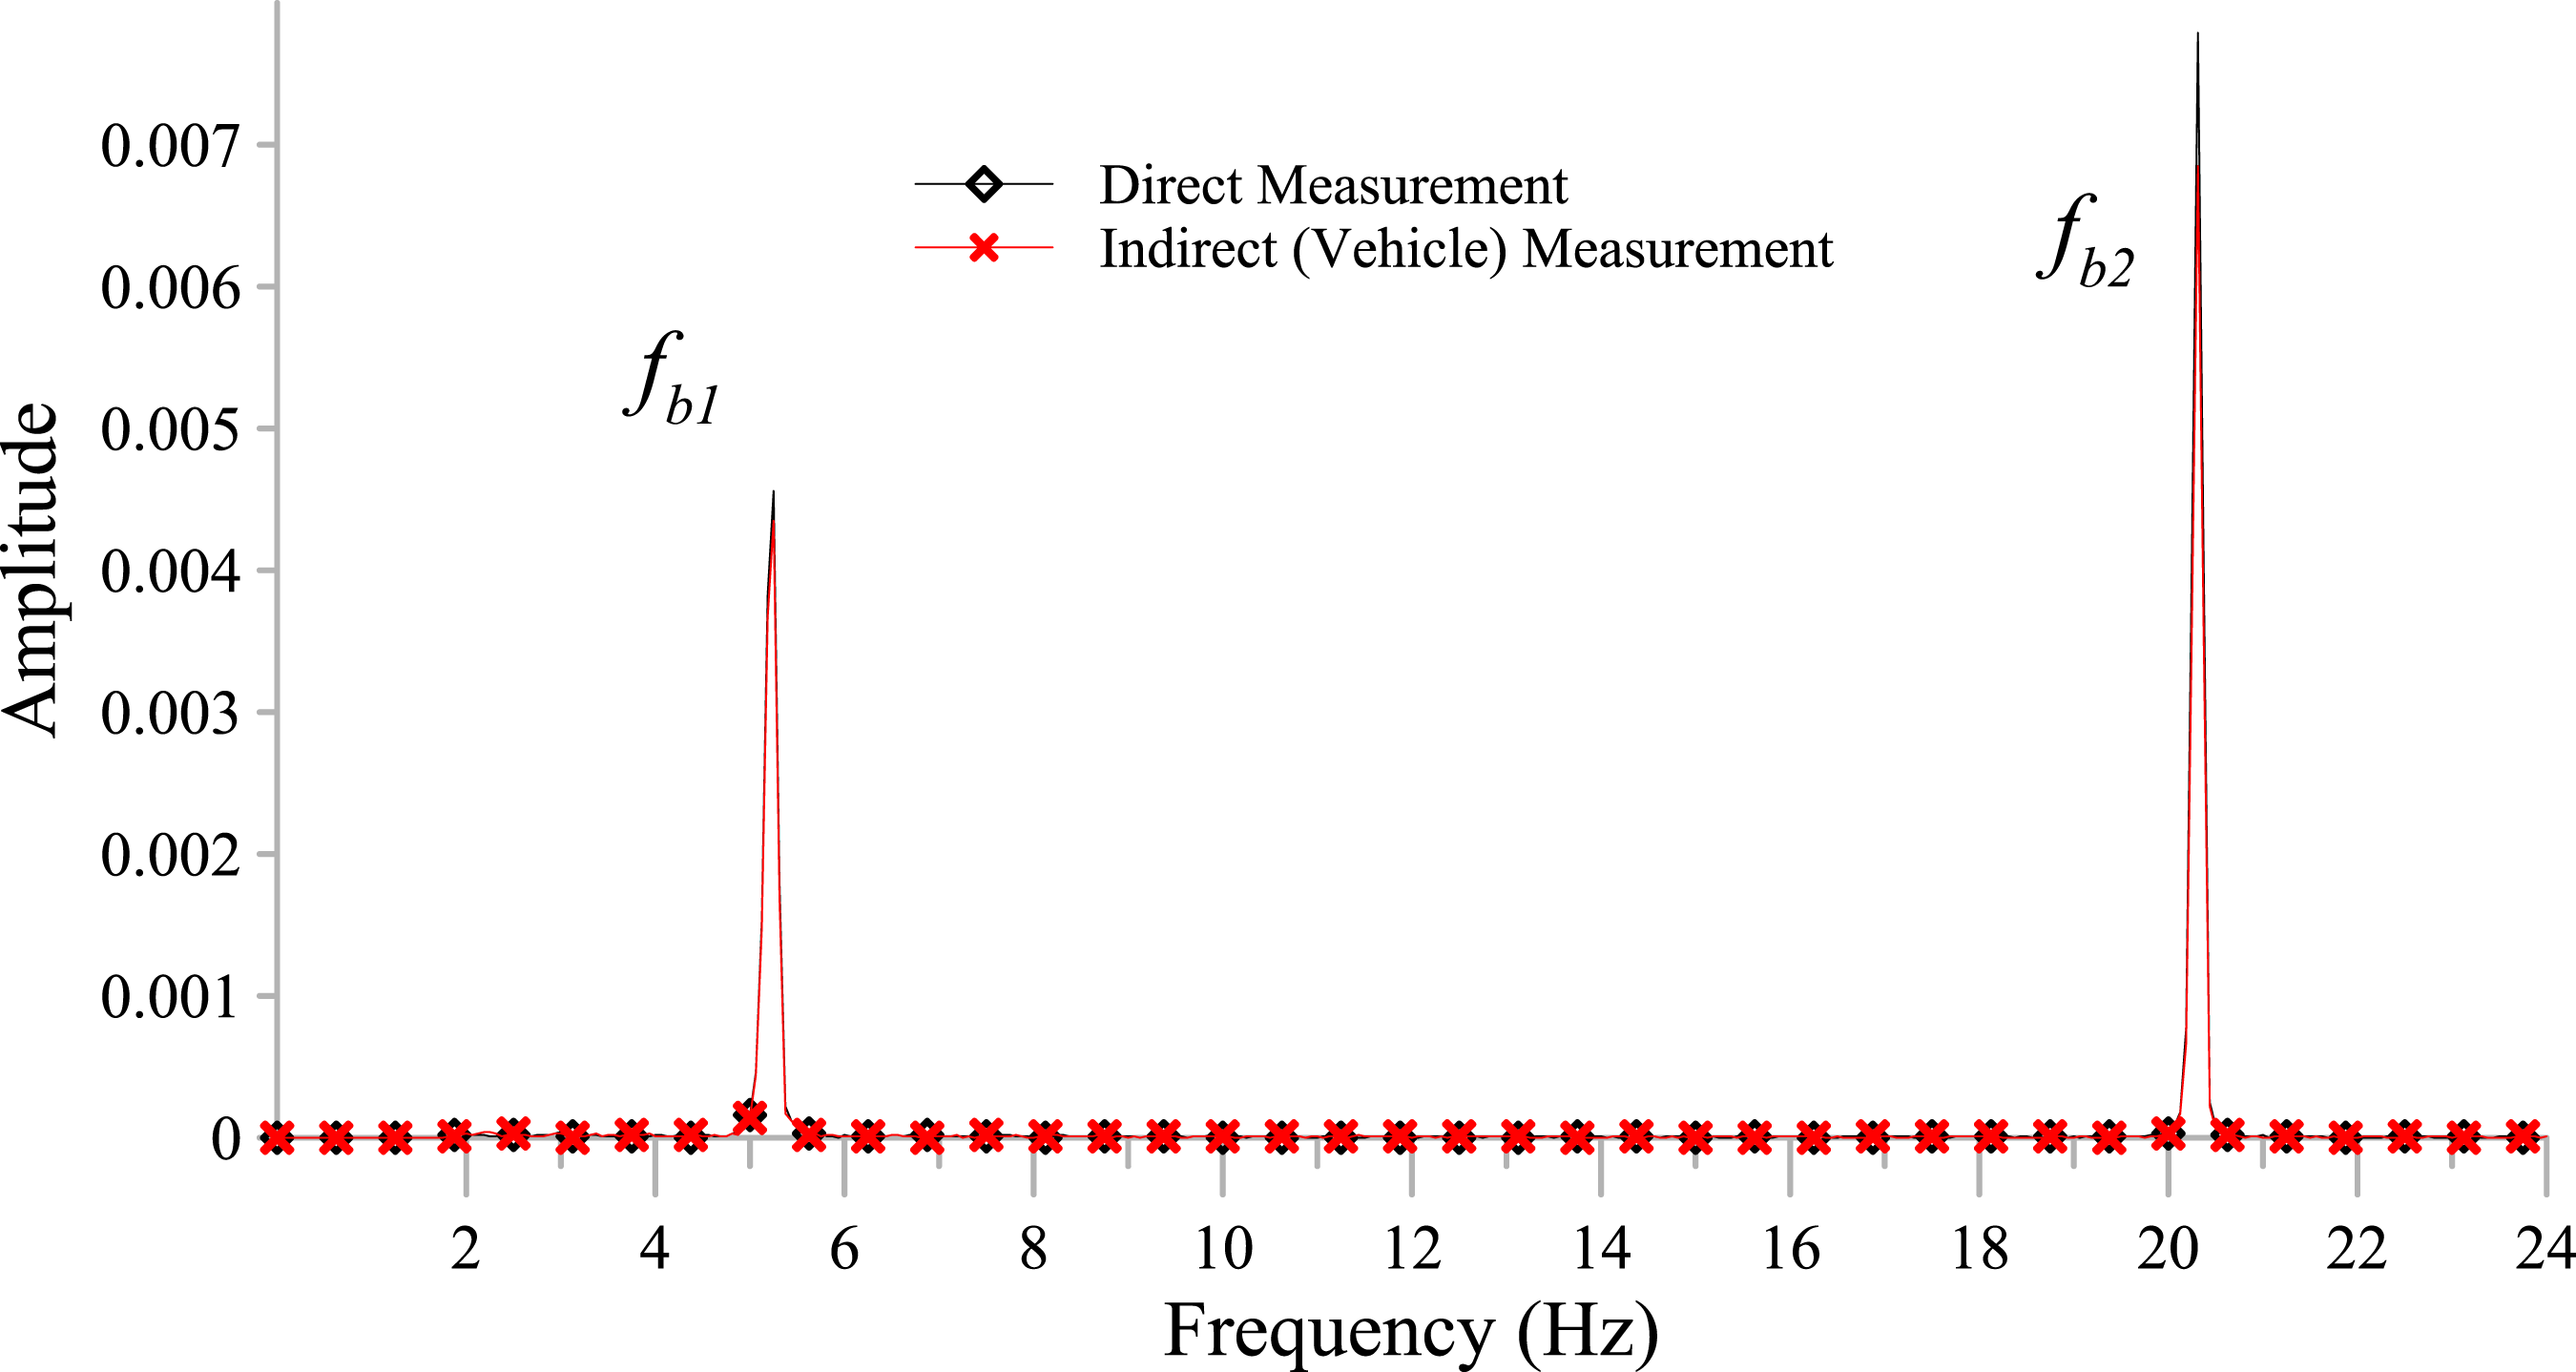
Damping ratio comparison
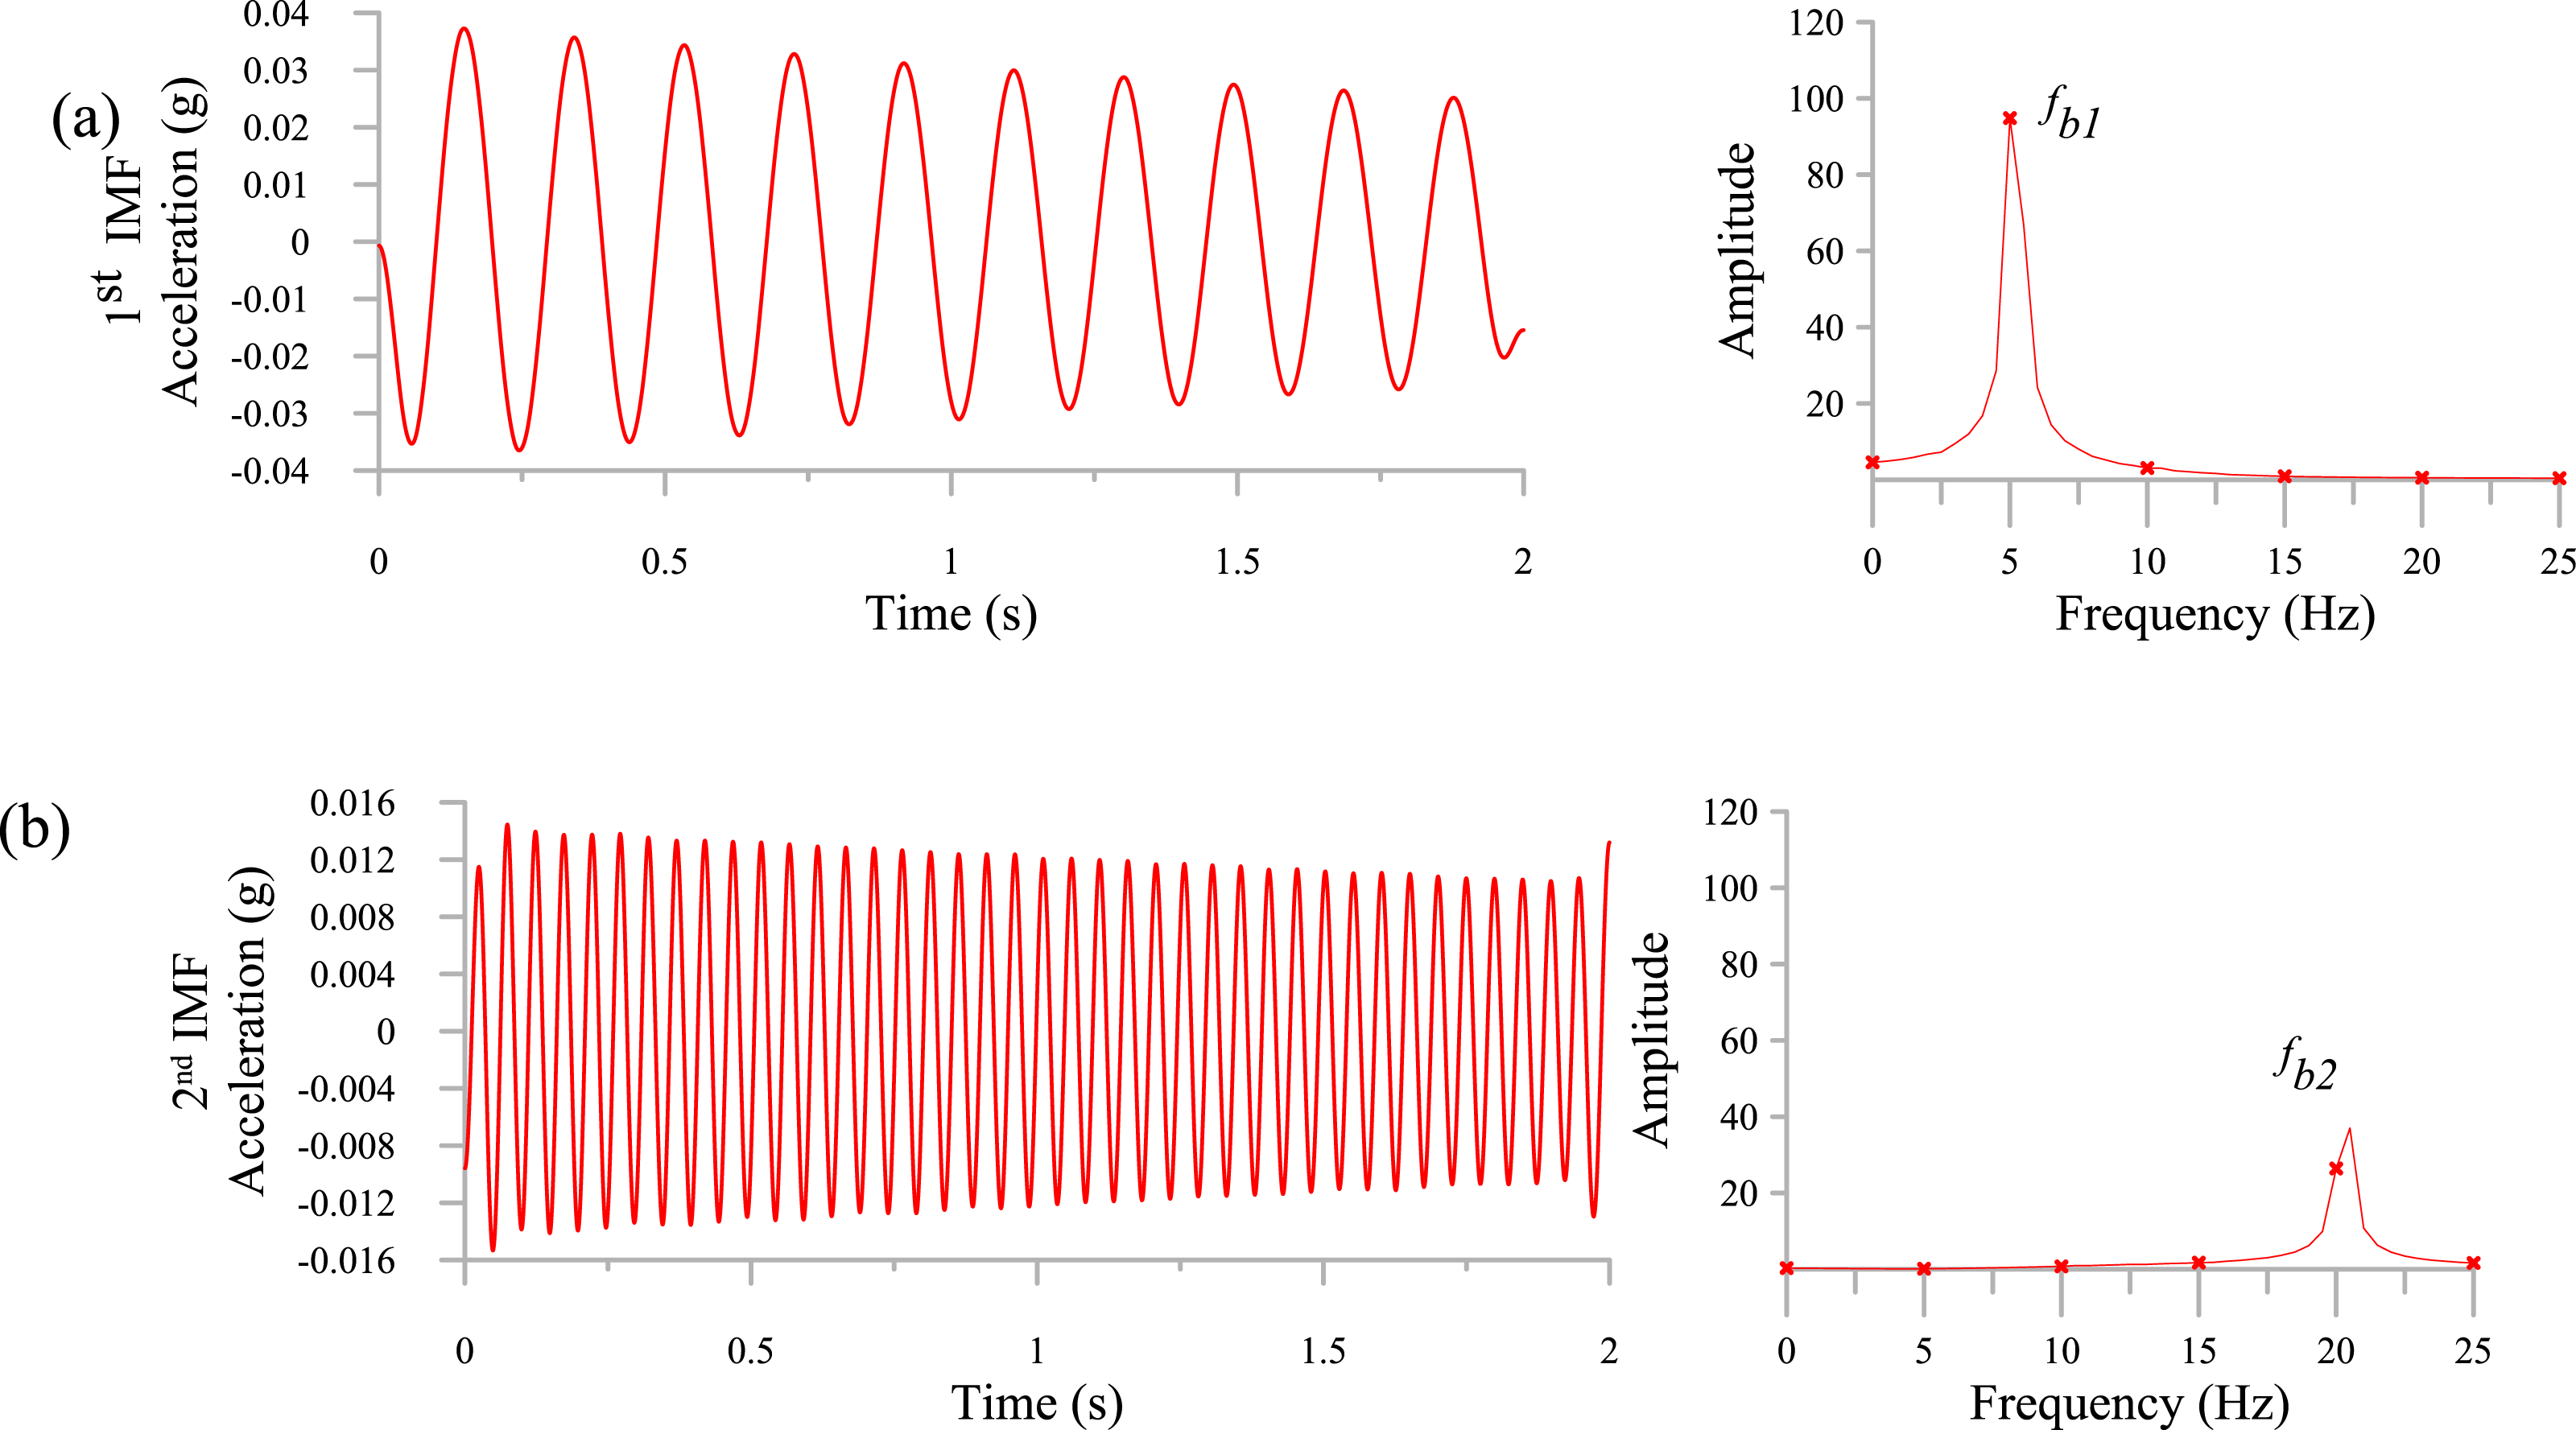
There are two dominant modes for this beam. Therefore, damping ratio can be calculated for these two modes. To calculate the damping ratio, variational mode decomposition (VMD) is used to decompose the signal intrinsic mode functions (IMFs). Also, random decrement technique (RDT) is used to obtain free decay response. The following procedures are followed to calculate the damping ratio
14
: (1) Employ the VMD to decompose the measured signal into a set of narrow band components (IMFs). (2) Use RDT to get the free decay response of each IMF. (3) Apply Hilbert transform on the RDT function to get the envelope of the function. (4) Obtain the coefficient of the best fitting linear function of the envelope by the linear least-square method. (5) Retrieve the damping ratio by calculating the absolute value of the coefficient divided by the natural frequency.
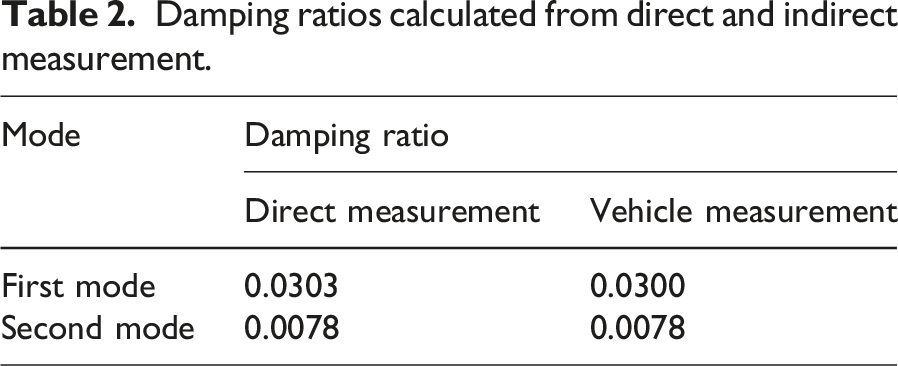
The signals from both the vehicle and direct measurements are decomposed into two IMFs signals, the first IMF represents the 1st mode and the second IMF represents the 2nd mode. Figure 10 shows the 1st and 2nd IMFs of the direct response and their respective FFT spectrum. Figure 11 shows the 1st and 2nd IMFs of the vehicle measurements and their respective FFT response. Each IMF is used to calculate the damping ratio using the previously explained method. The damping ratios calculated by the direct and vehicle measurements are shown in Table 2. It is shown that there is a good agreement of the damping ratio identified by both direct and indirect measurements. Decomposed acceleration response of direct measurements and their respective FFT response: (a) First IMF and (b) Second IMF. Decomposed acceleration response of vehicle measurements and their respective FFT response: (a) First IMF and (b) Second IMF. Damping ratios calculated from direct and indirect measurement.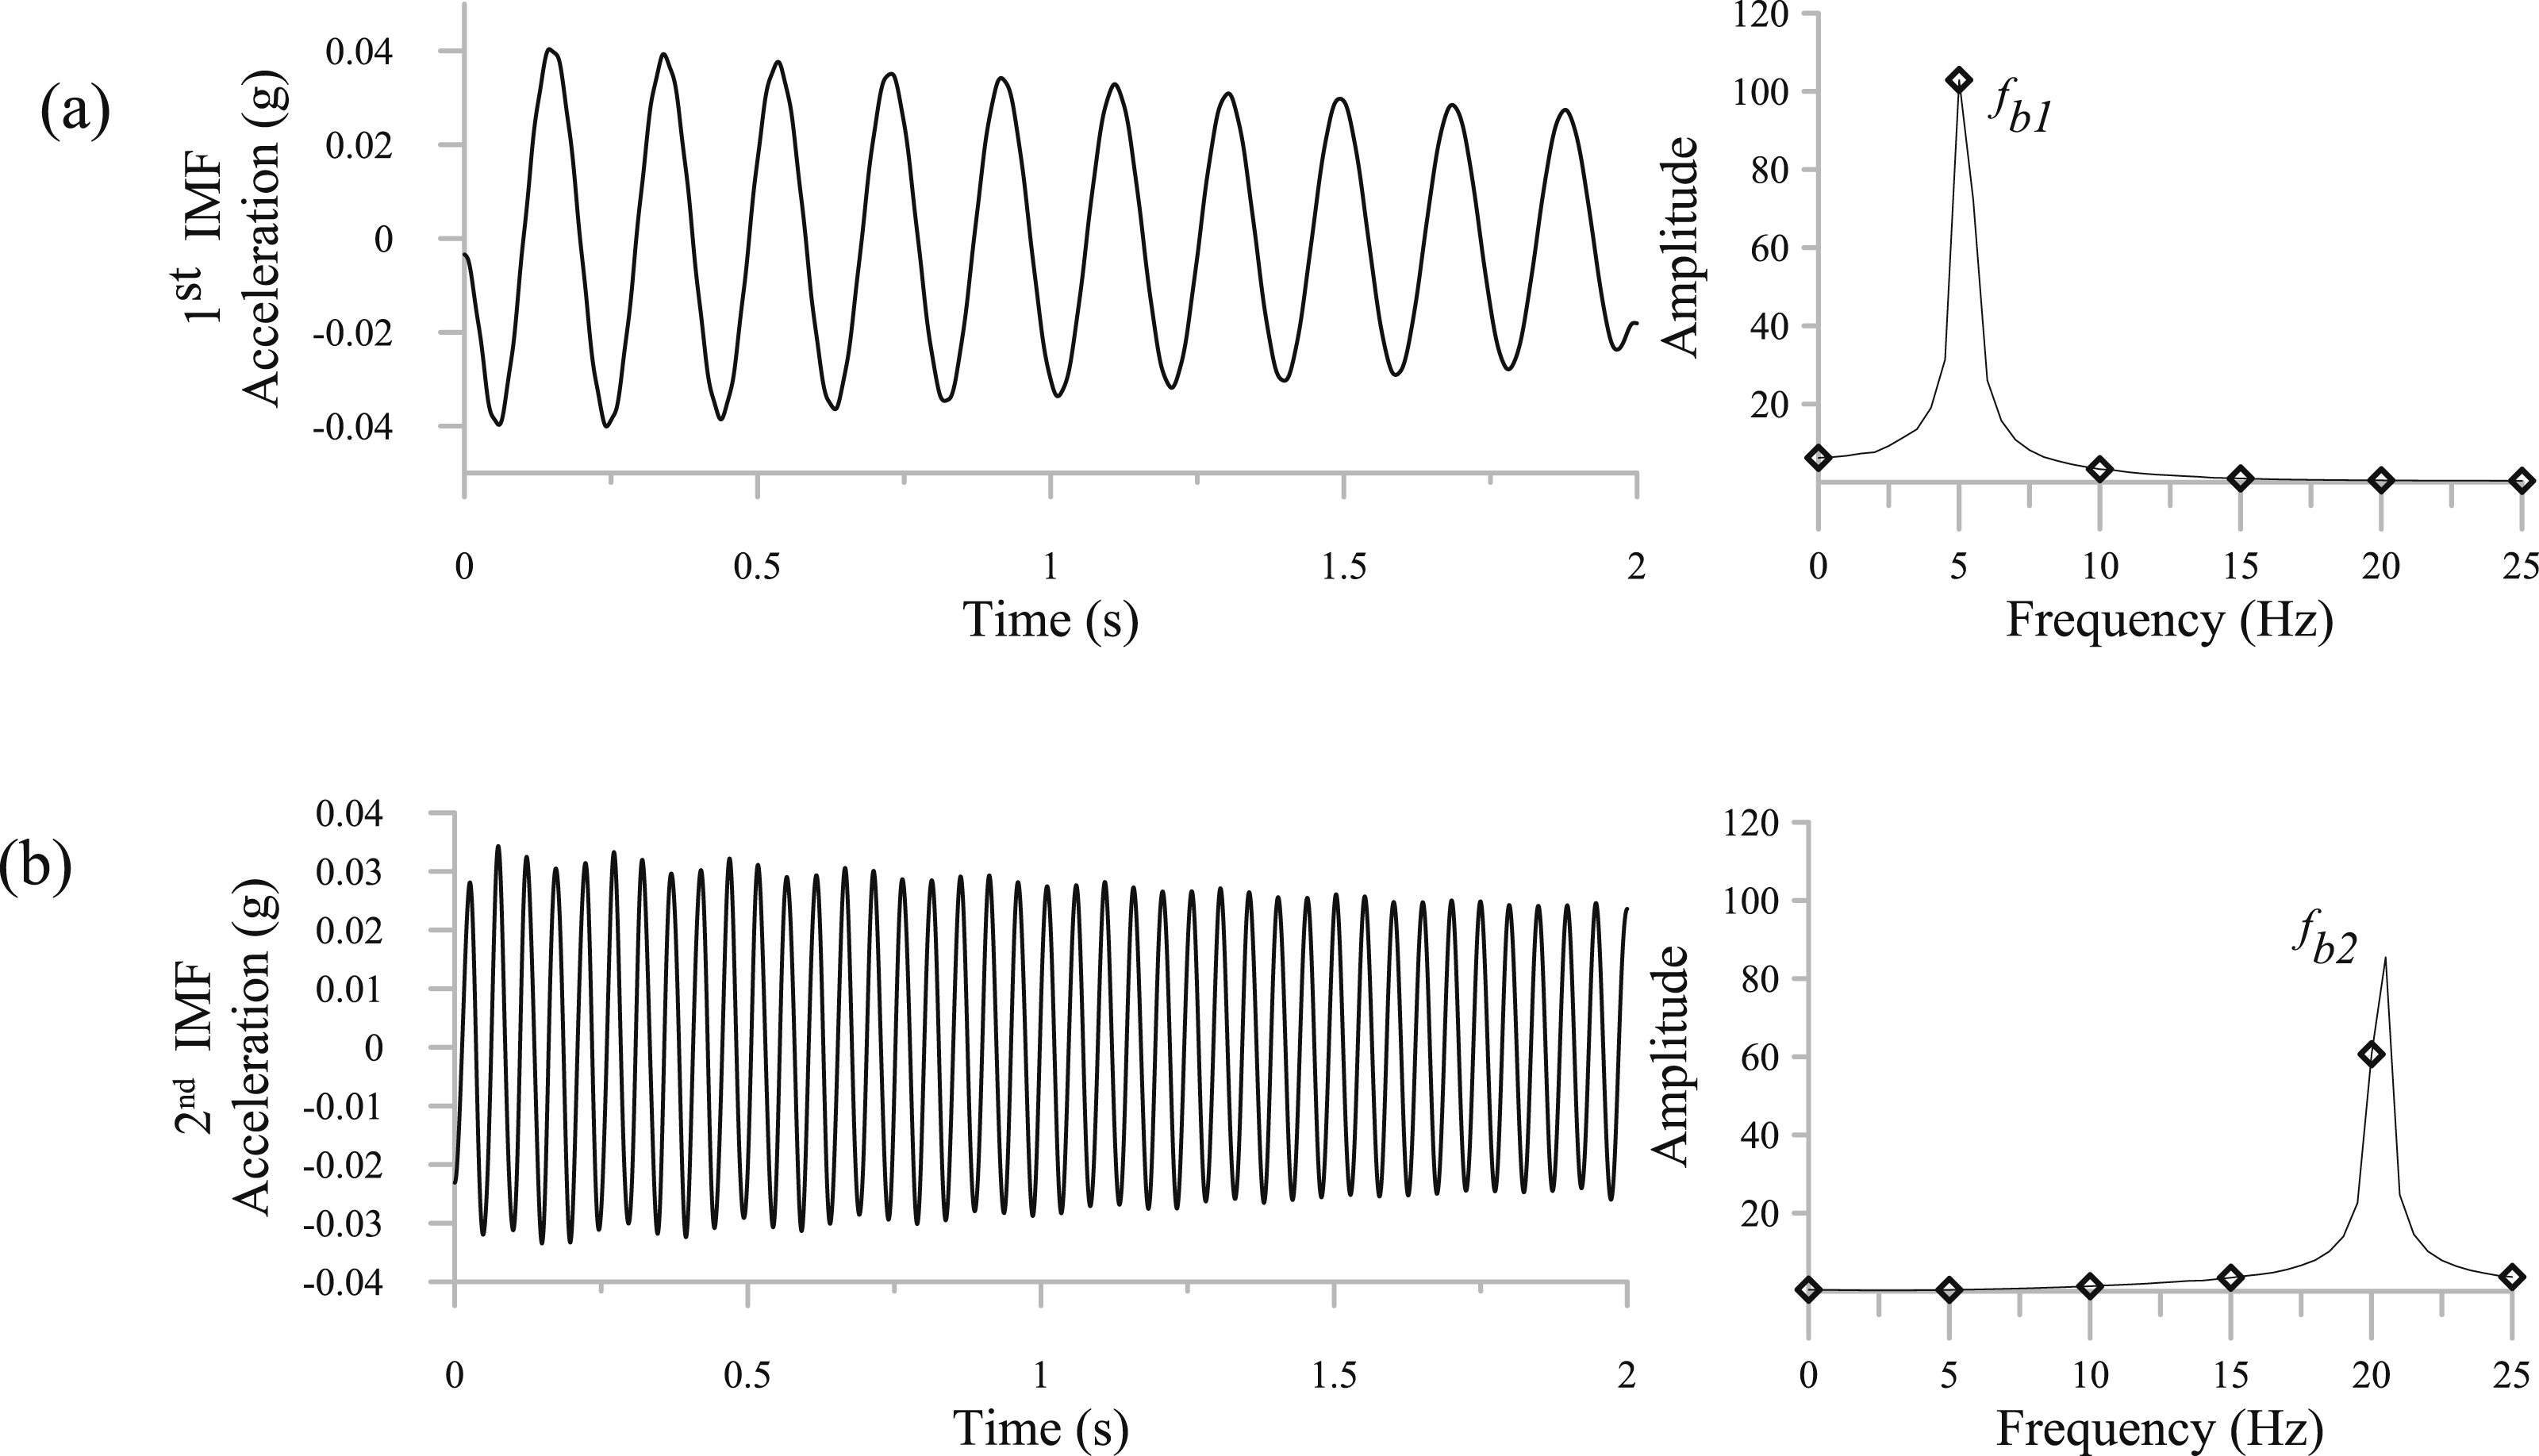
Mode shape comparison
Identifying mode shape requires a reference and a movable measurement point. The reference measurement point is same for all impact tests. The movable point should be placed at each point on the beam. Mode shapes are calculated using the response taken from both measurements, vehicle and direct. To calculate the mode shape of the bridge, the following procedures are followed
14
: (1) Record the frequency spectrum (FFT) response for the vehicle parked at each of the measuring points. (2) Identify the bridge frequencies from the vehicle responses via Fourier spectrum. (3) Calculate the modal amplitude ratios for all the measuring points at each bridge frequency mode. (4) Connect the amplitude ratios of all the measuring points on the bridge sequentially to form the mode shape.
For mode shape identification using the indirect method, the reference point remained the same. The movable sensor was mounted on the vehicle, and the vehicle was moved on each location on the beam. First and second mode shapes of the beam are shown in Figure 12. There is good agreement between the stationary vehicle and direct measurement. Mode shape of the beam using stationary vehicle and direct measurements (a) First mode (b) second mode.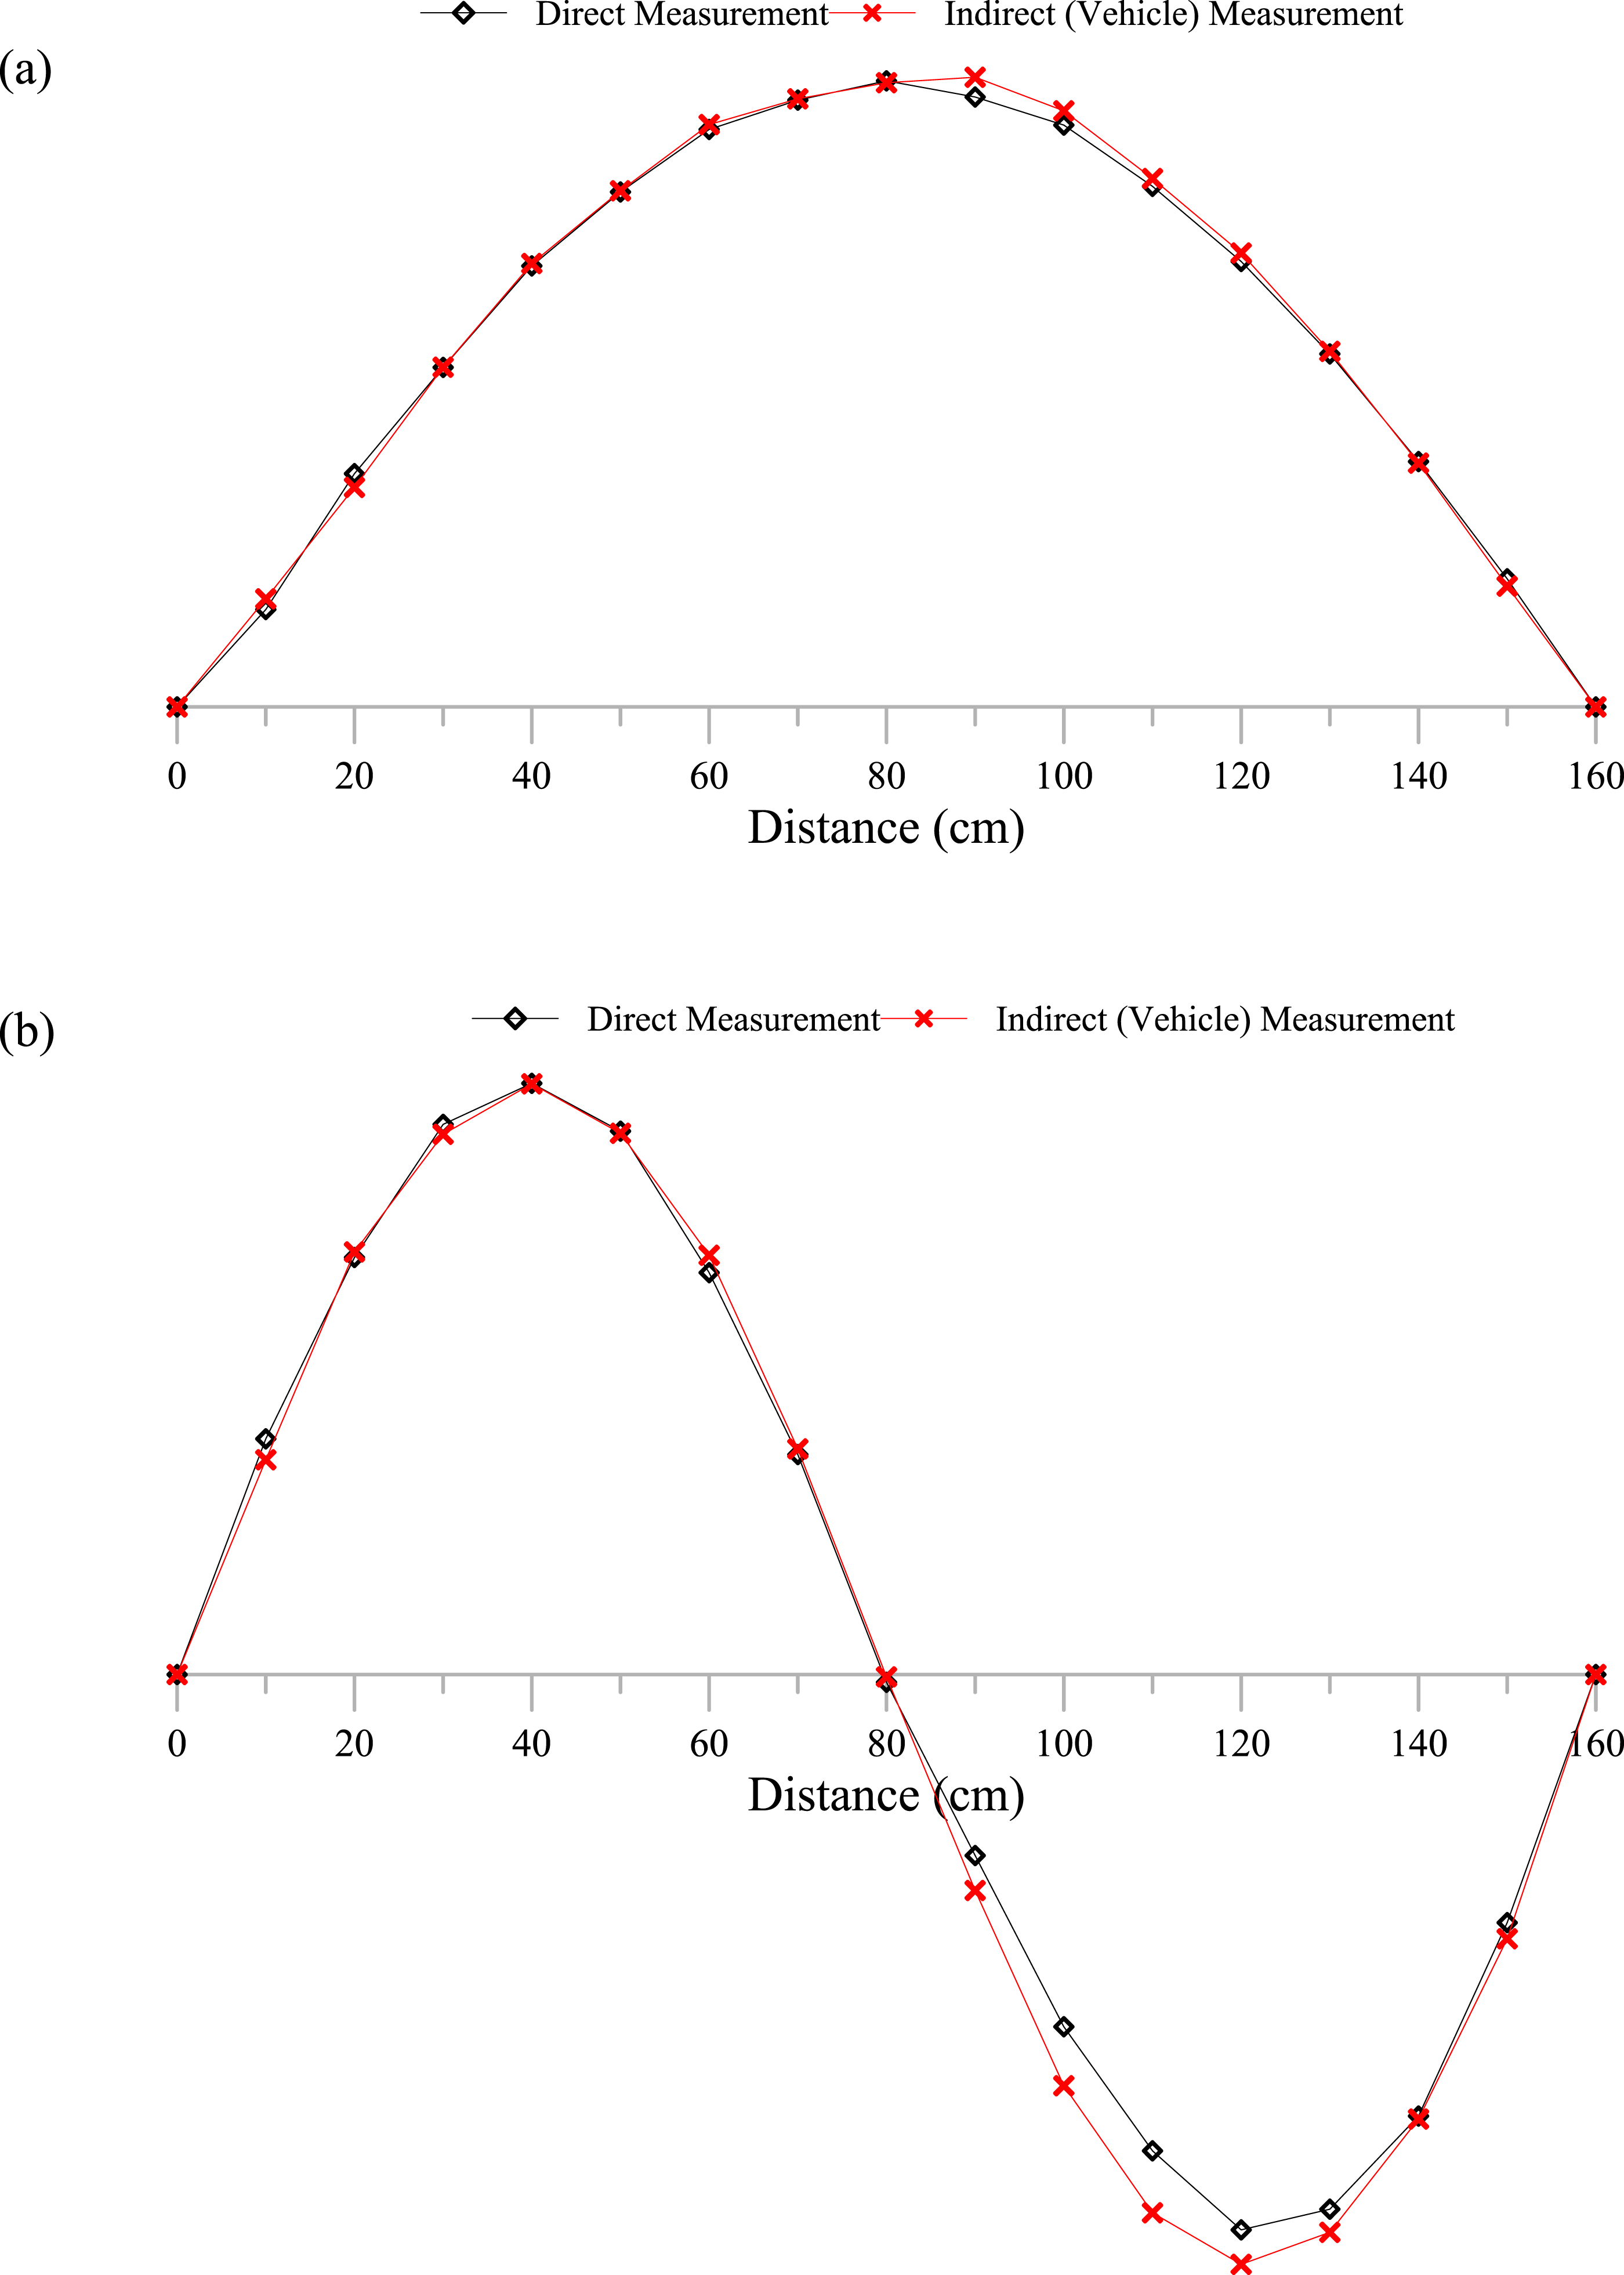
Conclusions
This paper comprises two parts. The first part developed simplified equations to calculate the CPR of a damped model for the scanning vehicle. The developed equations are used to calculate the CPR of a stationary vehicle while damping is considered. Various vehicle frequencies were considered, such as 1.6 Hz, 3.2 Hz, 10 Hz, and 18.8 Hz. The damping ratio of the vehicle is 0.25. The CPR shows good agreement with the reference response of the bridge at the same location of the stationary vehicle. Moreover, in the first part, the CPR obtained by the developed equations in this paper are compared with those developed by Yang et al. 8 For low vehicle frequencies such as 1.6 Hz and 3.2 Hz, the developed equation for CPR in study show good agreement with the reference response, unlike the results obtained by the CPR by Yang et al. For the vehicle with a frequency of 10 Hz, the Yang et al. equations provided good agreement with the bridge response 1st mode only. However, the proposed equations in this study, provided better transmissibility for modes up to 3rd mode. For the vehicle of 18.8 Hz, the equations proposed in this study and Yang equations both provided good agreement in the frequency-domain response with the bridge response up to the 2nd mode. For the 3rd mode, none of the CPR was in good agreement with that of the bridge. This happens because vehicle’s frequency of 18.8 Hz is close to that of the 3rd bridge frequency of 18.6 Hz. This leads to resonance in the response of the vehicle at the 3rd mode. In the investigation, it is shown that vehicles with higher frequencies show good agreement with the bridge response, without the need to compute the CPR. This conclusion leads to the next part of the paper, which is to develop a vehicle with higher frequency and damping.
In this paper, the goal of the laboratory experiment is to design a frequency-free vehicle. This means that the frequency of the vehicle is so high that it is not visible in the frequency-domain response of the vehicle when it is parked on a bridge. To design such a vehicle, the wheels of the vehicle were chosen to be made from PU materials. Such wheels have been examined to be able to transmit the vibration of the bridge without the interference of the vehicle’s response. The vehicle was designed as a single degree of freedom system. Such system is used to avoid the pitching effects of two axles vehicle. The transmissibility of the designed vehicle is assessed by investigating the time-domain and frequency-domain responses taken from the vehicle and direct measurements. The measurements were conducted by mounting an accelerometer on the vehicle and another accelerometer mounted on the beam at the same location of the vehicle. The acceleration and FFT responses shown good agreement between the vehicle and direct measurement. For the first case, 1st and 2nd modes of vibration were visible in both the vehicle and direct measurement responses. The first frequency mode was identified as 5 Hz and the second as 21 Hz. Also, the second mode was more visible than the first mode.
Moreover, modal properties such as damping ratios and mode shapes were calculated from the data obtained by the vehicle and direct measurements. Damping ratios of the 1st and 2nd modes were in good agreement from the vehicle and direct measurements. Additionally, mode shape of the 1st and 2nd modes of vibration were in good agreement as well.
While this study presents promising results regarding the transmissibility of bridge vibrations using a frequency-free stationary vehicle, the findings are currently based on a laboratory-scale model. Nevertheless, the fundamental concepts – such as the benefit of using PU wheels to suppress vehicle frequencies – are expected to be applicable to full-scale bridge monitoring. To enhance generalizability, future work should explore the performance of the proposed methodology under varying bridge types (e.g. truss, arch, or cable-stayed bridges), different road conditions, and multiple vehicle configurations. Field validation is also necessary to confirm the robustness of the approach in real-world monitoring scenarios with environmental and operational variability.
Looking ahead, the next phase of this research will focus on validating the proposed frequency-free stationary vehicle concept through field-scale experiments. While previous laboratory tests employed a scaled-down vehicle model, the upcoming work should utilize a larger vehicle designed to represent the scale and dynamic characteristics appropriate for an actual bridge. Moreover, the CPR should be evaluated under real bridge conditions to assess its reliability.
Footnotes
Author contributions
Ibrahim Hashlamon, conception; Ehsan Nikbakht and Belal Almassri interpretation of data; Ibrahim Hashlamon writing the article.
Funding
The authors received no financial support for the research, authorship, and/or publication of this article.
Declaration of conflicting interests
The authors declared no potential conflicts of interest with respect to the research, authorship, and/or publication of this article.