






Abstract
Background
Depression is a widespread mental health disorder that disproportionately affects women of reproductive age due to a combination of biological, social, and environmental factors. It significantly impacts productivity, increases morbidity and disability, and poses challenges to the global economy. In Bangladesh, there have been few studies addressing this issue using modern analytical methods, despite its importance for public health.
Objectives
The study aims to develop the best predictive model for depression risk factor analysis and to assess the PHQ-9 scale.
Design
This study extracted data from the cross-sectional survey.
Methods
We utilized data from the BDHS 2022, which gathered information on depression using the Patient Health Questionnaire (PHQ-9). The study included 13,113 ever-married women aged 15-49 years. To develop the predictive model, several machine learning algorithms were used. The performance of each model was assessed using metrics such as accuracy, precision, recall, and specificity. SHapley Additive exPlanations (SHAP) analysis was conducted to interpret and rank each feature’s contribution to the model’s output.
Results
Approximately 4.54% of women experienced moderate to severe depression. The Boruta algorithm identified 21 significant risk factors from a total of 25 variables, spanning demographic, socioeconomic, household, and reproductive domains, for predicting depressive symptoms. The Random Forest (RF) and Decision Tree models showed good performance across different performance metrics, achieving sensitivity of (0.068, 95% CI:0.064-0.072) and (0.409, 95% CI:0.395-0.423), specificity of (0.946, 95% CI:0.945-0.948) and (0.640, 95% CI: 0.629-0.651), and accuracy of (0.906, 95% CI:0.905-0.907), and (0.630, 95% CI:0.620-0.641). Whereas, boosting models also showed comparable performance. SHAP analysis revealed that household size, number of children under 5 in the household, and number of women in the household were the most influential predictors.
Conclusion
The study demonstrated the effectiveness of the RF and decision tree model in detecting depression among Bangladeshi women, proving to be a valuable tool for identifying and predicting risk factors related to women’s mental health. The findings indicate that combining machine learning with the PHQ-9 would help screen for depressive symptoms in large-scale public health settings while accounting for different covariate effects.
Introduction
Depression is a serious mental disorder marked by persistent sadness, loss of interest, and symptoms that disrupt daily life. 1 It is widely acknowledged as a major contributor to disability worldwide and plays a significant role in the overall global burden of disease. 2 Depression arises from a complex interaction between genetic predispositions and environmental influences, which accumulate and exert their effects over an individual’s lifetime. 3 Depression is usually grouped into mild, moderate, or severe types, depending on how strong the symptoms are and how much they affect a person’s daily life. 4 Currently, an estimated 280 million people worldwide are affected by depression, with the condition being approximately 50% more prevalent in women than in men. 5 Among them, women of reproductive age are a particularly important demographic, as they are key contributors to both population growth and the future workforce. 6 According to the data of the Bangladesh Demographic and Health Survey 2022, 7 5% of women in Bangladesh between the ages of 15 and 49 face moderate to severe symptoms of depression. By the year 2050, depression is projected to become one of the top seven causes of health-related challenges worldwide. 8 In Bangladesh, women of reproductive age encounter numerous obstacles that affect their overall health and well-being. 9 Many studies indicate that women worldwide frequently experience depressive symptoms due to factors like marital dissatisfaction, hormonal changes, financial stress, social stigma, limited mental health resources, family dynamics, the number of children, and challenging life experiences such as conception difficulties, pregnancy loss, violence, or isolation.10,11 Scaling up mental health services for depression is essential for achieving Sustainable Development Goal (SDG) 3 by 2030, which aims to reduce premature mortality from non-communicable diseases and promote mental health. 12
As a developing country, Bangladesh has limited research focusing on depression among ever-married women of reproductive age, despite their vulnerability to this condition. Recently, there have been efforts to investigate their mental health, primarily using logistic regression models for analysis. 13 In Bangladesh, mental health services, screening facilities and specialized professionals remain limited, making early identification of vulnerable women challenging. In such resource constrained settings accurate and interpretable prediction models may support targeted screening, early intervention, and efficient allocation of mental health resources. Recent studies have shown machine learning (ML) approaches can improve depression prediction by identifying complex non-linear relationships and interactions among demographic, socio-economic, and health-related factors.14,15 Therefore, this study evaluates and compares several ML models, to predict depression among Bangladeshi women of reproductive age and identify important associated factors. In addition, SHAP analysis was used to improve the interpretability of the performing model by identifying the variables that contributed most strongly to prediction. 16 . The potential of machine learning in healthcare is significant, with many ML tools achieving diagnostic and prognostic capabilities comparable to, or even exceeding, human performance. Furthermore, SHAP enhances our understanding of ML models, fostering trust and transparency in medical decision-making. This research is motivated by the need to better understand and predict depression among Bangladeshi women through the utilization of modern, data-driven methodologies. By applying machine learning and SHAP analysis, we seek to identify key risk factors and improve the accuracy and interpretability of mental health interventions. We hope that our findings will open a new dimension in improving mental health in Bangladesh. This research creates a baseline opportunity develop tools, such as software in the future, that can assist the government in detecting depressive symptoms and taking necessary actions for ever-married women of reproductive age.
Methods and materials
Nature of the study
This study used the data from the BDHS 2022 survey, which was conducted across Bangladesh in 2022. However, our study is based on a cross-sectional secondary data analysis.
Data source and study design
This study utilized the data from the Bangladesh Demographic and Health Survey 2022 (BDHS 2022), a nationally representative survey conducted between August and December 2022. 17 The BDHS is part of the global Demographic and Health Survey (DHS) Program, managed by the United States Agency for International Development (USAID) in collaboration with the National Institute of Population Research and Training (NIPORT) and ICF. The publicly accessible secondary data from the 2022 Bangladesh Demographic and Health Survey (BDHS), obtained with official authorization from the DHS program, served as the foundation for this analysis. The Bangladesh Medical Research Council and the Institutional Review Board (IRB) of ICF International, USA, examined and approved the initial survey protocols. The study’s dataset was completely anonymised and devoid of any personally identifiable information, protecting respondents’ privacy and confidentiality. Respondents who refused to consent were not included in the survey. The DHS authority does not provide any specific approval number for secondary data users. DHS only provides data to secondary users upon request of users. This cross-sectional study corresponds to the STROBE guideline. 18 The relevant checklist is attached as supplemental material 2.
Sample size determination
The BDHS offers high-quality population and health data across over 90 countries with lower and middle incomes, adhering to strict methodological standards. Bangladesh is divided into eight administrative divisions, further subdivided into zilas and upazilas. For the BDHS 2022, a two-stage, stratified cluster sampling method was employed to ensure representativeness at national, urban-rural, and divisional levels. In the first stage, 675 enumeration areas (EAs) comprising 237 urban and 438 rural areas were selected from the 2011 Population and Housing Census sampling framework using probability proportional to size (PPS) sampling. In the second stage, a systematic sample of 45 households per EA was selected, yielding a total of 30,330 households. Out of these households, 30,149 were occupied, and interviews were successfully conducted in 30,018 of them. From these households, 30,358 ever-married women aged 15–49 were identified as eligible respondents. A total of 30,078 women were successfully surveyed, leading to an individual response rate of 99.1%. This through-sampling technique reduced selection bias and improved the generalizability of the findings. To reduce the burden on respondents while still obtaining comprehensive data, only a random subset of households in each cluster (30 out of 45) was selected to complete the extended individual questionnaire, which included the mental health module. As a result, 19,987 ever-married women completed the mental health section. For this analysis, we excluded 10,091 women who did not participate in the mental health module, followed by the exclusion of an additional 6,918 women due to missing data on key covariates. The final sample consisted of 13,113 (weighted) women aged 15–49 (see Figure S1 in Supplementary Material A). This large sample size, which came from a nationwide survey, offered enough statistical power for developing complex machine learning models, securing the reliability of the study’s findings.
Outcome variable
The primary outcome measured in the study was the depression status of women. Depression symptoms were evaluated using the Patient Health Questionnaire (PHQ-9), which is a self-reported instrument consisting of 9 items that assess symptoms of depression experienced over the past two weeks. 19 Women responded using a 4-point Likert scale, yielding total scores ranging from 0 to 27. These scores categorize depression severity as follows: no depression (scores 0–4), mild depression (scores 5–9), moderate depression (scores 10–14), moderately severe depression (scores 15–19), and severe depression (scores 20–27). A score of 10 or higher indicates moderate to severe depression, while scores below 10 are classified as no or mild depression.7,19 Previous studies conducted in Bangladesh have also utilized the same cutoff score of 10 on the PHQ-9 to determine the presence of depressive symptoms.7,13,20
Covariates
This study examined a variety of demographic, socioeconomic, household composition, reproductive, and family dynamics factors to identify predictors of depression among ever-married women in Bangladesh. The independent variables were selected based on previous research into the predictors of pregnancy loss in Bangladesh.13,20 The respondents’ ages were categorized into the following groups: 15-19, 20-24, 25-29, 30-34, 35-39, 40-44, and 45-49 years. The residence was classified as either rural or urban, and the geographic area was divided into eight administrative regions: Barishal, Chattogram, Dhaka, Khulna, Mymensingh, Rajshahi, Rangpur, and Sylhet. Religious affiliation was categorized into two groups: Islam and others, which include Hinduism, Buddhism, and Christianity. Socioeconomic status was assessed using the Demographic and Health Surveys (DHS) wealth index, which is divided into five quintiles: Poorest, Poorer, Middle, Richer, and Richest. Educational attainment was categorized into four levels for both the respondents and their husbands: no education, primary education, secondary education, and higher education. The respondent’s occupation was classified into five groups: agricultural, non-agricultural, officer/business, housewife, and others/retired. Similarly, the husbands’ occupations were classified as agricultural, non-agricultural, officer/business, unemployed/student, and others/retired. Technology-related variables included smartphone ownership and internet use, both coded as binary (Yes/No). Media exposure was coded as “Yes” if the respondent accessed any form of media (radio, TV, or newspapers) at least once a week; “No” otherwise. The household structure included the number of household members (1–4 or more than 4), the number of children under five (none, 1–2, or more than 2), the number of eligible women in the household (one or two, or more), and the sex of the household head (male/female). Variables related to reproductive health and family dynamics included the total number of pregnancy losses (none, 1–2, or 3 or more), the total number of children ever born (none, 1–2, or 3 or more), and the number of living children (none, 1–2, 3–4, or 5 or more). Additional considerations included whether any child had died, current pregnancy status, co-residence with a husband, recent sexual activity, fertility preferences (wants more, wants no more/sterilized, infertile, undecided), and any pressure from the husband or family to become pregnant.
Data pre-processing
The BDHS 2022 data were utilized for this study. Inconsistent values were corrected or standardized, and missing values and outliers were removed from the dataset to ensure high data quality. Before data analysis and machine learning implementation, we coded every category of variables into numbers from 0 to 7 as needed. The target variable was set into two categories as no depression (coded as 0) and moderate to severe depression as depression (coded as 1). The full list of variables, along with their codes, is given in Supplemental Material 1.
Imbalanced data handling using SMOTE
Chawla et al. created the SMOTE technique to address the issues with imbalanced data.
21
SMOTE generates synthetic data that equalizes the distribution of minor and major classes. The artificial data is generated using the
Statistical analyses
Feature selection using boruta algorithm
The Boruta algorithm was employed to identify relevant risk factors associated with mild to severe depression among ever-married Bangladeshi women. This algorithm builds on the Random Forest method for feature selection, aiming to capture pertinent details about the outcome variable during data collection.
24
The importance of each attribute is assessed by the loss in classification accuracy resulting from randomly permuting attribute values across objects in the dataset. The algorithm iteratively eliminates features that are statistically less relevant than random probes. This procedure includes generating “shadow features” by duplicating and reshuffling the values within each column. A classifier assesses feature importance using metrics such as Mean Decrease Accuracy. A feature is deemed significant if its
Model selection
We used six supervised classification models for predicting depression. Most studies related to the BDHS survey used tree-based models such as Random Forest and Decision Tree, and Logistic Regression as a linear classifier based on a threshold. However, incorporating this message, we added three boosting models to compare the performance of two different types of models. Boosting models are complex in nature and useful for finding non-linear relationships among variables.
Classification models
Decision tree (DT)
A Decision Tree is a straightforward yet powerful machine learning technique that operates on the divide-and-conquer principle. It has a hierarchical, flowchart-like structure in which internal nodes represent decision rules or tests based on features, while leaf nodes correspond to predicted class labels. 25 By learning decision rules from the data, the Decision Tree effectively builds a model that predicts the target variable. Key hyperparameters of a Decision Tree include the criterion for measuring the quality of a split, such as Gini impurity or entropy; maximum depth, which limits the tree’s depth to manage complexity; and maximum features, which specifies the number of features considered at each split. 26
Random forest (RF)
Random Forest (RF) is an ensemble classification technique that creates multiple decision trees using various subsets of data to improve prediction accuracy and reduce overfitting. 27 It utilizes bootstrap sampling and random feature selection to reduce correlation among the trees. The final prediction is determined by the majority vote across all trees, enhancing the model’s robustness. This method is particularly effective for managing complex datasets with high dimensionality and non-linear relationships. 28
Logistic regression (LR)
Logistic Regression (LR) is a widely used probabilistic model designed for binary classification tasks, modeling the likelihood of an event based on independent predictor variables. It estimates parameters through maximum likelihood and assumes a logit link between predictors and the outcome. 29 LR is grounded in strong statistical assumptions that must be satisfied for valid inference. 30 Its simplicity, interpretability, and lack of need for hyperparameter tuning make it suitable for various applied research settings.
Extreme Gradient Boosting (XGBoost)
Extreme Gradient Boosting (XGBoost) is a highly scalable ensemble technique known for its effectiveness and reliability in tackling machine learning problems. 31 It supports various objective functions, including regression, classification, and ranking, via a robust gradient-boosting framework. 32 XGBoost is widely preferred due to its ability to reduce overfitting using multiple regularization strategies, which ultimately enhances overall model performance. Its computational efficiency and ability to handle missing values make it suitable for large-scale, real-world applications.
Light Gradient Boosting Machine (LightGBM)
Light Gradient Boosting Machine (LightGBM) is an efficient implementation of Gradient Boosting Decision Trees (GBDT) designed for handling high-dimensional and large-scale datasets. It utilizes two primary techniques, Gradient-based One-Side Sampling (GOSS) and Exclusive Feature Bundling (EFB). GOSS focuses on retaining instances with large gradients to better estimate information gain, while EFB combines mutually exclusive features to reduce the feature space while minimizing information loss. These techniques contribute to faster training times and strong performance, making LightGBM particularly suitable for complex classification tasks. 33
Categorical Boosting (CatBoost)
Categorical Boosting (CatBoost) is a gradient boosting algorithm that is specifically designed for datasets with categorical features. It incorporates innovative techniques to prevent target leakage and prediction shift. The algorithm uses ordered boosting and ordered target statistics to compute feature transformations and gradients from historical data via random permutations. This method ensures unbiased model training and helps maintain generalization performance. 34 CatBoost effectively handles categorical variables and offers an efficient training process, making it particularly suitable for structured datasets across various domains.
Confusion matrix performance parameters
A confusion matrix, also known as an error matrix, is a widely used tool for evaluating the performance of a classification algorithm. It compares the predicted outcomes with the actual classifications and summarizes them into four categories: true positives (TP), true negatives (TN), false positives (FP), and false negatives (FN). These components form the basis for calculating various performance metrics, such as accuracy, sensitivity (recall), specificity, precision, and F1-score, providing a comprehensive assessment of the model’s predictive capability.
35
The key performance parameters are:

Accuracy is defined as the number of data points that a classifier correctly classifies. Sensitivity and specificity measure how well a classification algorithm identifies data points in the positive class and negative class, respectively. Precision refers to the number of correctly classified data points from the positive class. 35
Feature importance using SHAP values
SHapley Additive exPlanations (SHAP) is a feature attribution method rooted in game theory, designed to provide consistent and locally accurate explanations for individual predictions in machine learning models, particularly tree ensembles like gradient boosting trees and random forests.
36
SHAP values assign a contribution score to each feature based on its impact on the model’s output, calculated by averaging the marginal contributions across all possible feature combinations using the formula
37
: Workflow of developing Interpretable of ML models.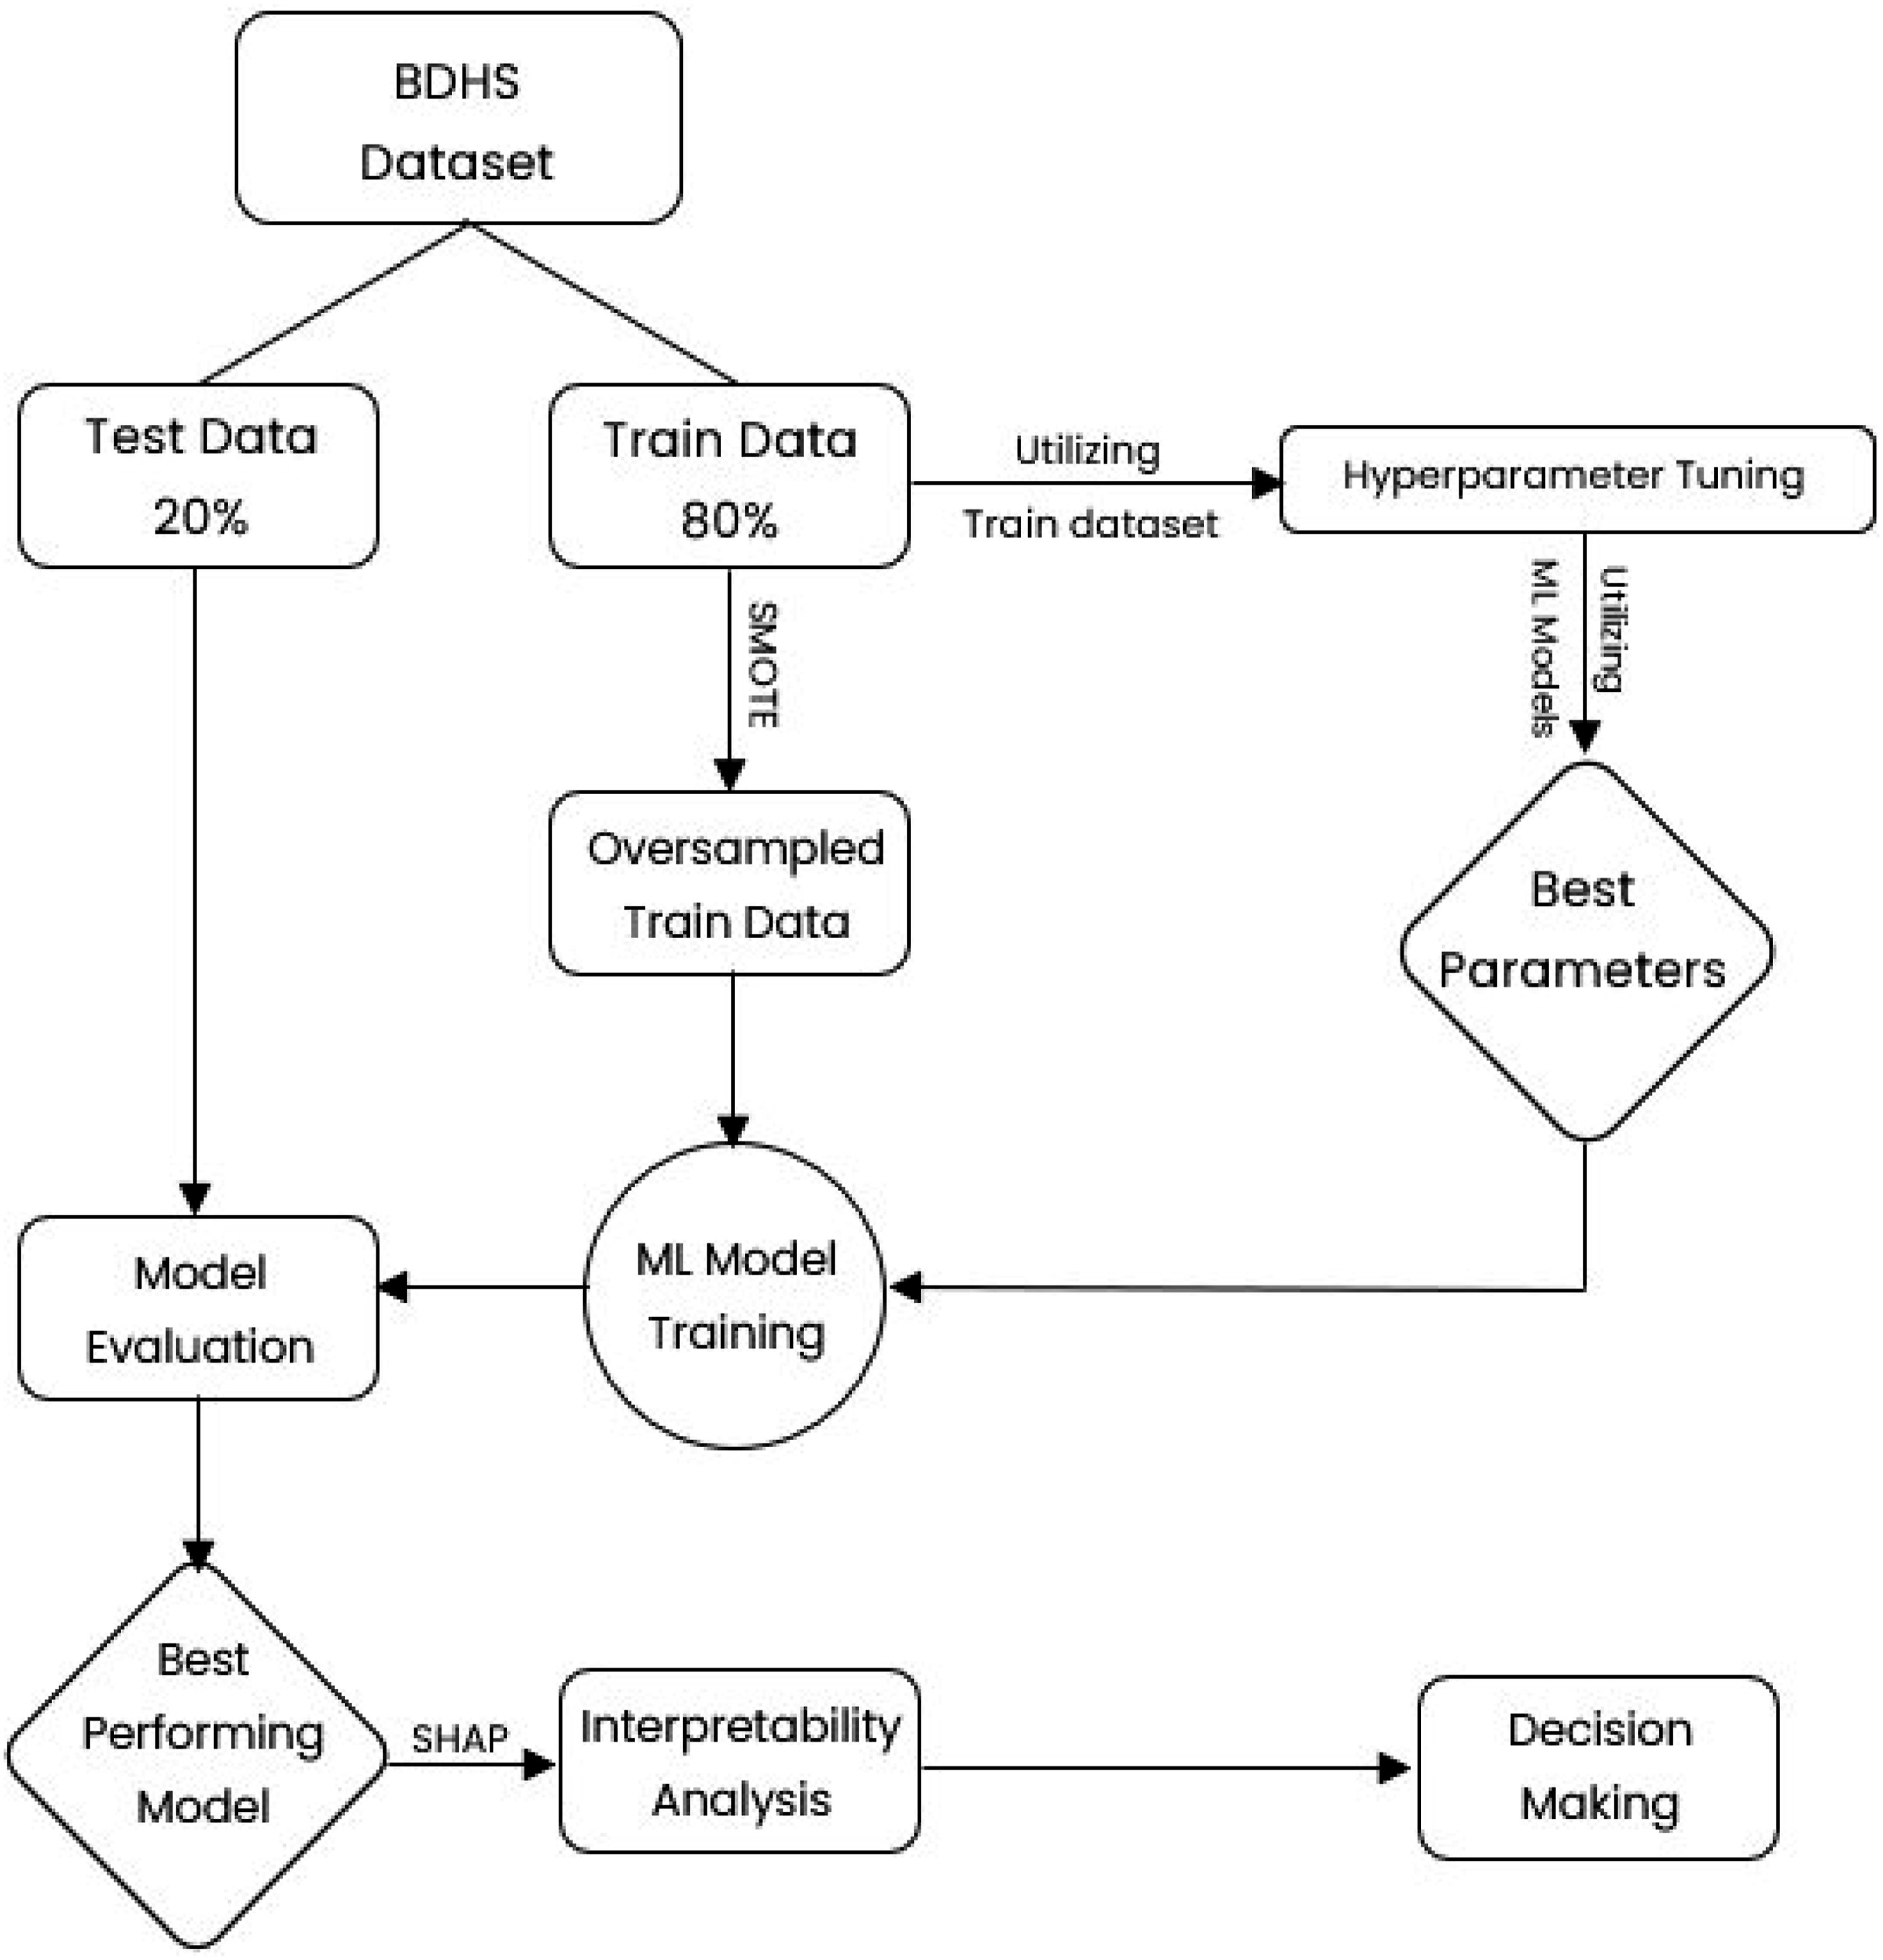

Results
Descriptive analysis of study variables and women’s depression.

Findings presented in Figure 2 illustrated that the distribution of our outcome variable is highly imbalanced. Percentage distribution of depression among women.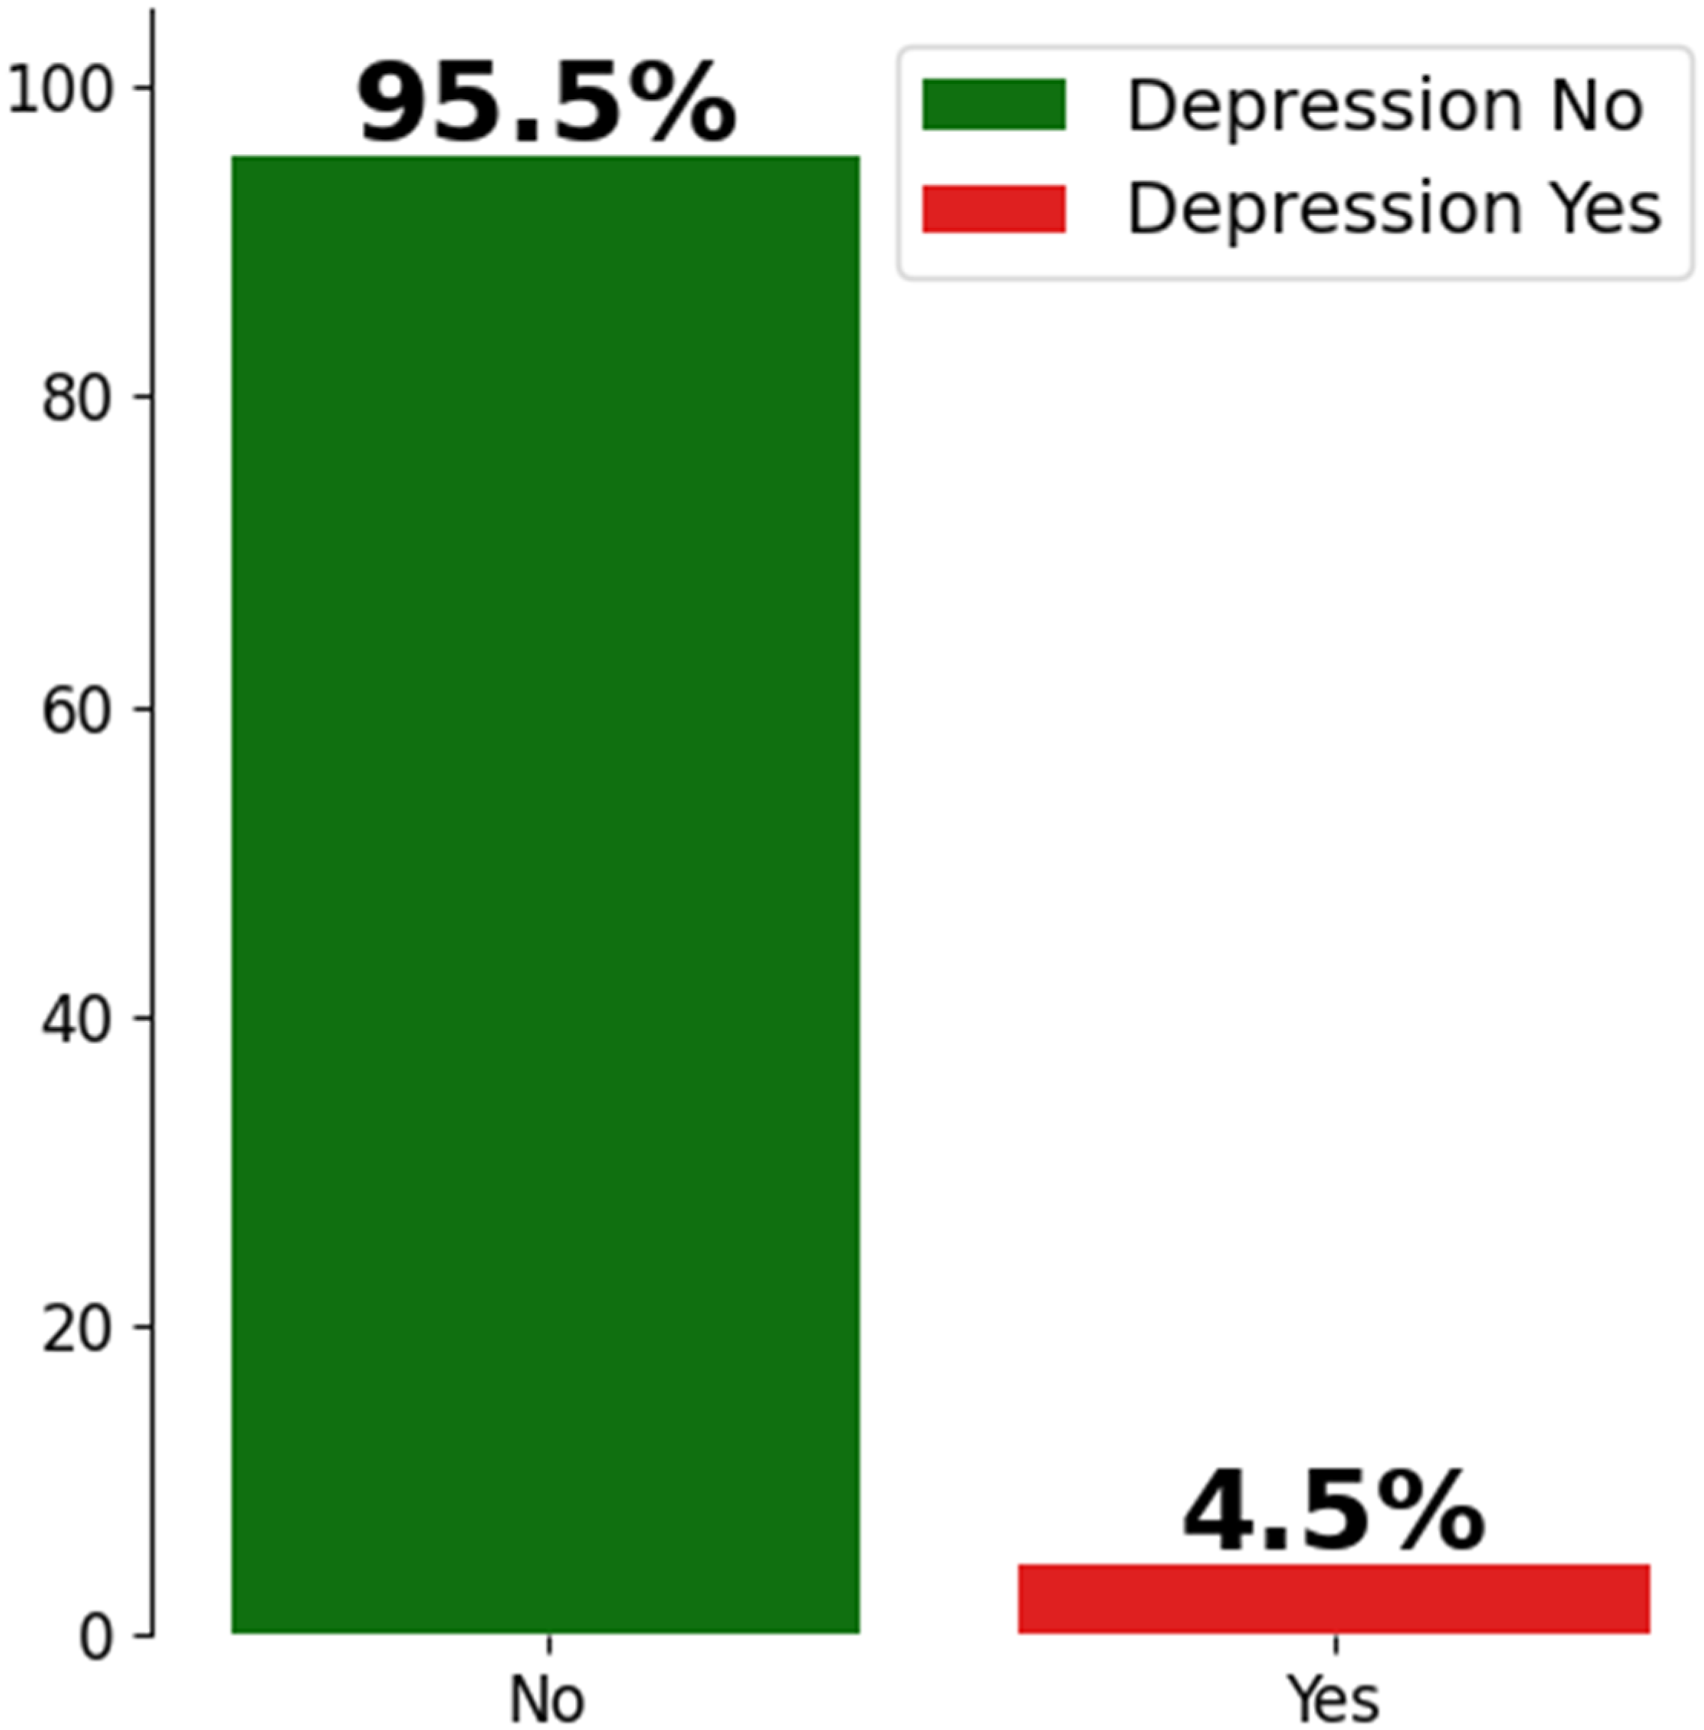
Selected features
By combining the Boruta algorithm with the chi-square test of independence, we selected 13 factors as risk factors for predicting depressive symptoms from 25 factors across demographic factors, Socio-economic factors, Household and family structure, and Reproductive and family dynamics segments. The Boruta algorithm selected 21 features from 25 factors. We got Women’s age, Women’s education, Household size, Number of children under5, Having own smartphone, Internet use, residence, household size, number of women in household, sex of household head, recent sexual acitivity, media exposure, number of living children, Desire for more children, Wealth index, Number of children everborn, Residing with husband Has any children ever died, , Pregnancy pressure from husband/family, Husband occupation and Husband education are the selected features for the appraisal of Machine learning models(Figure 3). Feature selection by the Boruta algorithm.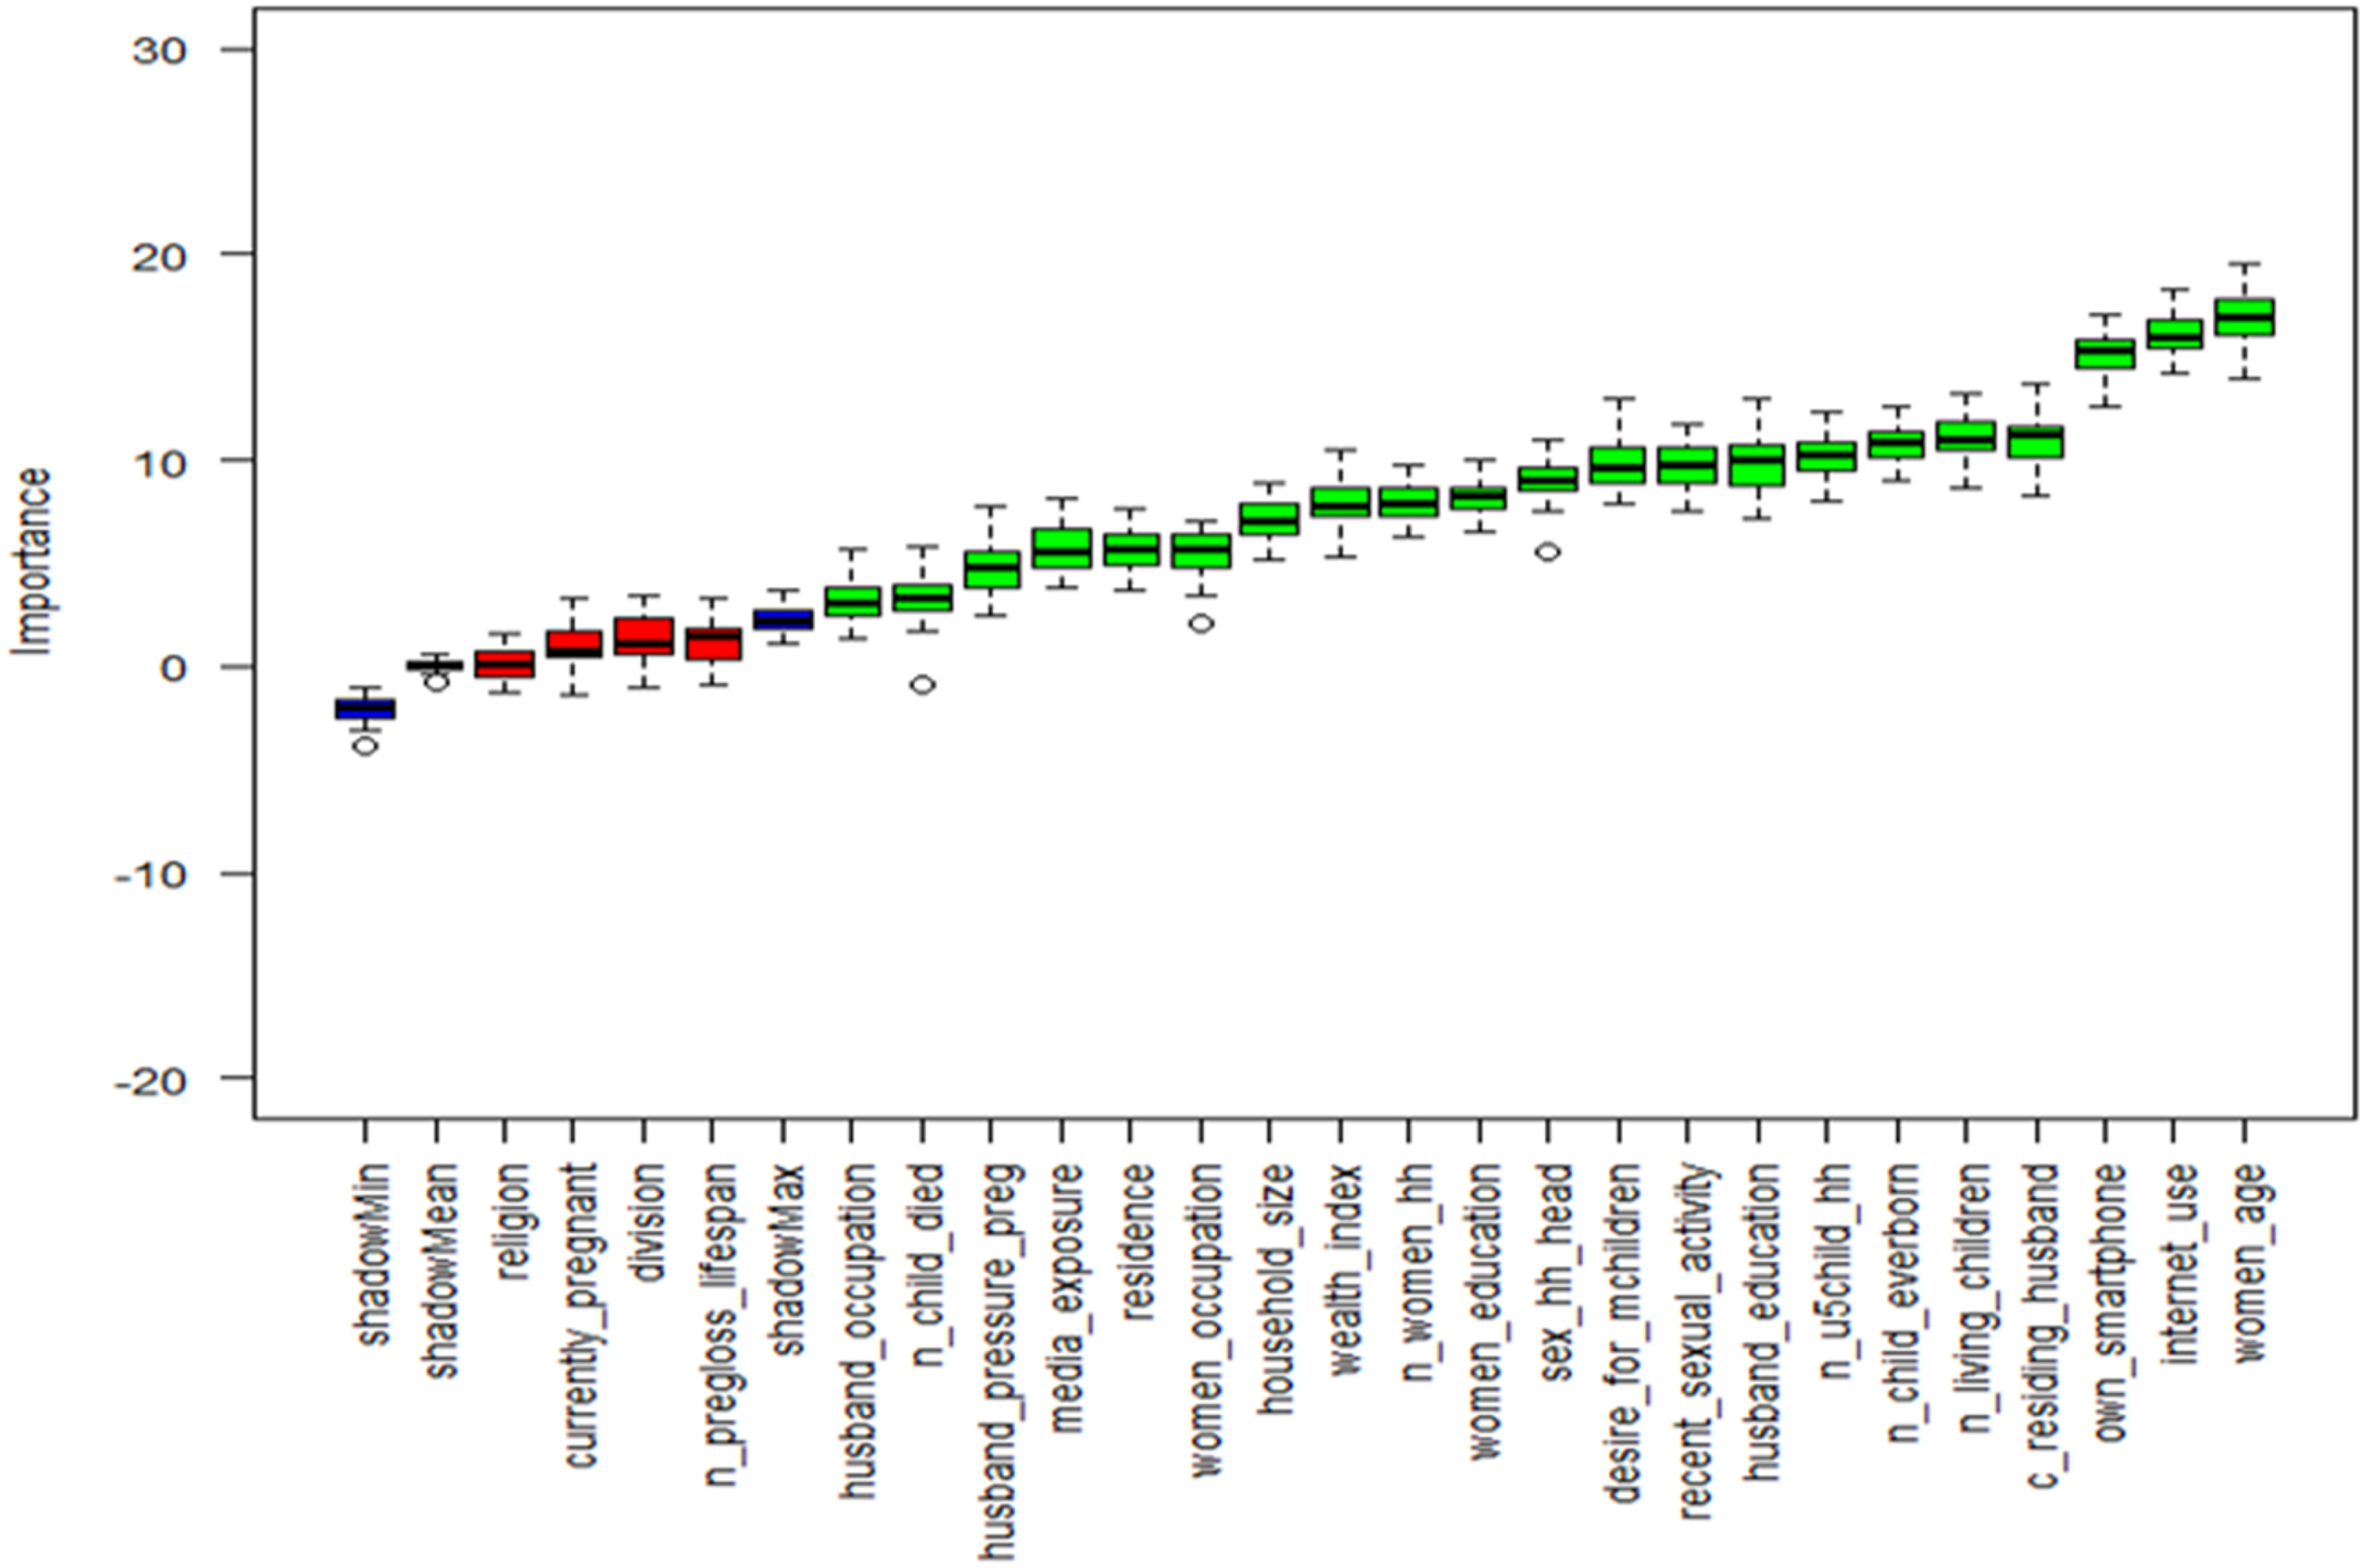
Machine learning models evaluation
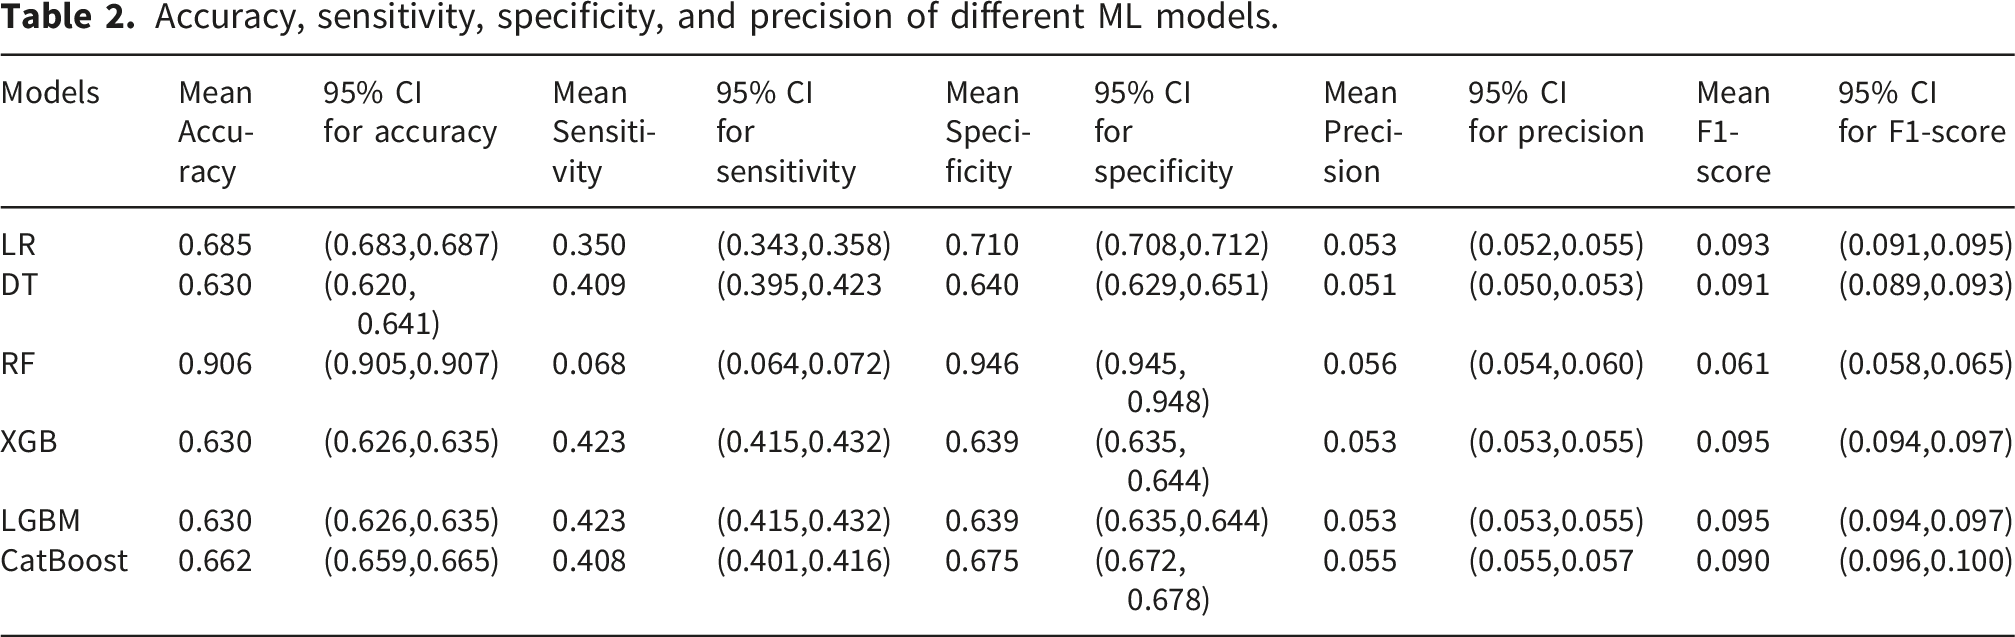
Using different performance metrics, including the confusion matrix, Accuracy, Sensitivity, Specificity, Precision, F1-score, the effectiveness of ML models, such as Decision Trees (DT), RF, Logistic Regression (LR), Extreme gradient boosting (XGBoost), Light gradient boosting machine (LightGBM), and Categorical boosting (CatBoost), was assessed.
Accuracy, sensitivity, specificity, and precision of different ML models.
The confusion matrix of Random Forest and Decision Tree using 2586 random seeds is presented in Figure 4. Confusion Matrix of the two best models.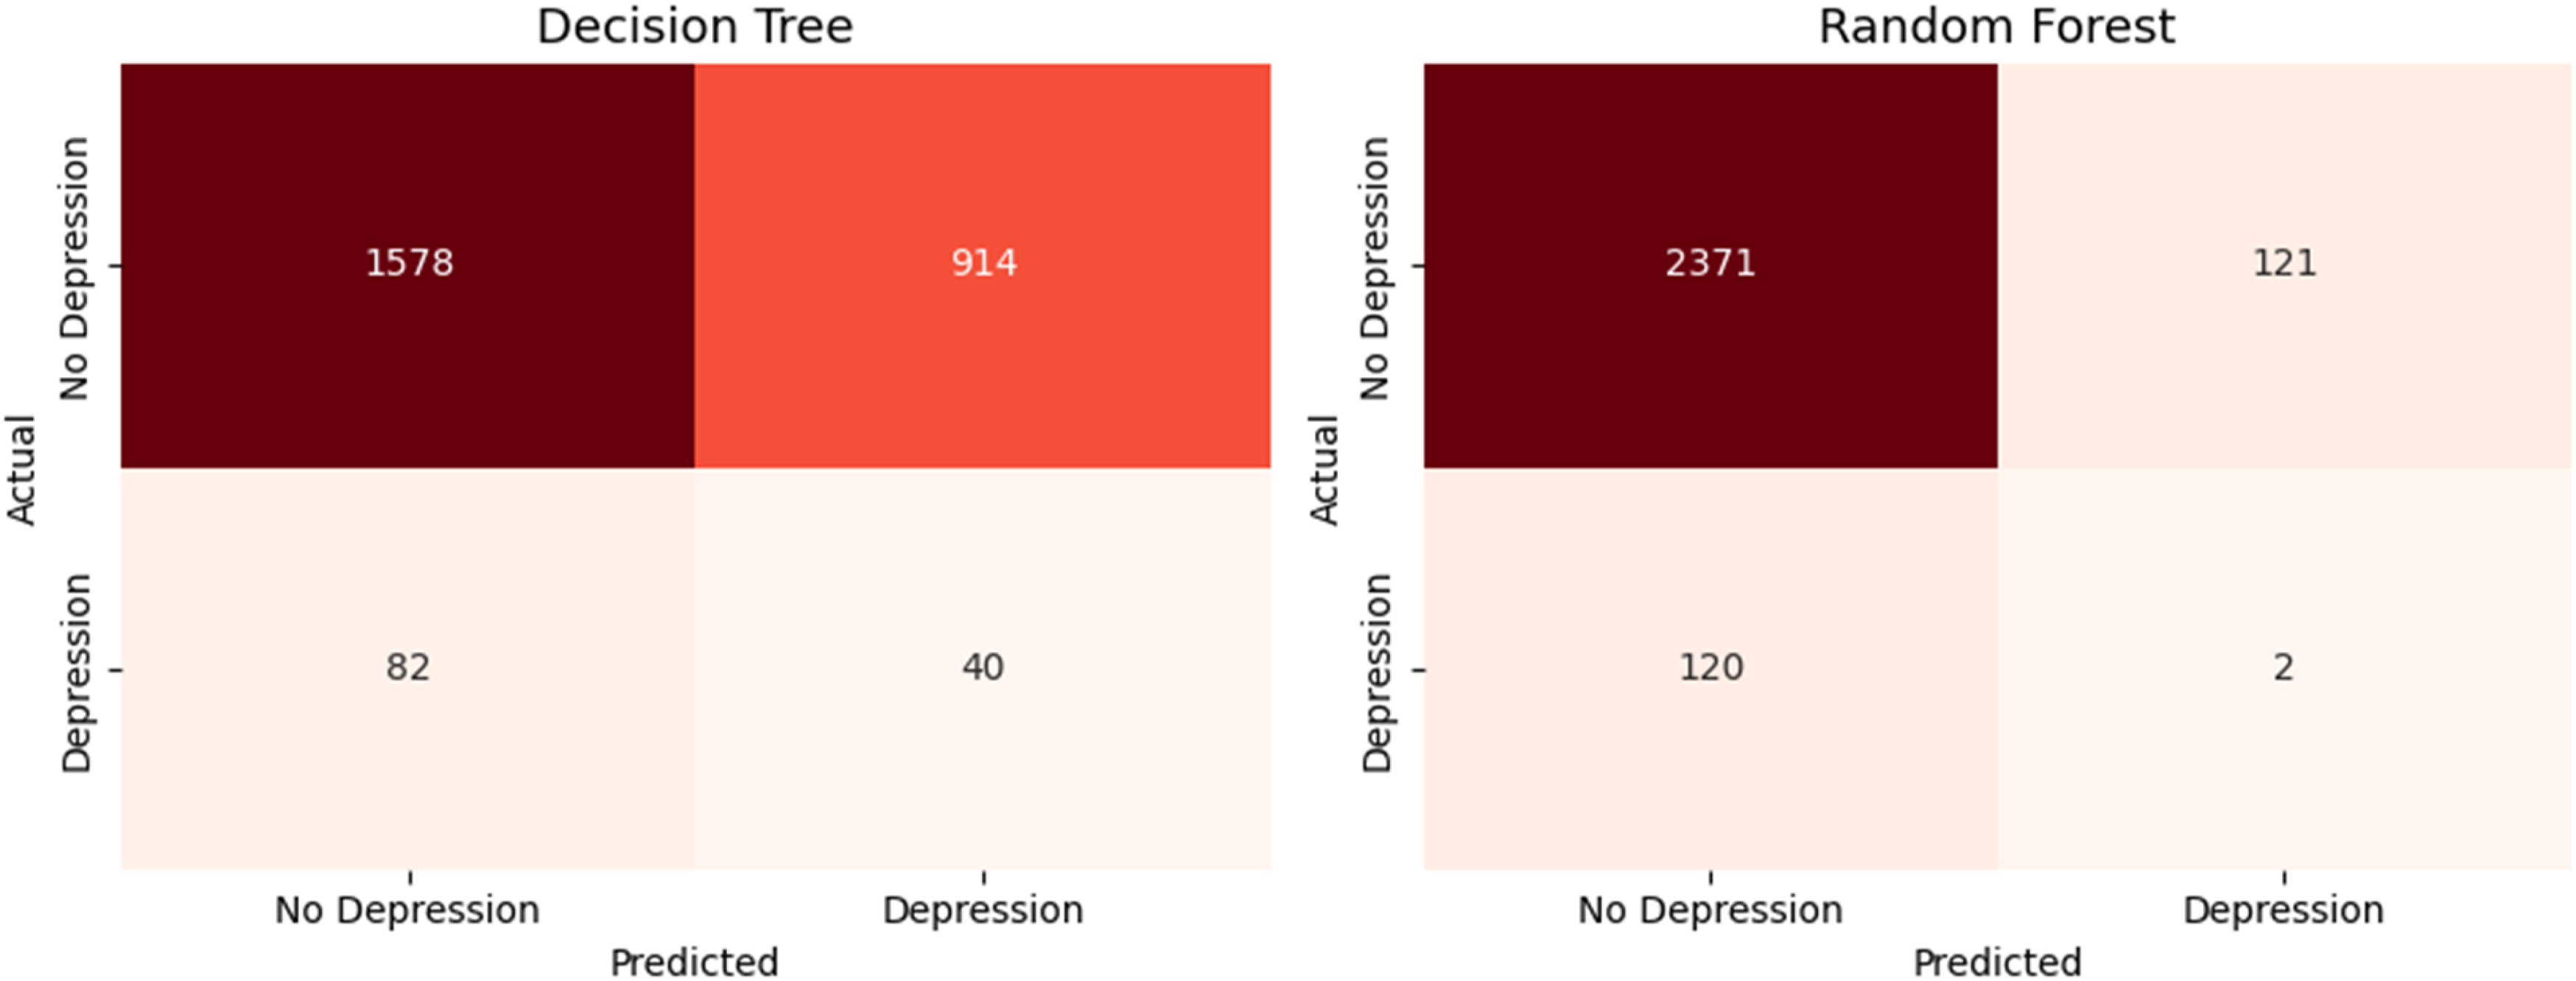
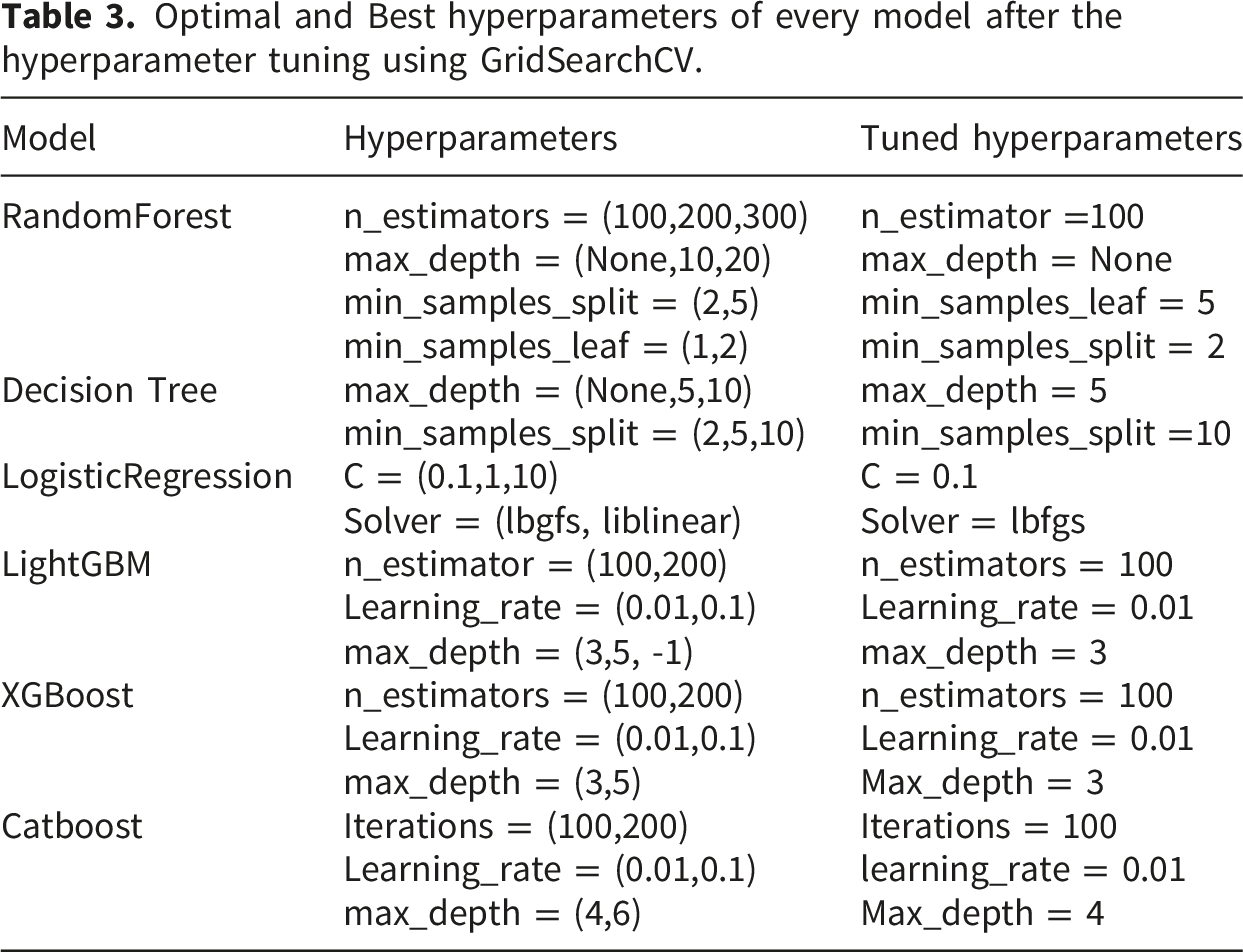
Optimal and Best hyperparameters of every model after the hyperparameter tuning using GridSearchCV.
Feature importance using SHAP
The most important features are arranged in descending order in a merged plot, which consists of global feature importance and a local explanation summary plot (Figure 1). The variables at the top have a greater impact on model output, as shown in the global feature importance plot, which shows the mean impact of each variable. Whereas the local explanation summary visualizes the model’s impact. A blue dot plot indicates that the variable has a low feature value, while a red/pink dot indicates a high feature value (Figure 5). (a): SHAP barplot and summary plot of the Random Forest Model. (b): SHAP barplot and summary plot of the Decision Tree Model. (c): SHAP barplot and summary plot of XGBoost Model.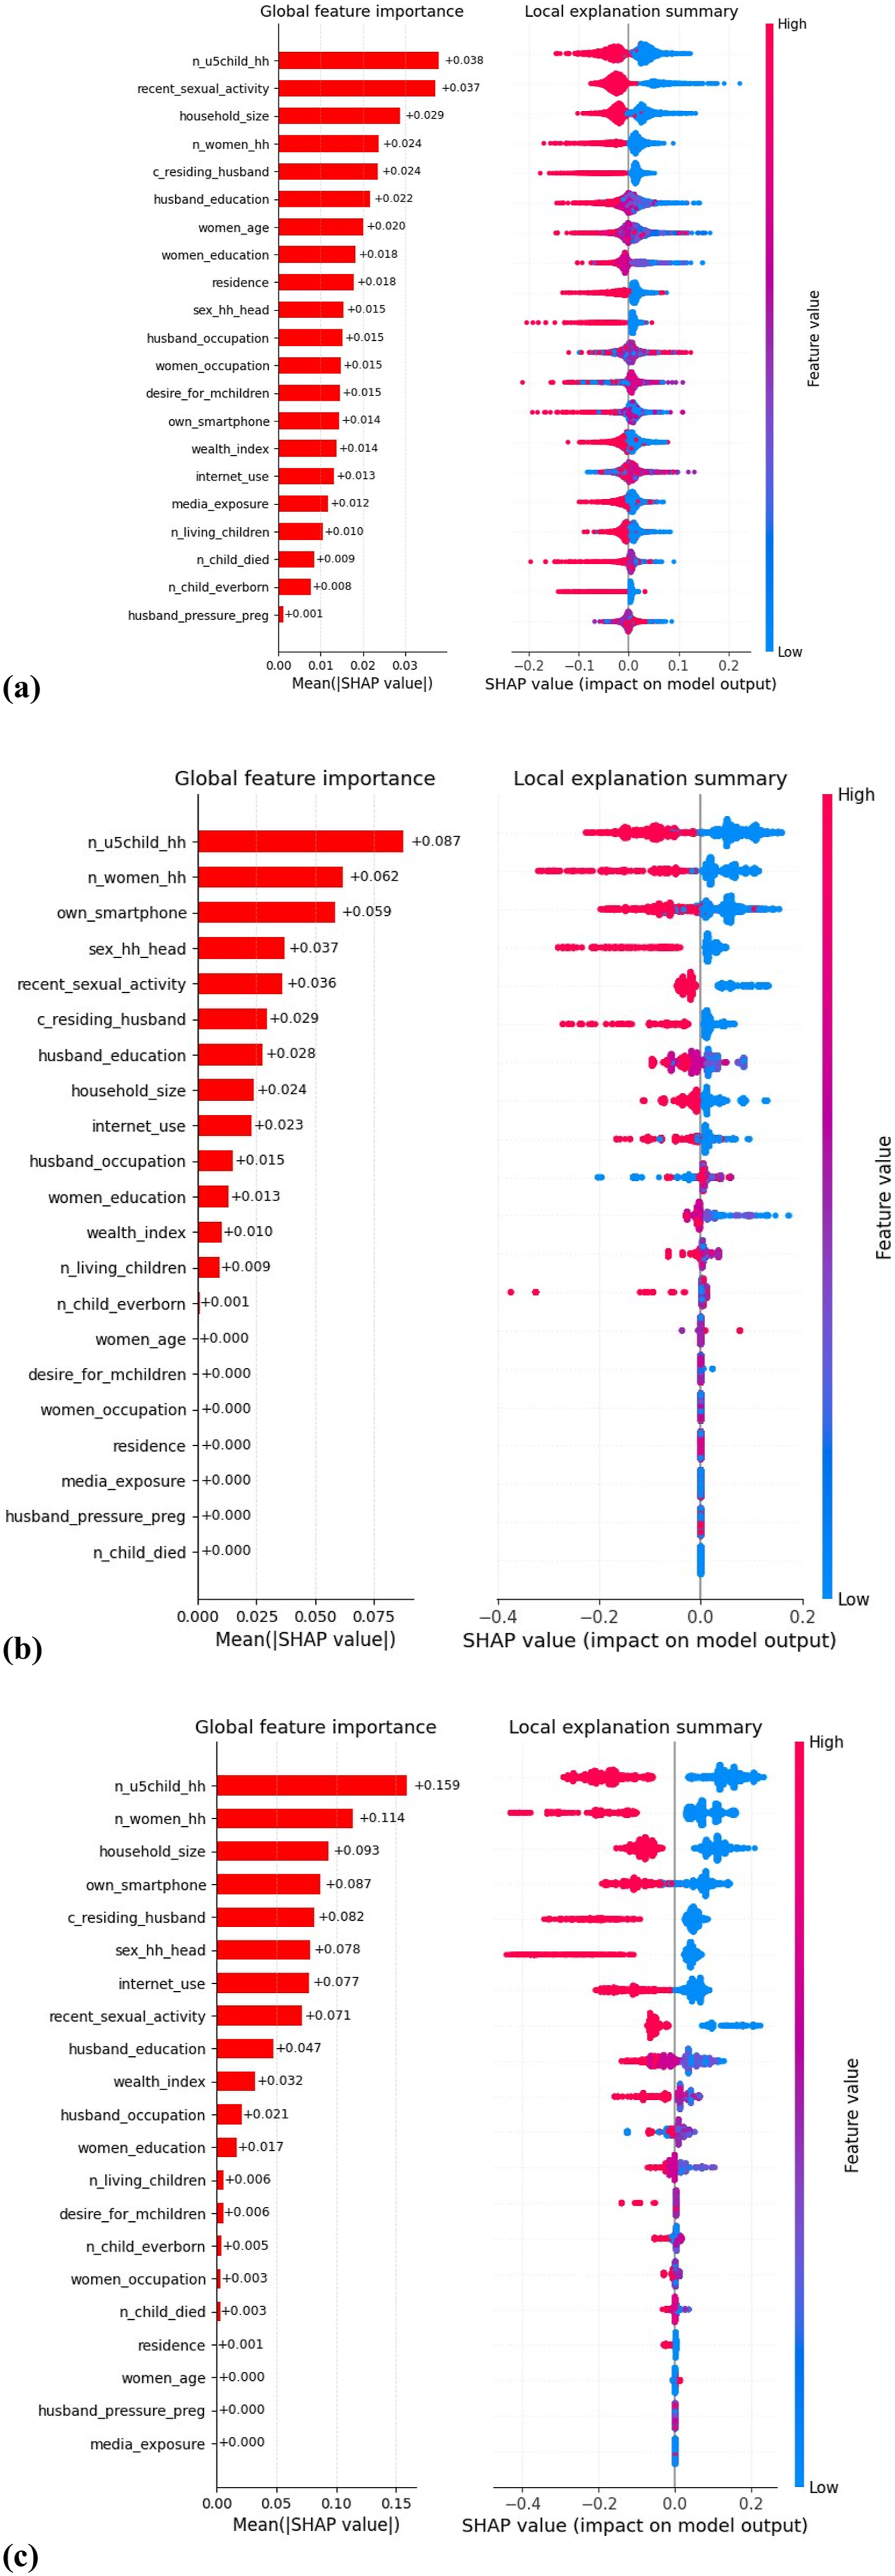
Discussion
According to existing literature, this is the earliest known nationwide study to apply several machine learning classifiers and interpretable AI (Shap) to predict and interpret the risk factors for depressive symptoms among women in the country, based on the BDHS 2022 survey.7,13,38–40 This study was conducted to predict and analyze risk factors for depression in Bangladesh, using several machine learning models informed by this prominent public health concern. We have found a total of 21 variables as selected covariates to assess the risk factor analysis of depression among women. The selected covariates and their associated categories significantly contributed to our target variable. Literature related to depression and depression regarding women also showed more or less these variables as significantly contributing to their target variables.13,41 Boruta has been an effective algorithm for selecting optimal features for predicting the target variable, with the most use cases in DHS survey-based machine learning studies. Important and non-important features in an information system can be objectively and consistently selected using Boruta, a revolutionary random-forest-based feature selection technique. This approach’s iterative design allows it to handle both the variability of a random forest significance measure and the interaction between attributes. 24 . 42
We assessed the performance of machine learning models, including Decision Trees (DT), Logistic Regression (LR), Random Forest (RF), LightGBM, CatBoost, and XGBoost, in predicting depression in women using four performance parameters, including the confusion matrix. The RF model yielded good results across all performance metrics, though it severely underperforms at finding true positives due to the highly imbalanced data. The RF model achieved less than 10% sensitivity, while boosting models performed better, achieving higher sensitivities of 0.423, 0.423, and 0.408 with XGBoost, LightGBM, and CatBoost, respectively. However, RF performs better in accuracy, specificity, and precision, with a mean accuracy of (0.906, 95% CI: 0.905-0.907), mean sensitivity of (0.068, 95% CI: 0.064-0.072), and mean precision of (0.056, 95% CI: 0.054-0.060). Results showed that RF is good at predicting negative cases and a very small number of positive cases, whereas another tree-based model, DT, showed high sensitivity, highlighting a contradiction between these two tree-based and ensemble-based models. Our results amplify prior work as literature based on depression, anxiety, and stress of women, men, and university students (i.e, university students also consist of women) showed the RF model as the better-performing model based on performance matrices, but contradicts the least performing model.43–45 The better performance of RF can be attributed to the nature of the data. Literature based on BDHS data showed that the RF model is the best-performing model.46–50. 39
From the Random Forest SHAP feature importance merged plot in Figure 2, we can see that several variables have a higher impact on the model output. Variables such as household size, the number of children under five in the household, recent sexual activity, the number of women in the household, residing with a husband, women’s education, husband’s education, and women’s age are the dominant predictors of depressive symptoms. Our findings revealed that household size and the number of children under five in the household have the largest average effects on the model output, with mean effects of 0.038 and 0.029, respectively. From the local explanation summary, the pink dots indicate that higher feature values tended to contribute negatively to the model’s output, increasing the likelihood of predicting 0 (no depression). One possible explanation for these findings may be attributed to the fact that the more family members and more children under five years old, may provide more space for women for emotional interaction and social support, which may be significantly associated with depressive symptoms of women. However, our findings align with the literature related to depression in women, which further proves that the presence of children and the increasing number of family members make a difference in the depressive symptoms rates. 51 Women’s education also exerts a moderate influence on the model’s output, with a mean SHAP value of 0.018. From the window of local summary, the higher feature values of women’s education make the difference in depression risk, which also aligns with a study showing that women’s education has a significant relationship with depression. 49 Husbands’ education also has a moderate to higher impact on the prediction, as studies related to women’s depression showed that husbands’ educational attainment was associated with anxiety and sadness in their spouses, indicating that education affects understanding and emotional support. 52
Age is also a contributing factor for detecting depressive symptoms, as Desai showed that depression is also influenced by age. 53 The wealth index has minimal effect on model output. A study showed that income inequality and poverty produce psychosocial stress, 54 which is consistent with our findings. SHAP global and local summaries based on the model DT showed similar features that impacted the model output, as did the SHAP of RF. Own smartphone and internet use have a positive impact on the prediction of depressive symptoms. As the use of smartphones together with the internet causes cloud interaction of women with others, they are more likely to face emotional distress and anxiety. As studies say, the use of social media increases the depression of women. 55 Boosting models are complex and good at finding complex patterns in data. SHAP analysis of XGBoost showed that the number of children under five in the household has a higher impact on model output, surpassing the value of DT and RF with a mean SHAP value of 0.159. However, XGBoost showed comparable performance to tree-based models, especially in identifying the most true positives. This indicates that ensemble boosting methods excel at capturing the complex, non-linear relationships commonly found in demographic and health data [56]. However, we conducted a study on reproductive-aged women because Women are susceptible to four distinct types of depression: postpartum depression, sadness associated with perimenopause or menopause, depression during pregnancy, and premenstrual dysphoric disorder (PMDD)[57]. In case of prevention of women’s depression, studies suggest antidepressants and alternative interventions throughout the life cycle, IPT interventions for postpartum depression of women [57,58]. Another study also suggested antidepressant medications and cognitive behavior therapy (CBT) for the treatment of severe depression and says CBT can alleviate Acute distress, and as long as treatment is sustained or extended, it also seems to lower the chance that symptoms would recur. Furthermore, long after therapy is finished, it seems to have a lasting effect that lowers the chance of relapse or recurrence. Combining medication with cognitive-behavioral therapy (CBT) appears to be just as effective as using medication alone and maintains the long-lasting benefits of CBT [59]. Preventative mental health initiatives at the societal level, such as integrating mental health services into primary healthcare, creating community-based mental health programs, and implementing school-based mental health education to foster resilience early on, are crucial to improving this situation. Enabling an experienced workforce and bolstering digital mental health solutions, like smartphone apps for counseling and screening, can also be beneficial. In our study, we have shown various applications of ML techniques, including feature selection with combining techniques such as Boruta and the chi-square method, as well as state-of-the-art Shapley explainable AI, which has interpretability. We also shed light on feature selection for predicting depression in women and diagnosed the ML models in their most suitable way by using hyperparameter tuning. We used the synthetic minority oversampling technique (SMOTE) to balance the classes in the target column, thereby improving the ML model’s ability to learn from imbalanced data. We also demonstrated how ML models perform with imbalanced data. To sum up, we can say our analysis can suitably predict women’s depressive symptoms.
Limitations of the study
In contrast, our study also has some limitations, as this study was based on the BDHS 2022 survey data, and only the BDHS 2022 survey has a depression module to work with; as a result, we can only predict and analyze risk factors of depression for the current situation and cannot show any trend concerning time for depression of women. This limitation also reduces the value of the selected feature for depression and the effect of each feature, because factors of depression may vary over time and across cultures and circumstances in each origin. The identified relationships can only be observed through association, not a causal relationship. The exclusion of 6138 women due to missing covariate values may introduce moderate bias. Whereas the results we found may not represent the women who are not in pre- and post-reproductive age. Therefore, the absence of prior work with the same methodological approach and outputs may weaken our study.
Conclusion
The study used nationally representative BDHS 2022 data and multiple machine learning models to predict depressive symptoms among women in the reproductive age group in Bangladesh and to identify associated factors through SHAP interpretability analysis. The findings reveal a significant trade-off in model performance due to class imbalance. Random Forest performed best overall, with high accuracy, specificity, and precision, but with low sensitivity for identifying depressive symptom cases. In contrast, boosting models such as XGBoost, LightGBM, and CatBoost, along with Decision Tree, showed higher sensitivity, making them more effective at identifying individuals with depressive symptoms. The SHAP analysis also showed that the same set of socio-economic and behavioral factors consistently influenced the model’s output, but this does not imply causality, as the data are cross-sectional. The conclusions indicate that machine learning models may be helpful for risk stratification and identification of high-risk subgroups, rather than for diagnostic isolation. The strategies can help inform more focused screening, for example, by prioritizing those to be screened for further assessment with validated tools such as PHQ-9, especially in resource-constrained countries such as Bangladesh.
Supplemental material
Supplemental material - Machine learning-based prediction and risk factor analysis of depression among reproductive-aged women in Bangladesh: Findings from the BDHS 2022
Supplemental material for Machine learning-based prediction and risk factor analysis of depression among reproductive-aged women in Bangladesh: Findings from the BDHS 2022 by Santu Karmaker, Ariful Hossain Sourav, Hasibul Hassain Emon, Md. Moyazzem Hossain and Rumana Rois in Women’s Health.
Footnotes
Acknowledgements
The authors are grateful to the participants for providing the information and consent for the publication of the survey results without any identifiable information. The authors are thankful to the Editor and reviewer for their valuable comments and feedback, which helped improve the quality of the manuscript.

Ethical considerations
No author of this article was involved in the data curation process. The National Research Ethics Committee, ICF Macro Institutional Review Board, and Bangladesh Medical Research Council approved the Bangladesh Demographic and Health Survey (BDHS). DHS authority does not provide any ethical approval number for secondary data users.
Author contributions
Funding
The authors received no financial support for the research, authorship, and/or publication of this article.
Declaration of conflicting interests
The authors declared no potential conflicts of interest with respect to the research, authorship, and/or publication of this article.
Data Availability Statement
Supplemental material
Supplemental material for this article is available online.
References
Supplementary Material
Please find the following supplemental material available below.
For Open Access articles published under a Creative Commons License, all supplemental material carries the same license as the article it is associated with.
For non-Open Access articles published, all supplemental material carries a non-exclusive license, and permission requests for re-use of supplemental material or any part of supplemental material shall be sent directly to the copyright owner as specified in the copyright notice associated with the article.
