






Abstract
Error detection and correction are essential components of cognitive control. Following an error, adjustments such as response slowing and changes in accuracy are typically observed. Adaptive theories interpret this behavior as strategic control, while maladaptive theories link it to cognitive impairment. Recent research suggests that post-error slowing depends on error type and the available time to implement adjustments before the next stimulus. In this cross-sectional study, two independent samples completed a version of the Simon task in which response stimulus intervals (RSI) were manipulated to study their effects on post-error adjustments in different error placements (i.e., earlier vs. later errors based on each participant’s median response time across error trials). In Experiment 1, we conducted exploratory analyses to test whether post-error adjustments vary with error placement and RSI. In Experiment 2, we aimed to replicate these findings in an independent sample to assess their robustness. Across both experiments, post-error adjustments varied systematically, suggesting that longer processing time enables distinct, error-specific adaptive mechanisms and highlighting new avenues for future research.
Introduction
Error detection and subsequent behavioral adjustments constitute foundational mechanisms of adaptive functioning and are integral components of cognitive control (Botvinick et al., 2001). When an error is detected, the performance monitoring system (Ullsperger et al., 2014) activates enhanced cognitive control processes to coordinate and mobilize subordinate mechanisms, thereby reducing the probability of subsequent errors (Shenhav et al., 2013; Wessel, 2017).
To examine how these monitoring systems respond to errors, researchers frequently rely on conflict tasks such as the Simon, Flanker, and Stroop paradigms (Botvinick et al., 2004; Lee & Sewell, 2024). These tasks increase the likelihood of incorrect responses by introducing interference between competing stimulus dimensions. Within this framework, an error is defined as a response that fails to match the correct, stimulus-driven alternative.
Findings from these paradigms indicate that, after an error commission, individuals frequently exhibit compensatory behavioral adjustments. These include increases in response time on the subsequent trial, which is known as post-error slowing (PES; Danielmeier & Ullsperger, 2011); and changes in accuracy on subsequent trials, known as post-error accuracy (PEA), which may either improve (Beatty et al., 2020; Marco-Pallarés et al., 2008; Valadez & Simons, 2018) or decrease (Beatty et al., 2018; Dudschig & Jentzsch, 2009; Ullsperger & Danielmeier, 2016; van den Brink et al., 2014).
There are competing theories and evidence regarding whether PES represents an adaptive or maladaptive consequence of an incorrect response. Adaptive theories of error processing propose that this slowing reflects strategic cognitive control mechanisms aimed at preventing future errors, which leads to improved task accuracy or PEA (Botvinick et al., 2001; Dutilh et al., 2012; Ridderinkhof, 2002). Alternatively, maladaptive theories argue that this slowing results from a disruption in cognitive processing, as the error automatically captures attention and reduces sensitivity to sensory information, which may lead to decreased PEA (Notebaert et al., 2009; Purcell & Kiani, 2016).
A recent theoretical development by Wessel (2018) partly resolves this conflict by proposing that PES comprises two distinct mechanisms that depend on the time available to process the error before the next stimulus is presented (response stimulus interval [RSI]). The first mechanism is known as orienting-related PES, which occurs when there is insufficient time to complete automatic and controlled post-error processes, including error detection, motor system inhibition, and task-set reconfiguration, and may be associated with decreased PEA. The second mechanism is strategic PES, which is more deliberate and reflects adaptive post-error adjustment that emerges after completing the aforementioned processes, and is calibrated according to specific task demands.
Various studies have supported this proposal and demonstrate that when the RSI is longer, PES tends to decrease and PEA increases (Beatty et al., 2020; Buzzell et al., 2017; Dudschig & Jentzsch, 2009). Additionally, researchers have observed that prolonged RSI is associated with greater activity in regions linked to cognitive control, which facilitates more efficient processing of the subsequent stimulus (Li et al., 2021). These findings suggest that the adaptive nature of PES may depend on the time available for error processing.
Given this temporal dependency, another critical question emerges: when adequate time permits adaptive adjustment, does this adjustment remain invariant across different error placements? That is, are post-error adjustments equivalent regardless of whether errors occur faster or slower relative to an individual’s typical response time? It has been suggested that when more time is available, as in long RSI, the response may become error-specific (Wessel, 2018). This hypothesis has received empirical support in recognition memory experiments, where the timing or placement of errors within the response distribution has been proposed as potentially relevant to understanding post-error adjustments, as it could reflect different manifestations of speed–accuracy tradeoff. Specifically, early errors may result from prioritizing speed over accuracy, whereas later errors may reflect slower, more cautious, or compensatory responding (K. Damaso et al., 2020). Although error timing or placement patterns can vary across paradigms and participants, we suggest that this specificity is particularly relevant in conflict tasks with strict time constraints, where the balance between speed and accuracy plays a central role in post-error adaptation.
In the present study, we employed the Simon task to investigate error processing mechanisms in young adults. Consistent with previous literature on conflict tasks, we anticipated that congruent trials would exhibit higher accuracy than incongruent trials (Botvinick et al., 2001; Cespón et al., 2020), and that errors would be characterized by shorter response times than correct responses, reflecting their more impulsive nature (Brewer & Smith, 1989). Regarding post-error adjustments and RSI, we hypothesized that under long RSI conditions, PES would be attenuated while PEA would be enhanced compared to short RSI conditions. Lastly, based on theoretical frameworks suggesting that different error placements may engage distinct control mechanisms (K. Damaso et al., 2020; Wessel, 2018),in Experiment 1 we conducted exploratory analyses to examine whether post-error adjustments vary as a function of error placement (i.e., earlier vs. later errors relative to each participant’s median response time across error trials) under different RSI conditions (i.e., short vs. long). In Experiment 2, we investigated whether the same effects would hold in an independent sample.
Experiment 1: Exploratory Analyses of Error Placement and Post-Error Adjustments
In this experiment, we examined error processing mechanisms in young adults using a Simon task. We assessed standard congruency and error response times (RT) effects, tested whether post-error adjustments differed as a function of RSI duration, and conducted exploratory analyses to examine whether earlier and later errors (classified relative to each participant’s median error response time) were associated with distinct post-error adjustment patterns across RSI conditions.
Methods
The study adhered to national and international ethical standards for research involving human participants and received approval from the Institutional Review Board (CEMIC, Protocol #1197). All participants provided informed consent in accordance with the Declaration of Helsinki. The privacy rights of all participants were observed and protected throughout the study.
Participants
Fifty-seven individuals were recruited through non-probabilistic convenience sampling. Participants met the following inclusion criteria: age older than 18, normal color vision, and normal or corrected-to-normal visual acuity. Participants were excluded if their task accuracy fell below chance level (50%; n = 5), if they did not finish the task (n = 2) or if they did not complete the sociodemographic questionnaire (n = 1). The final sample comprised 49 participants (M = 25.2 years, SD = 4.25; 63.3% females), all residents of Buenos Aires, Argentina.
Simon Task: Experiment Design
Participants completed a Simon task adapted from Beatty et al. (2020) designed to elicit a sufficient number of response errors (see Figure 1). The task was programmed using MATLAB (MathWorks, Natick, MA, USA) and Psychtoolbox functions (Brainard & Vision, 1997; Kleiner et al., 2007). All sessions were conducted in a controlled laboratory environment. Participants were seated approximately 60 cm from the screen. The task was presented on a laptop with a 14-inch Full HD (1,920 × 1,080) screen display.
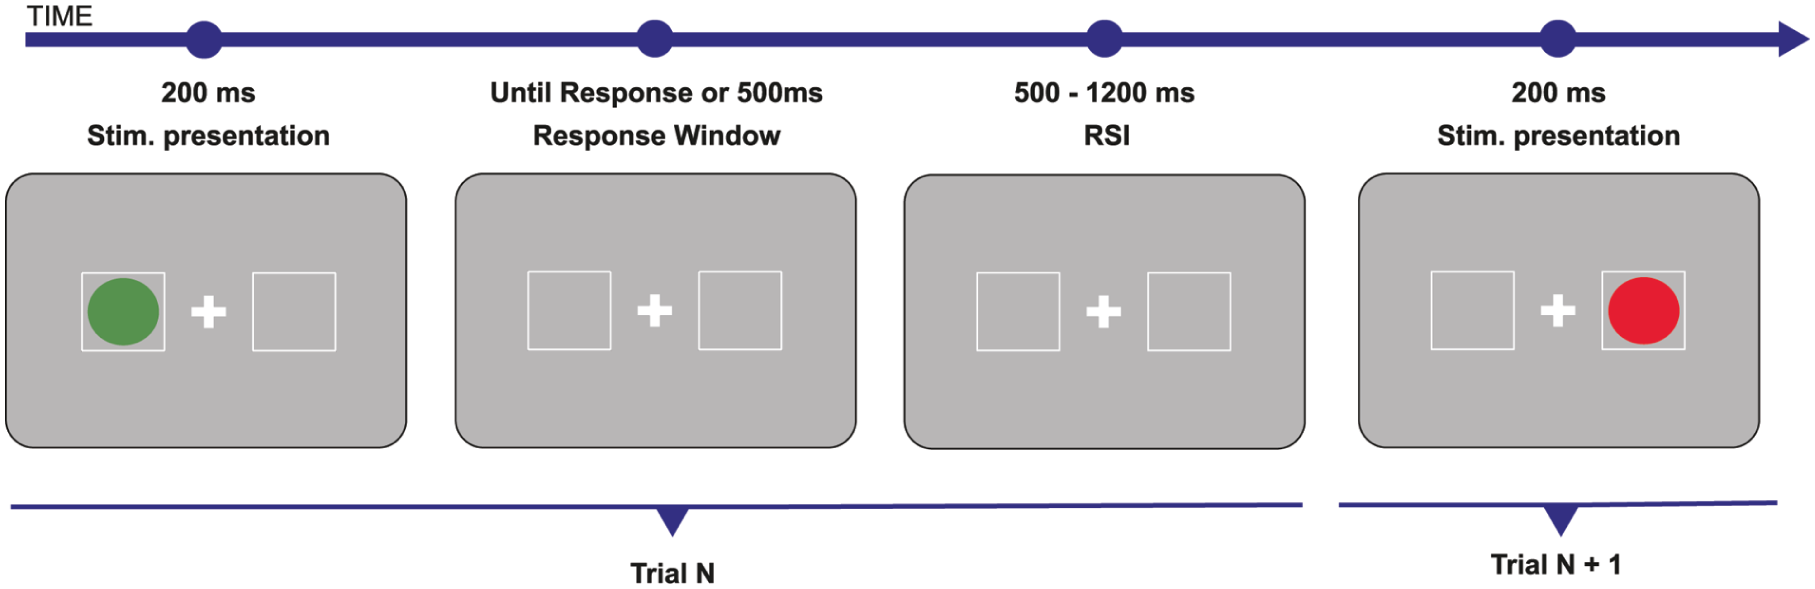
Experimental paradigm: Simon task adapted from Beatty et al. (2020).
Each trial began with a central light gray fixation cross on a darker gray background, flanked by two light gray boxes (3.75° × 3.75° visual angle) positioned 4.25° to the left and right of fixation. A red or green circle (2° diameter) appeared for 200 ms inside one of these boxes. Stimulus color and location were equiprobable.
All participants completed a mandatory practice phase consisting of 20 trials before beginning the main experiment. In both the practice and main task, participants were instructed to respond as quickly and accurately as possible by pressing the “2” key (left index finger) or the “8” key (right index finger), depending on the color of the stimulus. Response mappings were counterbalanced across participants.
The practice phase did not include trial-by-trial feedback, with the exception of delayed responses (later than 500 ms), where the message “too Slow” appeared. At the end of the practice, participants received their overall accuracy score and were given the option to repeat the practice by pressing the “R” key or to proceed directly to the main task by pressing the spacebar. This procedure ensured that all participants were familiar with the task requirements before the experimental blocks.
In the main task, responses exceeding 500 ms triggered a “too slow” message, and both the current and subsequent trials were excluded from analysis to avoid confounding effects. After each response, a randomly selected RSI was applied, ranging from 500 to 1,200 ms. To mitigate fatigue, participants took mandatory breaks of at least 30 s between blocks, during which they received feedback on accuracy.
The entire experiment consisted of 1,920 trials divided into 12 blocks of 160 trials each, lasting approximately 60 to 75 min per participant. Variables of interest include response times in correct and error trials, response times in congruent and incongruent trials, PES, PEA, and error placement (see Figure 2).
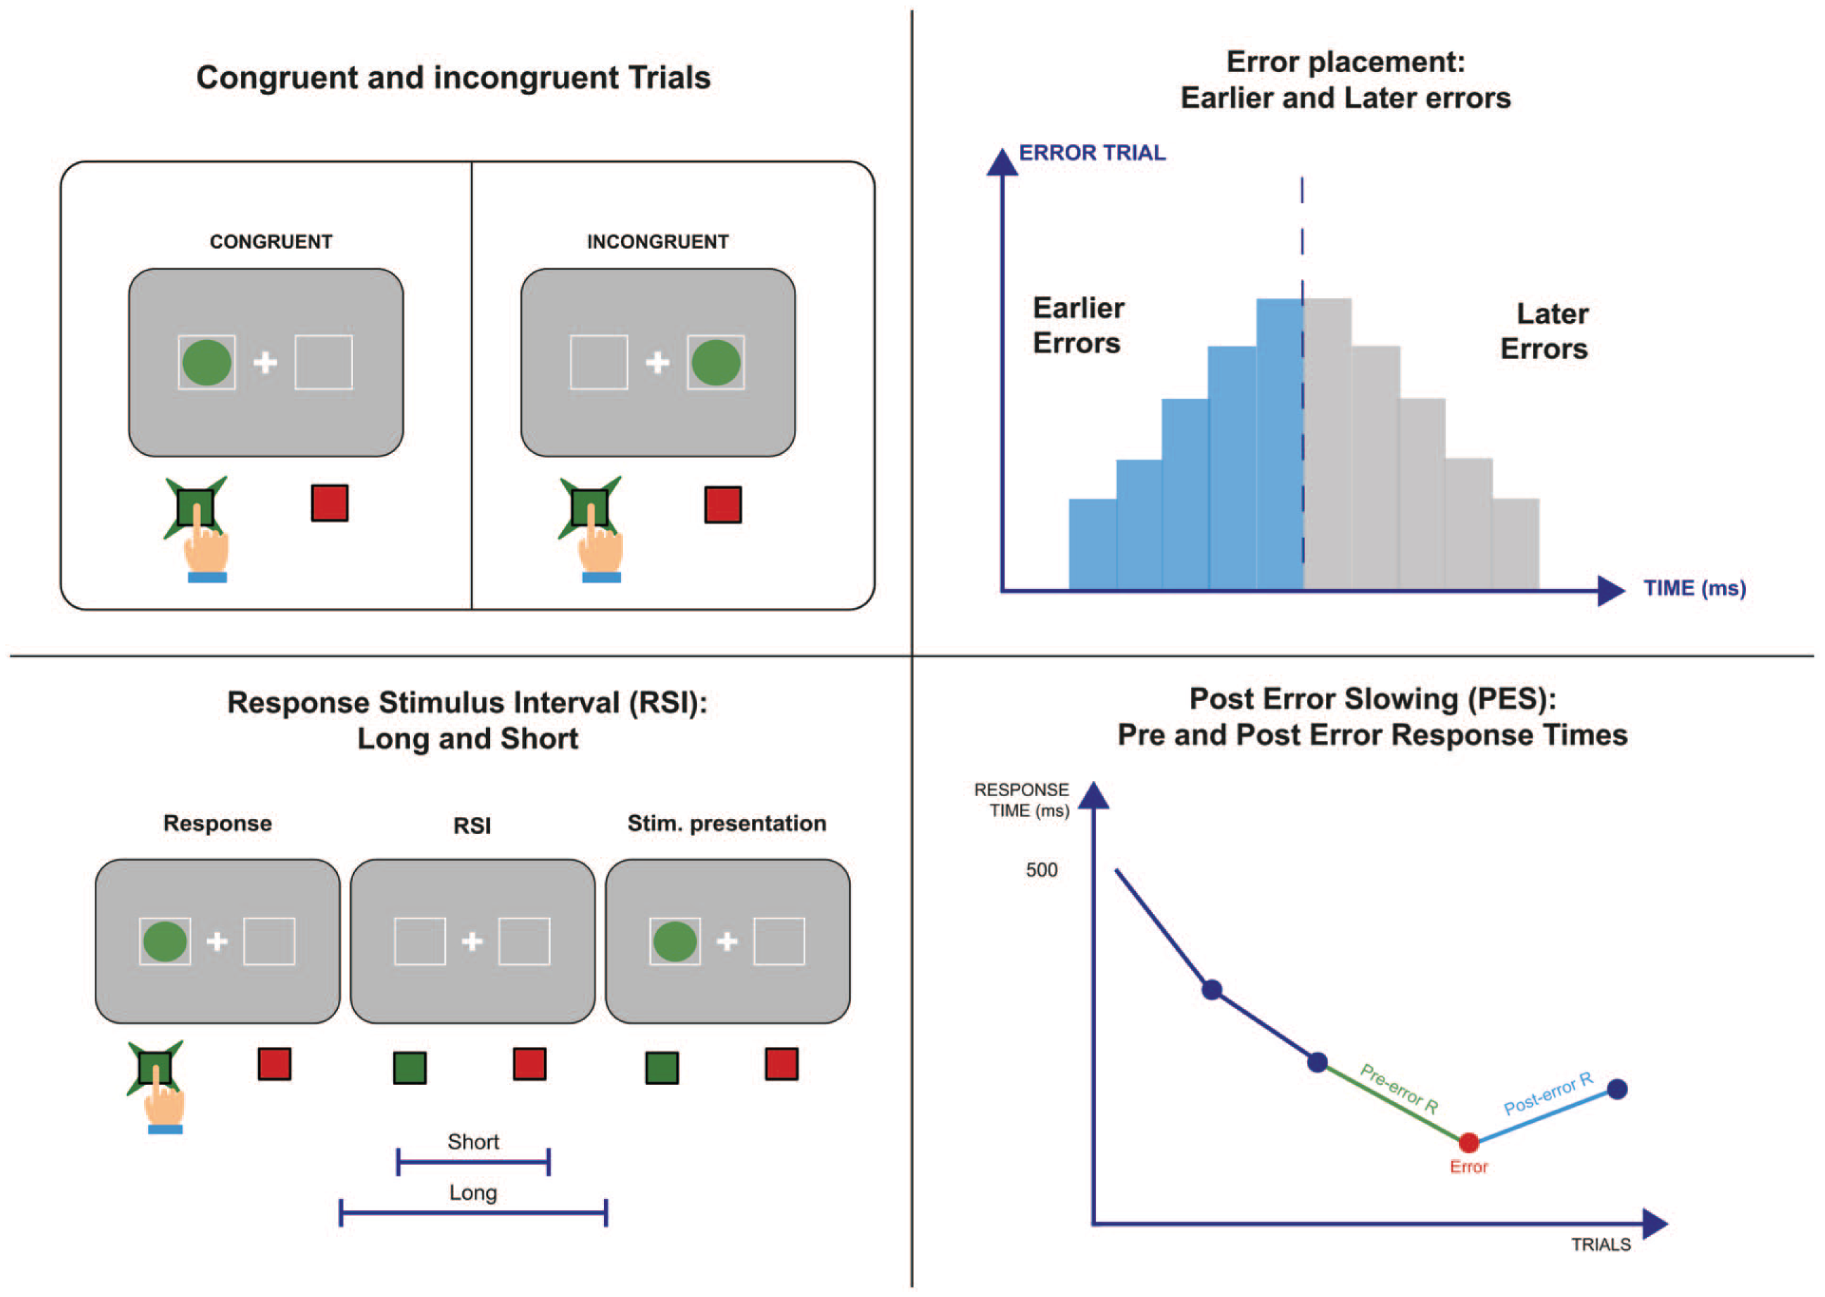
Schematic illustration of the main variables of interest. (1) Congruent and incongruent trials; (2) error placement: earlier and later errors (based on each participant’s median response time across error trials); (3) RSI short (500–850 ms) and long (>850–1,200 ms); and (4) PES, computed as a robust measure of the difference between pre- and post-error response times, following trial type correction procedures.
Data Analysis Plan
A minimum of five trials per condition (i.e., congruent and incongruent trials, error and correct RT, error and correct RT in congruent and incongruent trials, PES, PEA, post-correct accuracy, PES and PEA in short RSI and long RSI, PES and PEA in short RSI in earlier and later errors) was required for inclusion in the analyses (Beatty et al., 2020; K. Damaso et al., 2020; Olvet & Hajcak, 2009; see Supplemental Table S1 for a detailed trial count per condition).
Descriptive statistics were computed for all variables of interest. Then, to examine differences in RTs and accuracy between incorrect and correct responses and between congruent and incongruent trials, Student’s t-tests or Wilcoxon signed-rank tests were conducted (depending on whether test assumptions were met).
PEA and PES were computed as indices of behavioral adjustment following error commission. PEA was calculated as the percentage change in accuracy on post-error trials relative to post-correct trials:

PES was computed following the procedure outlined by Schroder et al. (2019), using the trial type correction method proposed by Derrfuss et al. (2022). PES was calculated separately for congruent and incongruent trials and then averaged to control for imbalances in trial type distribution before and after errors. Consistent with standard practice, PES was computed using only error trials that were preceded and followed by correct trials.

RSIs were categorized using a median split. Trials with RSIs at or below the 50th percentile (⩽850 ms) were classified as short RSI, while those above were considered long RSI. All subsequent analyses of PEA and PES were conducted separately for each RSI condition.
To evaluate post-error behavioral adjustments, one-sample t-tests or Wilcoxon signed-rank tests were conducted to determine whether PEA and PES significantly deviated from zero within each RSI condition. Additionally, paired-samples tests were used to compare PEA and PES between short and long RSI conditions.
To examine whether error placement affected post-error adjustments, errors were categorized as earlier or later based on each participant’s median response time across error trials. The average of these within-subject medians was 325.91 ms (SD = 25.93; Min = 269; Max = 370), indicating a variability of over 100 ms across participants. This inter-individual variability justified the use of participant-specific medians as a criterion for categorization. PEA and PES were then compared between earlier and later errors within each RSI condition using paired-samples t-tests.
Effect size estimates were reported for paired-sample tests. Specifically, Hedges’ g was used for the paired-samples Student’s t-test, with values interpreted as small (g ⩾ 0.2 and <0.5), medium (g ⩾ 0.5 and <0.8), and large (g ⩾ 0.8) effect, whereas the r-value was used for the Wilcoxon signed-rank test, interpreted as small (r ⩾ .1 and <.3), medium (r ⩾ .3 and <.5), and large (r ⩾ .5) effect (Tomczak & Tomczak, 2014).
Results
Descriptive Statistics
Descriptive statistics for all variables of interest are presented in Table 1. These descriptive values provide a general overview of the data and serve as the basis for the inferential analyses reported in the following subsections.
Descriptive Statistics of All Variables of Interest.
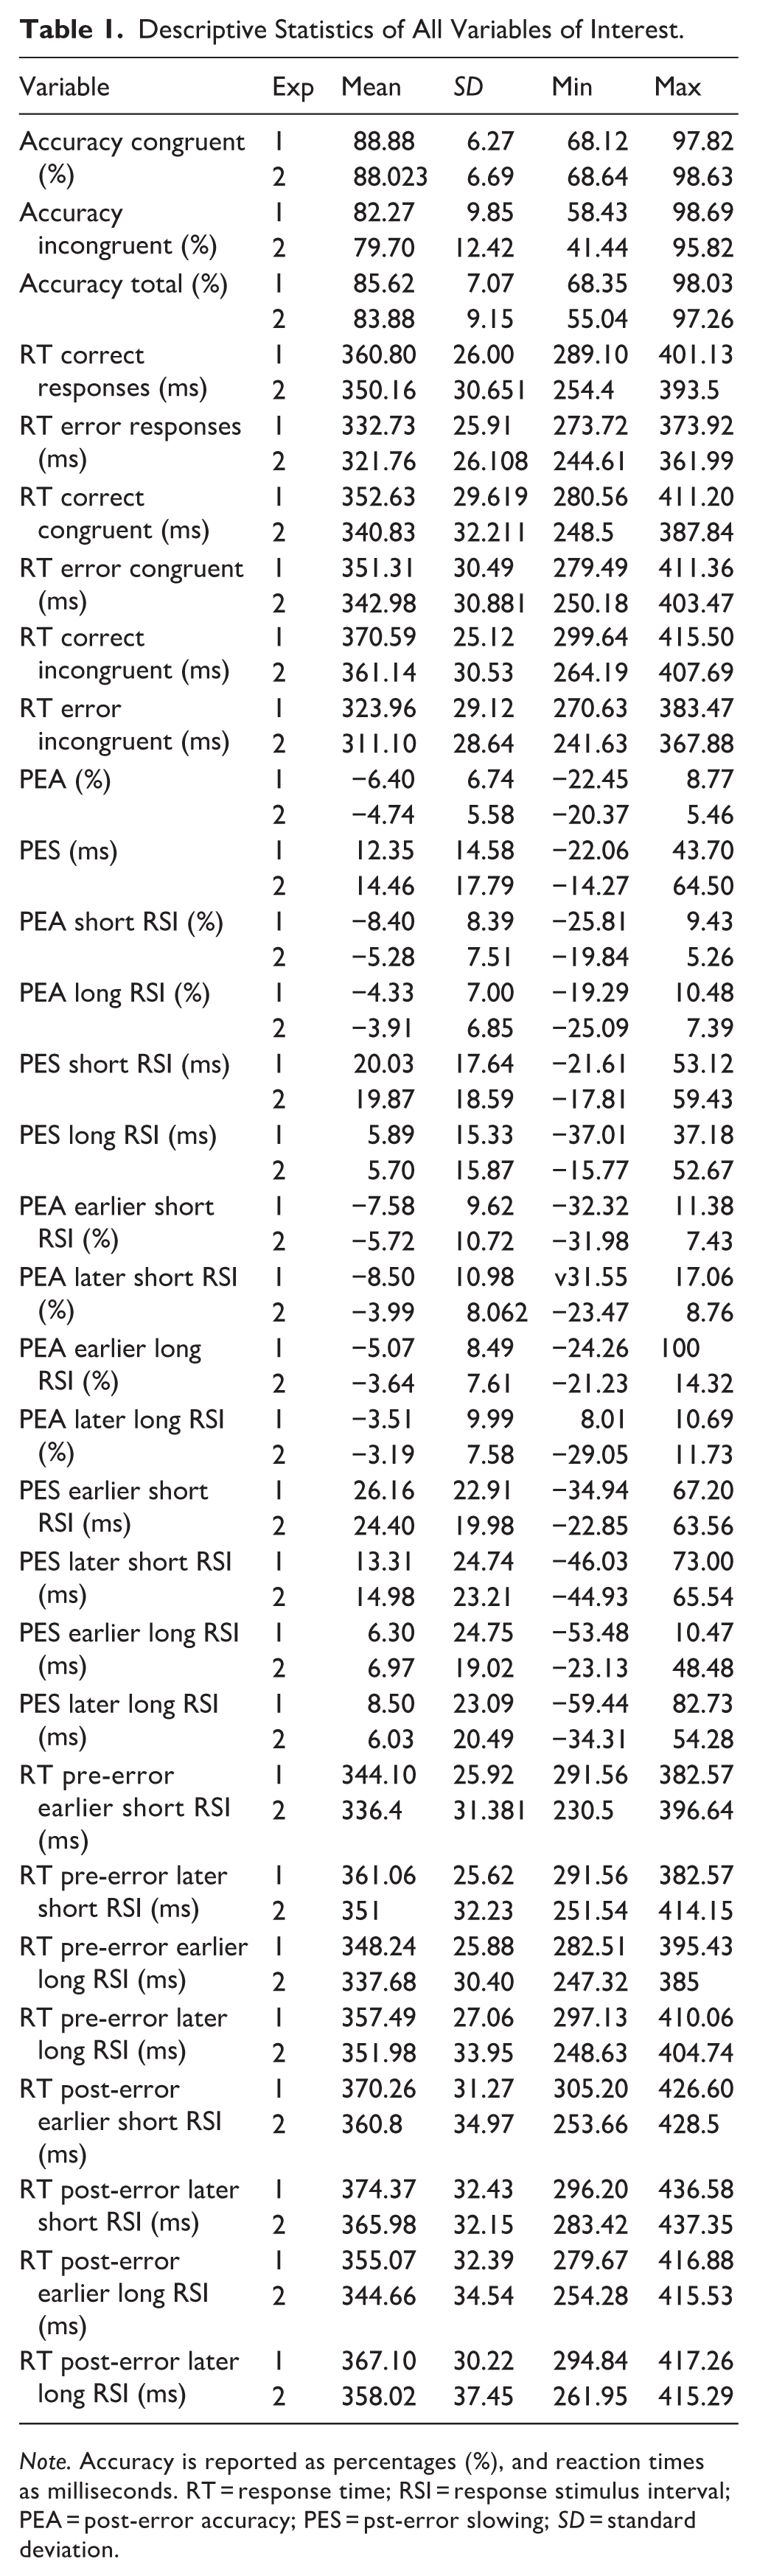
Note. Accuracy is reported as percentages (%), and reaction times as milliseconds. RT = response time; RSI = response stimulus interval; PEA = post-error accuracy; PES = pst-error slowing; SD = standard deviation.
Congruent Versus Incongruent Accuracy Comparisons
A Wilcoxon signed-rank test revealed significant differences in accuracy between trial types (z = 4.34, p < .001, r = .62). Participants demonstrated significantly lower accuracy on incongruent trials compared to congruent trials (see Table 1).
Differences in Response Times Between Correct Responses and Errors
A Wilcoxon signed-rank test revealed significant differences in response times between correct responses and errors (z = 6.09, p < .001, r = .87): errors showed faster response times compared to correct responses.
Further analyses by trial type revealed that this pattern was primarily driven by the incongruent condition trials. A Wilcoxon signed-rank test showed that correct responses on incongruent trials had significantly longer response times than errors on incongruent trials (z = 5.97, p < .001, r = .85). In contrast, no statistically significant differences in response times were observed between correct responses and errors in the congruent condition (t[48] = 0.34, p = .733, g = 0.05).
Post-Error Adjustments: PEA and PES
One-sample t-tests revealed significant post-error behavioral adjustments. PEA was significantly different from zero (t[48] = −6.65, p < .001) and showed a negative change (M = −6.40 ms, SD = 6.73), indicating that accuracy decreased following errors. PES was also significantly different from zero (t[48] = 5.93, p < .001) and showed a positive change (M = 12.35 ms; SD = 14.58), indicating that participants slowed their responses after committing errors.
Short RSI Versus Long RSI PEA Comparisons
One-sample t-tests showed that PEA was significantly different from zero (t[48] = −7.01, p < .001) for short RSI and long RSI (t[48] = −4.33, p < .001), indicating decreased accuracy following errors in both conditions (see Table 1).
A paired-samples t-test comparing PEA between RSI conditions revealed a significant difference (t[48] = −3.77, p < .001, g = 0.54), with greater PEA observed in the long RSI condition compared to the short RSI condition. PEA values were negative in both conditions; however, values in the long RSI condition were significantly closer to zero than those in the short RSI condition (see Figure 3B).
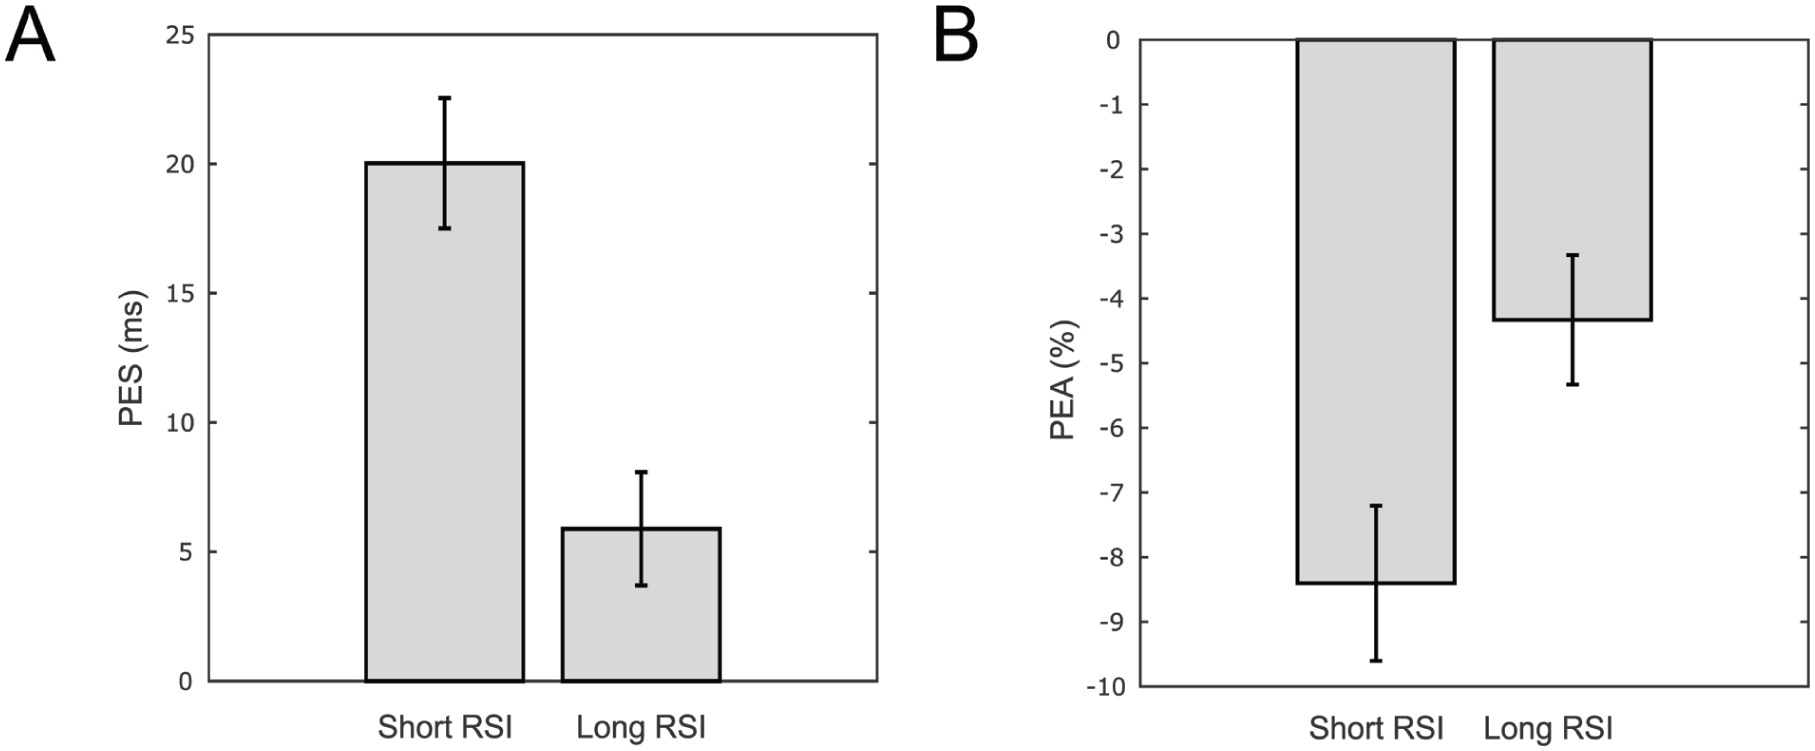
Post-error behavior as a function of RSI. (A) PES and (B) PEA as a function of RSI durations.
Short RSI Versus Long RSI PES Comparisons
One-sample t-tests showed that PES was significantly different from zero for both short RSI (t[48] = 7.04, p < .001) and long RSI (t[48] = 2.69, p = .009).
A paired t-test comparing PES between RSI conditions revealed a significant difference (t[48] = 6.00, p < .001, g = 0.86), with greater PES observed in the short RSI condition compared to the long RSI condition (see Figure 3A).
Earlier Versus Later Errors in Short Versus Long RSIs
PEA and PES
Analyses were conducted to examine post-error adjustments (PEA and PES) across different error placements (earlier and later errors) and RSI conditions (see Figure 4).
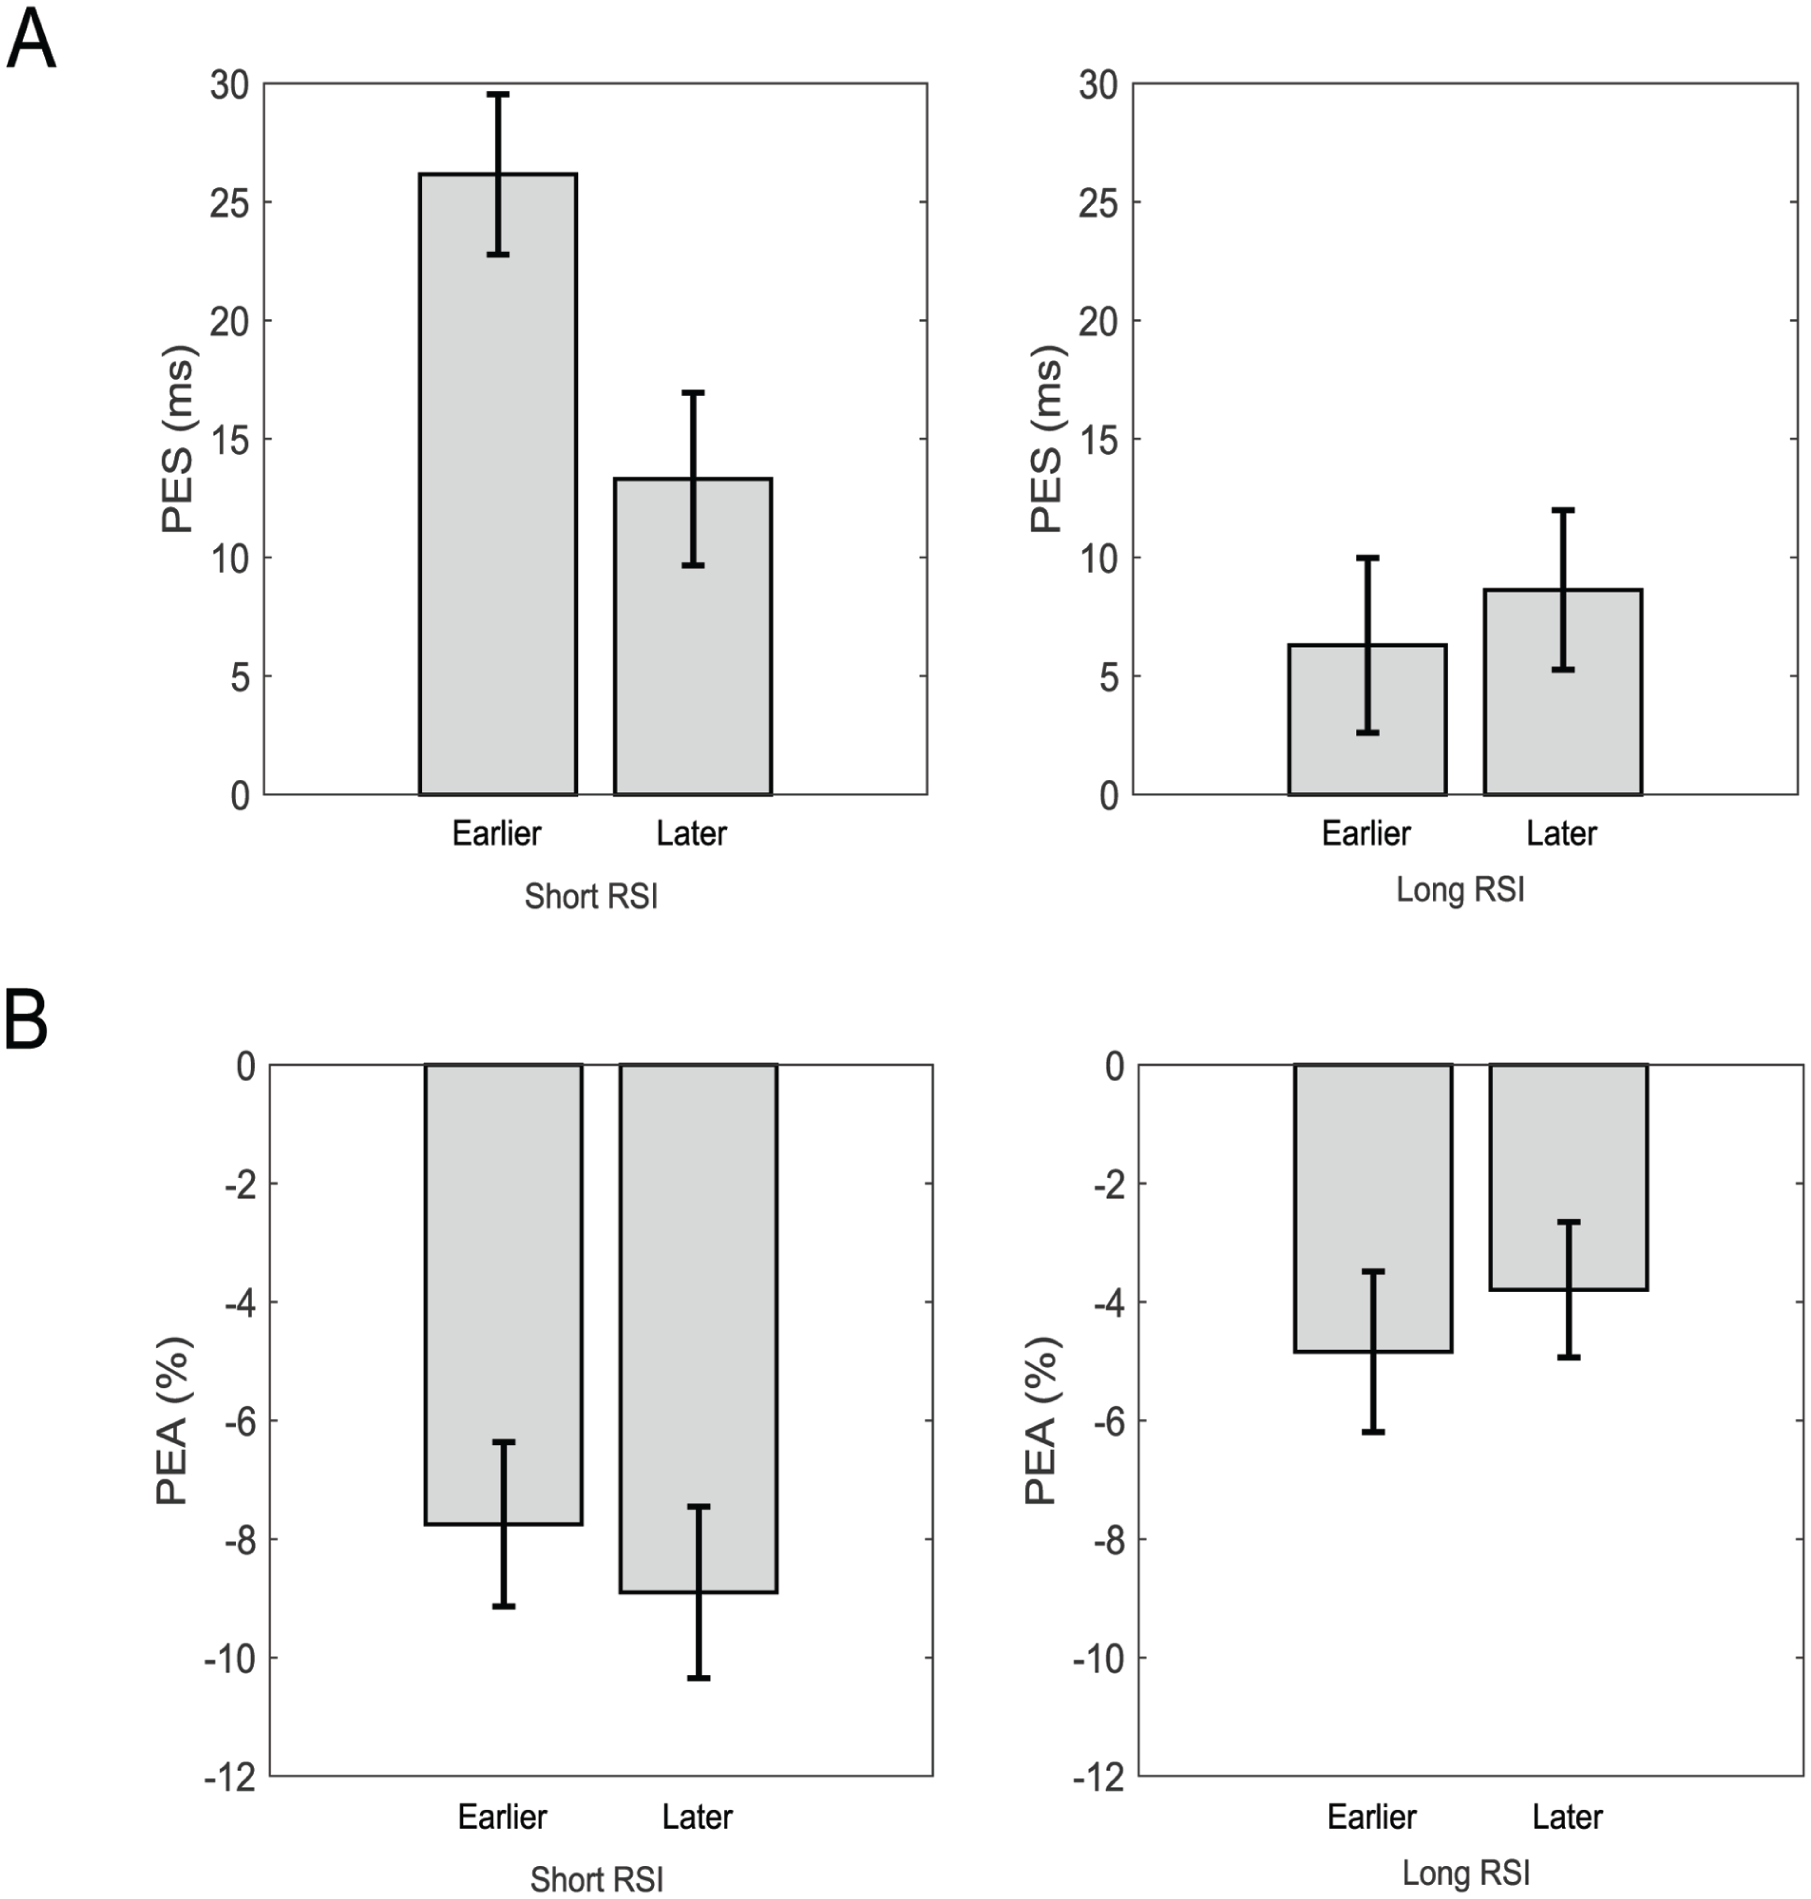
Post-error adjustments by error placement and RSI. (A) PES and (B) PEA for earlier and later errors under short (left) and long (right) RSI conditions.
Paired t-tests comparing PEA between earlier and later errors revealed no significant differences in either the short (t[48] = 0.76, p = .450, g = 0.11) or long (t[48] = −0.71, p = .484, g = 0.10) RSI conditions, indicating that error speed was not associated with PEA adjustments.
Regarding PES, error placement was associated with differential adjustments only in the short RSI condition. A paired t-test revealed significant differences (t[45] = 2.84, p = .007, g = 0.42), with greater slowing observed in earlier errors compared to later errors. However, no significant differences were found in the long RSI condition (z = −0.19, p = .852, r = .03).
Pre and Post-Error Response Times
To determine whether the observed PES differences reflected genuine post-error processing adjustments rather than pre-existing response time differences, we examined pre-error and post-error response times separately across RSI conditions (see Figure 5).
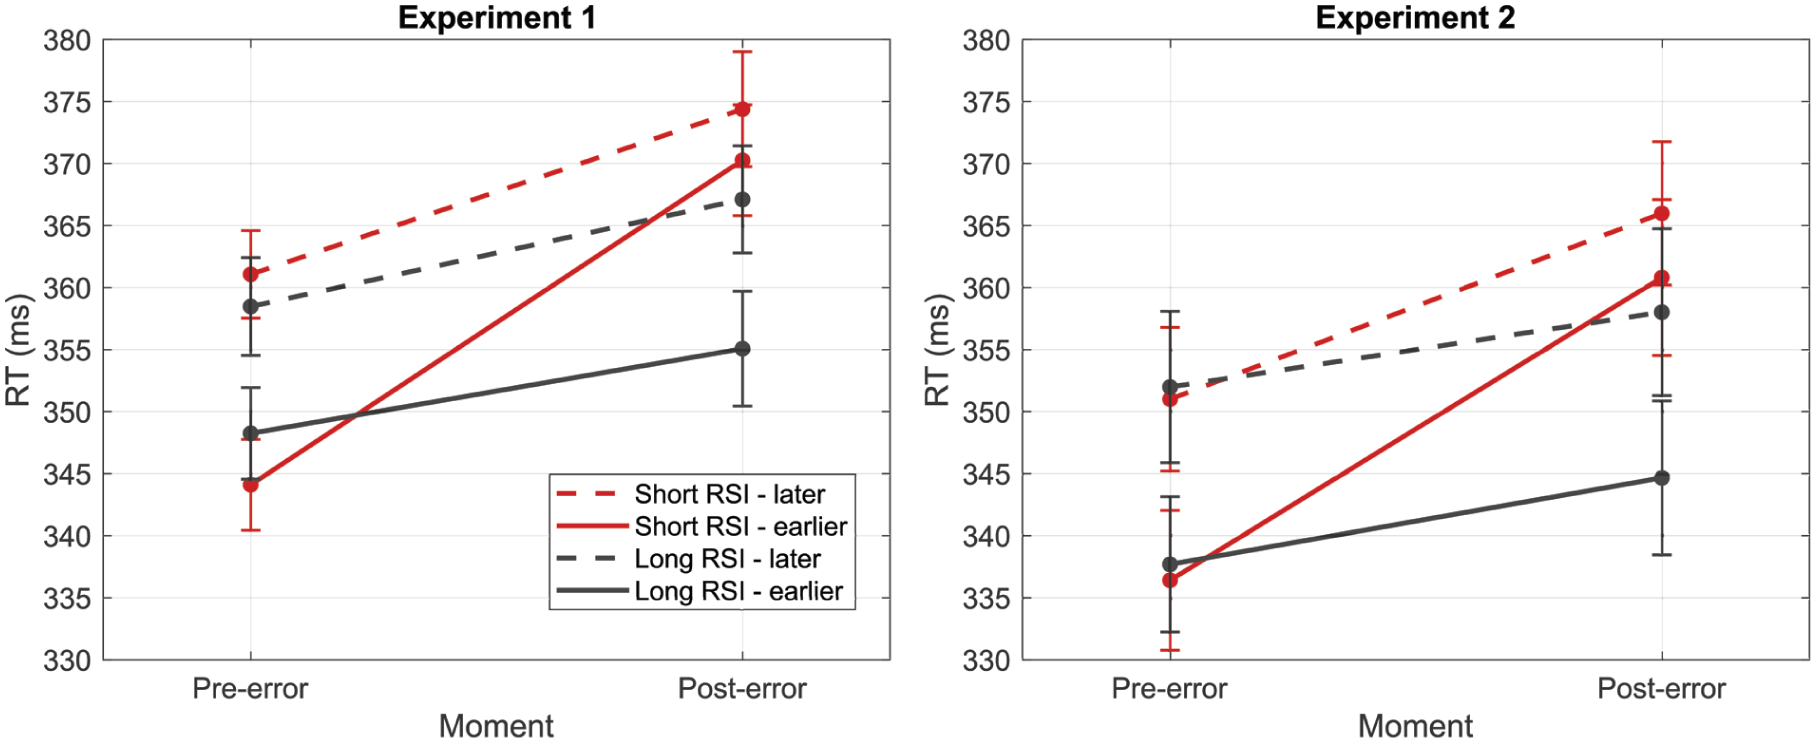
Mean RT (ms) at pre-error and post-error trials as a function of error placement (earlier vs. later) and RSI (short vs. long) for Experiment 1 (left panel) and Experiment 2 (right panel). Red lines indicate short RSI conditions and black lines indicate long RSI conditions; solid lines represent earlier errors and dashed lines represent later errors.
In the short RSI condition, significant differences were found between pre- and post-error response times in earlier errors (z = −5.15, p < .001, r = .76). In contrast, in this RSI condition, no significant differences were found between pre- and post-error response times in later errors.
Additionally, in short RSI conditions, significant differences were found (z = −4.34, p < .001, g = 0.64) in pre-error response times between earlier and later errors, with longer pre-error response times for later errors, compared to earlier errors. However, no significant differences were observed in post-error response times between error placements (t[45] = −1.14, p = .262, g = 0.17).
In the long RSI condition, no significant differences were found between pre- and post-error response times in earlier errors (t[44] = −1.71, p = .095, g = −0.25). In contrast, significant differences were found between pre- and post-error response times in later errors (t[45] = −2.56, p = .014, g = −0.38).
Additionally, significant differences were found in pre-error response times (t[44] = −2.50, p = .016, g = 0.37) between earlier and later errors. Significant differences were also found in post-error response times (t[45] = −3.52, p = .001, g = 0.52) between earlier and later errors.
Discussion
Consistent with previous research, congruent trials showed higher accuracy than incongruent ones, reflecting interference from automatically activated spatially corresponding responses that must be inhibited in incongruent trials (Botvinick et al., 2001; Cespón et al., 2020). In addition, errors were associated with shorter response times than correct responses. This pattern is consistent with pre-error speeding, which refers to the gradual decrease of response times in trials preceding an error (Brewer & Smith, 1989; P. M. Rabbitt, 1966; Pfister & Foerster, 2022).
Regarding post-error adjustments, we observed decreased PES and increased PEA under long RSI conditions. This means that, after committing an error, participants showed less slowing and higher accuracy in subsequent trials when the interval between response and stimulus was longer. These results are consistent with the idea that greater temporal separation facilitates adaptive control processes (Danielmeier & Ullsperger, 2011; Jentzsch & Dudschig, 2009).
Exploratory analyses examining error placement (errors were classified as earlier or later based on each participant’s median response time across error trials.) showed that within each RSI participants were equally accurate after earlier and later errors, regardless of how much time was available. No differences in PEA were found as a function of the error category. In contrast, PES differed between earlier and later errors under short RSI conditions: earlier errors were associated with greater PES than later errors. Under long RSI conditions, no differences were observed.
A central clarification is that PES reflects relative slowing, as it is determined by the relationship between pre- and post-error response times within their temporal context. To examine the mechanisms underlying this effect, we decomposed PES into its constituent pre-error and post-error response time components. Errors were classified as earlier or later based on each participant’s median response time across error trials.
Under short RSI conditions, differences in PES were primarily driven by variability in pre-error response times, while post-error response times remained consistent across both error categories. Given that post-error times did not differ as a function of error category, the observed variation in PES is attributable to differences in the pre-error baseline: earlier errors yielded a larger relative difference between pre- and post-error times and thus greater PES, whereas later errors produced a smaller relative difference and attenuated PES, despite comparable post-error behavior.
Under long RSI conditions, post-error response times scaled proportionally with the pre-error baseline. As a result, the relative difference between pre- and post-error response times remained constant across categories, and PES did not differ as a function of error classification. Critically, this pattern suggests that post-error adjustment did vary across error categories in long RSI, a difference that PES, as a relative measure, failed to capture.
These findings suggest that post-error adjustments are shaped by both preceding response dynamics and the time available for control processes to unfold. Given the exploratory nature of this finding, Experiment 2 was conducted to assess its reliability in an independent sample.
Experiment 2: Confirmatory Replication of Error Placement Effects
In this experiment, we sought to replicate the key findings of Experiment 1 in an independent sample using an identical Simon task design.
Methods
Participants
Thirty-two individuals completed the task. Participants were excluded if their task accuracy fell below chance level (50%; n = 1) or due to a data recording error (n = 1). The final sample comprised 30 participants (M = 24.66 years, SD = 3.39; 48.4% female), all residents of Buenos Aires, Argentina. A post hoc power analysis conducted in G*Power yielded a power of 0.73 at an alpha level of .05 (two-tailed), approaching the conventionally recommended threshold of 0.80 (Cohen, 1992).
Simon Task: Experiment Design
The methods were identical to those in Experiment 1 (see section “Simon Task: Experiment Design”).
Data Analysis
Data were analyzed following the same protocol as Experiment 1. The primary focus was on replicating the effect of error placement on post-error adjustments across RSI conditions.
Results
The results of Experiment 2 largely replicated those of Experiment 1. Descriptives of all variables of interest are presented in Table 1. Accuracy was significantly lower on incongruent trials than on congruent trials (z = 4.19, p < .001), and error trials were associated with faster response times relative to correct trials (z = 4.86, p < .001).
When comparing RSI conditions, PES was greater in the short RSI condition (t[28] = 5.08, p < .001). In contrast to Experiment 1, however, PEA did not differ significantly as a function of RSI (z = −0.67, p = .5052, r = −.12). Regardless of RSI condition, accuracy declined following errors, both in the short (t[30] = −3.92, p = .0005) and long RSI (z = −3.06, p = .0022) conditions.
Earlier Versus Later Errors in Short Versus Long RSIs
PEA and PES
A Wilcoxon signed-rank test comparing PEA between earlier and later errors revealed no significant differences in either the short (z = −0.79, p = .42, r = −.15) or long (z = −0.36, p = .71, r = −.07).
In contrast, error placement was associated with differential PES adjustments, but only in the short RSI condition. A paired t-test revealed significant differences (t[28] = 2.16, p = .03, g = 0.40), with greater slowing observed in earlier errors compared to later errors. However, no significant differences were found in the long RSI condition (t[28] = 0.25, p = .80, g = 0.05).
Pre and Post-Error Response Times
We examined pre-error and post-error response times separately across error placement and RSI conditions (see Figure 5).
In the short RSI condition, significant differences were found between pre- and post-error response times for earlier errors (z = −4.34, p < .001, r = −.81). Unlike Experiment 1, significant differences were also found for later errors (t[28] = −3.48, p = .002, g = −0.65).
Additionally, in short RSI conditions, significant differences were found (z = −3.88, p < .001, r = −.72) in pre-error response times between earlier and later errors, with longer pre-error response times for later errors, compared to earlier errors. However, no significant differences were observed in post-error response times between error placements (z = −1.83, p = .06, r = −.34).
In the long RSI condition, no significant differences were found between pre- and post-error response times in earlier errors (t[28] = −1.97, p = .05, g = −0.37) nor between the pre- and post-error response times in later errors (t[28] = −1.59, p = .12, g = −0.29).
In the long RSI condition significant differences were found in pre-error response times (t[28] = −5.67, p = .0000, g = −1.05) between earlier and later errors. Significant differences were also found in post-error response times (t[28] = −3.40, p = .002, g = −0.63) between earlier and later errors.
Discussion
Experiment 2 replicated the key findings of Experiment 1, including the main effects of congruency, the speed advantage of error over correct trials, and PES, but not PEA. Contrary to Experiment 1, PEA did not differ significantly as a function of RSI, which may reflect the higher overall level of PEA observed in participants of Experiment 2. Importantly, the effect of error placement was again observed confirming that post-error adjustments vary as a function of both error placement and RSI.
General Discussion
The present study investigated error processing mechanisms and post-error adjustments, with a specific focus on how RSI duration and error placement (i.e., earlier vs. later) influence different post-error adjustments.
Across two experiments, we found that post-error adjustments vary as a function of both error placement and the time available between response and stimulus. Specifically, under short RSI conditions, PES was greater following earlier errors than later errors. However, further analysis decomposing PES into its pre- and post-error response time components revealed that this difference did not reflect distinct post-error behaviors: response times following the error were similar regardless of whether the error had occurred earlier or later in the sequence. Rather, the difference in PES was driven by the pre-error baseline. Earlier errors, being faster, produced a larger contrast with the subsequent post-error response time, inflating PES, while later errors, being slower, produced a smaller contrast, attenuating it.
Under long RSI conditions, a similar logic holds: PES did not differ between error categories. However, this apparent equivalence does not mean that post-error behavior was uniform across categories. Decomposing PES into its pre- and post-error components revealed that post-error response times scaled in step with the pre-error baseline. Because the relative difference between pre- and post-error times remained constant, PES yielded no difference, yet the underlying post-error adjustment did vary.
To our knowledge, this is the first study to explore how error placement and RSI jointly influence post-error adjustments in conflict tasks. In the following paragraphs, we propose possible interpretations of these findings, while acknowledging that further replication will be necessary to establish their robustness.
One possible interpretation of these results is that they align with Wessel’s (2018) dual-process model, which distinguishes between automatic and controlled processes following errors. According to this model, automatic mechanisms are rapidly deployed immediately after an error and operate within a relatively fixed temporal window. Only after these processes are complete, slower and goal-directed mechanisms take over. From this perspective, the variation in post-error adjustments across error categories under long RSI conditions that indicates that participants adapted their behavior based on the specific characteristics of each error, may reflect fine-grained, trial-specific adjustments rather than a uniform post-error response.
A complementary interpretation is also plausible. One could argue that the short RSI (500–850 ms) in our study, while shorter than the long RSI, aligns more closely with medium RSI intervals than the “short RSI” (200–500 ms) typically used in prior studies using the same paradigm (e.g., Beatty et al., 2020; Buzzell et al., 2017). Therefore, it may represent an intermediate window that is still sufficient for some degree of adaptive control (P. M. A. Rabbitt, 2019; Ullsperger, 2024). In this view, both conditions support adaptive post-error adjustments, though with varying strategies. Specifically, the adjustments observed in the short RSI may reflect a more general and rigid control mechanism, a shift in the speed–accuracy tradeoff that is broadly beneficial for the task but not sensitive to specific trial characteristics. In contrast, the long RSI may allow for a more flexible, trial-by-trial adjustment process that is responsive to the particular features of the preceding error.
Taken together, these interpretations converge on the central role of temporal constraints in shaping post-error control, with short RSI promoting uniform adjustments and long RSI enabling error-specific adaptations. However, as mentioned before, these are tentative proposals pending replication and convergent evidence.
These interpretations must be considered alongside methodological considerations that warrant discussion. Our PES calculation followed Derrfuss et al. (2022) and Schroder et al. (2019). While this method provides a robust way to reduce variability and isolate cognitive control adjustments, it necessarily excludes post-error errors and may obscure individual differences in error processing. Moreover, these recent modifications in PES operationalization complicate cross-study comparisons, as methodological inconsistencies may partly account for the mixed findings in the literature. A further consideration concerns error classification methods. Although previous studies have also distinguished between earlier and later errors (K. Damaso et al., 2020) or between fast and slow errors (K. A. Damaso et al., 2022), it is important to acknowledge that categorizing errors based on their temporal placement, while informative, can systematically influence PES estimates and should therefore be interpreted with caution.
In addition, a number of design-specific limitations constrained our interpretations. The current RSI parameters may have limited our ability to observe early error-monitoring processes, since inclusion of shorter intervals (⩾250 ms) could reveal initial stages of error placement differentiation that occur immediately following error commission, such as the onset of attention orienting (Wessel, 2018) and motor inhibition (Guan & Wessel, 2022).
Despite these constraints, our findings provide critical evidence for the hypothesis that adaptation processes are error-placement-specific when sufficient processing time is available, regardless of behavioral accuracy. Looking forward, a key direction for future research is to investigate whether different temporal constraints recruit distinct neural control systems, as proposed by Dosenbach et al.’s (2008) dual-network model of top-down control. For instance, the more sustained adjustments observed under short RSI conditions may be driven by the cingulo-opercular network, which supports stable task-set maintenance and prolonged control states (Dosenbach et al., 2006, 2007; Vaden et al., 2013), whereas the more flexible adjustments that emerge under long RSI conditions may depend on the frontoparietal network, which enables adaptive, moment-to-moment control through continuous reconfiguration of connectivity patterns (Cocuzza et al., 2020).
Overall, these findings highlight temporal dynamics as a promising focus for understanding post-error adaptation, while also emphasizing the need for replication and multimethod approaches to establish their robustness and underlying mechanisms.
Supplemental Material
sj-docx-1-qjp-10.1177_17470218261463211 – Supplemental material for Post-Error Adjustments: The Role of Response Stimulus Intervals and Error Placement
Supplemental material, sj-docx-1-qjp-10.1177_17470218261463211 for Post-Error Adjustments: The Role of Response Stimulus Intervals and Error Placement by Victoria Cremerius, Federico Giovannetti, María Soledad Segretin, Juan Esteban Kamienkowski, Sebastián Javier Lipina and Marcos Luis Pietto in Quarterly Journal of Experimental Psychology
Footnotes
Acknowledgements
The authors thank Dr. Craig G. McDonald for providing the code used to implement the experimental paradigm, and Caterina S. Lardaro for her valuable contribution to data collection.
ORCID iDs

Ethical Considerations
The study adhered to national and international ethical standards for research involving human participants and received approval from the Institutional Review Board (CEMIC, Protocol #1197).
Consent to Participate
Written informed consent was obtained from all participants. The signed consent forms are retained by the authors.
Funding
The authors disclosed receipt of the following financial support for the research, authorship, and/or publication of this article: This research was funded by the Universidad Argentina de la Empresa under Project A24S21, titled “Error Processing in Young Adults” and led by Dr. Marcos L. Pietto.
Declaration of Conflicting Interests
The authors declared no potential conflicts of interest with respect to the research, authorship, and/or publication of this article.
References
Supplementary Material
Please find the following supplemental material available below.
For Open Access articles published under a Creative Commons License, all supplemental material carries the same license as the article it is associated with.
For non-Open Access articles published, all supplemental material carries a non-exclusive license, and permission requests for re-use of supplemental material or any part of supplemental material shall be sent directly to the copyright owner as specified in the copyright notice associated with the article.
