
Abstract
The Kapandji score is used widely to record thumb opposition and is the only alternative to angular measurements. We aimed to verify the extent to which the Kapandji score reflects the angle of pronation. We recruited volunteers with unaffected upper limbs (33 hands) and patients with carpal tunnel syndrome (20 hands). We attached a small gyroscope to the thumb metacarpal and measured the pronation and palmar abduction angles at each position of the Kapandji score in both groups. The Kapandji score showed a strong ceiling effect, and the increase in angle size at each Kapandji score levelled off around a score of 6 in both groups. A Kapandji score greater than 6 does not necessarily reflect thumb opposition.
Introduction
Thumb opposition consists of pronation and palmar abduction and is important for hand functions such as pulp pinch and grasp (Edmunds, 2011; Lee et al., 2003). Measurements of the extent of opposition is often used in reports of disorder that cause impairment of thumb opposition, such as severe carpal tunnel syndrome (CTS) and trapeziometacarpal (TMC) osteoarthritis (OA) (Badia and Sambandam, 2006; Garg et al., 2019).
The Kapandji score (Kapandji, 1986) is one of the methods for recording opposition, and is used widely due to its simplicity (Bakhach et al., 2018; Dehl et al., 2017; Naeem and Lahiri, 2013; Smeraglia et al., 2015). However, there have been reports that the score does not show differences between healthy participants and patients with thenar atrophy due to CTS (Barakat et al., 2013; Dilokhuttakarn et al., 2017). The method also has some shortcomings in that it is an interval scale and is affected by movements of other fingers.
We have reported a new method of measurement for the pronation and palmar abduction angles of the thumb using a gyroscope (Kuroiwa et al., 2018). To verify whether the Kapandji score reflects thumb opposition accurately, we measured thumb pronation and palmar abduction angles at each position of the Kapandji score in volunteers and in patients with CTS using this technique.
Methods
This study was approved by the institutional review board of our institution and we received written informed consent from all participants.
Participants
Between May 2018 and January 2019, we included 33 hands of 18 volunteers as a control group and 20 hands from 17 patients with CTS before surgery. At recruitment, we recorded the patients’ complaints and any history of trauma to their hands. We interviewed patients regarding their medical history, examined them physically using provocative tests for CTS and obtained radiographs of the hands.
We diagnosed primary CTS based on the following criteria: numbness of fingers; positive results of physical findings of CTS, such as Tinel’s sign and Phalen’s test; and abnormal values of nerve conduction velocities (NCV), according to the classification of Padua et al. (1997). The following patients were excluded: those who had an injured hand, or a hand that had undergone surgery for recurrence after CTS surgery: those with physical and imaging finding of osteoarthritis of the thumb metacarpophalangeal (MP) or trapeziometacarpal (TM) joints, as they have potential to affect the thumb motion; those who were suspected to have cervical spine disease; a space-occupying lesion in the carpal tunnel, found using magnetic resonance imaging, which could compress the median nerve; and those who had NCV gradings better than moderate in the Padua classification because thumb opposition is not impaired.
For the control group, volunteers were recruited from those who had undergone total hip arthroplasty at our institute and were sex- and age-matched with participants in the CTS group. The following patients were excluded: those who had a hand injury or operation, thumb pain, or numbness of fingers; those who had physical findings of CTS; and those who had osteoarthritis of the thumb MP or TM joints on radiographs. The reason we chose patients who underwent a total hip arthroplasty for the control group was that additional radiation exposure was unnecessary because they had already had routine radiographs of the hand to assess the possibility of using a walking stick.
Physical examination and NCV testing
Experienced hand surgeons conducted the physical examinations. The extent of atrophy of the thenar muscle was categorized into four stages by visual examination (Gelberman et al., 1987). All NCV tests were carried out and interpreted by experienced neurologists.
Apparatus
The apparatus used and its settings were the same as in the previous report (Kuroiwa et al., 2018). We measured angular velocity and acceleration of thumb movement using a three-axis gyroscope with a three-axis accelerometer (MP-M6-02/500C, MicroStone, Nagano, Japan). The method of attachment of the sensor was the same as in the previous report. The sensor was attached by tape to the dorsal aspect of the thumb metacarpal, parallel to the axis of the bone (Figure 1a).
(a) The sensor fixed on the thumb metacarpal during measurement. (b) The rotation angle around the longitudinal axis of the sensor was regarded as the pronation angle. (c) The inclination angle of the longitudinal axis of the sensor to the horizontal plane was regarded as the palmar abduction angle.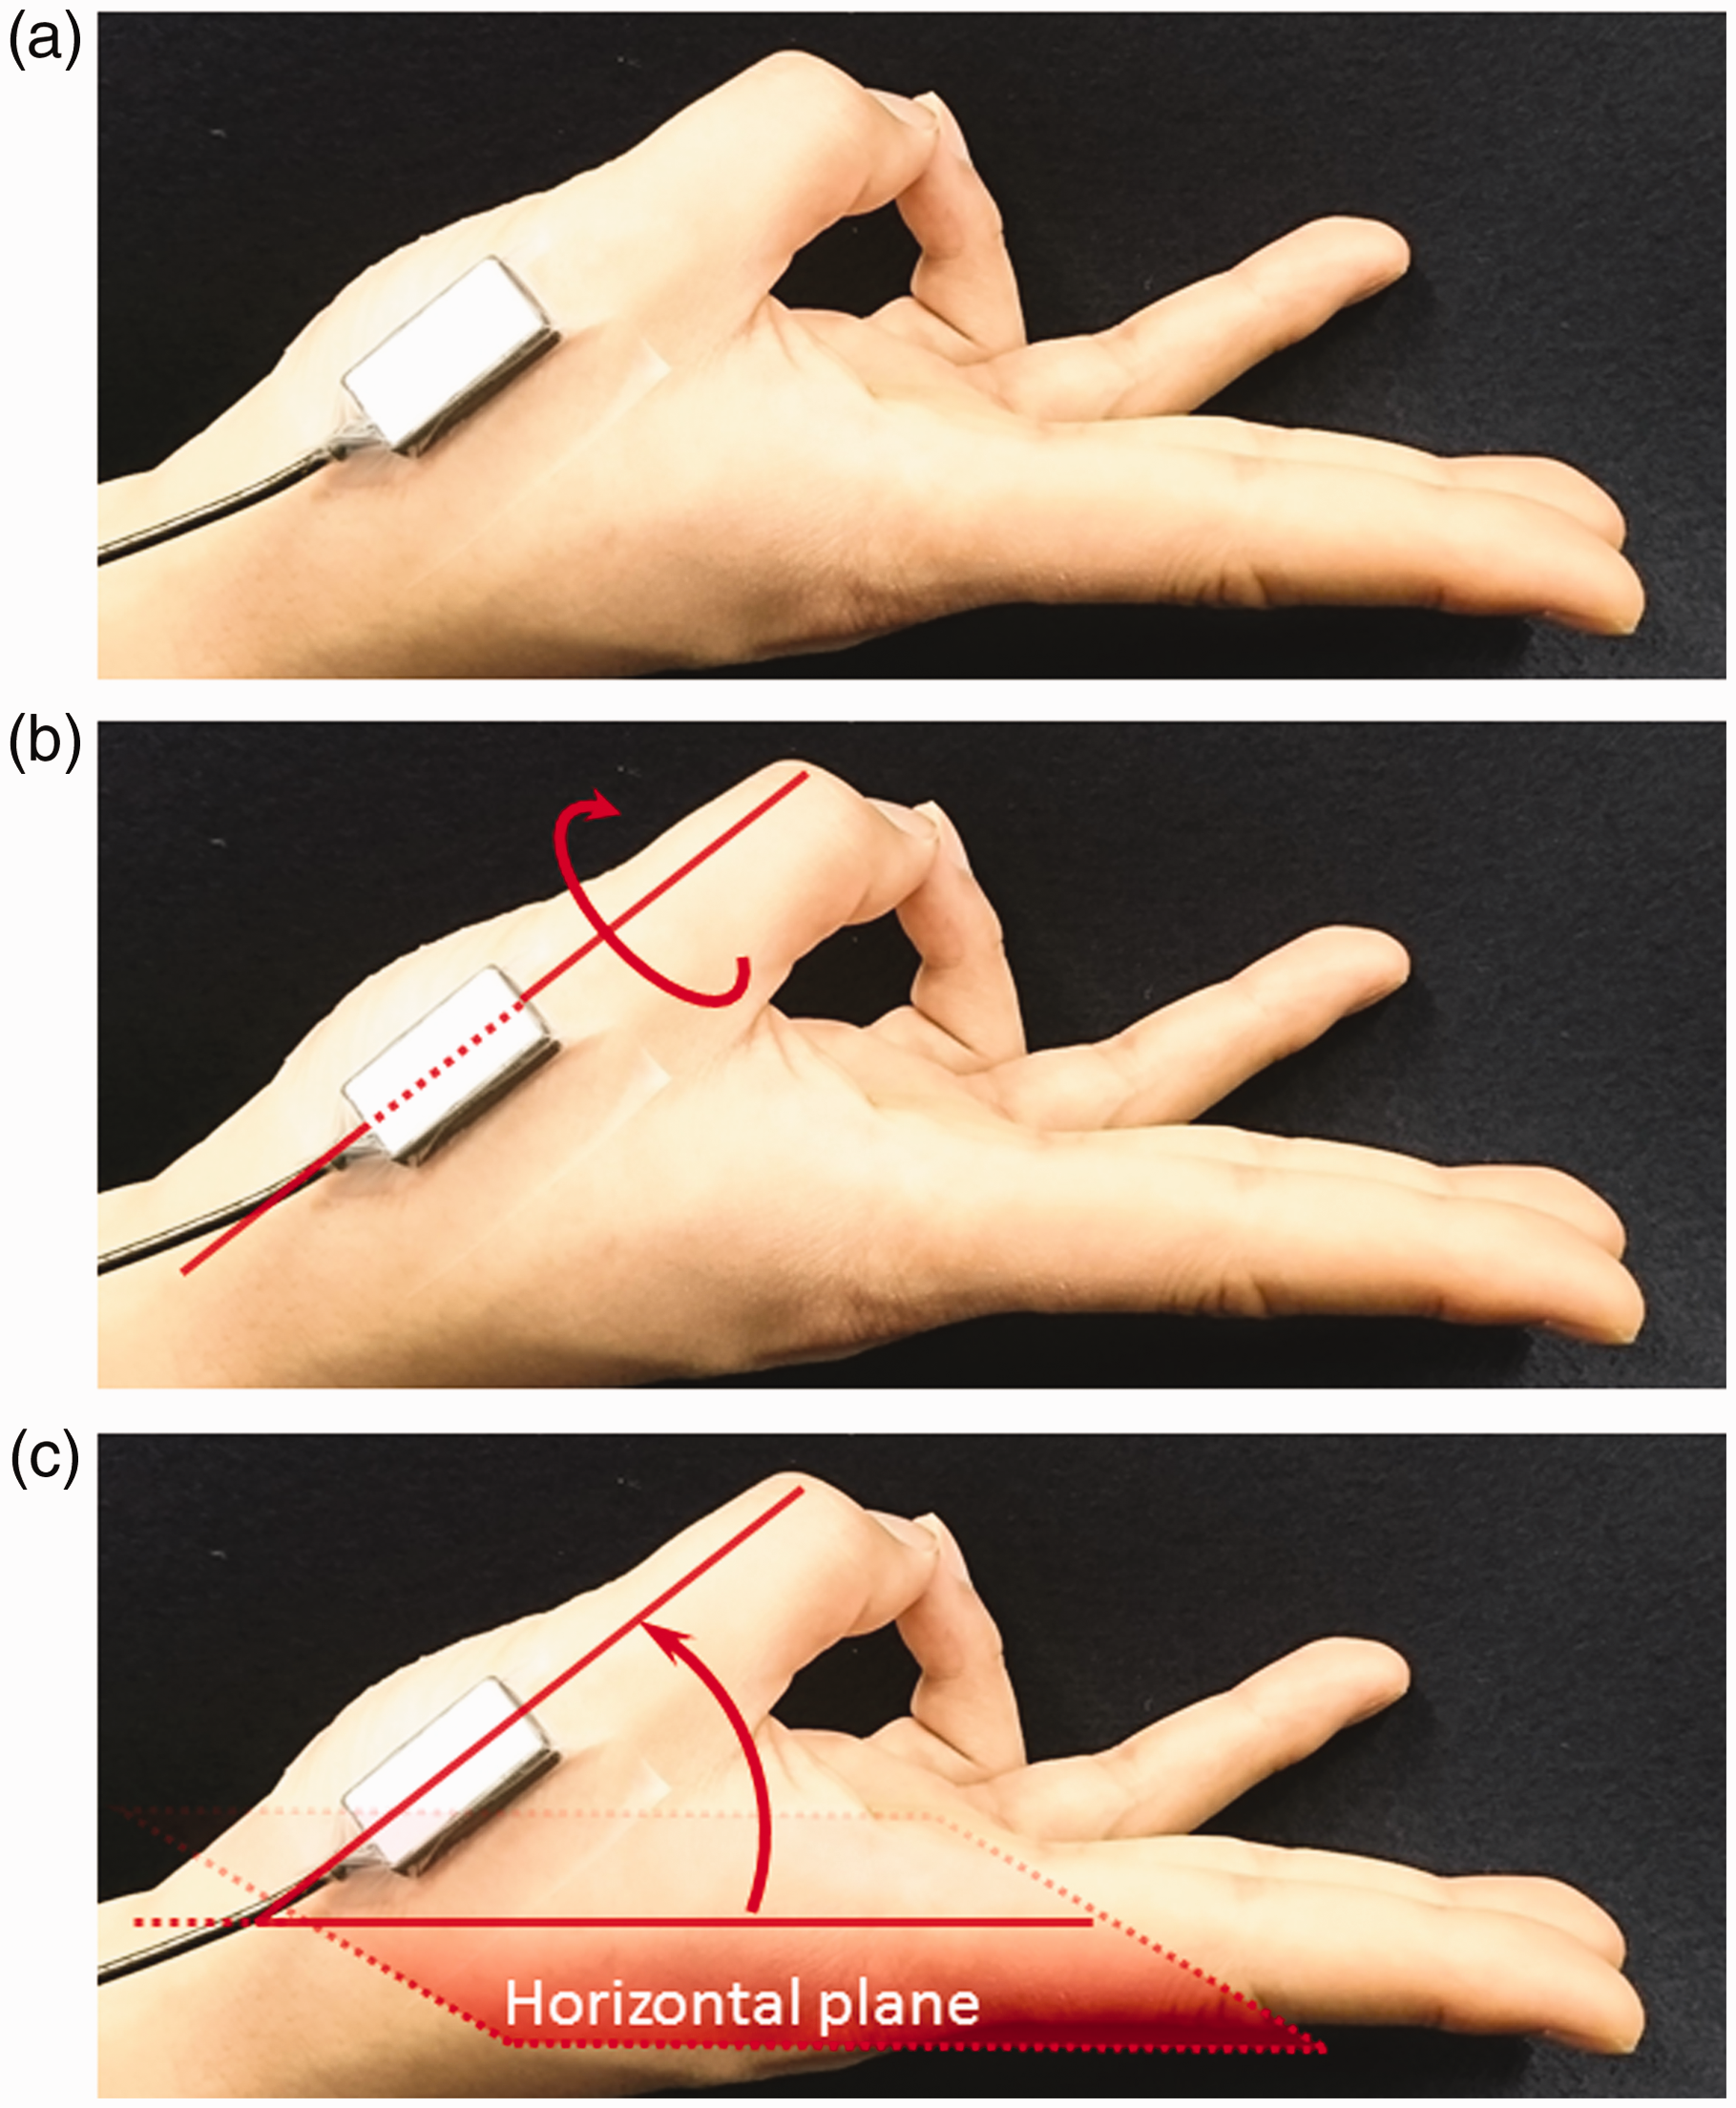
Measurement
Participants were instructed to move the thumb tip from the position of radial abduction to each position of the Kapandji score and to stop for 3 s at each position (Figure 2). Secondly, they opposed the thumb by drawing as large a semicircle as possible from the radial abduction position to the position of a score 10 of the Kapandji score. The angles of rotation and inclination of the metacarpal axis were measured at each position of the Kapandji score and during opposition movements. The examiner held the distal part of the participant’s index metacarpal and the wrist in a stationary position during these movements.
The measurement method of the ten positions in the Kapandji score. Start from the position where the thumb tip is in contact with (1) the radial side of proximal phalanx of the index finger; touch to (2) the radial side of distal phalanx of the index finger; (3) the tip of the index finger; (4) the tip of the middle finger; (5) the tip of the ring finger; (6) the tip of the little finger; (7) the distal interphalangeal joint crease of the little finger; (8) the proximal interphalangeal joint crease of the little finger; (9) the metacarpophalangeal joint crease of the little finger; (10) the distal palmar crease.
The rotation angle was regarded as pronation/supination and the inclination angle was regarded as palmar abduction (Figure 1b and c). The angular data were measured using a system in which the directions of pronation and palmar abduction were considered positive. The difference between the value of the radial abduction position and the value of each position of the Kapandji score, or maximum value during opposition, was calculated. The maximum Kapandji score and the Kapandji score that showed the highest pronation or inclination angles were recorded in each participant.
Statistical analysis
Data regarding age are presented as means with standard deviation and the measured angle as medians with interquartile ranges. The Student's t-test and the Mann-Whitney U-tests were used to compare differences for nominal variables and non-parametric variables, respectively. A ceiling effect was considered to be present if more than 15% of hands achieved the highest possible score (McHorney and Tarlov, 1995; Terwee et al., 2007). All statistical analyses were carried out by EasyR (version 1.36). A p-value <0.05 was regarded as statistically significant. We performed a power analysis based on the pronation angles. With reference to previous studies (Kuroiwa et al., 2018; Marquardt et al., 2014), the sample size to detect a 10° difference in the measured angle for the two groups, presuming an overall standard deviation of 10°, was estimated to be 16 participants per group to acquire 80% power.
Results
Patient characteristics
Characteristics of participants in the CTS and control groups.
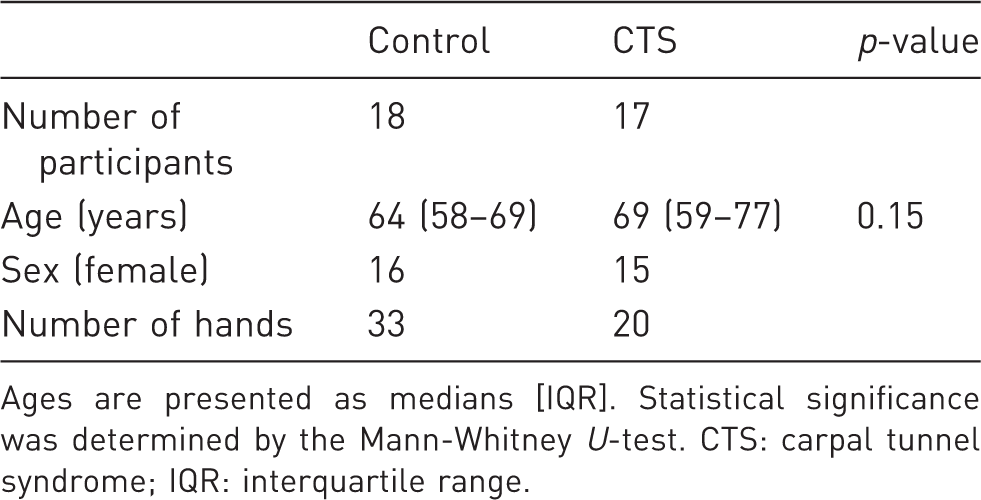
Ages are presented as medians [IQR]. Statistical significance was determined by the Mann-Whitney U-test. CTS: carpal tunnel syndrome; IQR: interquartile range.
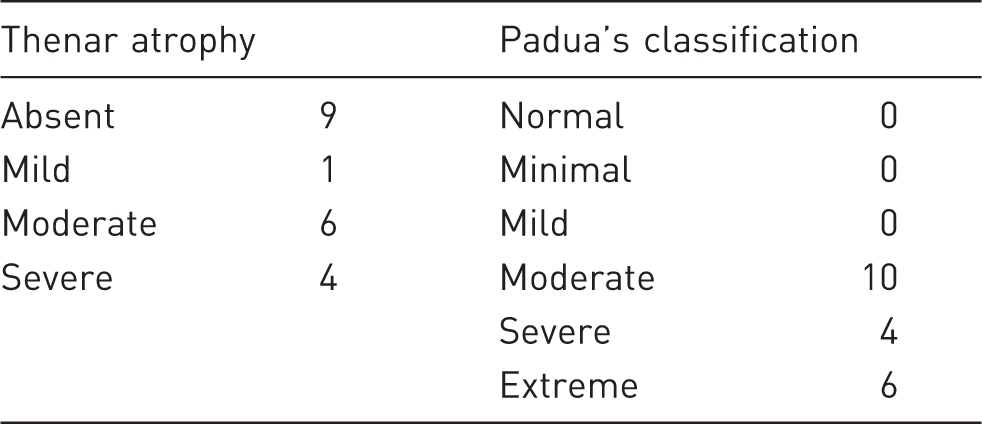
Physical findings and Padua classification in patients with carpal tunnel syndrome (n = 20).
Measurement data
The maximum Kapandji scores obtained.
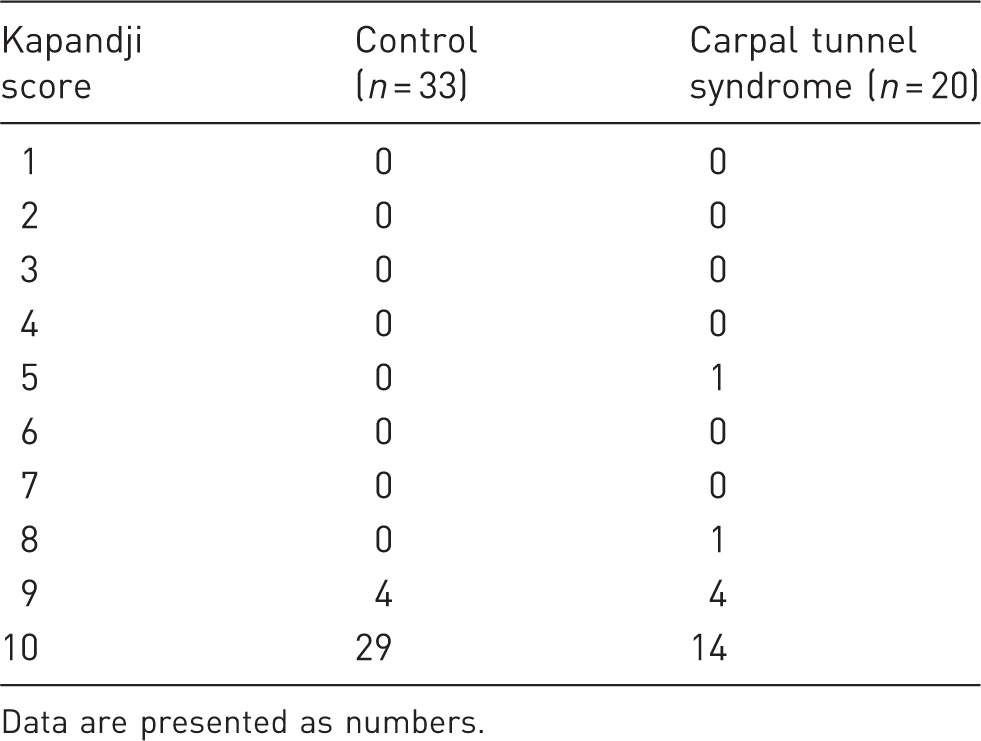
Data are presented as numbers.
Results of maximum pronation and palmar abduction angles.
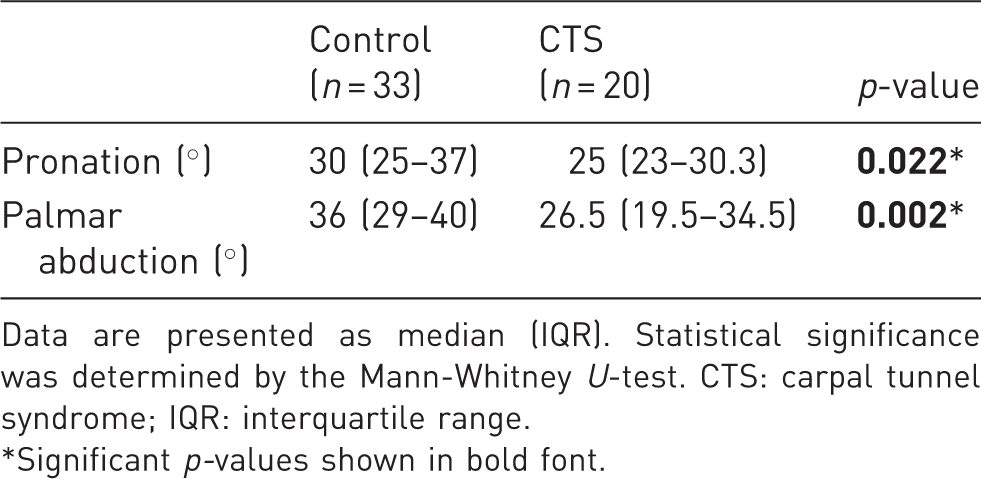
Data are presented as median (IQR). Statistical significance was determined by the Mann-Whitney U-test. CTS: carpal tunnel syndrome; IQR: interquartile range.
Significant p-values shown in bold font.
The pronation and palmar abduction angles at each position of the Kapandji score in the two groups are shown in Figures 3 and 4. Nineteen of 33 hands and 9 of 20 hands in the control and CTS groups, respectively, did not show a maximum pronation angle at the position of the maximum Kapandji score.
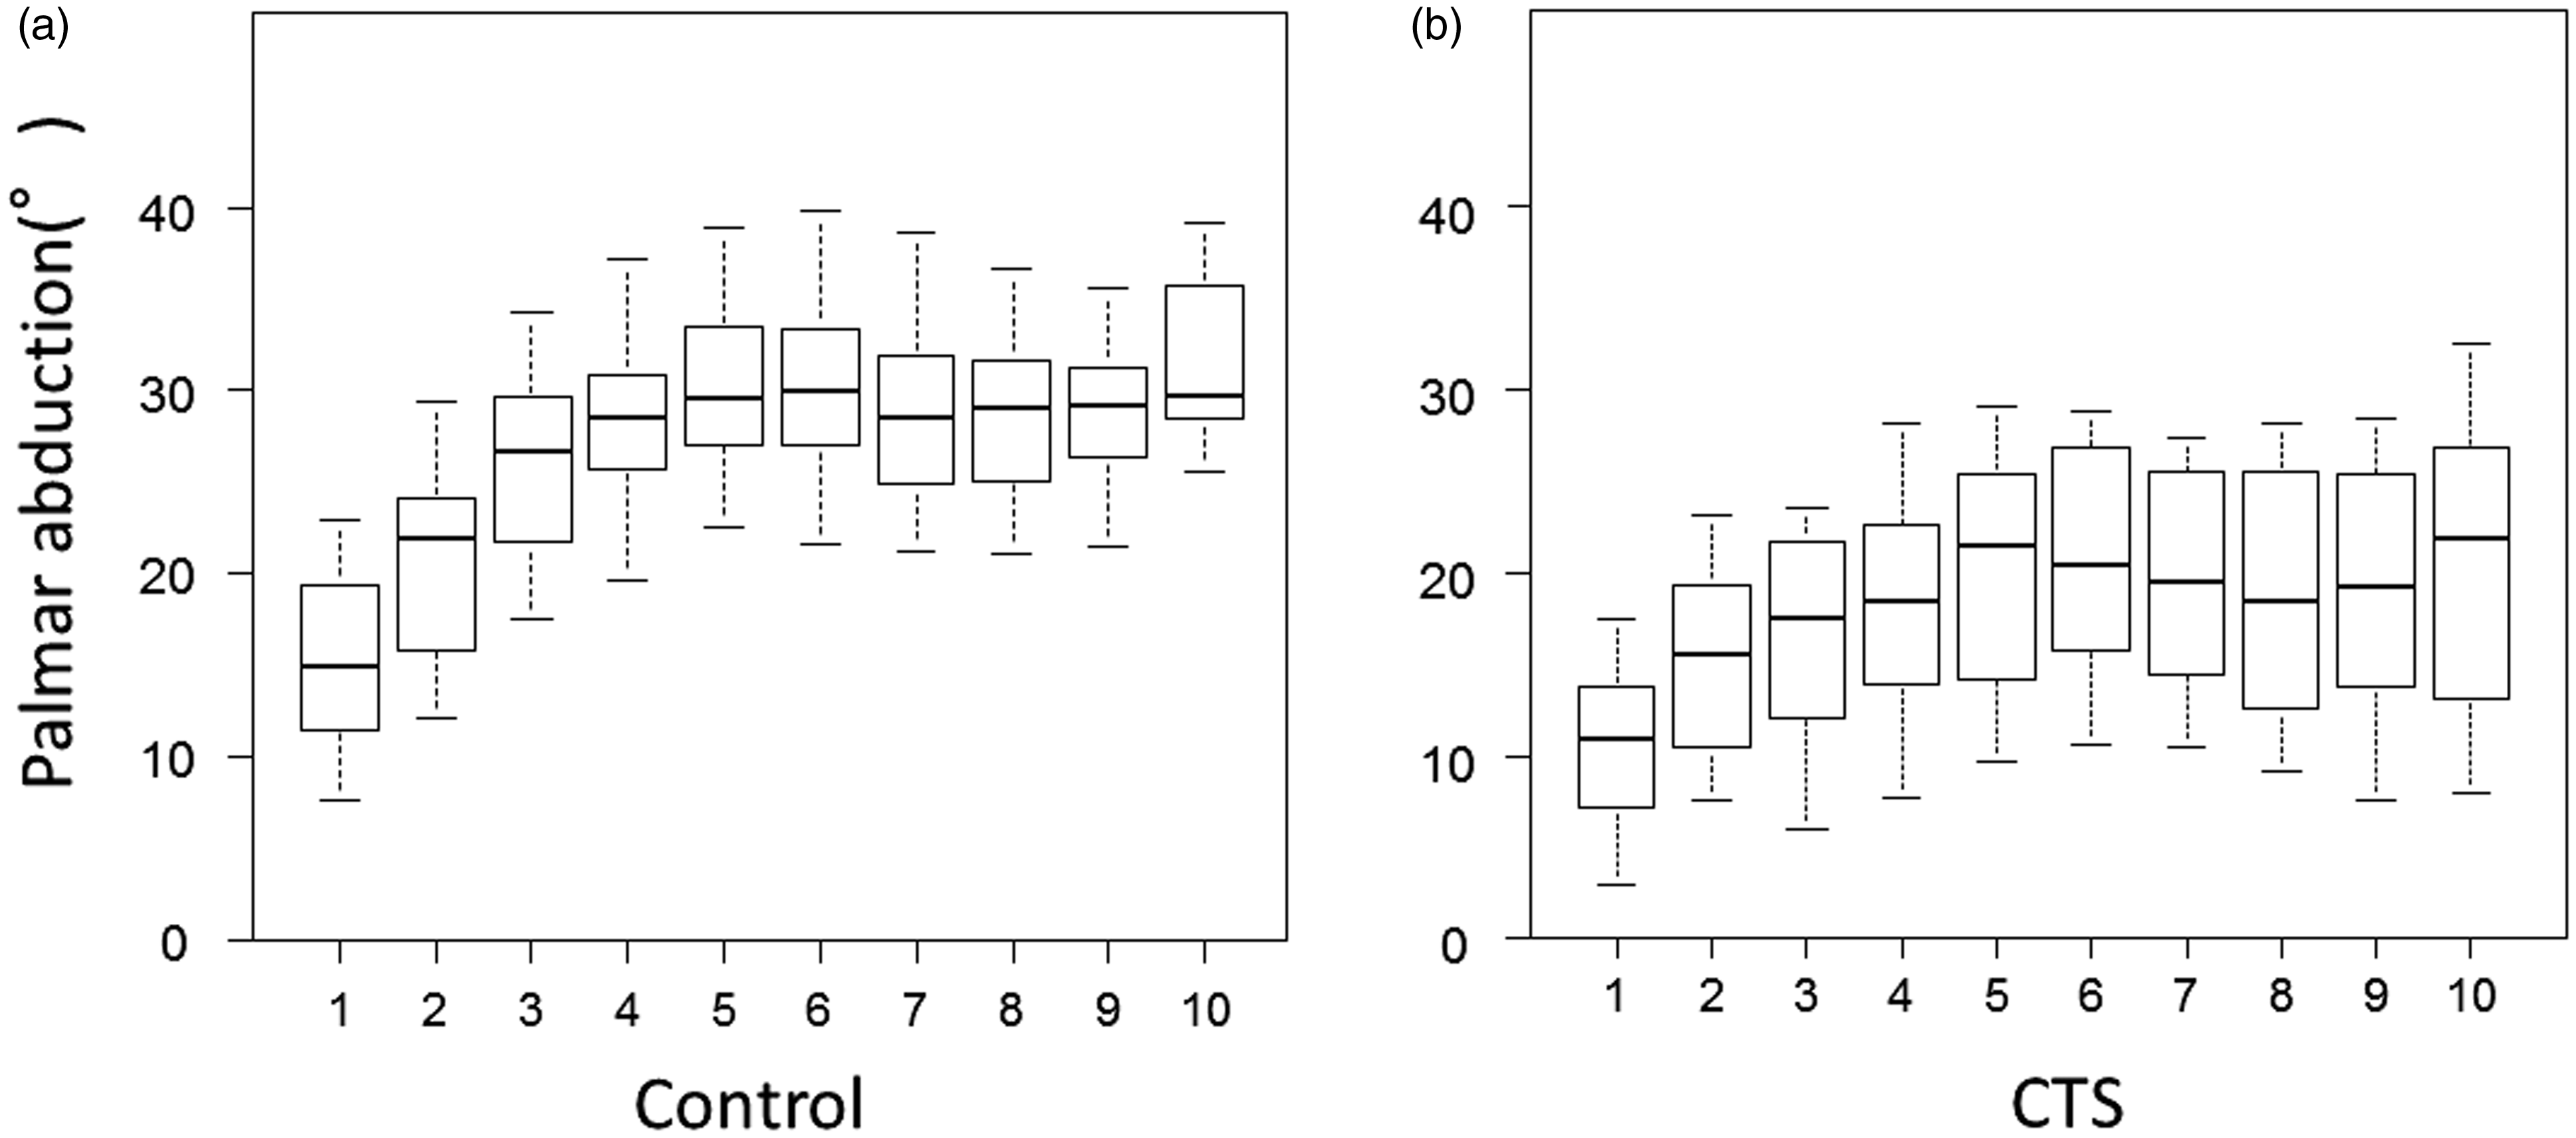
A box plot showing the pronation angles at each position of the Kapandji score in the (a) control and (b) carpal tunnel syndrome (CTS) group. Upper whisker, 90th percentile; box top, 75th percentile; central line, median; box bottom, 25th percentile; lower whisker, 10th percentile. A box plot showing the palmar abduction angles at each position of the Kapandji score in the (a) control and (b) carpal tunnel syndrome (CTS) group. Upper whisker, 90th percentile; box top, 75th percentile; central line, median; box bottom, 25th percentile; lower whisker, 10th percentile.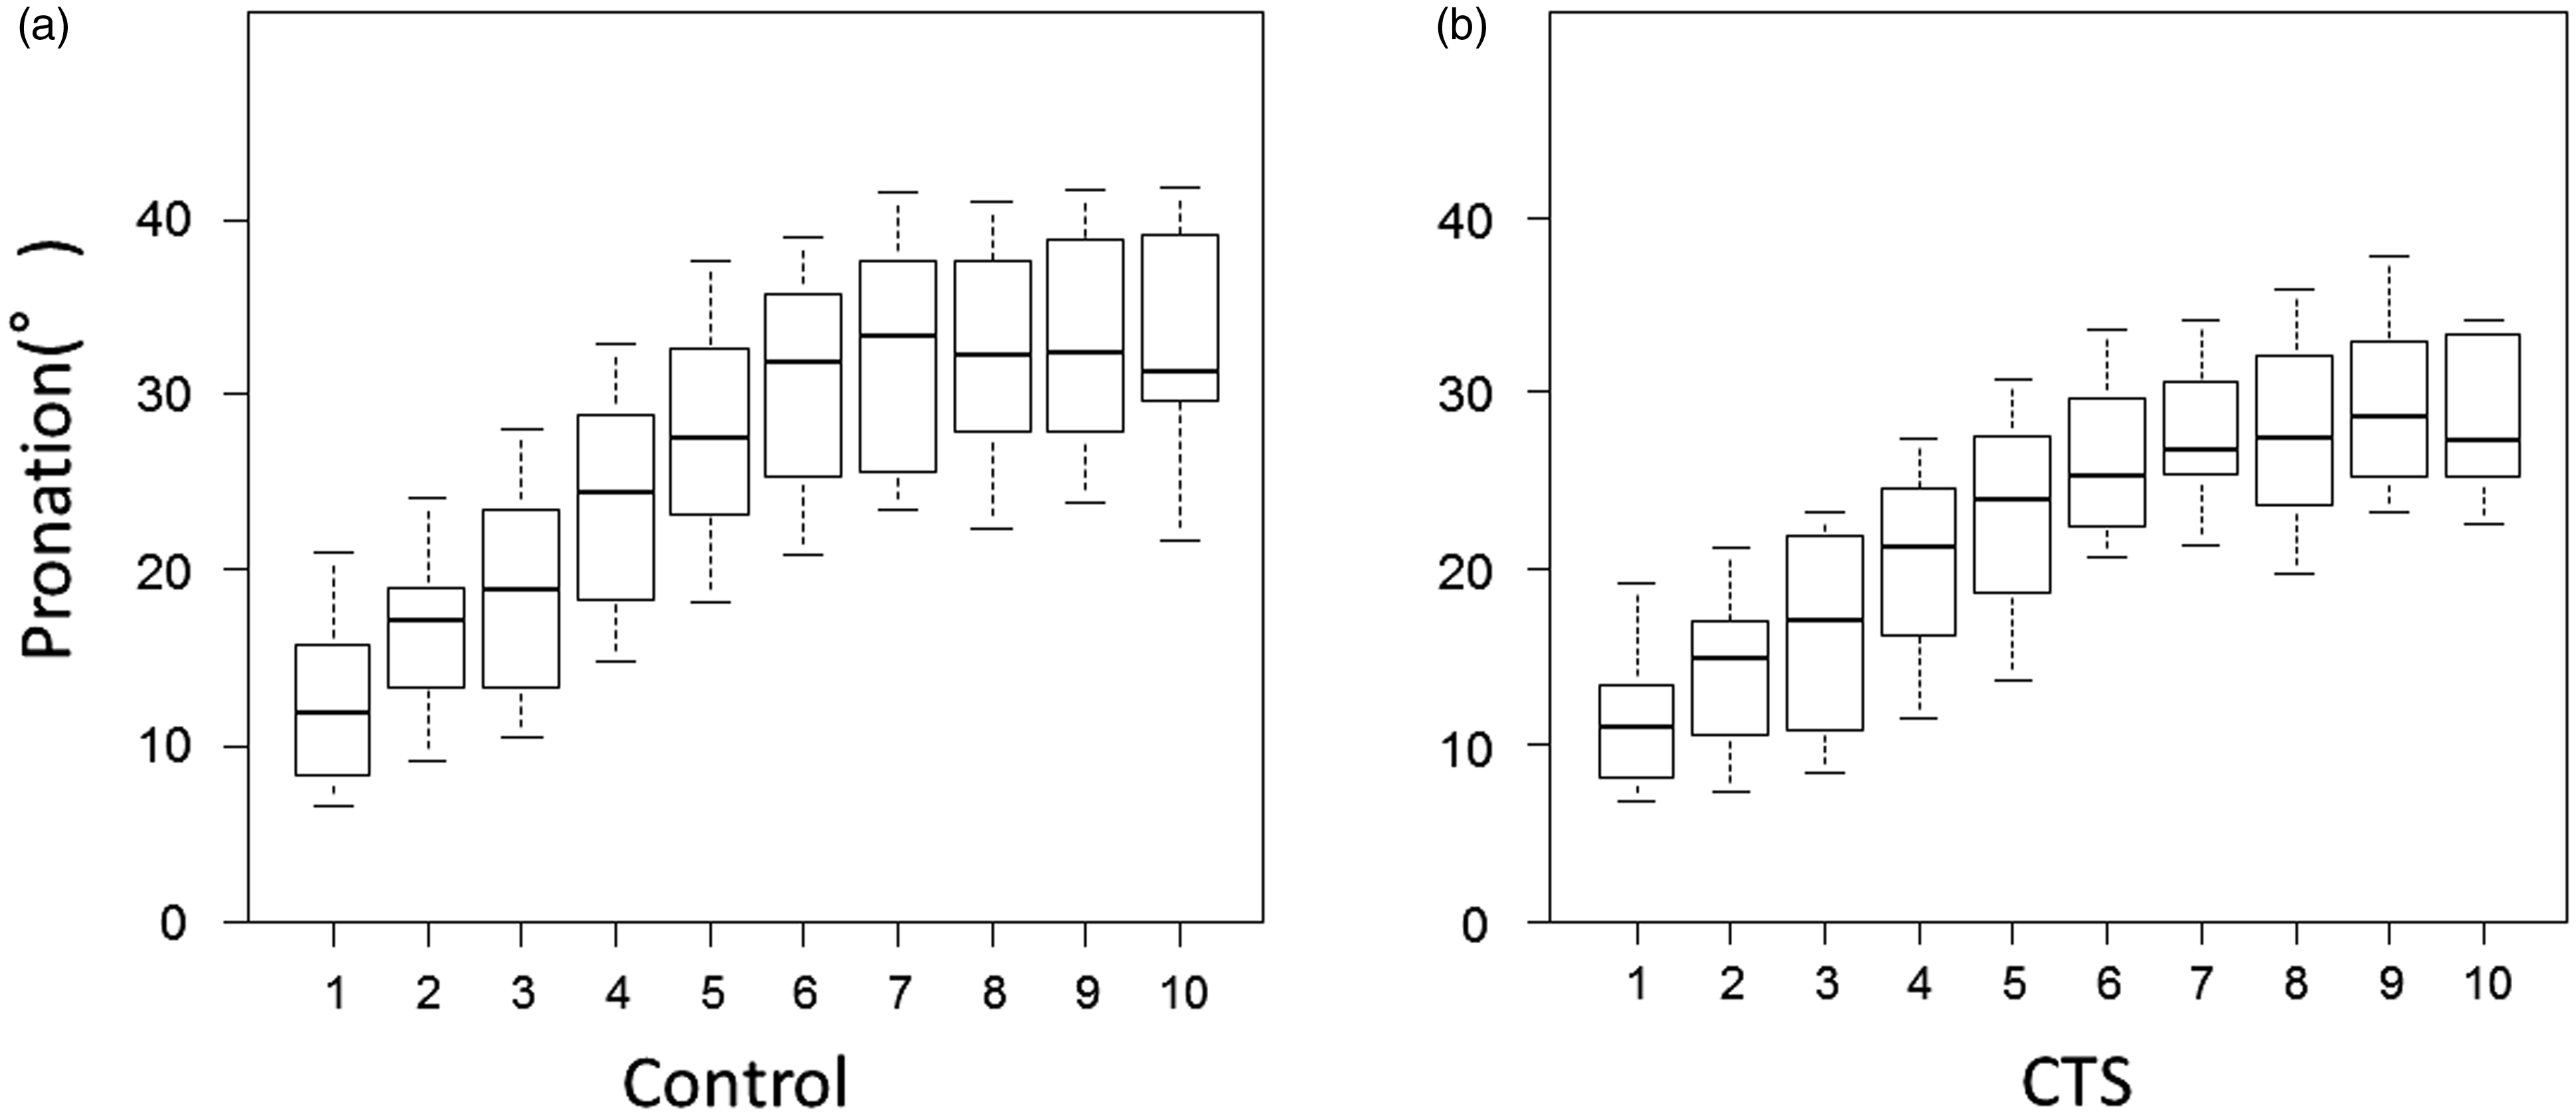
Discussion
There was no significant difference between the Kapandji scores of the two groups. Most hands did not show a maximum pronation angle at the position of the maximum Kapandji score, and the graphs of median pronation and palmar abduction angles reached a plateau from about position 6 of the Kapandji score.
Previous reports have compared reliability between the Kapandji score and a goniometer (Jha et al., 2015) and the reliability and validity of a modified Kapandji score using correlation with a score of hand function (Kroon et al., 2018; Lefevre-Colau et al., 2003). However, it is difficult to measure the pronation angle of the thumb since it moves in three dimensions. Therefore, there have been no reports of pronation angles at each position of the Kapandji score.
In this study, the CTS group included patients with moderate or more severe CTS with thenar atrophy; nevertheless, there was no significant difference between the Kapandji scores in the two groups. Previous reports have shown similar results (Barakat et al., 2013; Dilokhuttakarn et al., 2017). It is plausible that this discrepancy was caused by a strong ceiling effect in the Kapandji score. Our measurements were able to demonstrate this ceiling effect numerically, in that the pronation and palmar abduction angles reached a plateau. It could be clinically plausible that any increase in the Kapandji score, from around 6 to 10, is mainly from flexion of the thumb MP and interphalangeal (IP) joints. As 28 out of 53 hands did not show a maximum pronation angle at the position of the maximum Kapandji score, this means that the Kapandji score is not an interval scale but not also even an ordinal scale because in some participants the angle decreased whilst the score was increasing.
The findings of this study revealed that the Kapandji score reflects the pronation and palmar abduction angles up to a score of 6, but not in a score of 7 or more. This suggests that the Kapandji score should only be applied to the assessment of thumb pronation in patients with severe impairment of opposition and should not be used to express the percentage of improvement, as the relationship between the increase in pronation angle at each position and the Kapandji score is non-linear.
There are certain limitations to this study. There is a possibility that stretching of the skin affected the results. However, although this effect might have reduced the increase in measured angles, it should not have reduced the angle sizes themselves. The angles of the distal and proximal phalanxes were not measured so there were no data for the flexion angles of the MP and IP joints. Finally, the study included eight participants in the control group who used a cane for walking; the mechanical effect of a cane on the first web might have affected the results.
Footnotes
Declaration of conflicting interests
The authors declared no potential conflicts of interest with respect to the research, authorship, and/or publication of this article.
Ethical approval
This study was a prospective case-control study approved by the institutional review board of Tokyo Medical and Dental University. All participants provided written informed consent.
Funding
The authors disclosed receipt of the following financial support for the research, authorship, and/or publication of this article: This work was supported by the Hitachi, Ltd.; and JST AIP-PRISM (grant number JPMJCR18Y2).