
Abstract
The force perpendicular to a limb is often measured for muscle strength assessment. However, muscles act in three-dimensional (3D) space, exerting a 3D force and moment. The validity of hip adductor and extensor strength measured from the perpendicular force versus 3D forces were compared. Ten participants performed hip adductor and extensor strength tests on two visits, with 5–7 days between visits. Limb orientations were determined from 3D motion capture and reaction forces exerted against the thigh using a multi-axis force platform. 3D hip net joint moments (NJM) were calculated using an inverse statics rigid body model. Hip adductor and extensor strength were also calculated using a planar assumption from the force vector perpendicular to the thigh’s long axis, with and without gravity correction. Planar hip adductor and extensor strength without gravity correction were greater than with gravity correction and from the 3D NJM (p < 0.001; Cohen’s d = 0.84–1.62). Gravity corrected planar hip adductor strength was not different than the hip adductor NJM (p = 0.032; d = 0.04), but gravity corrected planar hip extensor strength was less than the hip extensor NJM (p = 0.002; d = 0.10). This effect size difference was small; however, it indicates that measurement error may be present when ignoring the non-perpendicular forces during strength testing. The presence of 3D forces, and their influence on muscle strength measurement should be considered for different muscles, joints, and limb orientations.
Keywords
Introduction
Hip muscle strength may be associated with performance and injury risk.1–3 Traditionally, two approaches have been employed to measure hip muscle strength, isokinetic and handheld dynamometers.4–7 Isokinetic dynamometers employ torque sensors to measure the moment of force, in a single plane, exerted by an individual. In contrast handheld dynamometers involve a single-axis load cell that is aligned perpendicular to the limb to measure the force exerted. 8 The moment may be calculated measuring the moment arm and multiplying by the moment arm and the measured force. The positioning of the handheld dynamometer assumes that only a force perpendicular to the limb is generated by the muscles contracting. However, Arampatzis et al., who employed isokinetic dynamometers, do not make this assumption, showing the applied force may not be perpendicular to the limb in their free body diagrams.9,10
A muscle may exert forces parallel or perpendicular to a limb’s long axis, depending on the muscle’s origin and insertion, and the joint angle. These factors may result in forces at the limb-dynamometer interface that are parallel or perpendicular to the limb’s long axis.9,10 The presence of forces parallel to the limb’s long axis may threaten the validity of handheld dynamometry. The feasibility of utilizing handheld dynamometers due to their small size and relatively low cost, has made them popular for measuring hip muscle strength.4,5,11–13 Thus, it is prudent to evaluate whether their measurements are valid.
Recognizing that forces may be exerted along multiple vectors during strength testing, specialized dynamometers have been constructed for isolated muscle strength measurement.14–16 The most common sensors capable of measuring forces along multiple vectors used in biomechanics laboratories are multi-axis force platforms. Typically, force platforms are used to measure foot reaction forces, such as during squatting or jumping.17,18 However, force platforms have also been used to measure thigh reaction forces during sit-to-stand, 19 and hand reaction forces during dynamic arm-impact loading exercise. 20 Despite their ubiquity in biomechanics laboratories, there are few reports of using multi-axis force platforms for isolated muscle strength measurement. 17 As multi-axis force platforms measure three-dimensional (3D) forces, they may be used to measure the 3D forces exerted during single-joint isometric strength testing. 17 Moreover, in conjunction with 3D motion capture, the force vector perpendicular to the limb can be determined from the 3D force. Therefore, the validity of the perpendicular force vector approach to muscle strength testing that underlies the use of single-axis force sensors may be examined. The primary purpose of this research was to compare maximum hip adductor and extensor strength testing using 3D forces versus the force exerted perpendicular to the thigh segment. It was hypothesized that moments from the perpendicular force alone would be less than those from 3D forces.
Methods
Study design
This research employed a test-retest design with comparison between three methods of assessing isometric hip adductor and extensor strength. Method 1 involved calculating the net joint moments (NJM) from 3D motion capture and force platform recordings (3D-NJM). Method 2 calculated the planar moment from the support reaction force (SRF) vector applied perpendicular to the thigh’s long axis (PLANAR). As PLANAR does not account for the mass of the lower extremity, Method 3 applied gravity correction (PLANAR-GC). The test–retest design was used to assess measurement reliability.
Participants
A convenience sample was recruited using posters on the university campus. Ten physically active individuals (five women and five men) provided written informed consent. The study protocol was approved by the University of Alberta Research Ethics Board (Pro00150741). Participants visited the lab twice, with 5–7 days between visits. While isometric muscle strength recovers in 48 h, 21 visits were approximately 1 week apart to accommodate participants’ schedules. Participants were 23.9 ± 7.8 years old, 1.75 ± 0.10 m tall, and 83.0 ± 23.0 kg body mass. Body mass was measured using a digital weighing scale calibrated using certified weights.
Procedures
Hip strength testing was performed on the right lower extremity. For hip adductor testing, participants lay on their left side with their left hip and knee flexed to 90° (Figure 1). A support structure consisting of a half foam roller mounted on a yoga block was used as an interface between the participant’s thigh and the force platform. The right thigh was placed on the half foam roller proximal to the medial femoral epicondyle. Participants were aligned so that their left and right anterior superior iliac spines were in the same vertical plane. An investigator pressed down on the right iliac crest to fixate the participant. Two investigators were responsible for this task; however, the same investigator performed this task for both visits of a single participant.
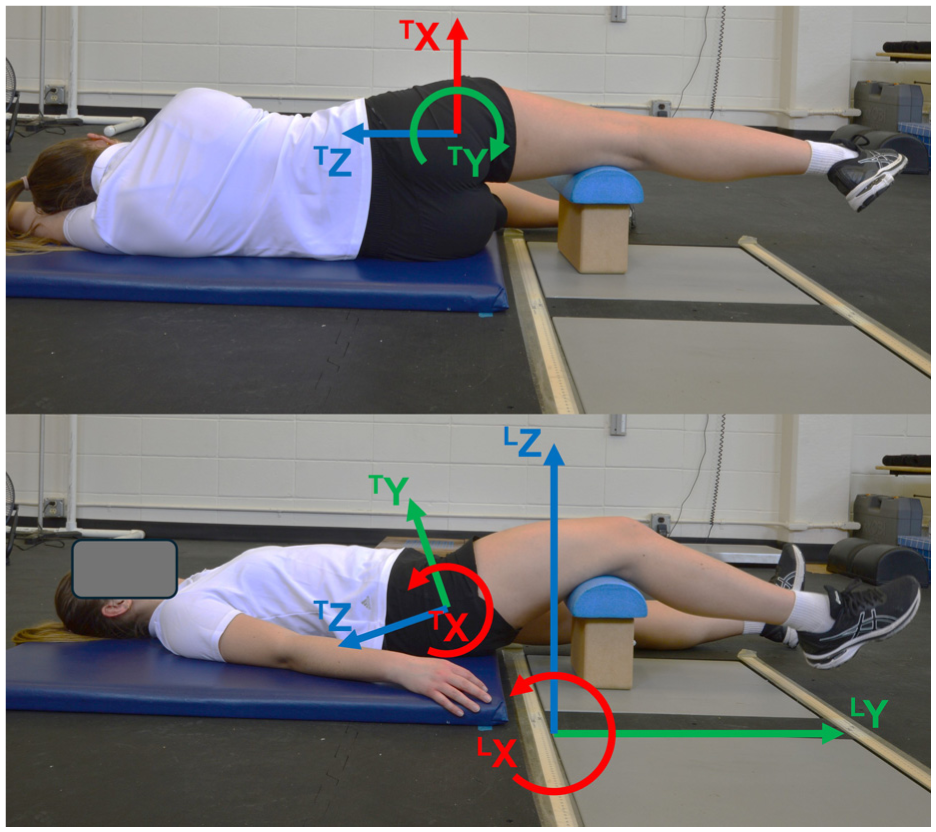
Participant positioning for hip adductor (top) and extensor (bottom) strength testing, illustrating the laboratory (LX, LY, LZ) and right thigh (TX, TY, TZ) coordinate systems.
For hip extensor testing, participants lay supine with their left lower extremity extended (Figure 1). The right thigh was placed on the support structure just proximal to the femoral condyles. Participants were aligned so that a line through the left and right anterior superior iliac spines was parallel to the laboratory X-axis. An investigator pressed down on the right anterior superior iliac spine to fixate the participant. Two investigators were responsible for this task; however, the same investigator performed this task for both visits of a single participant.
Warm-up contractions at 50% and 75% effort were performed, followed by three maximal contractions with loud verbal encouragement. Thirty to sixty seconds rest was provided between contractions. These rest intervals are consistent with previous research examining hip muscle strength.5,7,12,22,23 As at least one hip adductor muscle also acts a hip extensor, 24 the order of performing hip adductor and extensor tests could affect results. Although this effect of order was not expected due to the low number of contractions performed, the order of adductor and extensor testing was alternated between participants.
Retroreflective markers were placed on the anterior and posterior superior iliac spines, bilaterally; as well as the right greater trochanter, medial and lateral femoral condyles and malleoli, and first and fifth metatarsal heads. Clusters of five markers were placed on the right thigh and leg, and three markers on the right foot. Three markers were also placed on the yoga block. Markers were recorded at 100 Hz using eight Miqus M3 optoelectronic cameras (Qualisys; Gothenburg, Sweden). Force data were recorded at 1000 Hz from an OR6-6 force platform (AMTI; Watertown, MA, USA) using a USB-1608G analog-to-digital board (Digilent; Austin, TX, USA). Marker and force data were collected simultaneously using Qualisys Track Manager (2021.1 build 6470, Qualisys; Gothenburg, Sweden).
Data processing
Rigid body modeling was performed in Visual 3D (v2020.03.26, C-Motion; Germantown, MD, USA) to define the right thigh, leg, and foot as conical frustra. The pelvis and hip joint center were defined using the CODA model. 25 Marker and force platform data were filtered using a fourth order recursive Butterworth with a 6 Hz cut-off frequency. Segment proximal end, distal end, and mass center locations, segment rotation matrices, filtered support stand marker data, and filtered force platform data were exported to Matlab (R2022b, Mathworks; Natick, MA, USA). Force platform data were resampled from 1000 Hz to 100 Hz.
When an object is placed between an individual and the force platform, the center of pressure (COP) between the individual and object needs to be calculated. For a flat surface parallel to the top surface of the force platform, equations of static equilibrium may be applied. 26 These equations essentially project the force vector through the height difference between the two parallel surfaces. However, for a cylindrical surface, the height difference is variable, depending on where the interaction point is located.
Point


Equation (2) can be expressed in Cartesian notation using the length of the line (


Equations (4 and 5) are substituted into equation (6).

The center of the top surface of the yoga block was known in relation to the three markers on the yoga block (Figure 2). A cylinder with 7.46 cm radius (
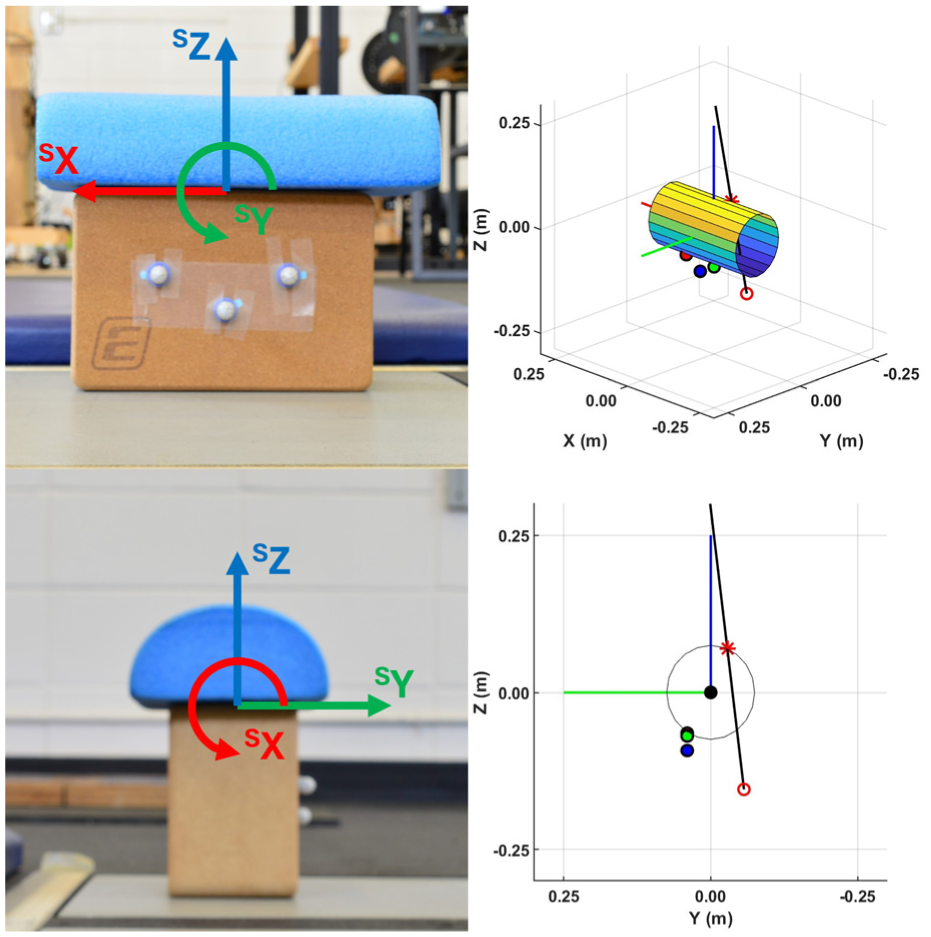
Support stand and illustrations of locating the center of pressure on the support stand. Red, green, and blue lines indicate the positive SX-, SY-, and SZ-axes in the support stand’s coordinate system, respectively, with the origin located at the top center of the yoga block (black circle). The black line is a parameterized line along the force vector from
An inverse statics approach, including the right foot, leg, and thigh, with the SRF applied to the thigh was used to calculate the hip NJM. The hip NJM was transformed into the right thigh’s local coordinate system. For the 3D-NJM hip adductor and extensor strength measurements, the frontal and sagittal plane NJM, respectively, were used.
To calculate the PLANAR strength measurements, SRF and COP location were transformed into the right thigh’s coordinate system with the hip joint center as the origin. The moments for the SRF (
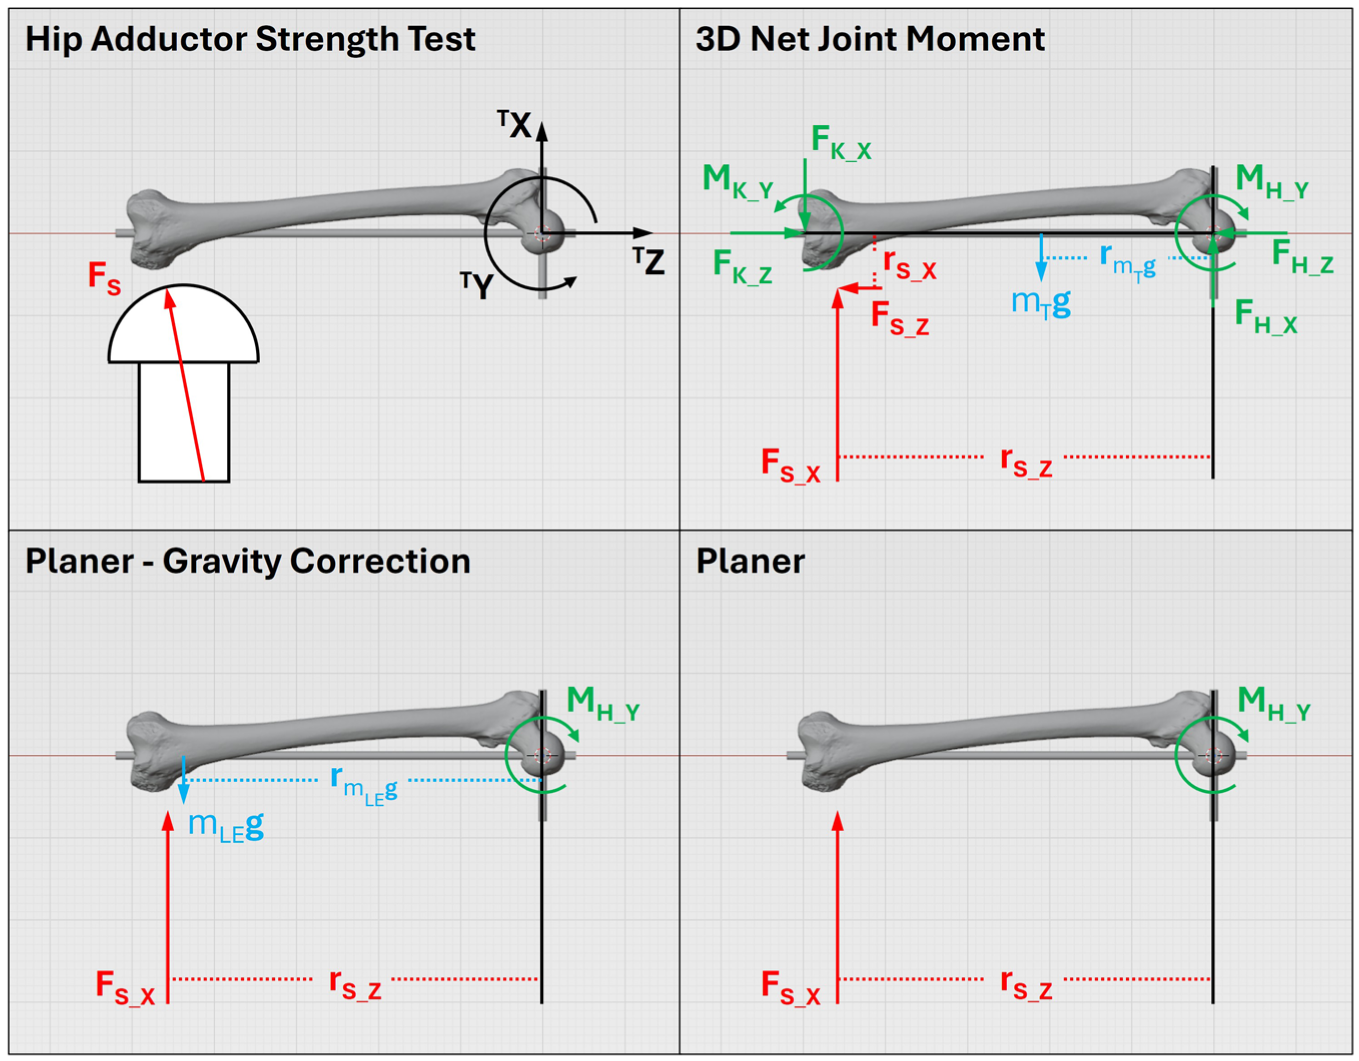
Free-body diagrams illustrating the calculation of hip adductor strength using an inverse statics approach (3D net joint moment) and using only the force perpendicular to the thigh’s longitudinal axis (planar) with and without gravity correction. Forces, moment arms, and moments are shown in the thigh’s local coordinate system (TX, TY, TZ). FK_X, FK_Z, MK_Y– forces and moments at the knee joint (distal thigh); FH_X, FH_Z, MH_Y– forces and moments at the hip joint (proximal thigh); FS– resultant support reaction force; FS_X, FS_Z– support reaction forces and rS_X, rS_Z– their moment arms; mTg, mLEg – weights of the thigh and lower extremity, respectively, and rmTg, rmLEg– and their moment arms.
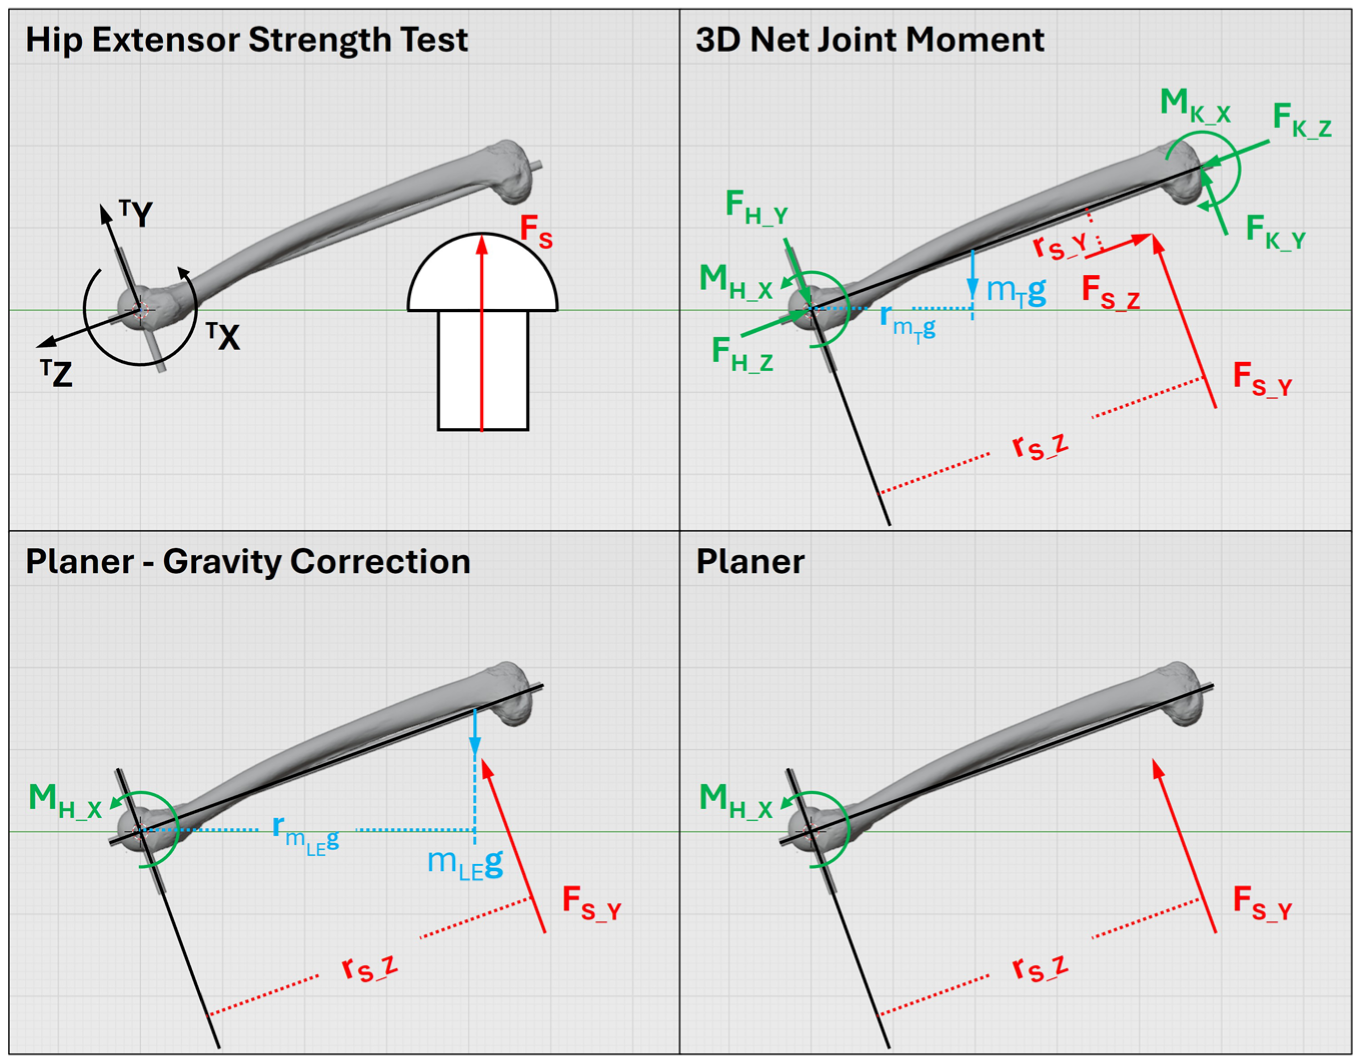
Free-body diagrams illustrating the calculation of hip extensor strength using an inverse statics approach (3D net joint moment) and using only the force perpendicular to the thigh’s longitudinal axis (planar) with and without gravity correction. Forces, moment arms, and moments are shown in the thigh’s local coordinate system (TX, TY, TZ). FK_Y, FK_Z, MK_X– forces and moments at the knee joint (distal thigh); FH_Y, FH_Z, MH_X– forces and moments at the hip joint (proximal thigh); FS– resultant support reaction force; FS_Y, FS_Z– support reaction forces and rS_Y, rS_Z– their moment arms; mTg, mLEg – weights of the thigh and lower extremity, respectively, and rmTg, rmLEg– and their moment arms.
The time of peak hip adductor or extensor NJM for adductor and extensor trials, respectively, was determined. Hip adductor and extensor strength were extracted at this timepoint for all three methods. Data from the trial with the highest hip adductor NJM from the adductor trials and highest hip extensor NJM from the extensor trials were used for further analysis.
Statistical analyses
Test–retest reliability was assessed using two-way random, absolute agreement, average measure intraclass correlations (ICC), standard error of measurement (SEM), and percentage SEM. Acceptable reliability was established as ICC ≥ 0.80. 23 The normality of hip adductor and extensor strength measures was assessed using Shapiro–Wilks tests. To compare hip adductor and extensor strength between the three methods, two-way repeated measures ANOVA (approach by visit) were computed. Paired t-tests were used for post hoc comparisons, with Bonferroni correction (αt-test = 0.05/3 = 0.017). Partial eta-squared (ηP2) and Cohen’s d were calculated for effect size measures for ANOVA and post hoc comparisons, respectively. Statistical procedures were conducted in R (version 4.3.2) in RStudio (version 2023.09.1 + 494, Posit Software; Boston, MA, USA).
Results
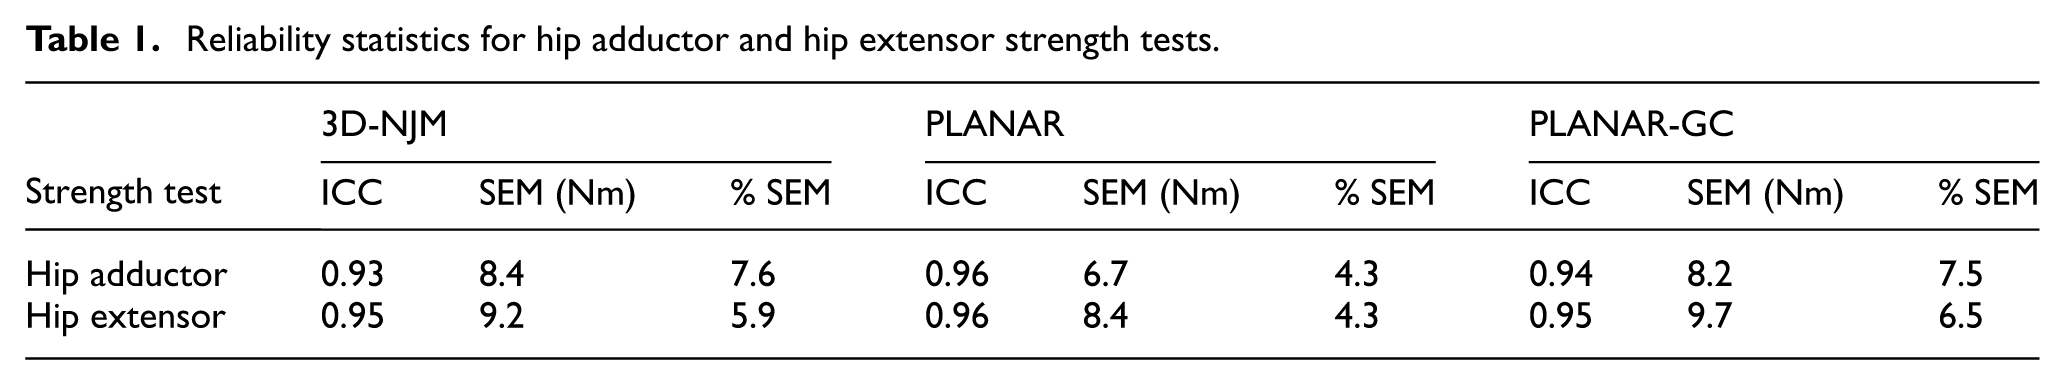
Hip adductor strength, calculated from all three methods, were reliable (Table 1). Hip extensor strength also demonstrated reliability for all three methods.
Reliability statistics for hip adductor and hip extensor strength tests.
Hip adductor strength measures followed a normal distribution (p > 0.605). There was a significant main effect for method for hip adductor strength measures (p < 0.001; ηP2 = 0.93) (Table 2). Post hoc analyses indicated hip adductor strength from PLANAR was greater than 3D-NJM (p < 0.001; 95% CI = [35 N m–55 N m]; d = 1.59) and PLANAR-GC (p < 0.002; 95% CI [37 N m–56 N m]; d = 1.62). 3D-NJM and PLANAR-GC moments were not different from each other (p = 0.032; 95% CI [0 N m–2 N m]; d = 0.04).
Maximum hip adductor and hip extensor strength (mean ± SD).
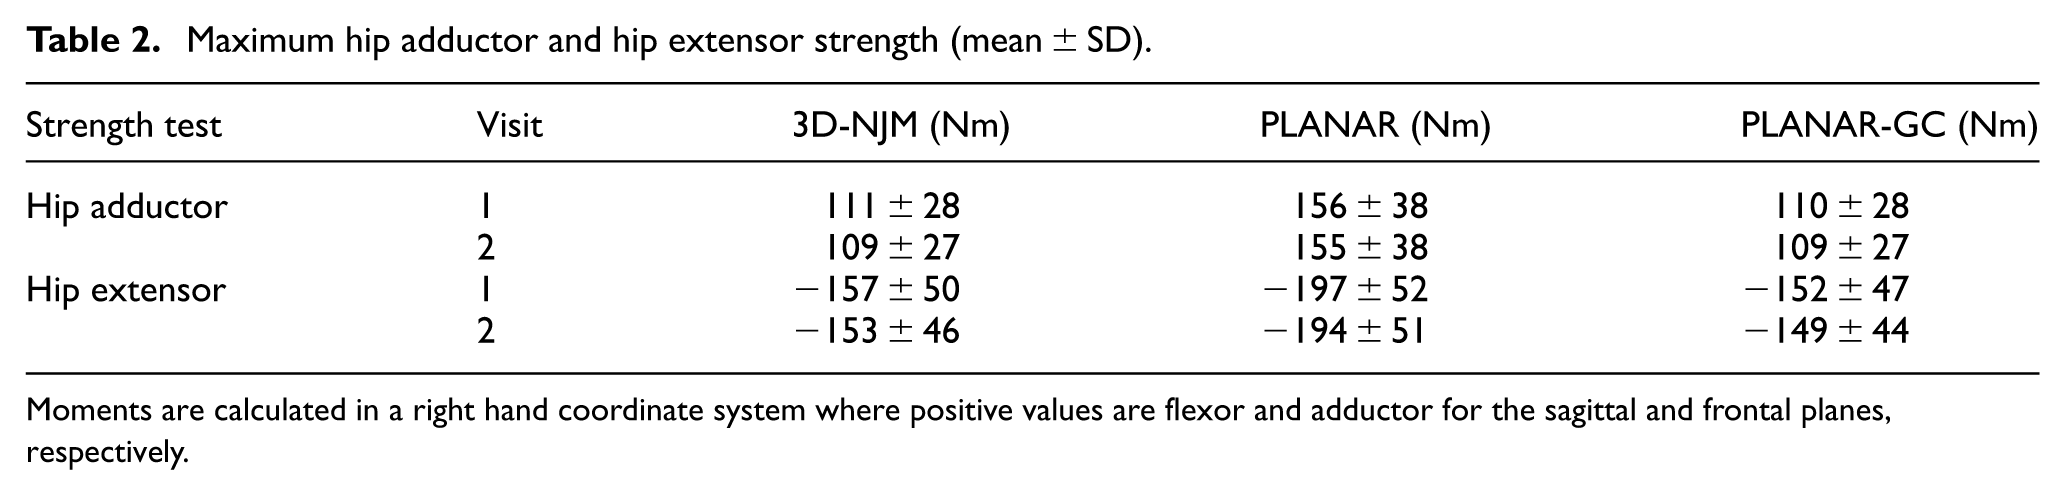
Moments are calculated in a right hand coordinate system where positive values are flexor and adductor for the sagittal and frontal planes, respectively.
Hip extensor strength measures followed a normal distribution (p > 0.585). The main effect for method for hip extensor strength measures was significant (p < 0.001; ηP2 = 0.93). Hip extensor strength from PLANAR was larger than both 3D-NJM (p < 0.001; 95% CI [31 N m–49 N m]; d = 0.84) and PLANAR-GC (p < 0.001; 95% CI [36 N m–54 N m]; d = 0.96). Hip extensor strength from 3D-NJM was greater than from PLANAR-GC (p = 0.002; 95% CI [2 N m–7 N m]; d = 0.10).
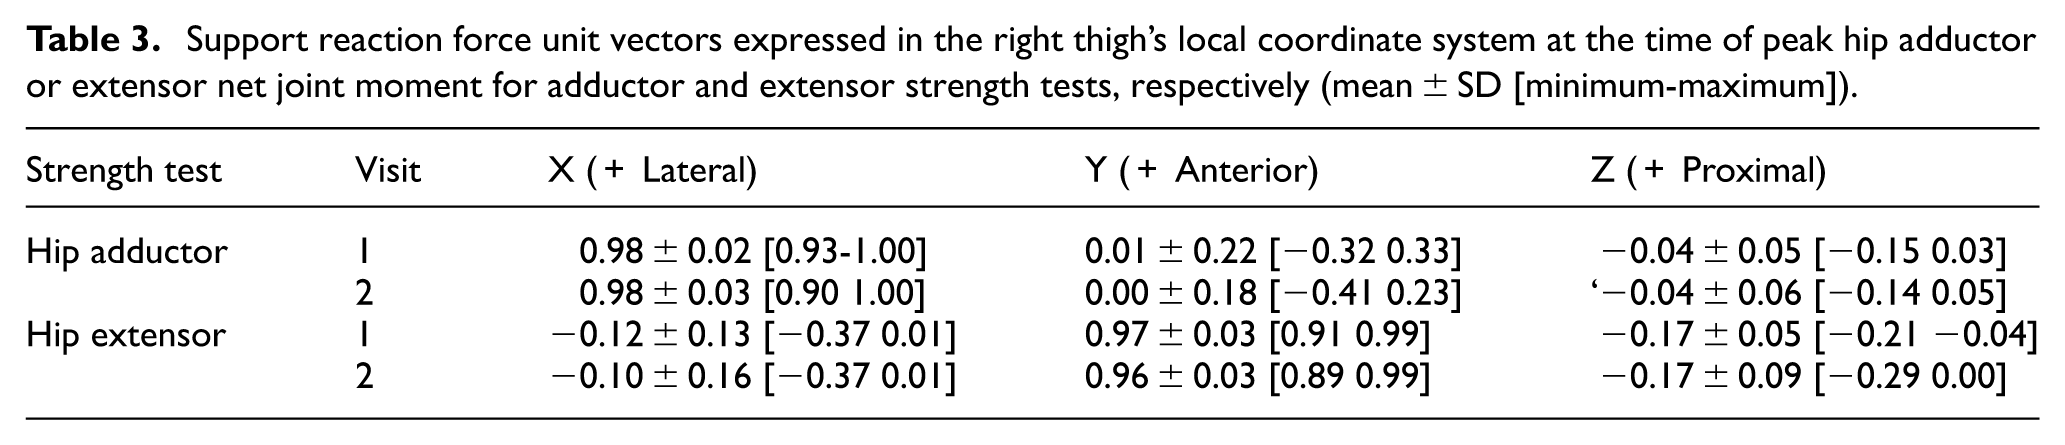
For reference, unit vectors for the support reaction force during hip adductor and extensor strength tests are provided in Table 3.
Support reaction force unit vectors expressed in the right thigh’s local coordinate system at the time of peak hip adductor or extensor net joint moment for adductor and extensor strength tests, respectively (mean ± SD [minimum-maximum]).
Discussion
Hip adductor and extensor strength testing were performed comparing 3D and planar measurements. For both hip adductor and extensor strength tests, PLANAR moments were substantially larger than 3D-NJM. This difference was a result of PLANAR not accounting for the moment exerted by the weight of the lower extremity, as PLANAR-GC and 3D-NJM had no difference for hip adductor strength and a small difference for hip extensor strength. Gravity correction is particularly important for hip versus knee or ankle strength testing, due to the combined mass of the foot, shank, and thigh. The mass for one lower extremity, estimated from Dempster’s data as 16.1% of total body mass and acting at 44.7% of the distance from the hip to the ankle, 27 exerts a large moment and highlights the necessity of gravity correction. However, several recent investigations of hip muscle strength have ignored this moment and its effect on strength measurement.4,6,11,22 When the limb is placed on top of the force sensor, as in this investigation, ignoring gravity correction will result in overestimation of muscle strength. Although not used in this investigation, the limb may be placed beneath the force sensor, in which case, ignoring gravity correction will underestimate muscle strength. In either scenario, gravity correction could be performed by placing the force sensor under the limb in a resting (i.e., no muscle contraction) condition and multiplying this force by the perpendicular distance of the force sensor to the joint. Hip muscle strength has been associated with injury risk and performance,13,28 thus, it is important to factor in gravity correction in positions where the lower extremity weight exerts force on the force sensor or is lifted against gravity.
In the hip adductor strength test, no difference was found for 3D-NJM and PLANAR-GC. A small difference was present between 3D-NJM and PLANAR-GC for the hip extensor strength test. This difference was smaller than the SEM established from the reliability assessment, therefore, this difference is not likely meaningful. The lack of or minimal differences may validate the planar measurement of hip adductor and extensor strength, using a single-axis load cell placed perpendicular to the thigh. However, the presence of a difference between 3D-NJM and PLANAR-GC for hip extensor strength demonstrates that forces exerted by muscles on the thigh elicit a 3D force vector at the point of measurement. Thus, measurement error occurs when ignoring the non-perpendicular force vectors.
As the difference between 3D-NJM and PLANAR-GC was greater for hip extensor than hip adductor tests, the magnitude of this error is likely task dependent and may also be limb position dependent. When muscles contract the direction of the forces they exert are dependent on their origin, insertion, and joint angle. Thus, the force measured from the limb is not restricted to a vector perpendicular to the limb and forces parallel to the limb may also be present. Muscle strength may be measured with different limb orientations and joint angles, such as for ecological validity or to examine the effect of different moment arm lengths and the force-length relation of muscle. 29 Further validation of muscle strength measurement using a single-axis load cell is warranted for other joint angles, as it is not known how much non-perpendicular forces contribute to the muscle’s moment in other configurations. These findings also apply to other muscles and joints; it should not be assumed that strength measures determined from the force perpendicular to the limb are accurate.
A limitation of this investigation is that the use of a support placed on top of a force platform restricted the participants’ positioning for testing. This limitation does not alter the findings, specifically, that 3D force may be exerted against the limb during strength testing. For future use, modifications may be made to facilitate different limb positions. For example, a variable height support would allow for manipulating the hip abduction angle for adductor strength testing, and the hip flexion angle for extensor strength testing. Traditionally, inverse dynamics calculations have been performed for tasks where an individual’s foot is planted on the force platform. The description of locating the COP on the support permits the use of a force platform or other 3D load cell expands the range of tasks where 3D motion capture and inverse dynamics calculations may be applied. For example, Arakawa et al. 30 examined split squats where the rear foot was placed on a semi-cylindrical surface. They assumed that the COP was at the apex or top of the surface, whereas COP could be calculated more accurately. The same math could also be used for concave as opposed to convex (e.g., half foam roller) cylindrical interface surfaces, and only slight modification is required for spherical surfaces.
Conclusion
Hip adductor and extensor muscle strength were determined from the 3D force vector versus the force perpendicular to the thigh. While differences were present between 3D-NJM and PLANAR-GC, these differences were small and likely not meaningful. While this research provides partial validation for the use of single-axis load cells for strength measurement, the errors from ignoring non-perpendicular forces may be greater for other limb orientations, muscles, and joints. Thus, the use of only the force perpendicular to the limb should be specifically validated for the muscles and task of interest. A procedure for locating the COP on a cylindrical support surface is described, allowing cylindrical or spherical objects to be used as an interface surface between a limb and the force platform.
Footnotes
Appendix
Funding
The authors received no financial support for the research, authorship, and/or publication of this article.
Declaration of conflicting interests
The authors declared no potential conflicts of interest with respect to the research, authorship, and/or publication of this article.