
Abstract
This study assessed morphological and genetic diversity in twelve Berberis F2 populations. Seeds were collected from selected F1 hybrids resulting from crosses between Berberis integerrima, B. crataegina, and ‘Zereshk Bidaneh’-a commercial seedless barberry cultivar. Initial evaluations compared seed germination and seedling survival on three substrates: perlite, cocopeat, and peat moss. Germination rates varied widely among F2 populations, ranging from 17% to 95.48%. A 1:1 mixture of cocopeat and perlite significantly enhanced germination. Twelve morphological and vegetative traits were subsequently measured, revealing substantial phenotypic variability across F2 populations. Correlation analyses identified strong positive associations among key traits such as leaf number, plant height, and leaf morphology characters. Factorial analysis indicated that the first two factors explained 35.5% of the total variance, primarily differentiating populations based on leaf pigmentation and leaf-spine architecture. Heatmap clustering grouped the F2 genotypes into six distinct phenotypic clusters. Notably, traits such as leaf margin spine (CV = 33.89%) and leaf pigmentation (CV > 43%) exhibited high coefficients of variation, suggesting the potential for transgressive segregation and providing a wide basis for selection. These findings establish a robust framework for early-stage selection in barberry improvement programs.
Introduction
The genus Berberis (family Berberidaceae) comprises a diverse group of plants, with an estimated 450–500 species distributed worldwide. 1 These species are predominantly diploid (2n = 2x = 28), self-pollination, and include both deciduous and evergreen forms. 2 In Iran, five wild Berberis species are recognized: B. vulgaris, B. orthobotrys, B. khorasanica, B. crataegina, and B. integerrima. 2 Among these, B. crataegina and B. integerrima are particularly notable for their ecological adaptability, thriving in diverse regions beyond Iran.2–4
The genus Berberis holds significant ornamental and medicinal value. While many species are prized in urban landscapes, 5 their economic importance is profoundly linked to human health.6,7 Berberis species are renowned for their high concentration of bioactive isoquinoline alkaloids, primarily located in the roots and stems, with berberine and berbamine being the most prominent due to their potent pharmacological properties. 8 A systematic review of 77 clinical trials has confirmed the wide range of therapeutic applications for berberine and barberry in humans, including lipid-lowering, anti-diabetic, and anticancer effects, without significant side effects. 9 Furthermore, the fruits, characterized by their tart flavor and vibrant pigmentation attributed to anthocyanins, are widely used in culinary applications and as natural preservatives. 10 Given these multifaceted benefits, optimizing cultivation strategies to enhance desirable traits is essential for sustainable production.
Successful seedling establishment is critical not only for commercial cultivation but also for ecological restoration, particularly in protected grazing lands. Research demonstrates that growth media significantly influence early plant development by modulating gas exchange, water retention, and nutrient availability.11,12 Substrates such as perlite, cocopeat, and peat moss have proven effective in promoting seedling survival and vigor, though their efficacy may vary across species and hybrids.
In self-pollinating plants, the F2 generation plays a pivotal role in breeding programs due to its high genetic variability, which arises from the segregation of alleles in heterozygous F1 hybrids. 13 On the other hand, understanding the inheritance patterns and phenotypic diversity in F2 populations provides valuable insights for targeted breeding strategies.
This study had two primary objectives. First, to identify the optimal growth substrate for germination and early seedling establishment in interspecific Berberis hybrids by evaluating three different media. Second, to assess the extent and patterns of morphological diversity in the F2 progeny populations during early seedling growth. Establishing the best cultivation practices is a prerequisite for efficient breeding. Therefore, by first determining the optimal substrate and then leveraging it to characterize the genetic potential of the F2 populations, this research provides a comprehensive framework for the selection and advancement of superior genotypes in barberry breeding programs.
Materials and methods
Plants sources
The parental plants used for the initial interspecific crosses were meticulously selected from the Berberis germplasm collection housed at the Faculty of Agriculture, Shahrood University of Technology, Shahrood, Iran. The collection is located at 36°25′ N, 54°58′ E, and an elevation of 1380 meters above sea level, characterized by a cold and arid climate. From this collection, twelve superior F1 genotypes were selected from interspecific crosses of B. integerrima, B. crataegina, and ‘Zereshk Bidaneh’, 14 and their ripe berries were collected in the fall at commercial maturity. Seeds were extracted from fermented fruits, and thoroughly washed, and any remaining fruit residues were removed. These twelve populations were identified with four-digit codes: ‘0903’, ‘0308’, ‘0525’, ‘0601’, ‘0539’, ‘0534’, ‘0528’, ‘0530’, ‘0516’, ‘0532’, ‘0538’, and ‘0607’. The first two digits of each code indicate the parents, while the last two digits represent the genotype or offspring. The initial digits 03, 05, 06, and 09 correspond to the following parental crosses: ‘R2N1’ ♀ × ‘BD’♂, ‘R4N1’♀ × ‘BD’♂, ‘R5N1’♀ × ‘BD’♂, and ‘R9N3’♀ × ‘BD’♂, respectively. In these codes, BD refers to the seedless barberry cultivar, ‘Zereshk Bidaneh’, ‘R2N1’ and ‘R4N1’ are selected genotypes of B. integerrima, ‘R5N1’ is a selected genotype of B. crataegina, and ‘R9N3’ represents an unknown species of Iranian barberries (Figure 1).
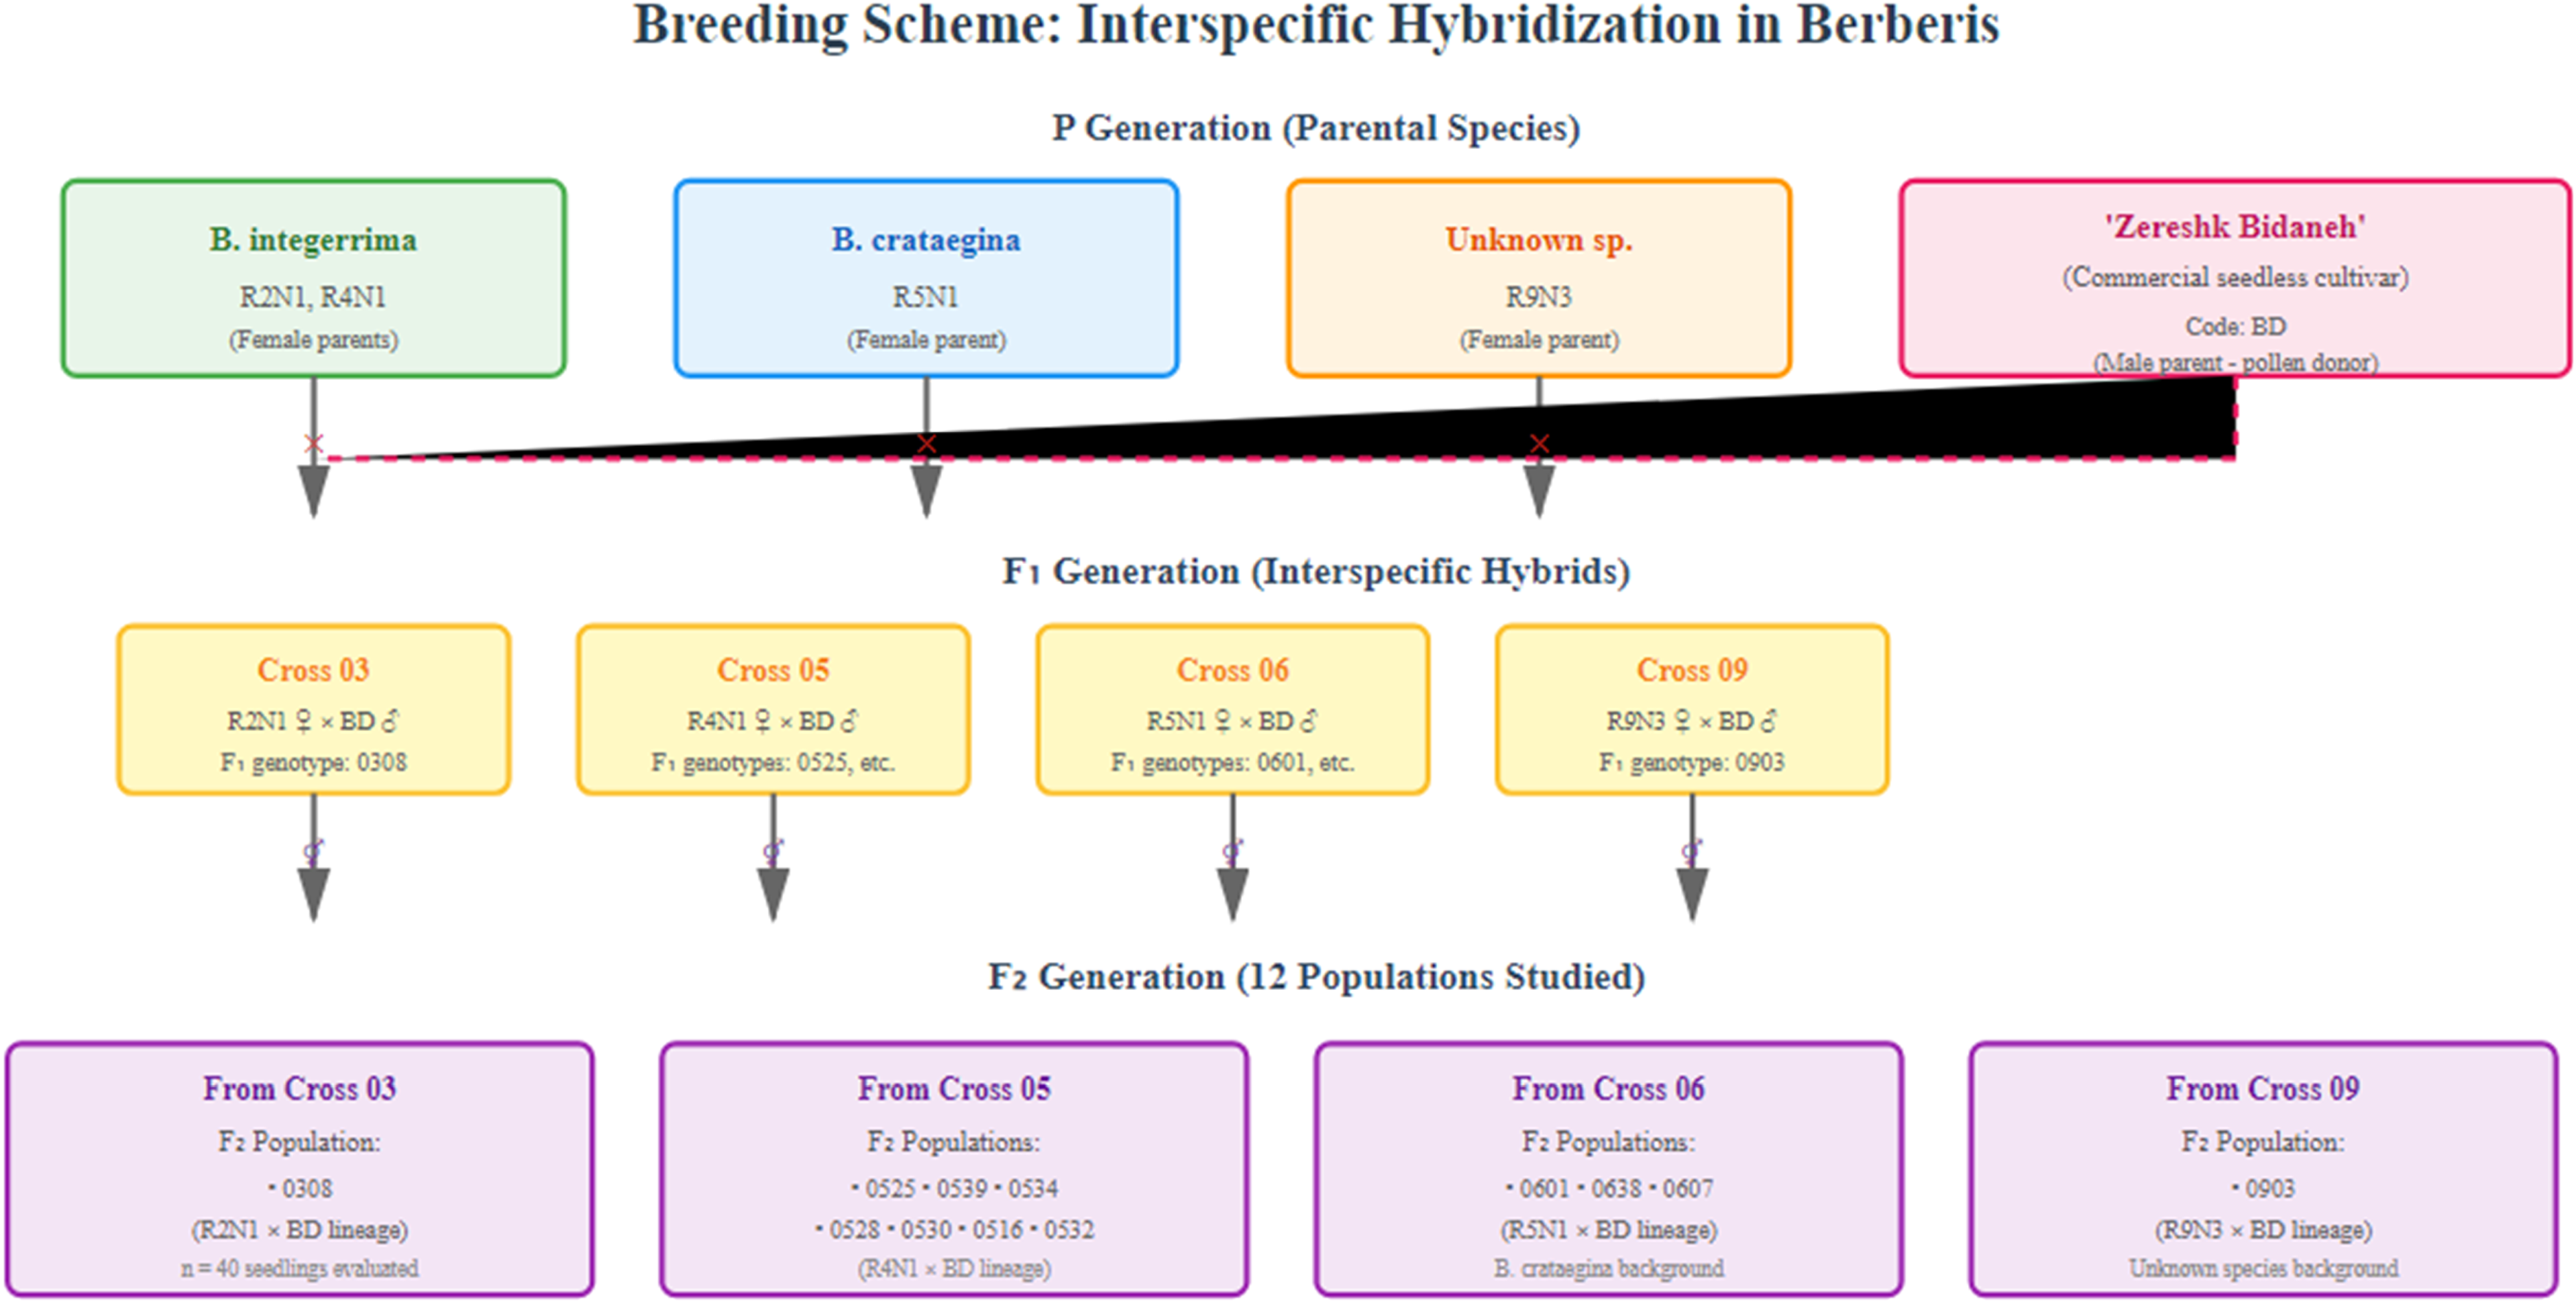
The diagram showing the breeding scheme from Berberis parental species to the F2 populations.
Seedling establishment
Fruit collection and seed extraction were performed in the fall. Mature fruits were identified based on their full coloration, juiciness, and an increase in sugar content. These fruits were harvested from the F1 parent plants. All F1 seeds used in this study were germinated and grown in a common environment to minimize non-genetic variation. The experiment was conducted in a controlled greenhouse at Shahrood University of Technology. Throughout the study period, the greenhouse conditions were maintained as follows: temperature between 25°C and 30°C, a photoperiod of 12–14 h of light, and relative humidity of 60–70%. To develop seedling populations, various common growth substrates were tested for seedling establishment. The germination protocol was initiated with chemical scarification using 99% sulfuric acid (H2SO4) for 10 min (±30 s) to disrupt seed coat dormancy, followed by neutralization with 0.1 N sodium hydroxide and thorough rinsing under running water. The seeds were then cold stratified in moist perlite at 5°C for three months to synchronize germination. 15 After stratification, seeds were planted in seedling trays containing three different substrate mixtures: ½ peat moss + ½ perlite, ½ coco peat + ½ perlite, and ⅓ peat moss + ⅓ coco peat + ⅓ perlite. The experimental design was a factorial arrangement based on a completely randomized design (CRD) with four replications. Each experimental unit (tray) consisted of 100 seeds. Following germination, all seedlings were maintained under the same greenhouse conditions described above until the end of the survival assessment. Germination and seedling survival percentages were calculated as the proportion of germinated seeds and successfully developed seedlings, respectively, relative to the total number of seeds sown in each tray.
Morphological variability
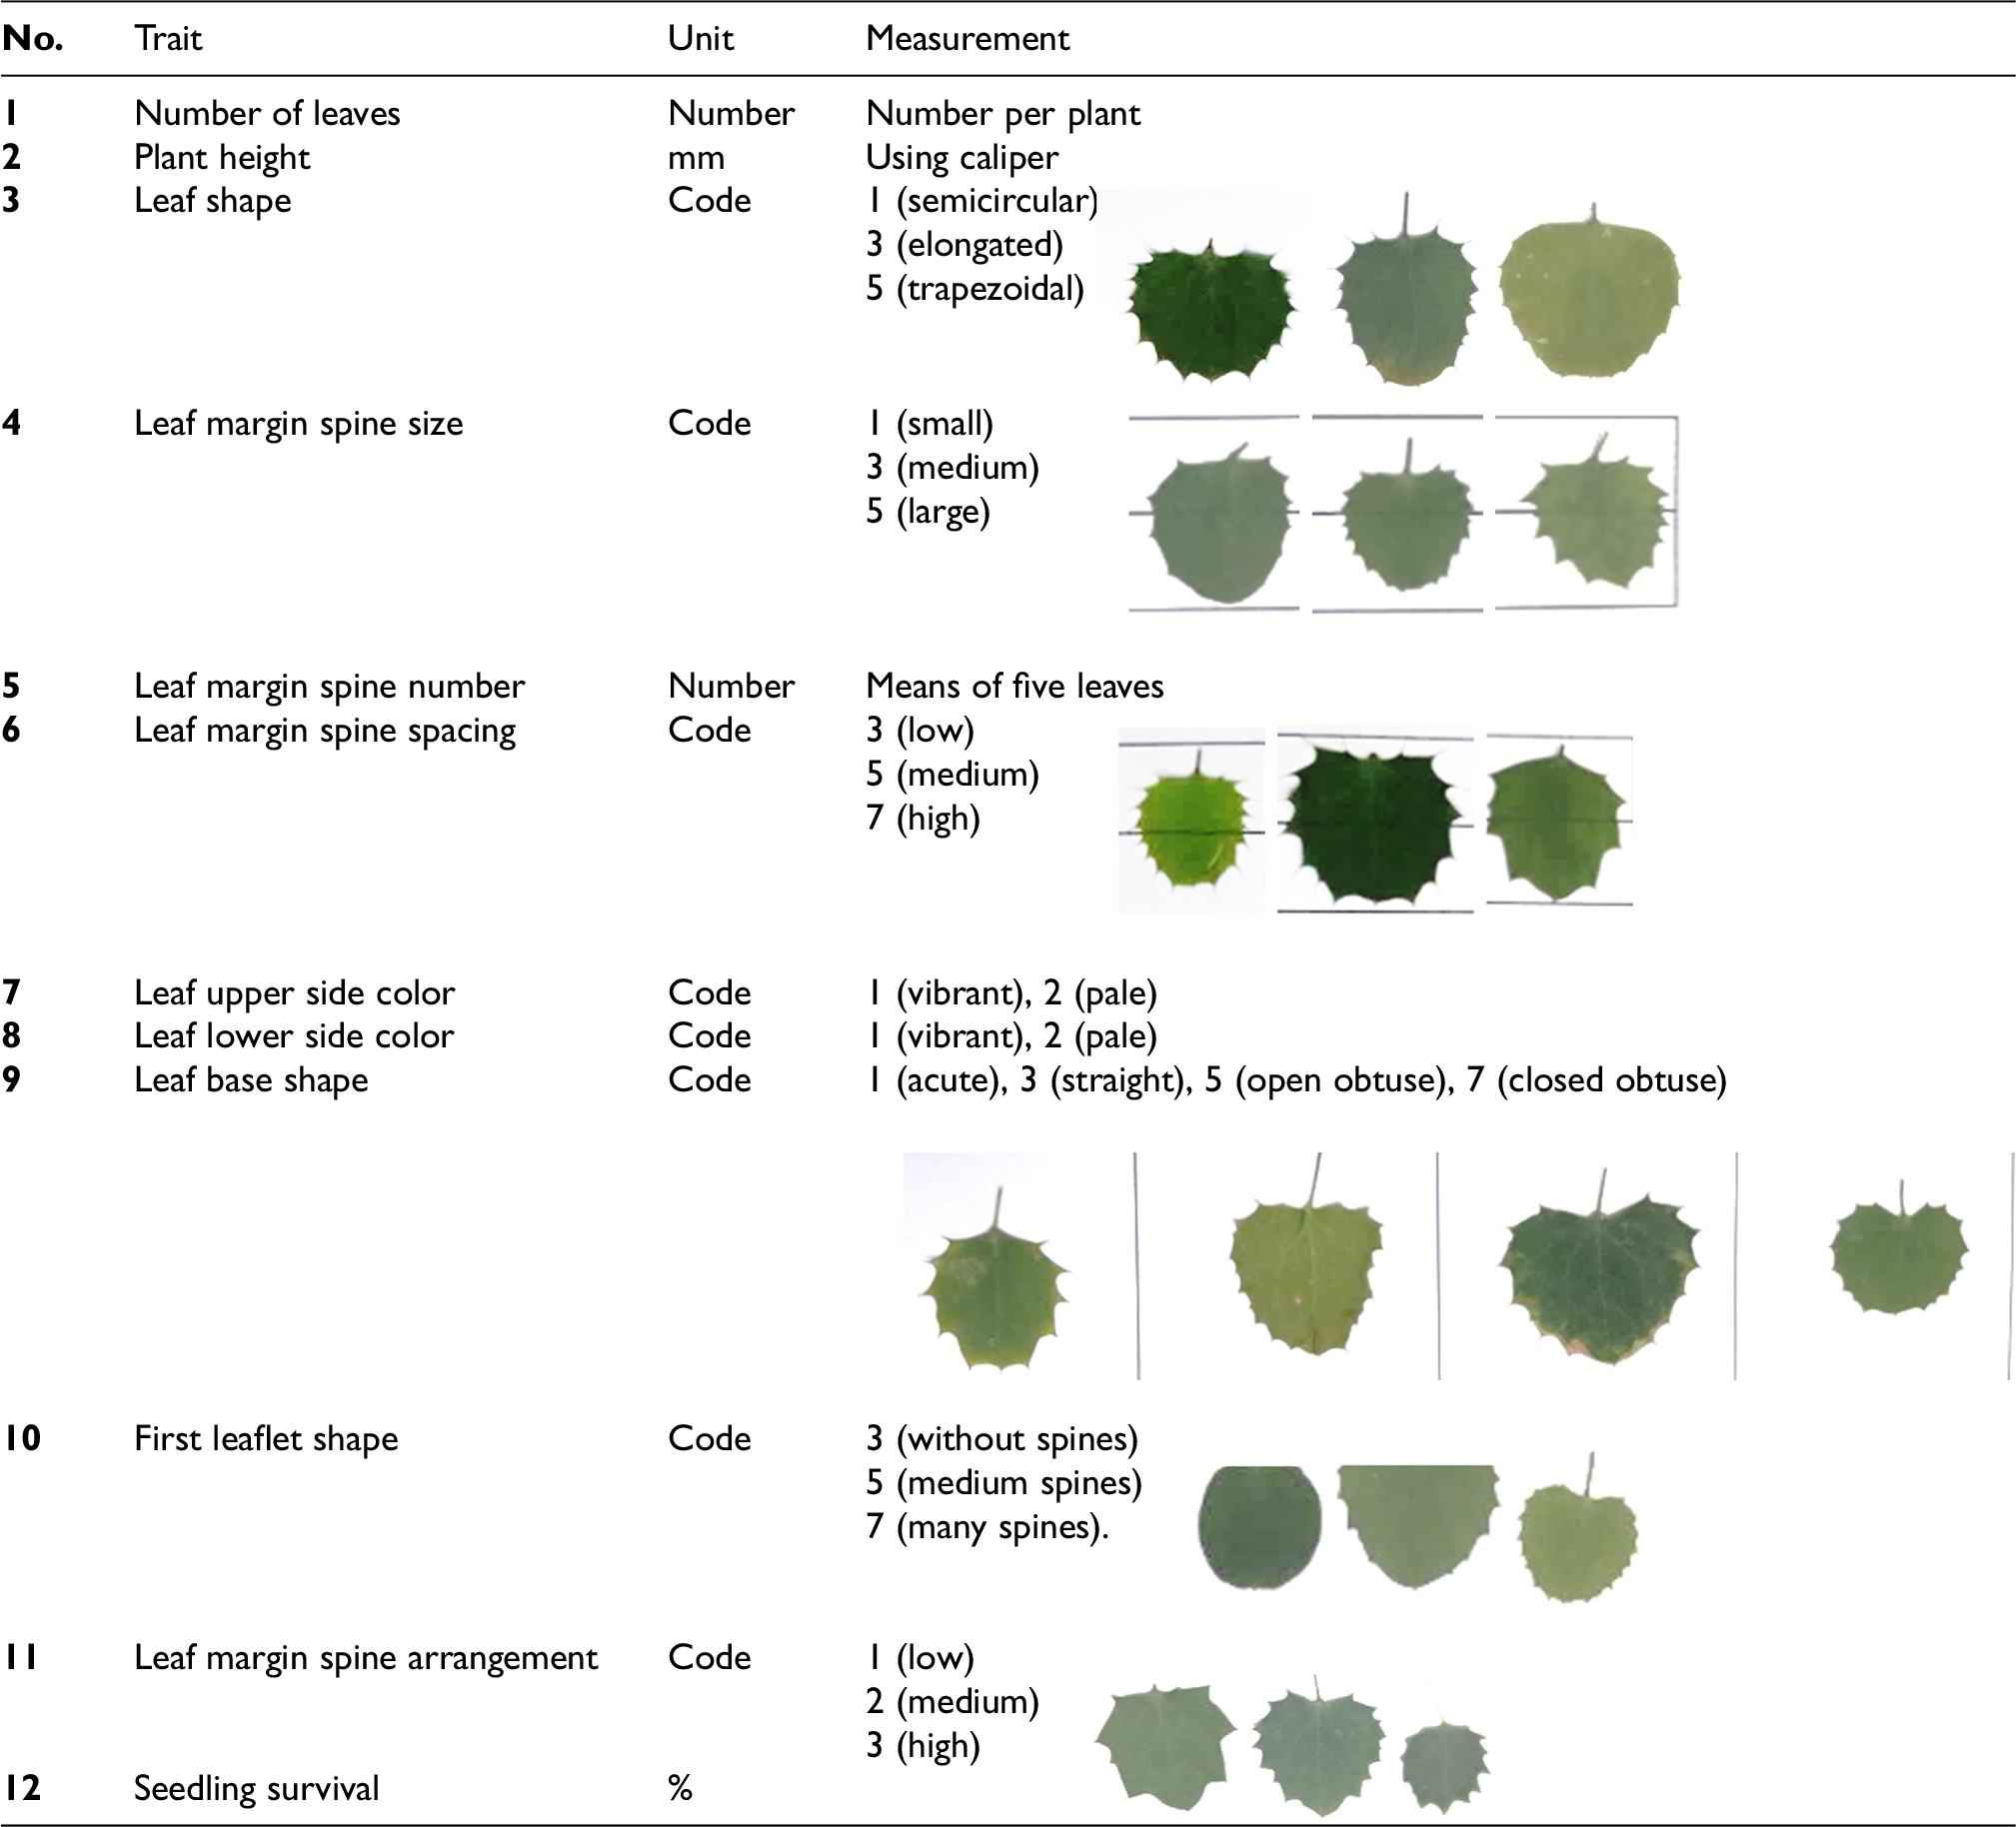
To quantify phenotypic diversity in early seedling development, twelve morphological traits were systematically evaluated across the F2 populations (Table 1). The assessment included both quantitative and qualitative characteristics: number of leaves, plant height, seedling survival rate (quantitative), along with leaf shape, leaf margin spine size, number of margin spines, spacing of margin spines, leaf upper/lower surface color, leaf base shape, shape of first leaflet, and spine arrangement (qualitative). These traits were selected based on UPOV descriptors for Berberis 16 and observable differentiations among seedlings. A total of 40 seedlings per F2 population were randomly selected for morphological evaluation, with no sub-replication, as each seedling was considered an observational unit. All measurements were conducted 40 days after germination.
Morphological traits measured in barberry seedlings after 40 days.
Statistical analysis
The data were analyzed using a factorial experimental design arranged in a completely randomized block design (CRD) with three replications in the seedling establishment test. Multivariate analyses, including factorial analysis, Ward's hierarchical cluster analysis, and heatmap visualization, were performed using SAS JMP 14 software.
Results and discussion
Germination and seedling survival
Analysis of variance (ANOVA) revealed significant effects of population (F11,72 = 135.32, p*** < 0.0001) and growth medium (F2,72 = 3.67, p* = 0.0304) on seed germination. The population × medium interaction was not statistically significant (F22,72=1.65, pns = 0.0589). The population ‘0607’ exhibited exceptional germination performance at 95.48%, which was statistically comparable to several other high-performing populations, including ‘0601’ (92.70%), ‘0539’ (94.44%), ‘0535’ (92.70%), ‘0516’ (92.36%), and ‘0525’ (94.09%) (Figure 2). In contrast, population ‘0903’ showed a markedly reduced germination rate of 17.1%, suggesting a strong genetic influence on germination potential.
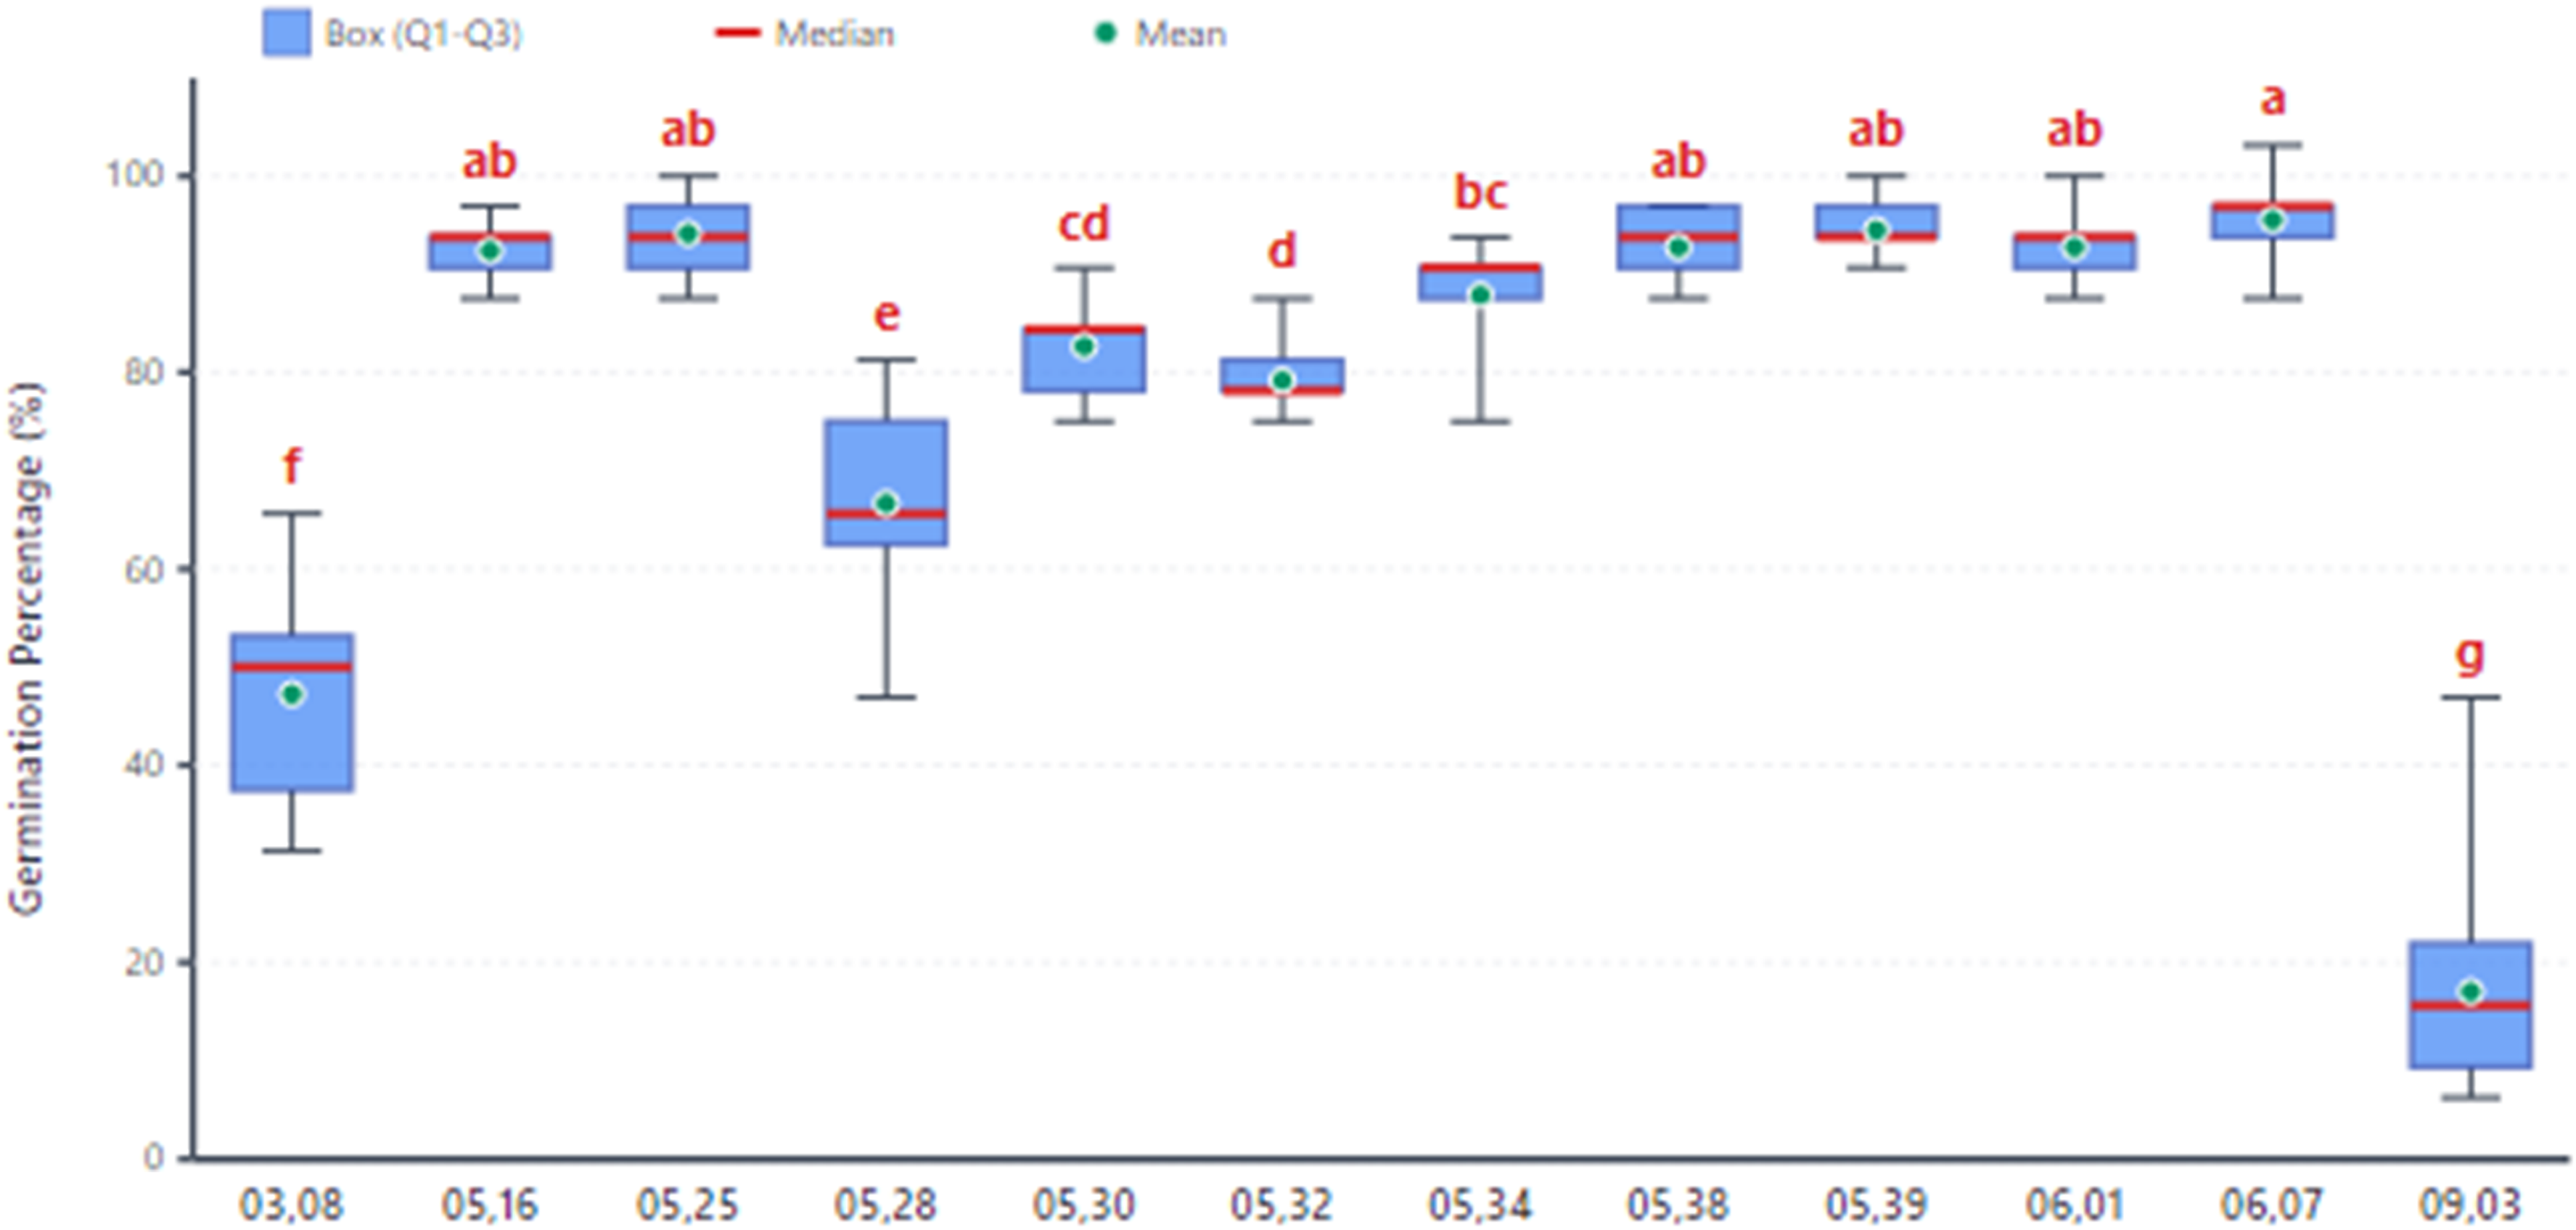
Germination of 12 F2 barberry populations derived from interspecific hybridization. Letters above boxes indicate Duncan's Multiple Range Test groupings (α = 0.001). Means with the same letter are not significantly different. Population codes represent collection dates (MM, location code). The box plots show the 25th and 75th percentiles, the red line inside the box represents the median, and the red plus sign (+) indicates the mean.
Substrate analysis revealed that a 1:1 mixture of cocopeat and perlite produced the best results, with an average germination rate of 80.81% (Figure 3). This finding aligns with previous research by Rezaei and Balandari, 17 who demonstrated that both growth media and cultivation systems significantly affect barberry seedling establishment. The superior performance of the cocopeat-perlite blend is likely due to its optimal balance of water retention and aeration, creating favorable conditions for seed germination and early root development.
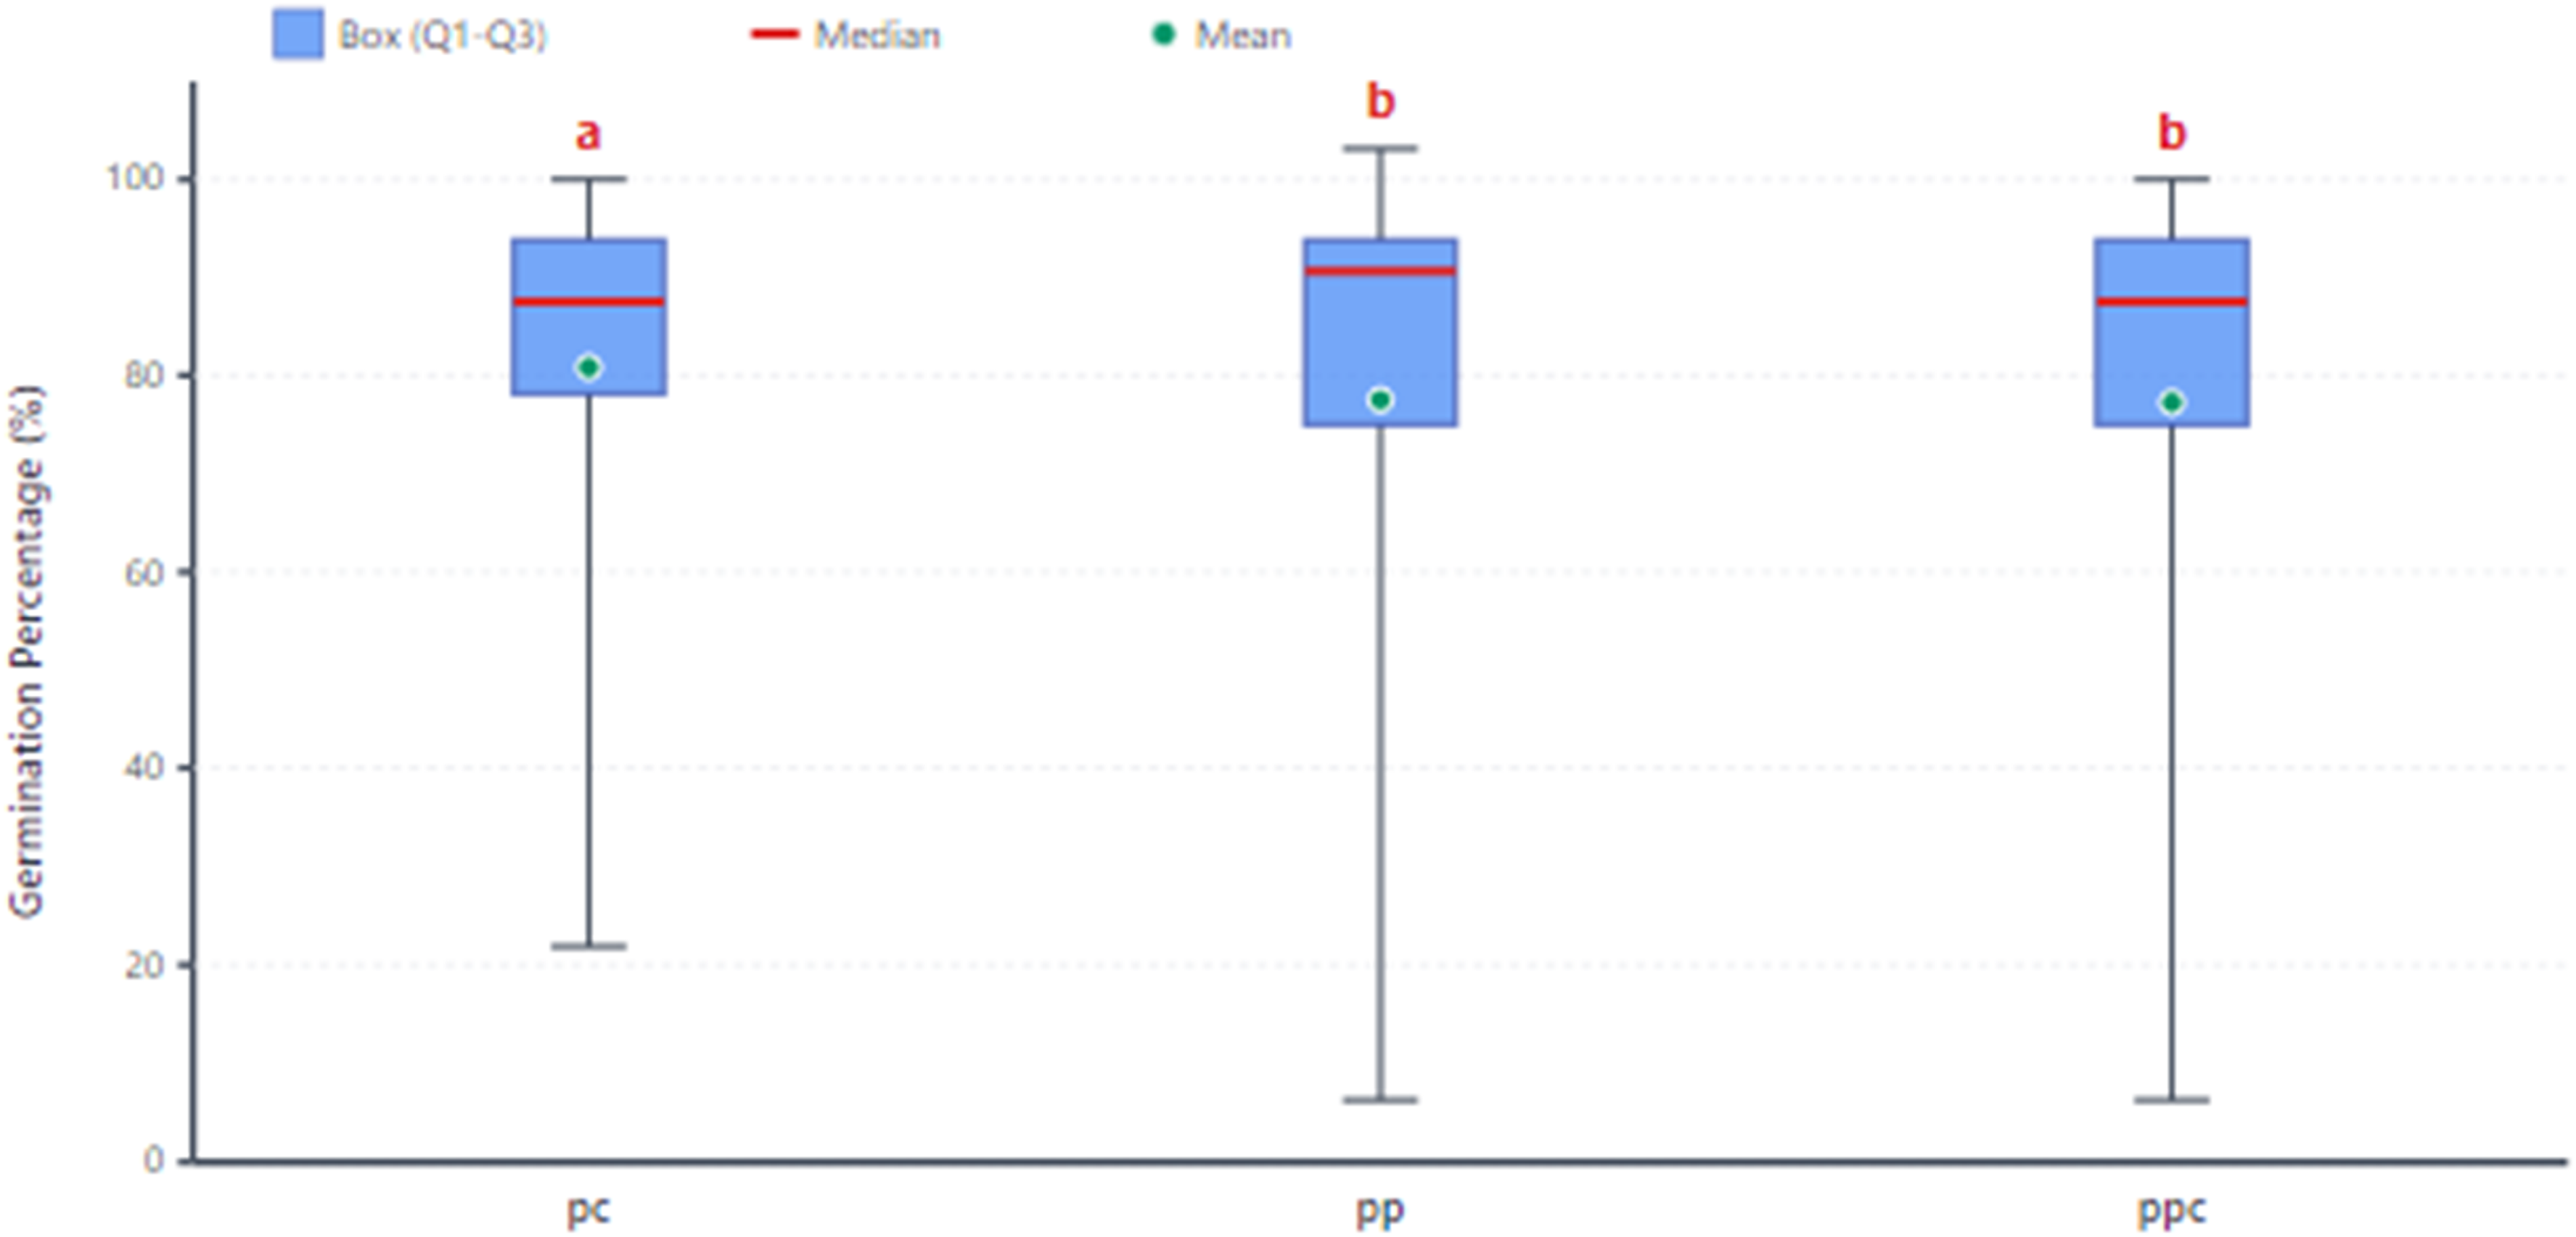
Germination percentages of 12 F2 barberry populations in three culture media. Letters above boxes indicate Duncan's Multiple Range Test groupings (α = 0.05). Means with the same letter are not significantly different. Medium codes: pc = ½ coco peat + ½ perlite, pp = ½ peat moss + ½ perlite, ppc = ⅓ peat moss + ⅓ coco peat + ⅓ perlite. The box plots show the 25th and 75th percentiles, the red line inside the box represents the median, and the red plus sign (+) indicates the mean.
Seedling survival rates among the barberry populations ranged from 53% to 92%. Population ‘0525’ showed the highest average survival rate, while population ‘0528’ had the lowest (Figure 1).
Morphological evaluations
The evaluation of morphological traits in superior interspecific barberry hybrids revealed substantial variability across different characteristics (Table 2). Seedling survival (Sur) exhibited the highest coefficient of variation (CV = 53.71%). Leaf pigmentation showed considerable diversity, with both upper (COnL, CV = 43.73%) and lower (CBaL, CV = 43.85%) surfaces. Among structural traits, leaf margin spine spacing (LMTS, CV = 33.89%) and leaf base shape (LBSh, CV = 28.64%) demonstrated significant variation, while leaf margin spine arrangement (LMTA, CV = 27.41%) showed moderate variability, supporting observations by Rezaei and Balandary 17 in wild barberry populations. The high coefficients of variation (CV > 25%) observed for traits such as seedling survival, leaf pigmentation, leaf margin spine spacing, and leaf base shape highlight their potential as key criteria for early-stage selection. Their variability indicates a strong response to selection pressure, allowing breeders to identify superior or novel phenotypes in seedling populations rapidly.
Descriptive analysis of morphological traits measured in superior genotypes derived from interspecific barberry crosses.
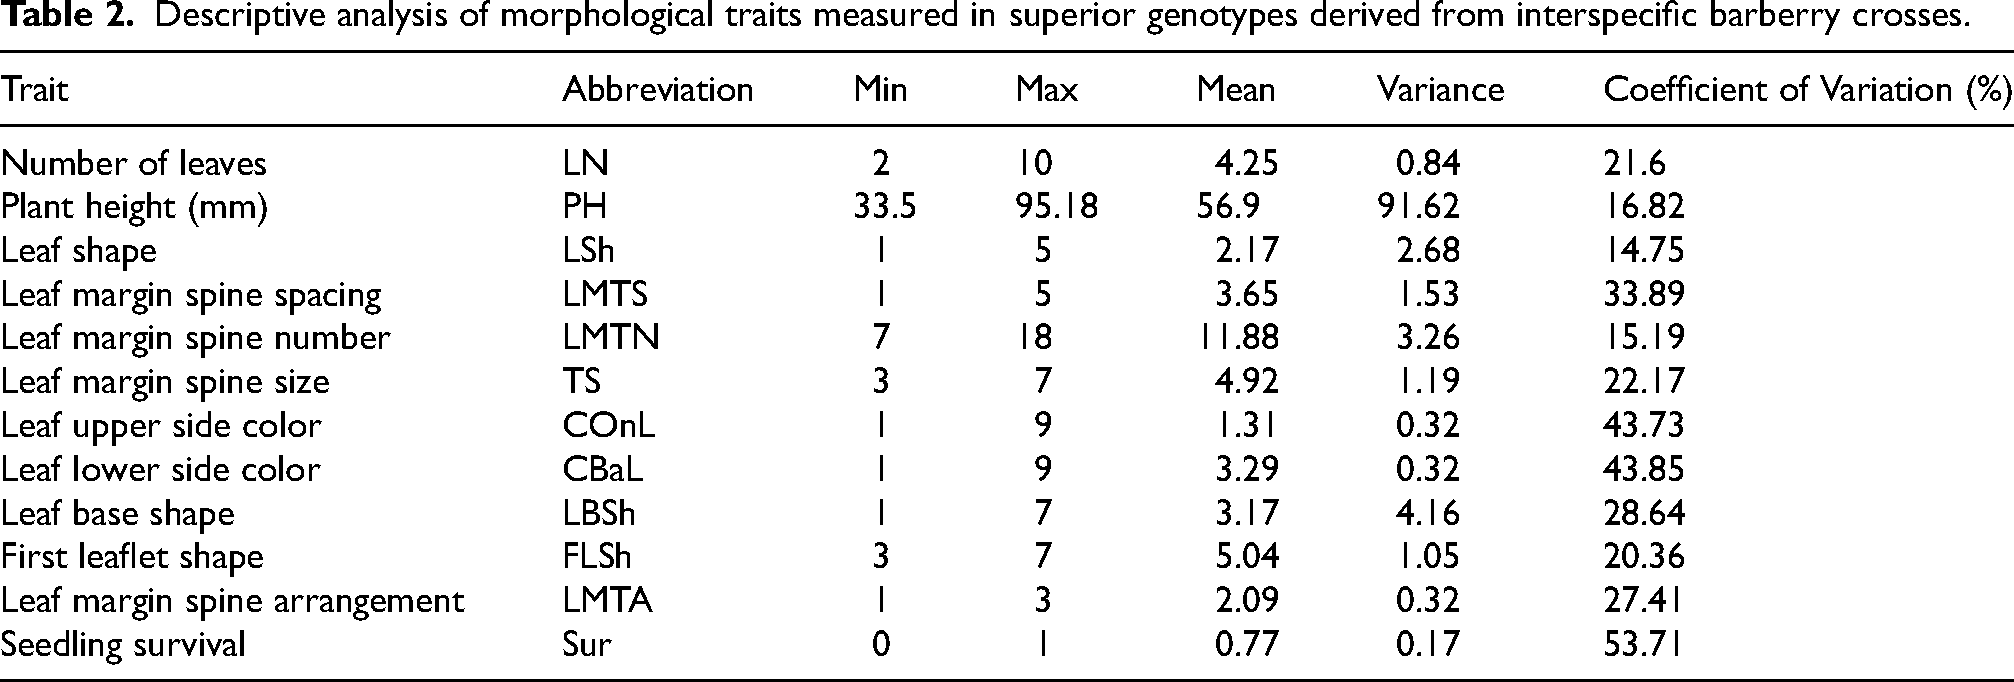
In contrast, several traits exhibited relatively stable expression across genotypes. Plant height (PH) showed limited variation (CV = 16.82%), ranging from 33.56 to 95.18 mm with a mean of 56.9 mm. The number of leaf margin spines (LMTN, CV = 15.19%) and leaf shape (LSh, CV = 14.75%) were among the most consistent characteristics. Other moderately variable traits included the number of leaves (LN, CV = 21.6%), leaf margin spine size (TS, CV = 22.17%), and first leaflet shape (FLSh, CV = 20.36%) (Table 2). This lower variability suggests that while these traits are valuable for descriptive purposes, they may have less discriminatory power for early selection within these specific hybrid populations.
These findings highlight distinct patterns of morphological diversity in barberry hybrids, with particularly high variation in survival rates and leaf characteristics. The results suggest that traits related to leaf morphology and seedling establishment offer the greatest potential for selective improvement, while architectural features like plant height show more genetic stability. 2
Correlation analysis
The relationships between traits can be utilized to design breeding programs. However, correlations do not imply causation or direct effects of one trait on another; instead, they indicate the degree of association between traits and can be used to indirectly measure traits. The correlation analysis between traits showed a significant positive relationship between leaf upper side color and leaf lower side color (r = 0.87) and between the number of leaf margin spines and the shape of the first leaflet (r = 0.49) (Table 3). This means that as the number of spines on the first leaflets of barberry increases, the number of spines on the margins of other leaves also increases. A significant negative correlation was found between leaf margin spine distance and the number of leaf margin spines (r = −0.383, p < 0.01). Leaf shape had a significant positive correlation with the number of leaf margin spines (r = 0.492, p < 0.01). Leaf margin arrangement showed a significant negative correlation with spine distance (r = −0.431, p < 0.01) and a significant positive correlation with the shape of the first leaflet (r = 0.144, p < 0.05). Moreover, leaf margin arrangement, number of leaf margin spines, and leaf lower side color were correlated with leaf upper side color. These correlation patterns are highly valuable for breeding. The strong association between spine-related traits (LMTN, LMTA) implies that selection for one, such as a highly spiny first leaflet, can indirectly and efficiently co-select for a more heavily defended plant architecture.
Correlation coefficients among morphological traits of superior genotypes derived from interspecific barberry crosses.
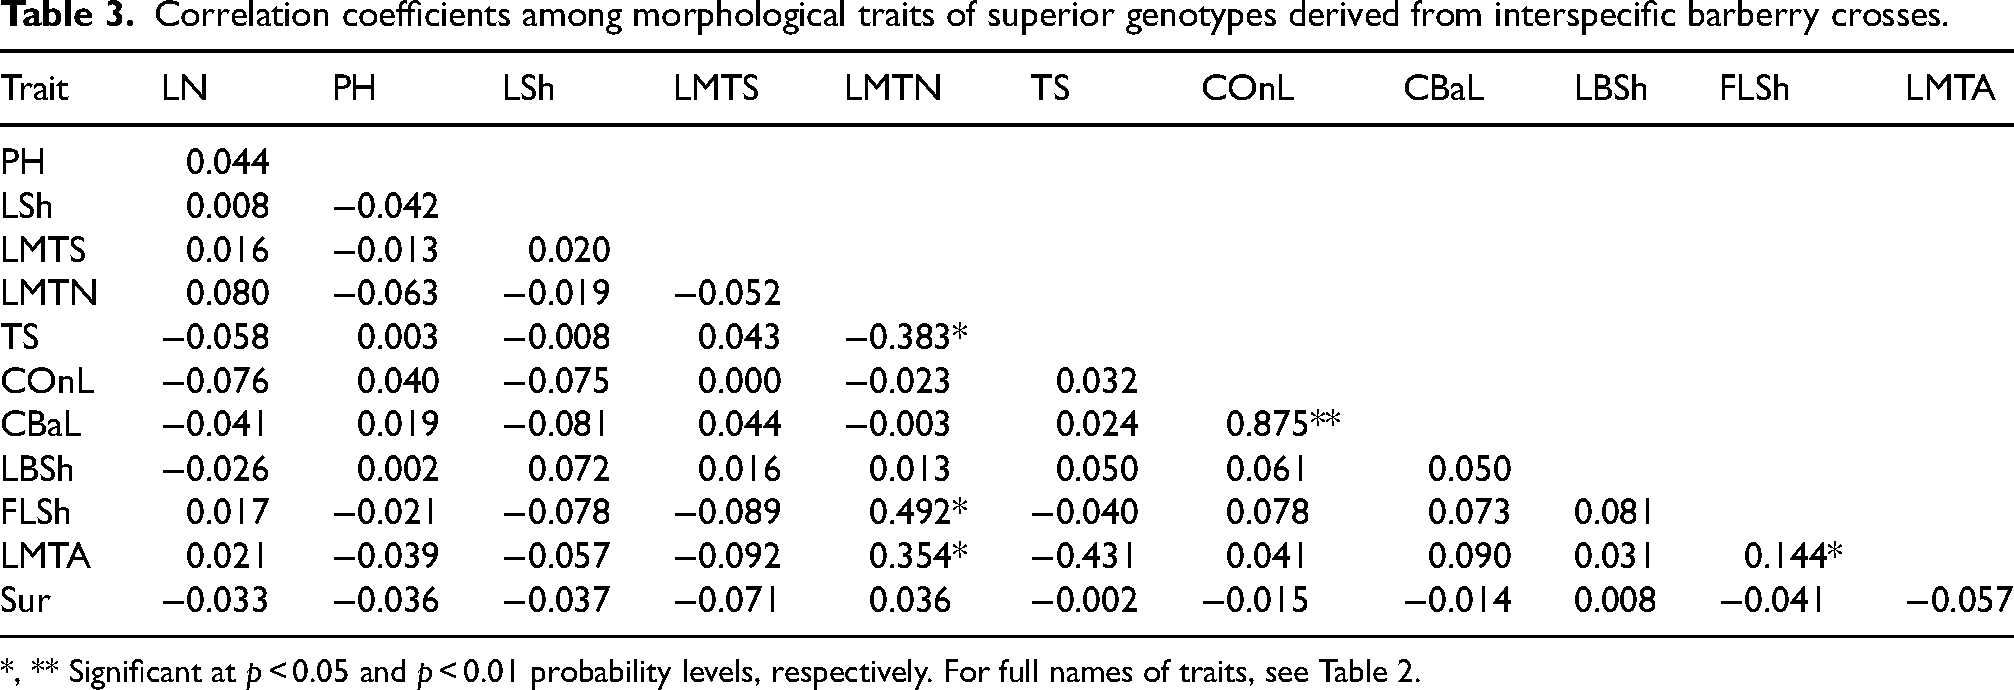
*, ** Significant at p < 0.05 and p < 0.01 probability levels, respectively. For full names of traits, see Table 2.
Multivariate analysis
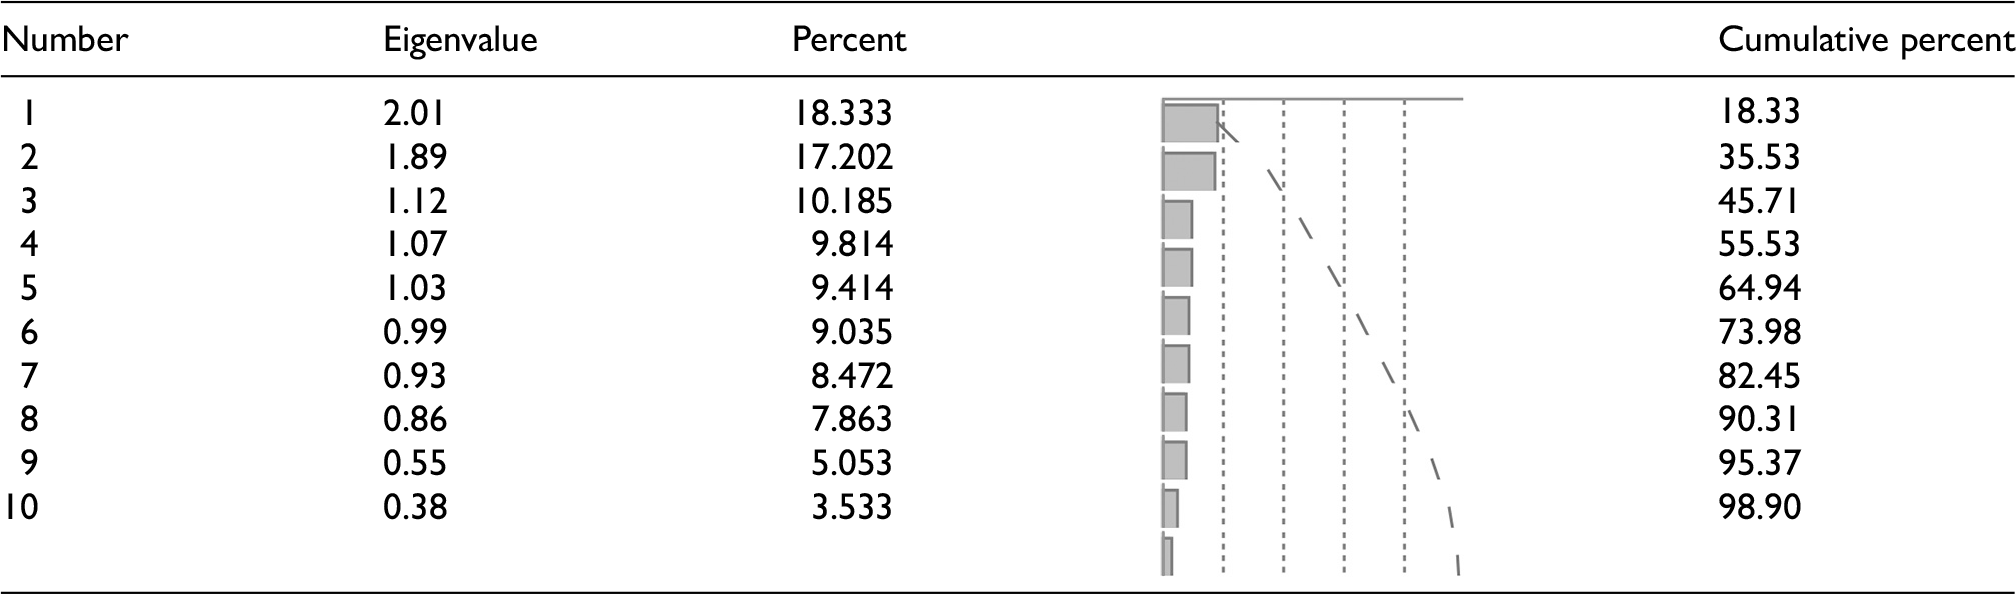
By using factor analysis, multiple traits can be grouped into factors or components, each comprising several related traits. This decomposition was employed to interpret the data better and to identify the primary traits influencing genotype differentiation. Factors represent quantitative traits with the greatest contribution to distinguishing genotypes. The relative variance explained by each factor indicates its importance in the total variance of the traits and is expressed as a percentage. The factor analysis revealed significant patterns in the morphological variation of barberry hybrids, with the first ten components collectively explaining 98.9% of the total variance (Table 4). The first factor, accounting for 18.33% of the variance, was predominantly associated with leaf pigmentation characteristics, showing strong positive loadings for both upper (0.932) and lower (0.922) leaf surface coloration. The second factor, explaining 17.20% of the variance, primarily represented leaf-spine architecture traits, with particularly high loadings for the number of leaf margin spines (0.964) and moderate loadings for the first leaflet shape (0.488) and leaf margin arrangement (0.361), while demonstrating a negative correlation with leaf-spine spacing (−0.395) (Figure 4).
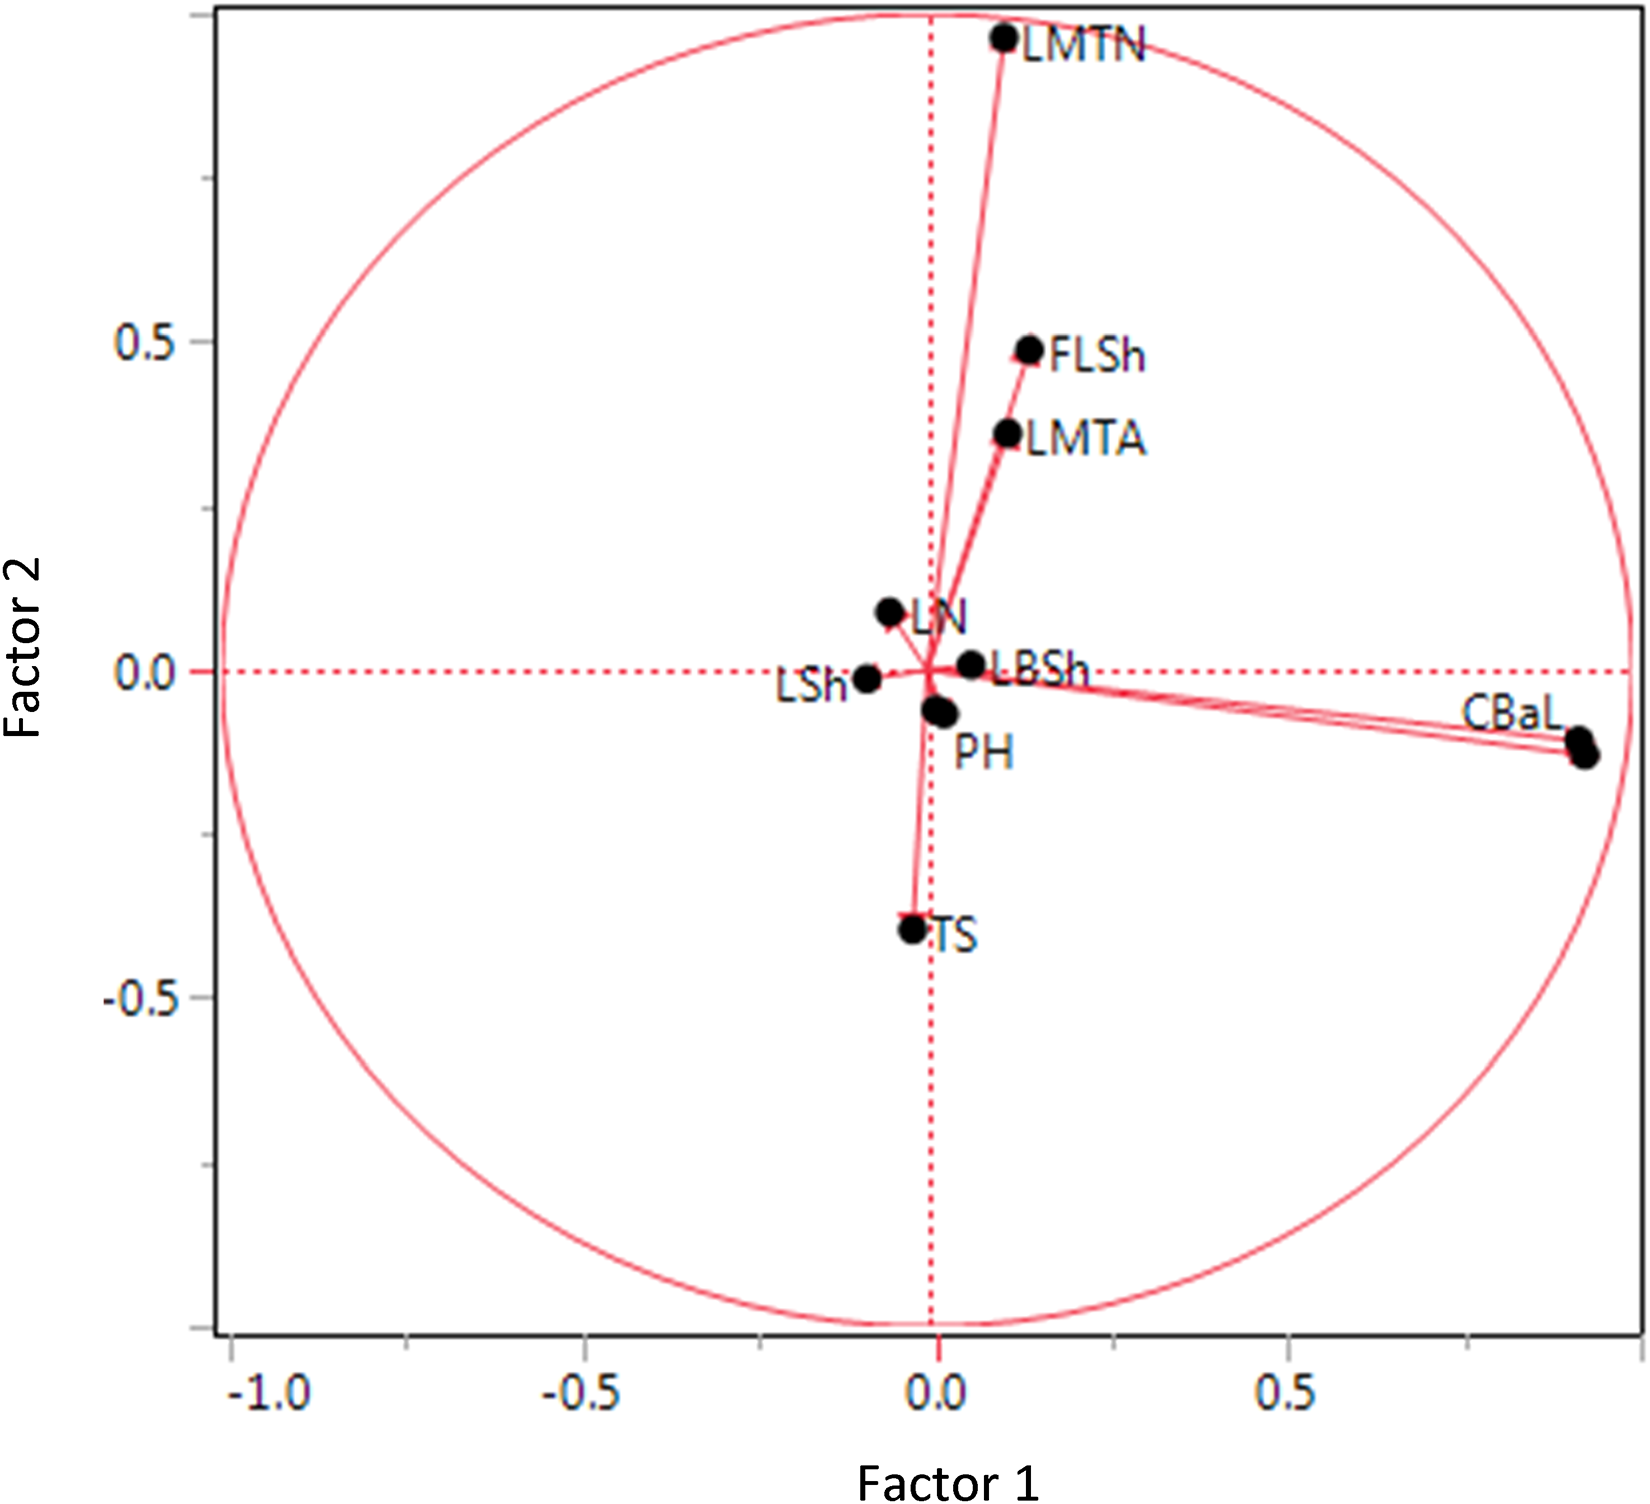
Factorial analysis biplot of morphological traits in barberry hybrids. Factor 1 (18.3% variance) vs. Factor 2 (17.2% variance). Trait vectors show loading directions. For full names of trait abbreviations, see Table 2.
Eigenvalues and variance explained by the factors extracted from the factor analysis of morphological traits in F2 barberry populations.
Biplot analysis
This test displays the two-dimensional dispersion of genotypes based on traits that have significant effects on the first and second principal components. The clustering of genotypes in a specific area of the plot indicates their genetic similarity. The biplot visually represents genotypic distribution according to traits contributing most to each factor, with 35% of total variance collectively explained (FA1 = 18.3%; FA2 = 16.7
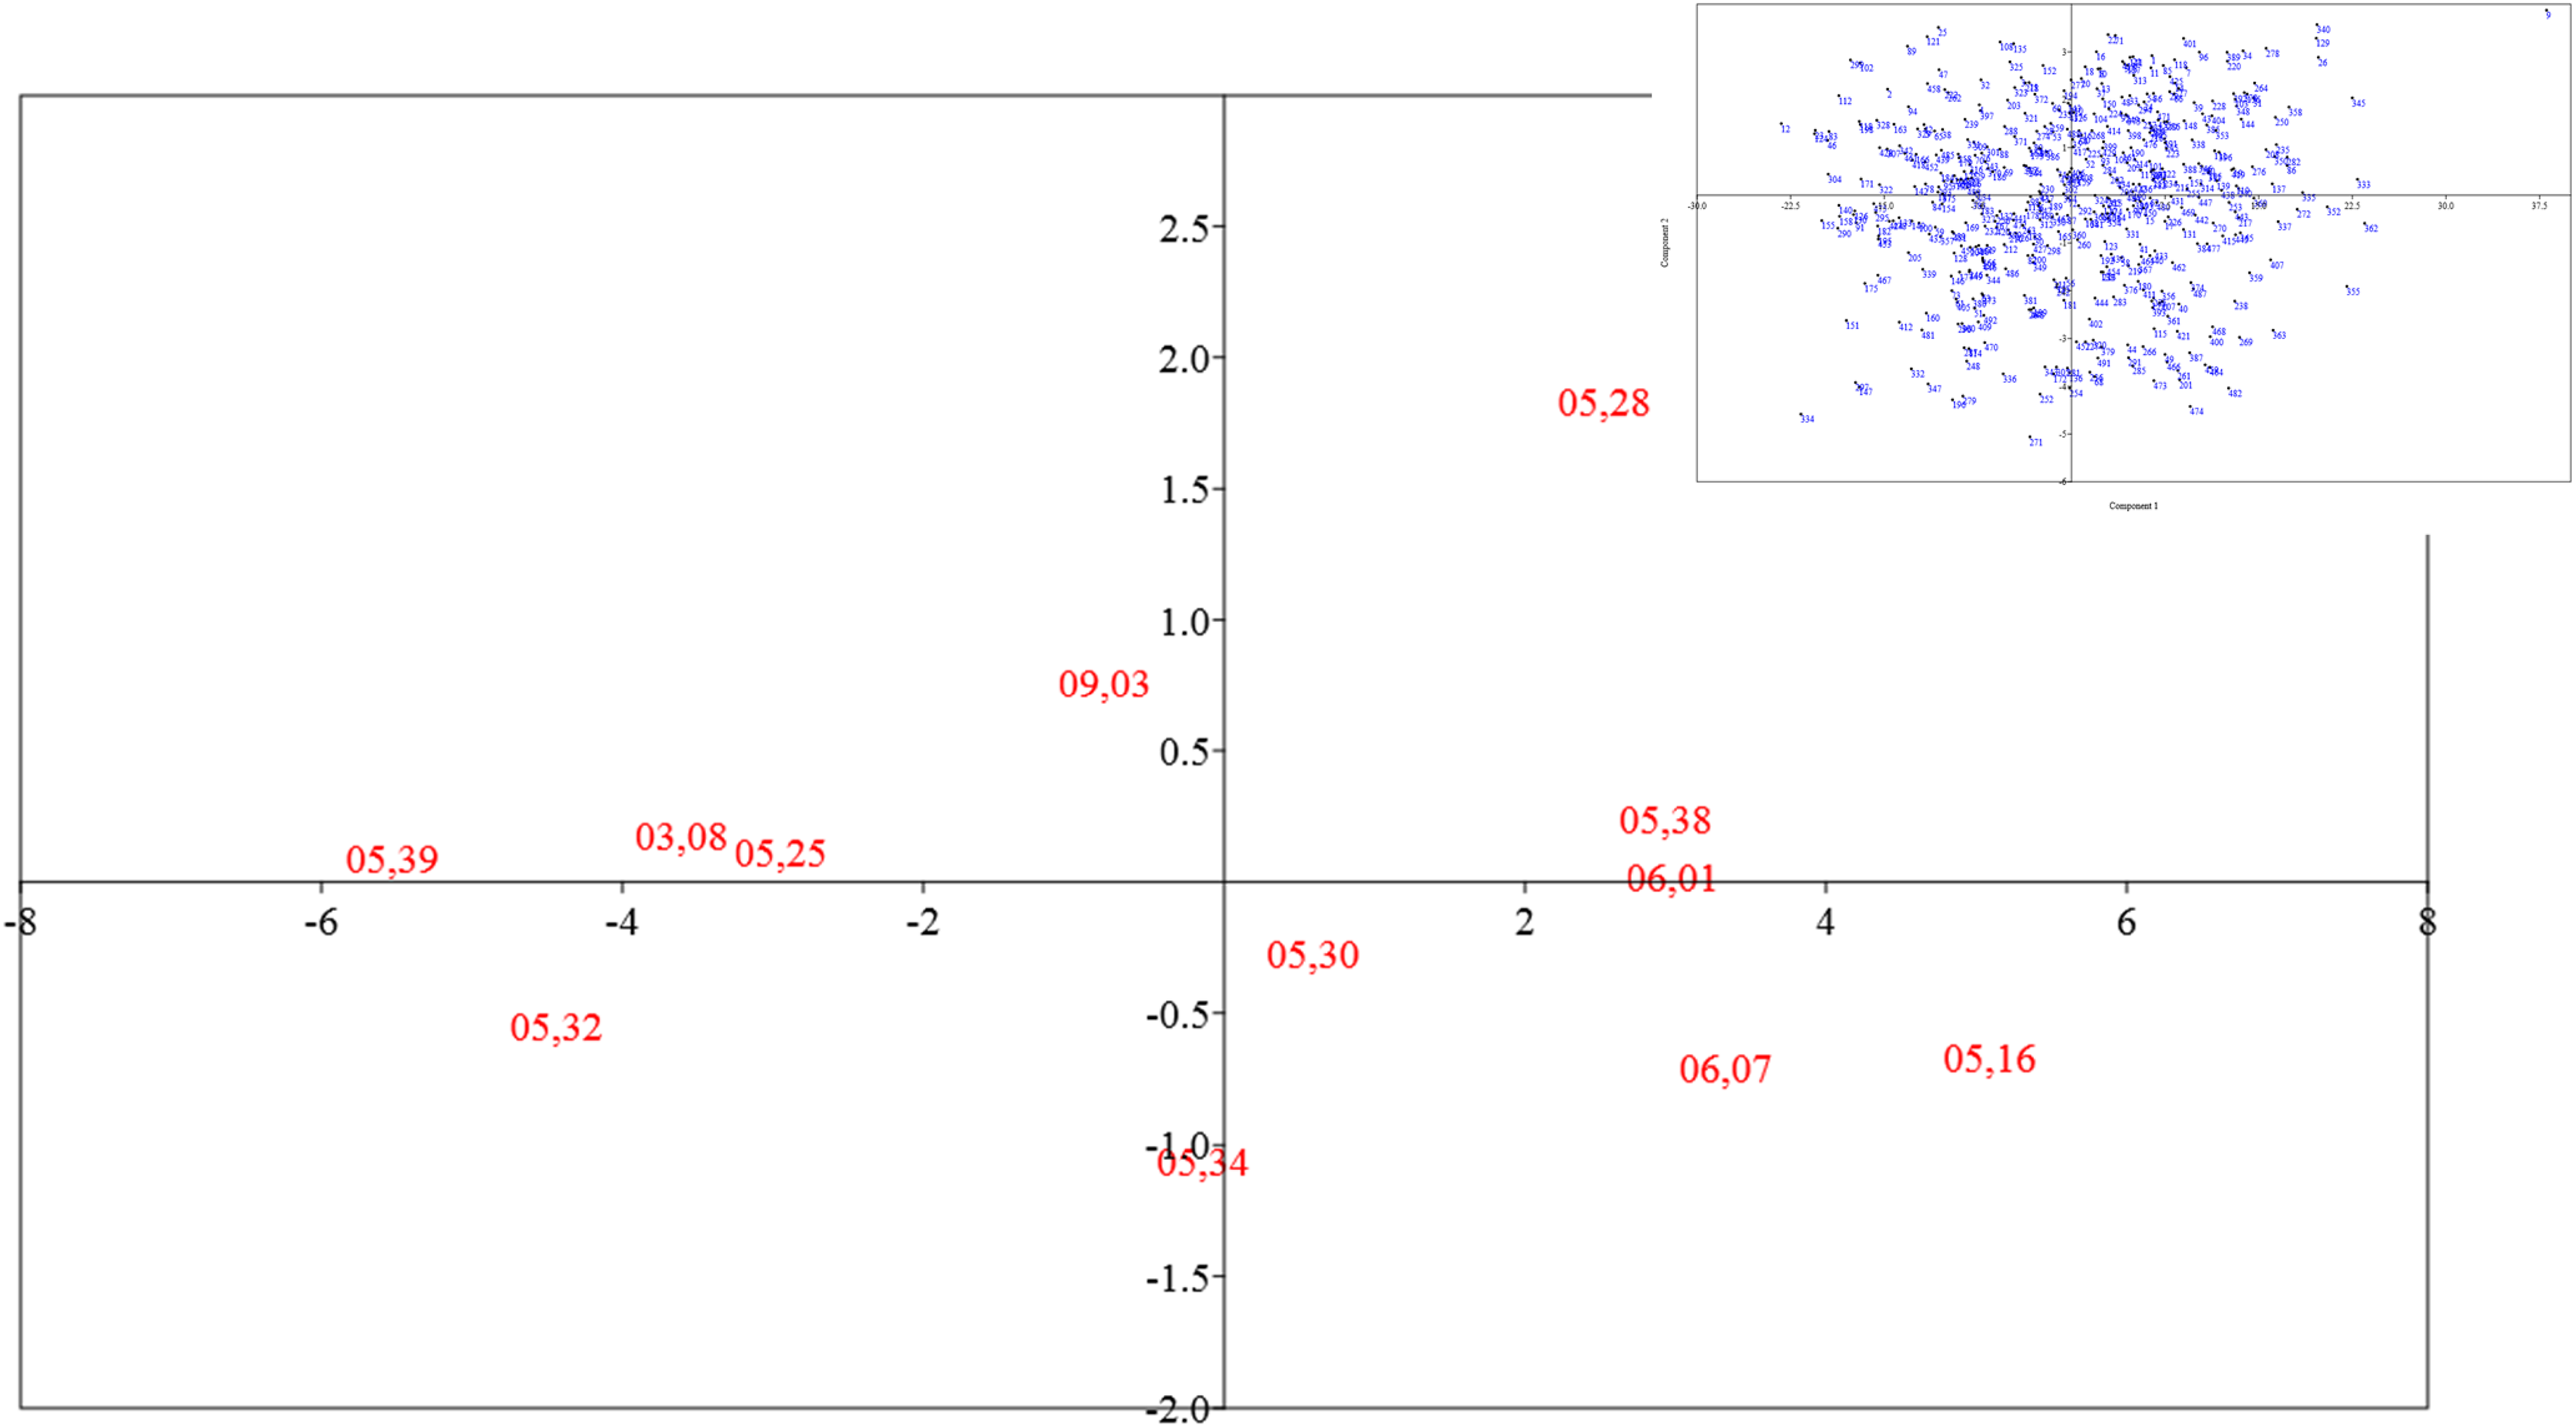
Biplot analysis of barberry population based on the first two factors from morphological evaluation of F2 populations during early seedling growth.
Cluster analysis
To evaluate the morphological diversity among superior barberry genotypes, cluster analysis was performed using Ward's method. This analysis was based on quantitative data from 12 traits assessed across 12 populations to aid in the classification. Based on the dendrogram, generated using Ward's method, the genotypes were divided into two main groups, A and B. Group A was further subdivided into two subgroups, A1 and A2, as the clustering distance decreased to 13. Similarly, group B was split into two subgroups, B1 and B2, when the distance decreased to 11. Group A includes genotypes ranging from 11 to 352, while group B consists of genotypes from 12 to 9. Subgroup A1 contains 234 genotypes, spanning from genotype 11 to genotype 407, whereas subgroup A2 comprises 16 genotypes, from 26 to 352, grouped due to their close similarities. Subgroup B1 includes 30 genotypes, from 12 to 334, and subgroup B2 has 172 genotypes, ranging from 200 to 9 (Figure 6). Genotypes from different main clusters (A and B) represent divergent gene pools; crossing them could generate transgressive segregants with novel trait combinations and enhanced heterosis. Conversely, selections within a subgroup can be used for line fixation and purity, ensuring consistency for specific trait profiles.
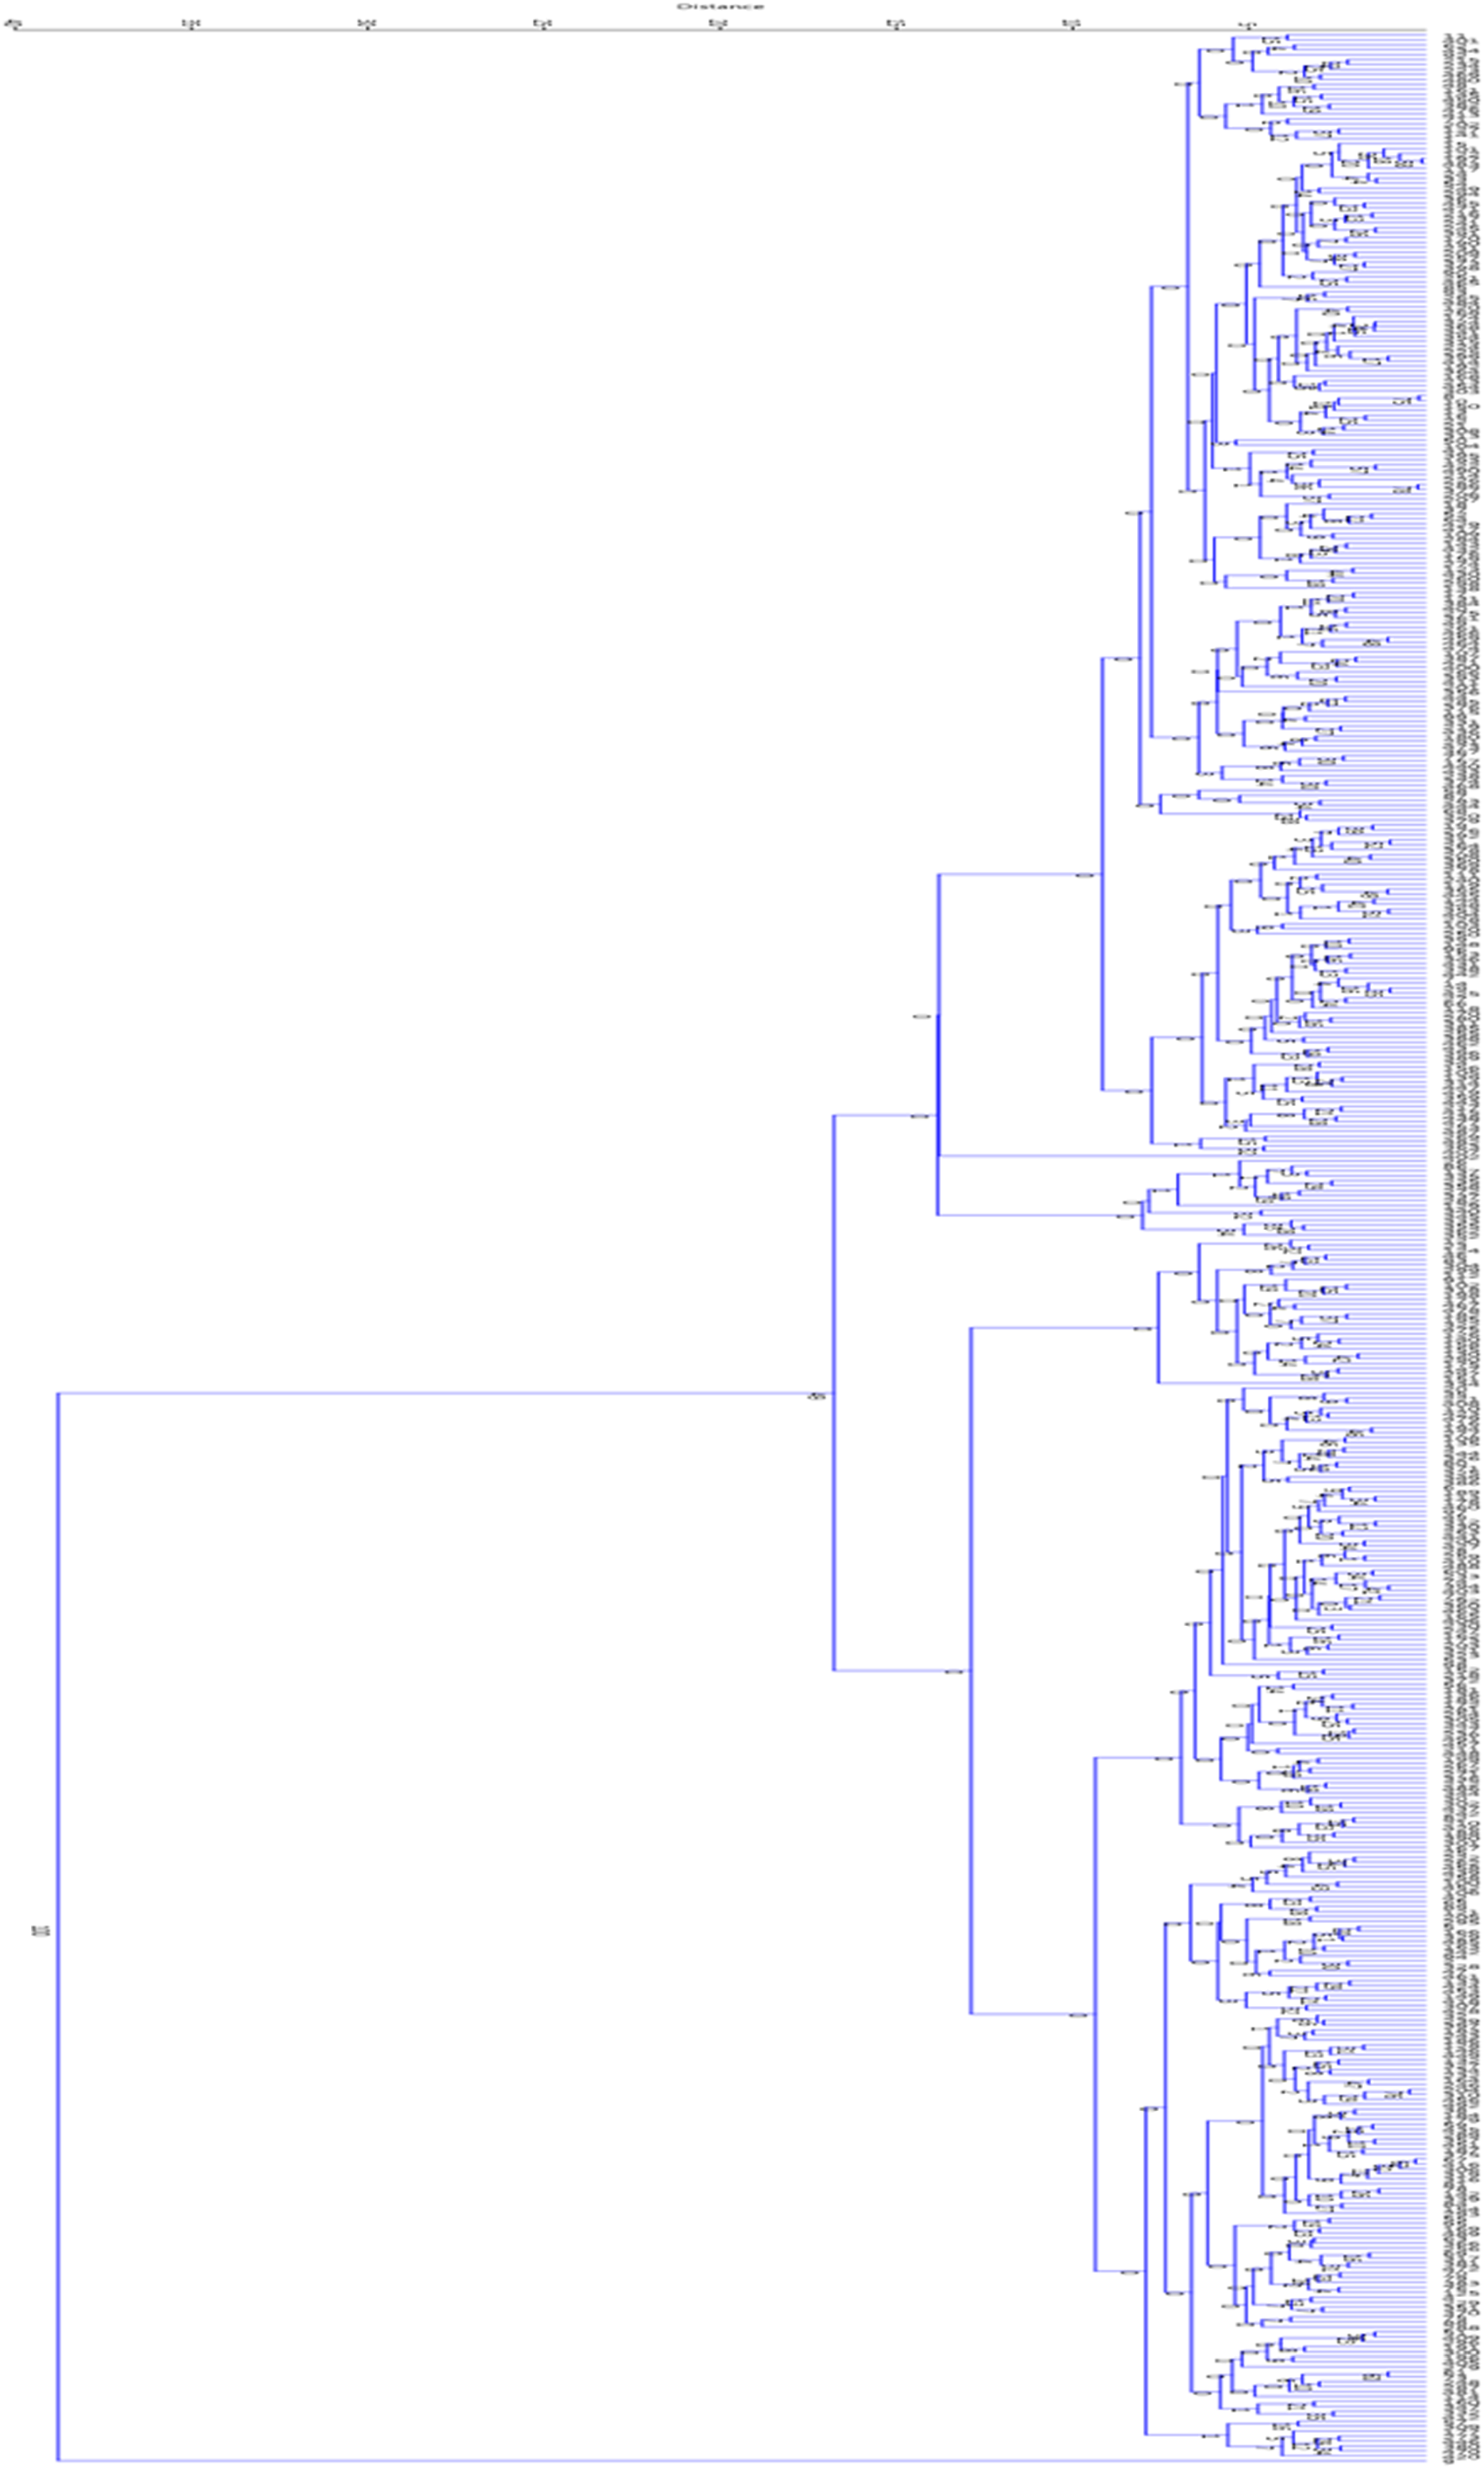
Cluster analysis using Ward's method to study the morphological variation of F2 barberry populations at early seedling growth stages.
Hassanpour and Alizadeh 18 reported that cluster analysis of various barberry populations revealed high genetic diversity, consistent with the findings of this study. Another study by Heidary et al. 19 showed that cultivated barberry samples did not differ significantly from other tested samples, as they clustered within the same group. This grouping likely reflects their strong morphological similarities, which aligns with our results. The separation of different barberry populations based on morphological traits is probably due to the presence or absence of distinct characteristics, with populations clustered together sharing common traits. In this context, Heidary et al. 19 emphasized that some morphological features, such as differences in leaves and spines, effectively distinguished different barberry species from one another.
Heatmap analysis
The heatmap analysis served as a powerful analytical tool for evaluating morphological variation among barberry genotypes (Figure 7). This visualization method enabled simultaneous examination of trait associations and genotypic differences through color-coded representations, where columns corresponded to evaluated traits and rows represented individual genotypes. The color intensity in each cell reflected the relative expression level of each trait across genotypes. The measured traits were clustered into three primary groups, A, B, and C. Group A comprised vegetative growth characteristics, including leaf number, plant height, leaf shape, leaf base shape, margin spine number, spine length, and spine spacing. Group B contained leaf pigmentation traits (upper and lower surface colors). Group C included leaf margin spine number, first leaflet shape, and leaf-spine arrangement.
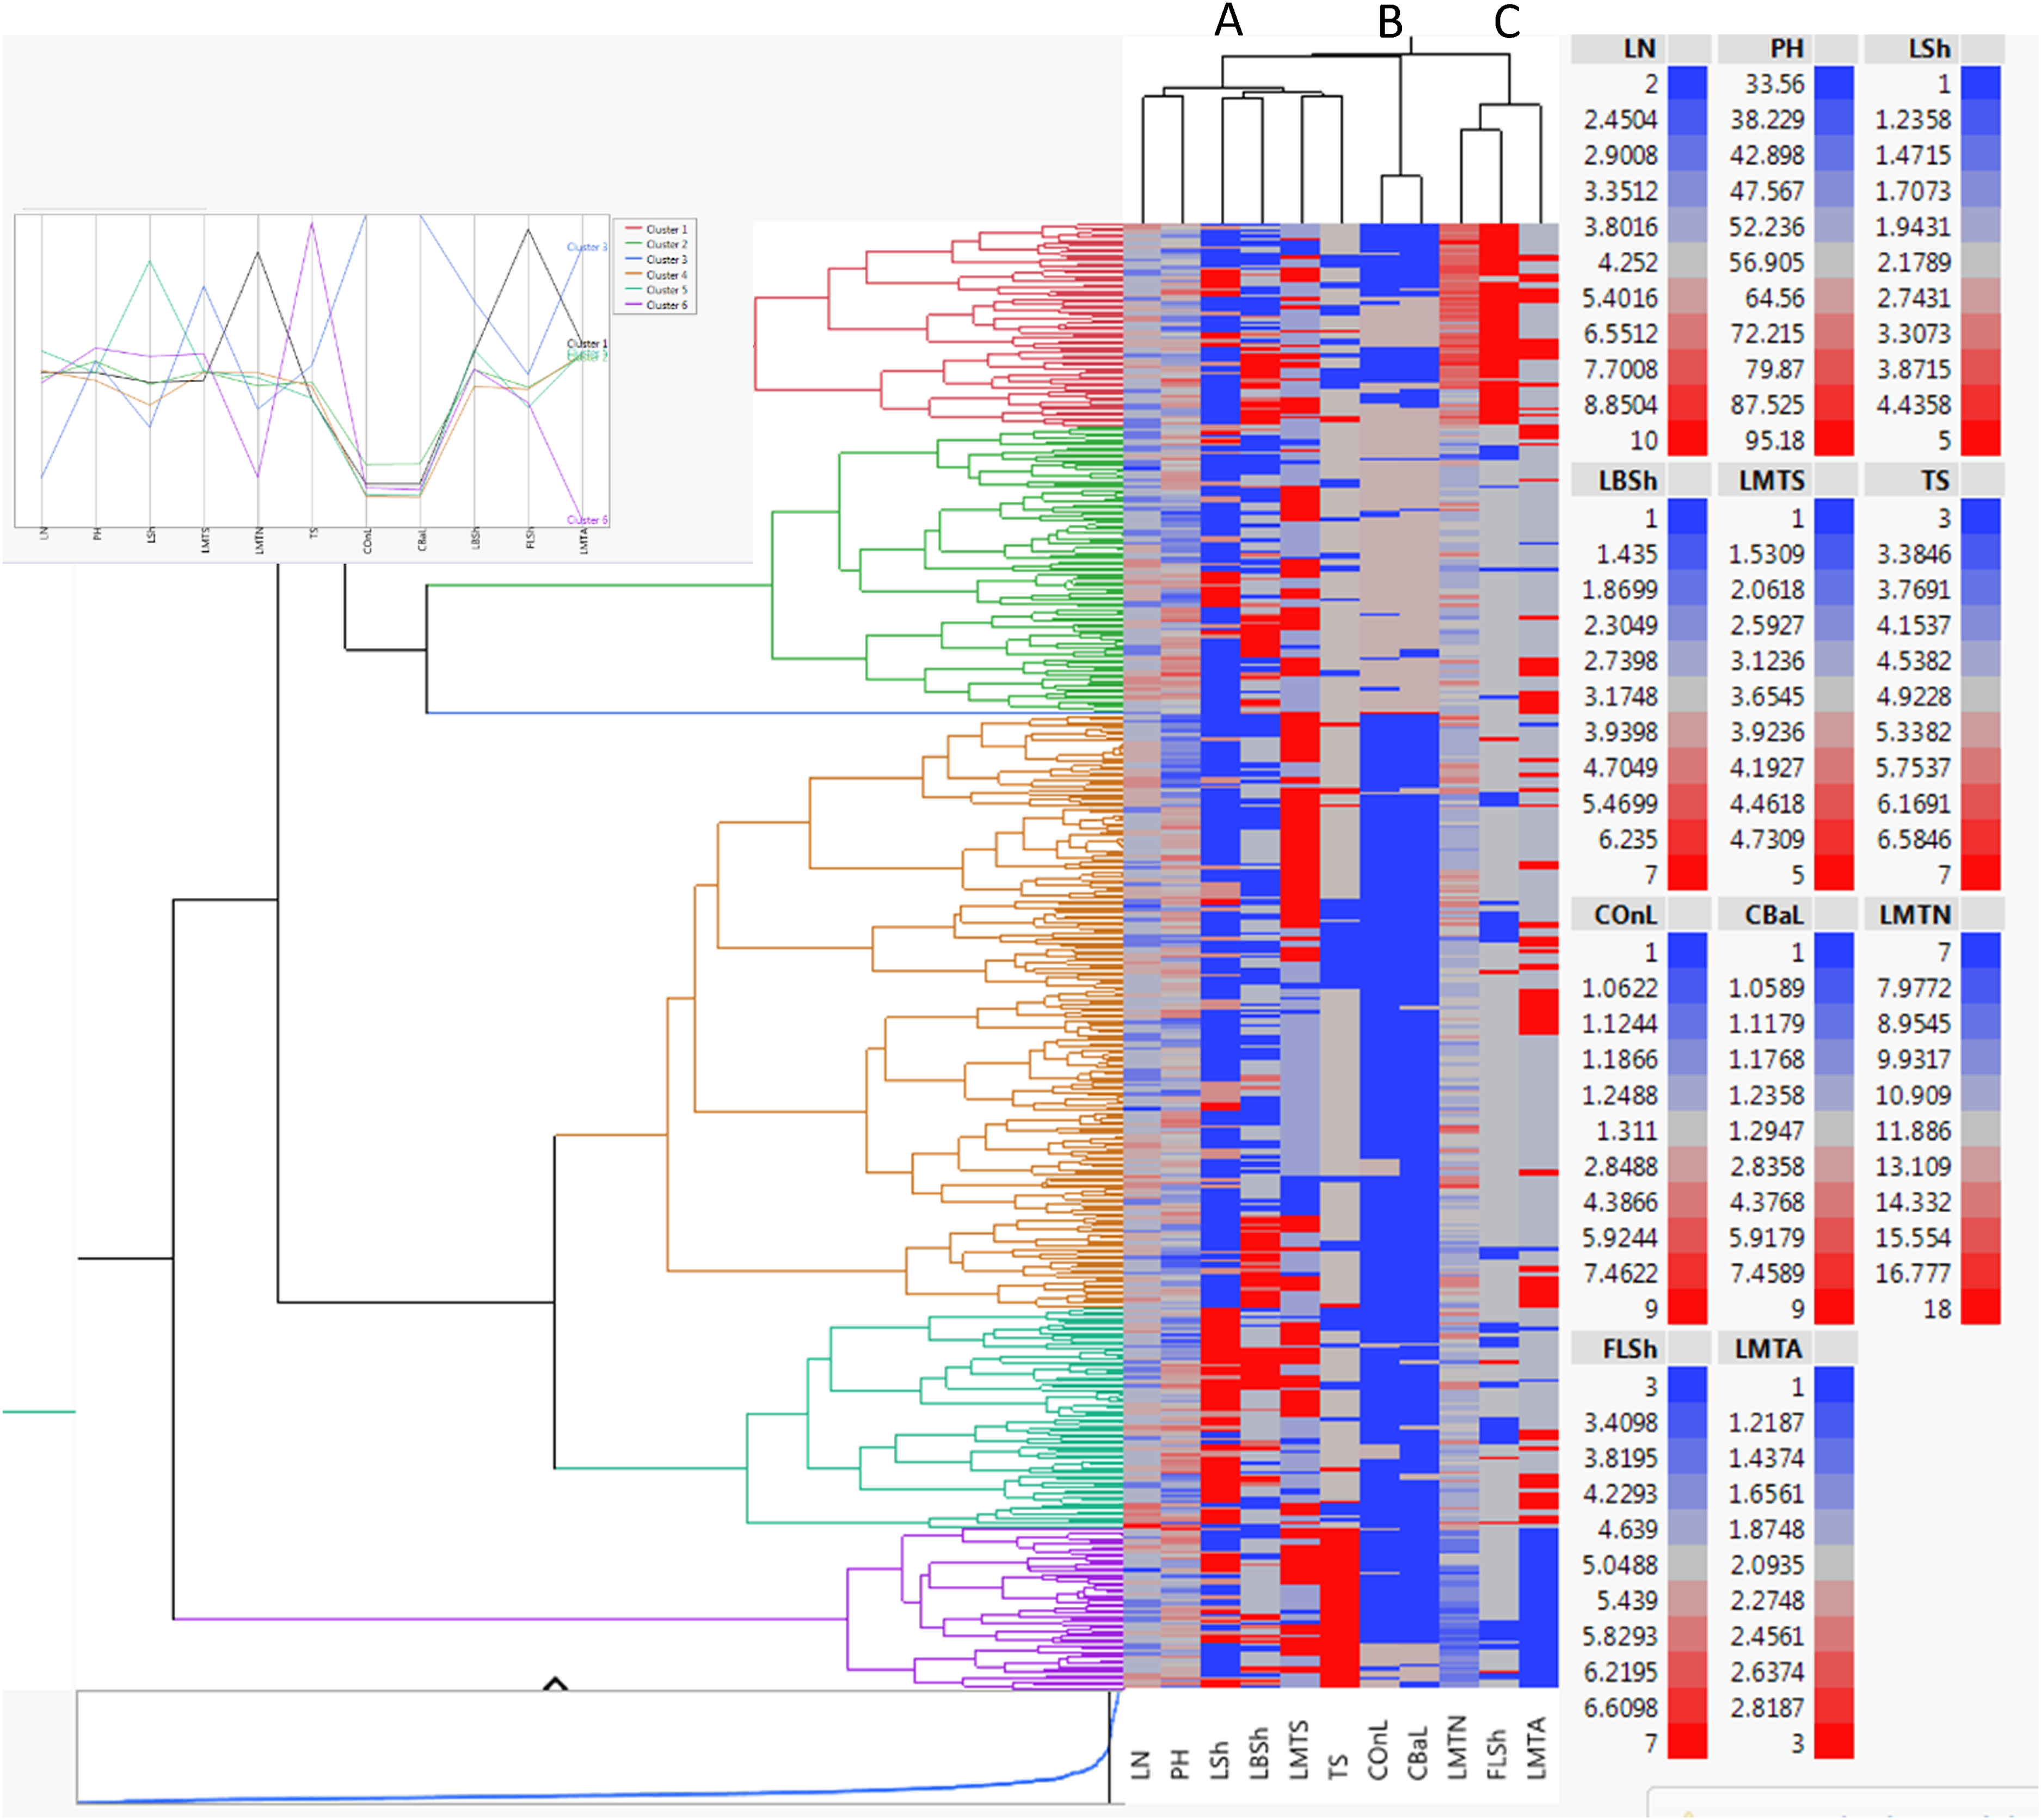
Heatmap of morphological trait variation in F2 barberry hybrids. Color intensity shows relative expression levels (see legend). For full names of trait abbreviations, see Table 2.
Genotypes were segregated into six distinct groups based on morphological similarity. The red group contained genotypes with intensely spiny first leaflets (code 7) and high-margin spine density. From a selection perspective, this group is a prime source for breeding programs aimed at developing ornamental security hedges or for introducing robust physical defenses into cultivated varieties grown in areas with high browsing pressure. The green group exhibited intermediate phenotypic expression across most traits, with lighter leaf coloration. The blue group displayed dark leaf pigmentation coupled with numerous margin spines. The dark pigmentation may indicate higher concentrations of photoprotective compounds like anthocyanins, suggesting an adaptation to high-light stress environments. The yellow group (largest cluster) comprised genotypes with rounded leaf shapes and lighter pigmentation. The turquoise group included genotypes featuring elongated, pale-colored leaves. The purple group consisted of genotypes with minimal leaf serration (code 1), sparse margin spines, and wide spine spacing. This cluster is highly relevant for selecting genotypes for commercial fruit production, where ease of harvest and reduced physical handling damage are desirable, or for ornamental use in low-maintenance landscapes. This clear differentiation of genotypes likely reflects the presence or absence of distinct morphological markers. Genotypes within the same cluster shared fundamental phenotypic characteristics, suggesting potential genetic relationships or common adaptive patterns. Notably, leaf architecture and spine morphology served as particularly diagnostic traits for genotype discrimination, consistent with previous findings by Heidari et al. 20 regarding barberry species identification. The heatmap effectively captured complex genotype-phenotype relationships, providing valuable insights for breeding programs, germplasm characterization, and evolutionary studies of morphological adaptation in barberry.
Conclusions
This study demonstrated that an equal mixture of peat moss and perlite serves as the optimal growth substrate for barberry seedling cultivation. The F2 hybrid populations exhibited remarkable morphological diversity during early seedling stages, particularly in vegetative and spine-related traits. Key traits such as leaf pigmentation, leaf spine length, and spine arrangement were identified as highly variable and thus highly useful for early-stage phenotypic selection. Multivariate analyses of the F2 progeny revealed distinct segregation patterns, with heatmap visualization differentiating six phenotypic groups based on leaf architecture and spine characteristics. The substantial phenotypic variation observed among F2 seedlings is consistent with the expected genetic consequences of interspecific hybridization and highlights the potential for selective breeding. A limitation of this study is its reliance on morphological markers; future work integrating molecular analysis would be valuable to confirm the genetic basis of this variation and to identify transgressive segregation directly. These findings emphasize the value of F2 populations as a genetic resource for barberry improvement while underscoring the importance of early-stage selection in breeding programs. The study provides foundational insights for utilizing hybrid populations in barberry cultivation and conservation efforts.
Footnotes
Author contributions
MA: Data collection, experimental execution, preliminary manuscript drafting, and statistical analysis. MR, AK, and YT: Conceptualization, project supervision, data interpretation, final manuscript writing, and editing.
Funding
The authors received no financial support for the research, authorship, and/or publication of this article.
Declaration of conflicting interests
The authors declared no potential conflicts of interest with respect to the research, authorship, and/or publication of this article.
Availability of data and materials
The data that support the findings of this study are available from the corresponding author upon reasonable request.