
Abstract
Using a case study of a pharmacy department rebuild in the South West of England, this article examines the use of evidence-based design to improve the efficiency and staff well-being with a new design. This article compares three designs, the current design, an anecdotal design, and an evidence-based design, to identify how evidence-based design can improve efficiency and staff well-being by reducing walking time and distance. Data were collected from the existing building and used to measure the efficiency of the department in its current state. These data were then mapped onto an anecdotal design, produced by architects from interviews and workshops with the end users, and an evidence-based design, produced by highlighting functions with high adjacencies. This changed the view on the working processes within the department, shifting away from a focus on the existing robotic dispensing system. Using evidence-based design was found to decrease the walking time and distance for staff by 24%, as opposed to the anecdotal design, which increased these parameters by 9%, and is predicted to save the department 248 min across 2 days in staff time spent walking.
Keywords
Introduction
The National Health Service (NHS) of Great Britain is facing tough challenges to provide an effective and efficient healthcare service, as changing demographics put different pressures upon the health service (Department of Health, 2013). Much work has been done in academia and industry to provide solutions for improved efficiency in healthcare departments such as surgery theaters (Dexter & Epstein, 2009; Marcario, 2006), emergency departments (Bernstein et al., 2009; Gunal & Pidd, 2006), nursing units (Burgio, Engel, Hawkins, McCormick, & Scheve, 1990; Furåker, 2009; Hendrich, Chow, Skierczynski, & Lu, 2008; Trites & Galbraith, 1970), and pharmacy departments (Maviglia et al., 2007; Mukherjee, 1991; Reynolds et al., 2011).
Pharmacy departments typically receive less focus in healthcare research as a large portion of the focus is placed upon the patient, with numerous studies having been conducted to observe how patients view their healthcare service and the waiting times involved (Booth, Harrison, Gardener, & Gray, 1992; Fornara, Bonaiuto, & Bonnes, 2006; Rhee & Bird, 1996; Ridic, Gleason, & Ridic, 2012; Thompson, Yarnold, Williams, & Adams, 1996). Pharmacy departments tend to be overlooked, as they typically do not deal with patients directly. Rather, they are service systems with complex processes (Reynolds et al., 2011) in handling and dispensing drugs (prescriptions) and, when embedded within a hospital, may only dispense to wards and not the patients themselves. Likewise, few studies look at the effect of building design on staff, preferring instead to see how the design may (indirectly, through staff performance) ultimately affect patient care, though some research has been conducted which highlights the positive outcomes for staff as well (Guenther & Hall, 2007; Sadler, Dubose, & Zimring, 2008).
The productivity and efficiency of a pharmacy department is typically measured using broad metrics that are poorly, if at all, specified (Gupta et al., 2007; Naseman, Lopez, Forrey, Weber, & Kipp, 2015). Examples of these include measuring routine pharmaceutical activities such as the number of prescriptions filled. Although previous research has focused on a productivity model for pharmacy departments (Naseman et al., 2015), or linked the hospital size to pharmacy productivity (Gupta et al., 2007), few studies have looked at how the design impacts on walking distances of staff and resultant efficiency.
In addition to pressures being placed on the NHS through growing patient demand and changing demography, the U.K. government has put additional pressure on health services with new and changing policies. In 2009, the NHS was set a target of finding £20bn of efficiency savings by 2015 (Nicholson, 2009). This was updated in 2015 in an interim report on NHS operational productivity that outlined ways to save £5bn per annum (Coles, 2015). These efficiency drives have resulted in the NHS looking to make the most of the estates they have to ensure efficiency is at its peak. This article uses the case study of a large hospital estate in the southwest of England where the pharmacy department has been scheduled for demolition and there is an aspiration from the estate directors to ensure the new build design allows for the most efficient process of pharmaceutical dispensing and improved staff well-being. Employing similar techniques to measure and reduce the distance walked by staff to improve the design of patient wards (Burgio et al., 1990; Furåker, 2009; Hendrich et al., 2008; Shepley, 2002; Trites & Galbraith, 1970; Westbrook, Duffield, Li, & Creswick, 2011) and a pharmacy department layout (McDowell & Huang, 2012), this study presents the findings of an evidence-based approach to assist decision makers in delivering the most efficient design for the new pharmacy building.
The problem
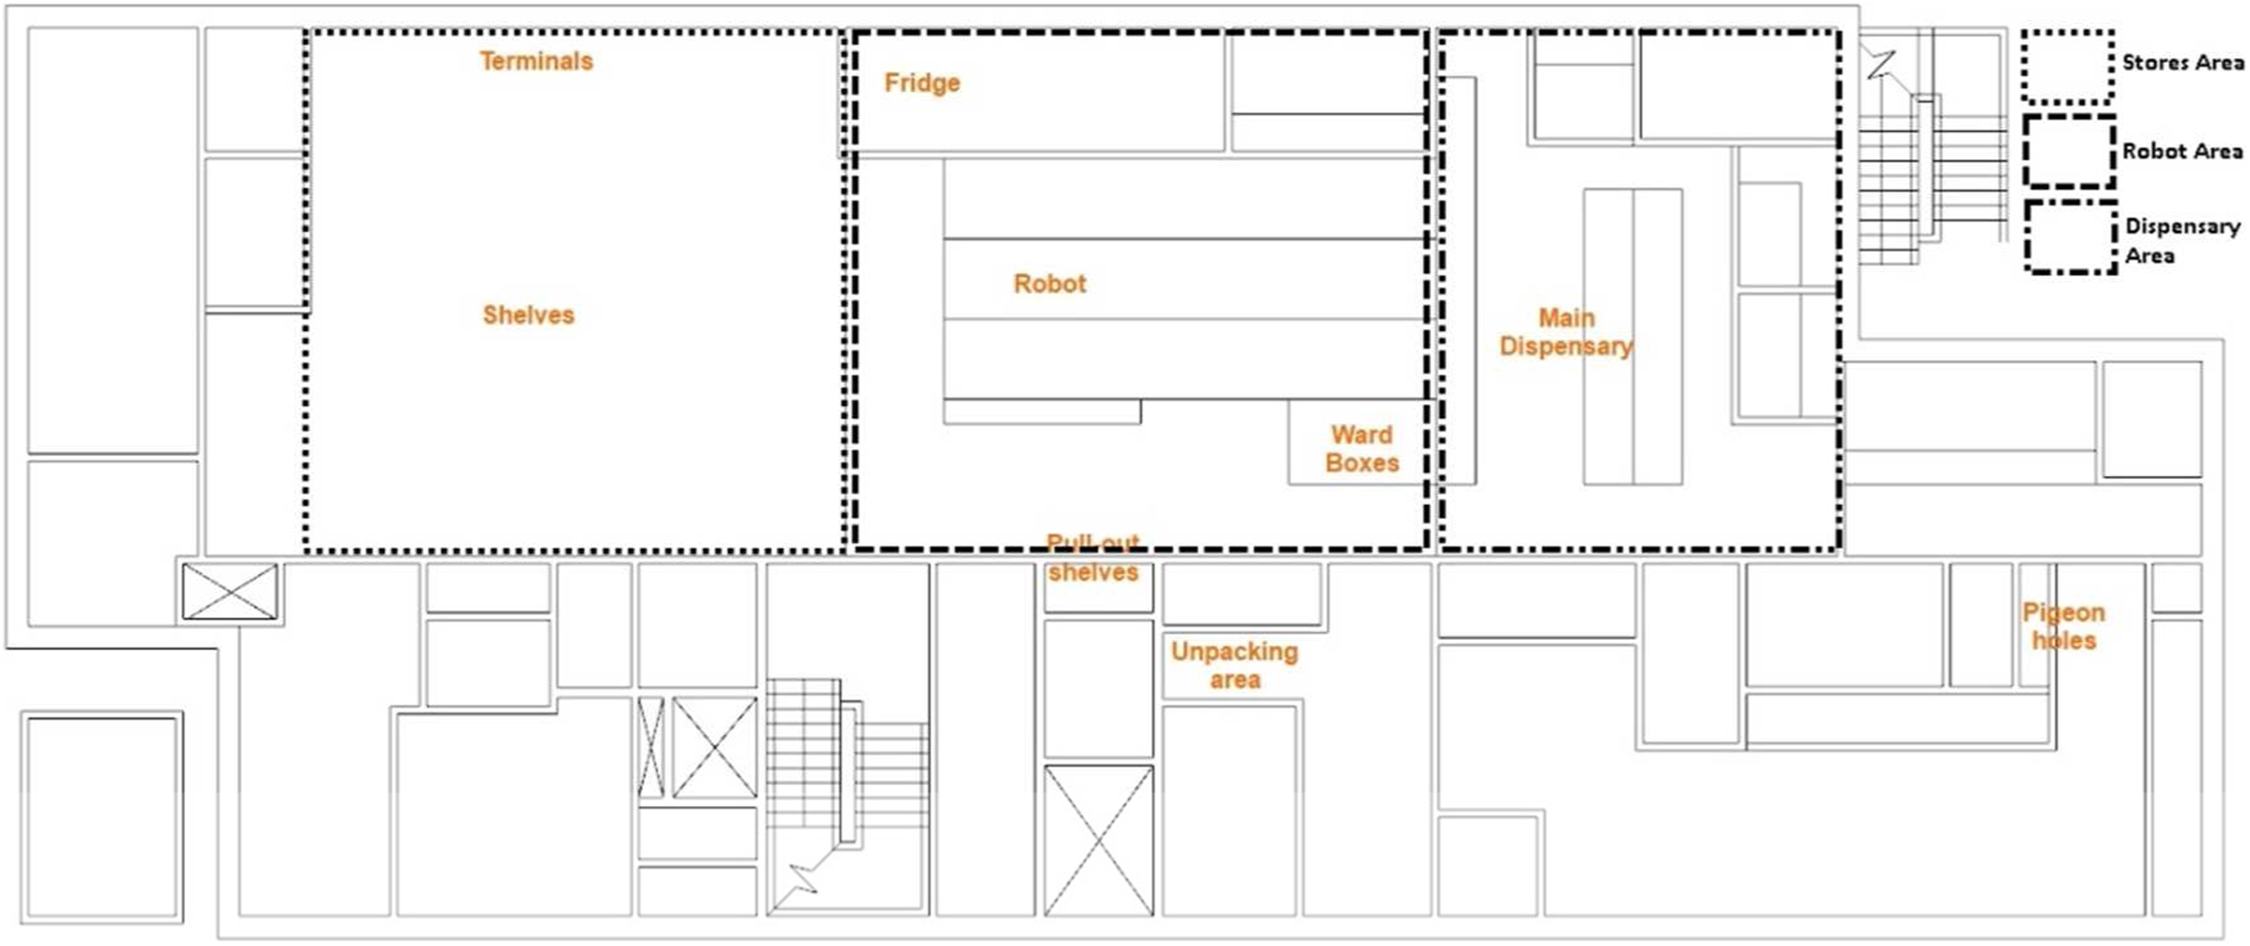
The pharmacy department for this hospital has been adapted over the years to include new technologies to optimize the pharmaceutical process, the most notable of which is the introduction of robotic dispensing. As a result, many of the processes undertaken within the department have evolved around the use of the robot and the layout is potentially no longer optimal for the work of the teams. Figure 1 shows the current design and layout of the department, with a clear division between the two key staffing teams (split into the Stores Team and Dispensary Team).
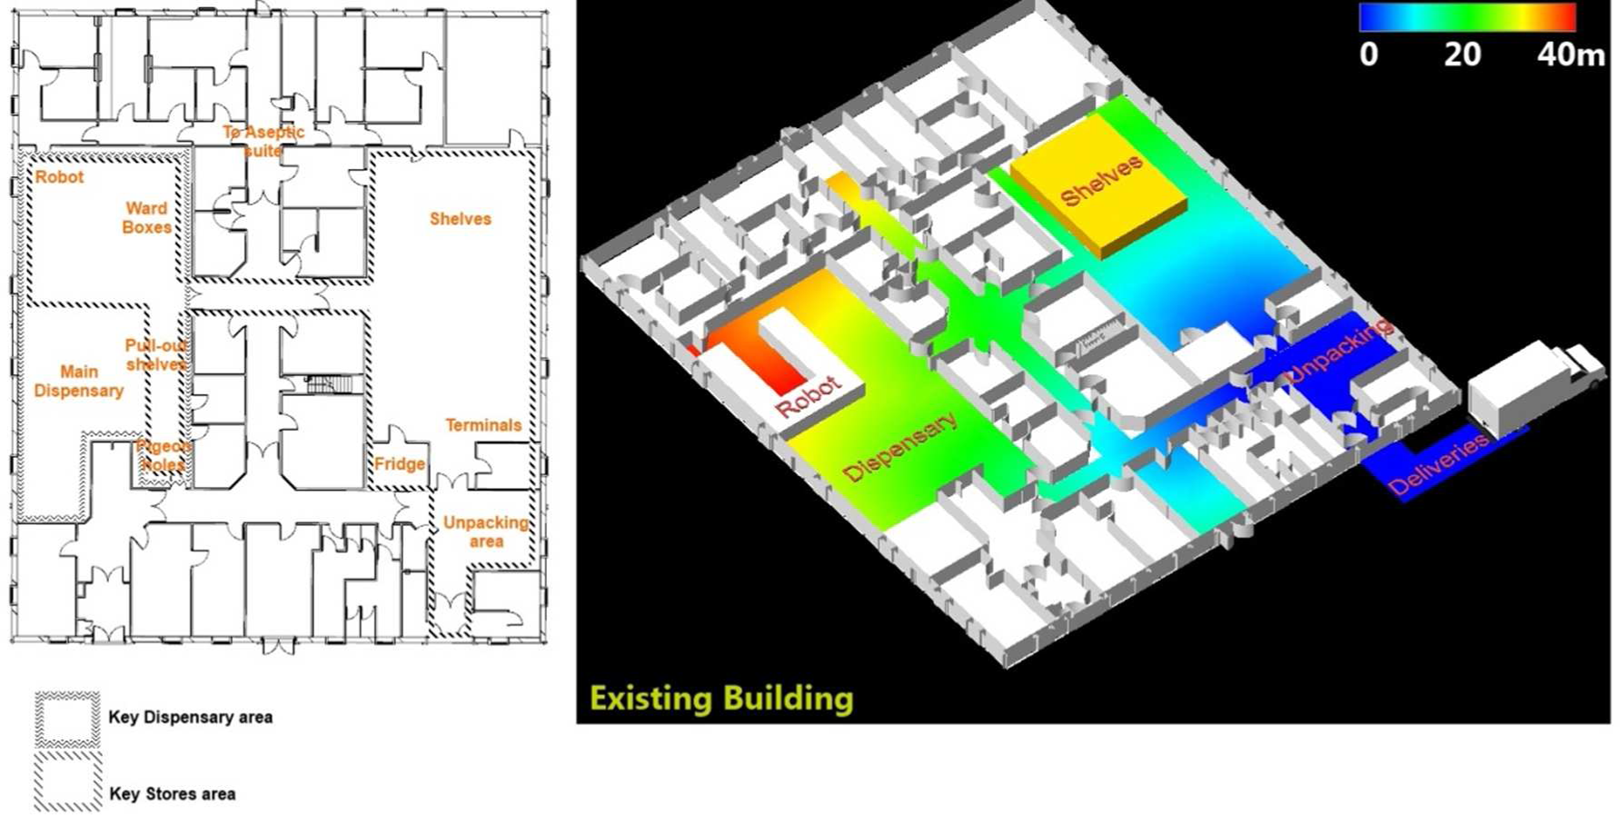
Existing pharmacy design (left) and distance map from the deliveries door (right).
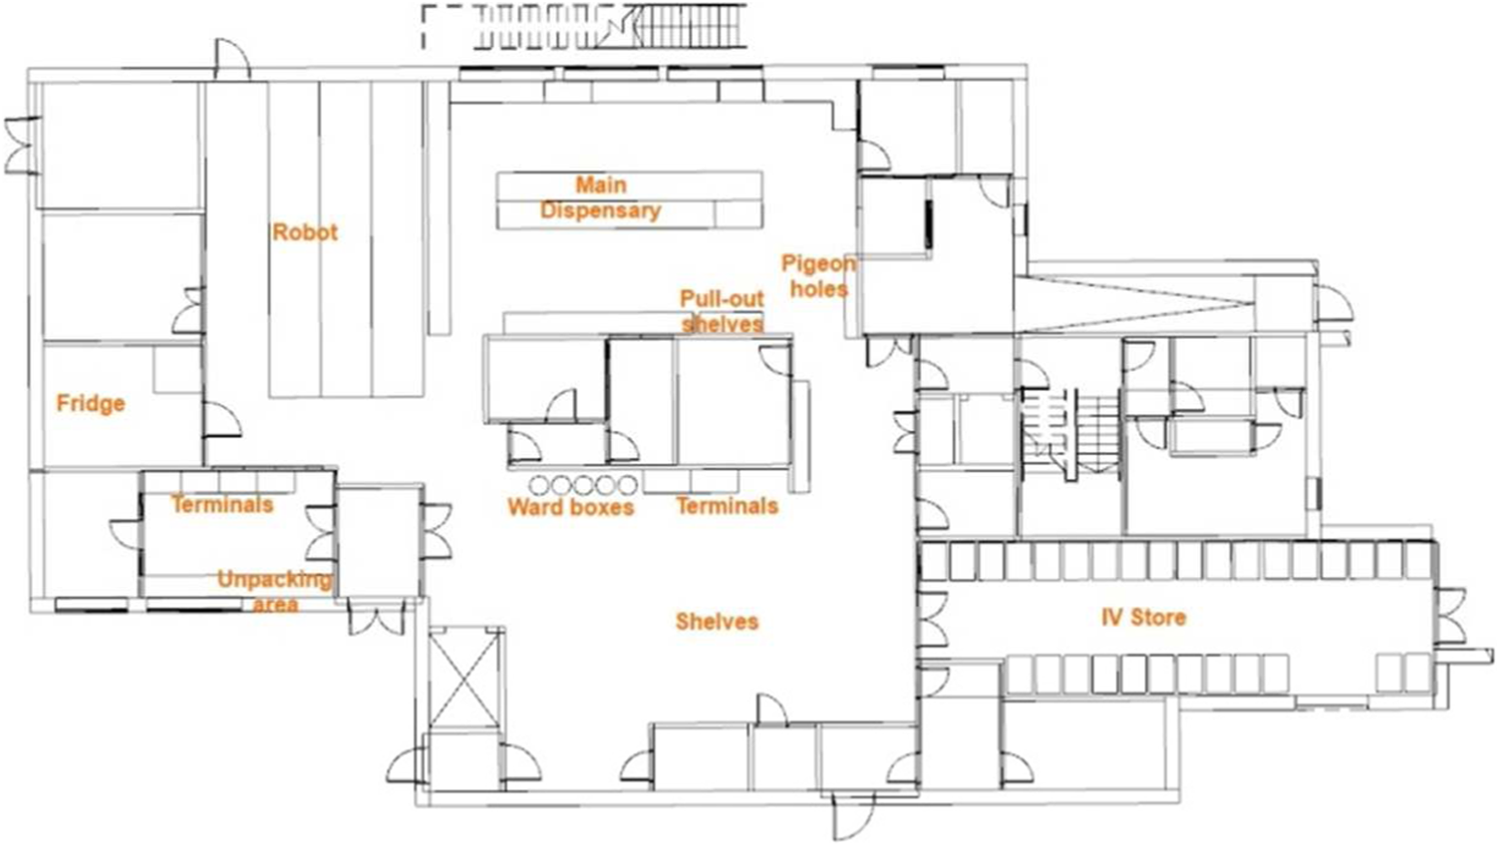
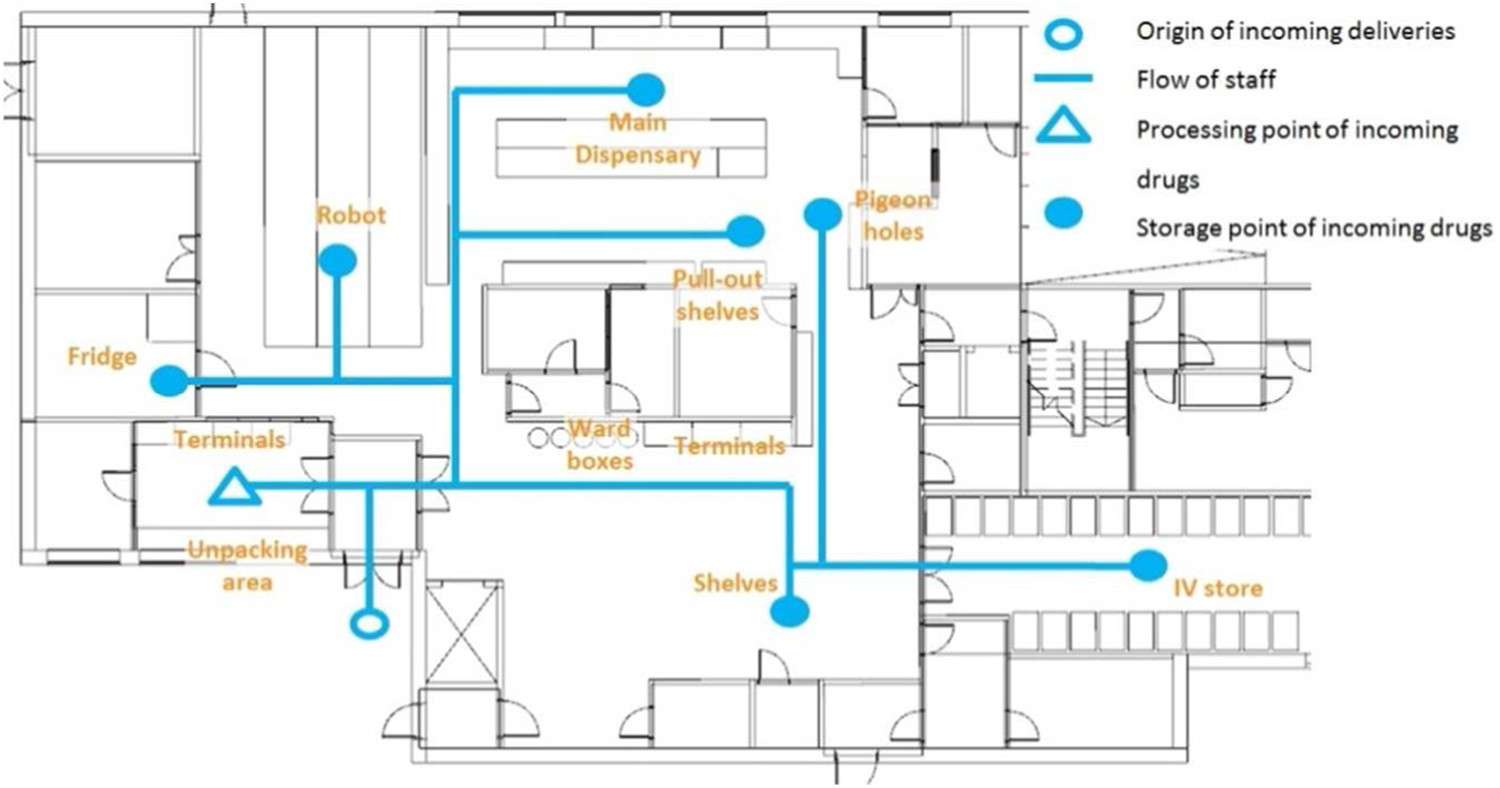
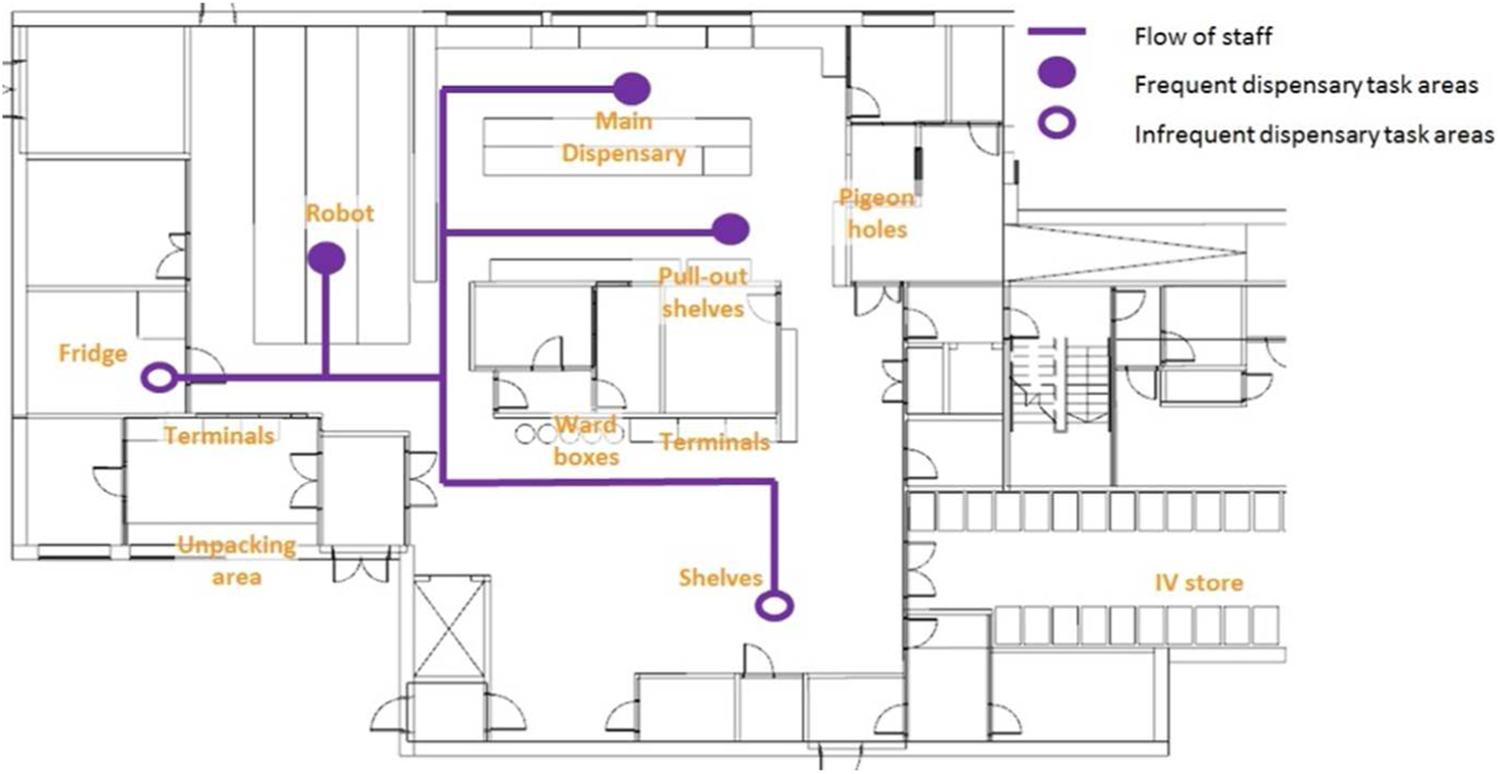
The estate directors, along with those working in the department, reported that there were some large inefficiencies in the way the Stores team were working as a result of the evolved processes following the introduction of the robot. The process undertaken by Stores staff is distributed across key areas around the department (as seen in Figure 2), while the work process for Dispensary staff focuses primarily on the Main Dispensary area with occasional tasks in the stores room (as seen in Figure 3). The division between the two staffing teams is clearly visible, with the Dispensary team dominating the left sections and the Stores team dominating the right. However, following the introduction of the robot, these divisions have become less pronounced, with the Stores Team branching out further into the Dispensary area to achieve their tasks.
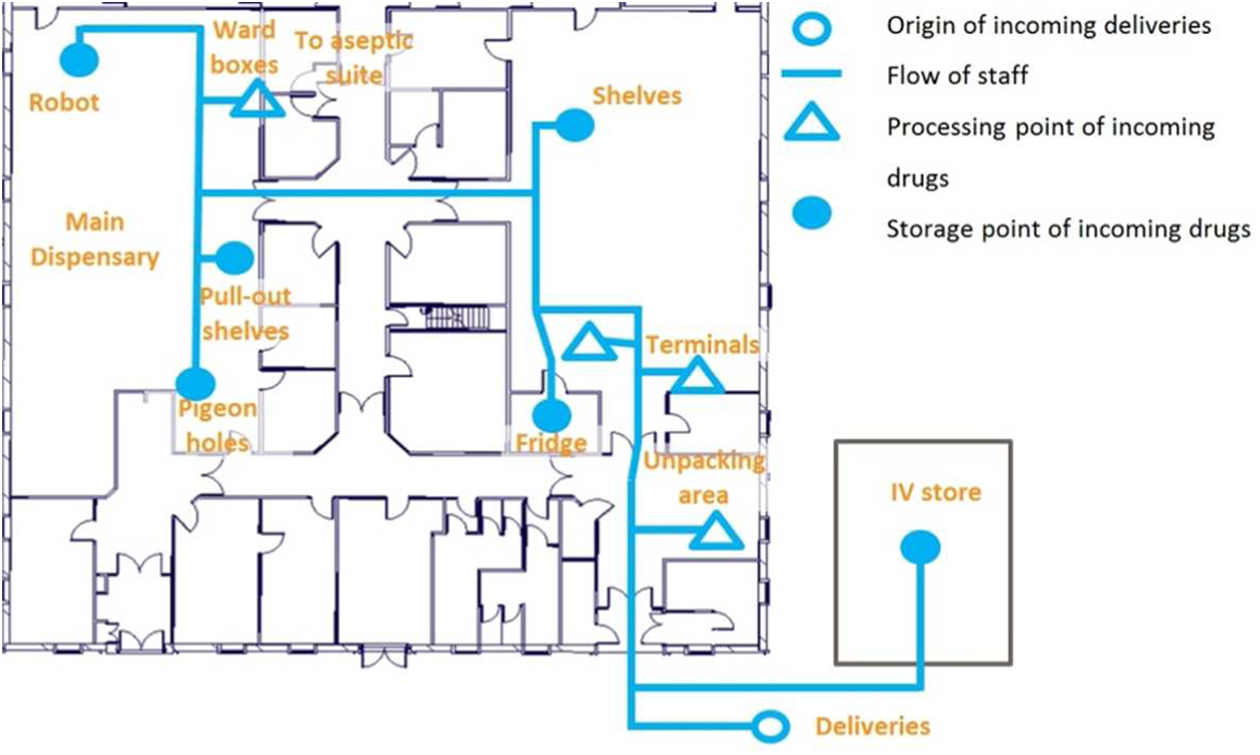
Task areas for Stores staff.
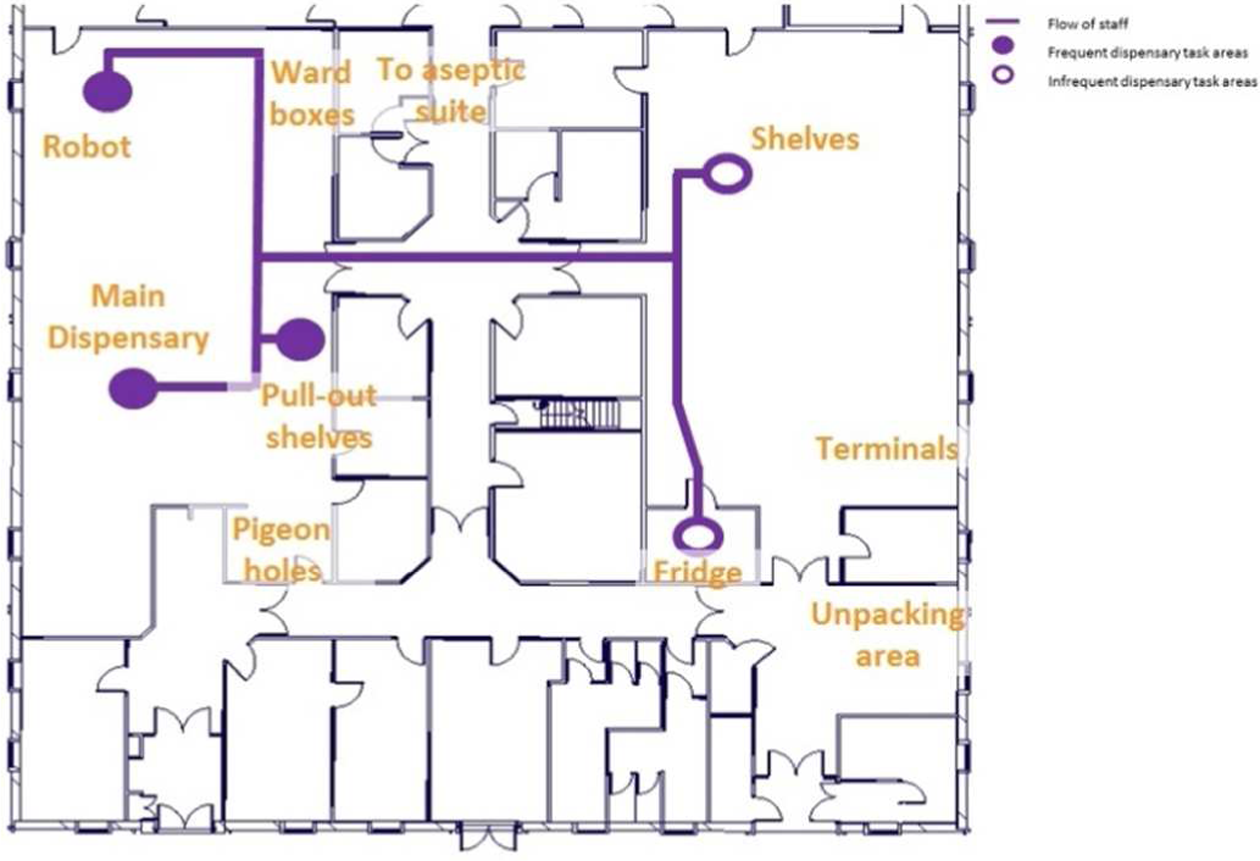
Task areas for Dispensary staff.
Method
In order to understand the current operations, processes, and activities in the pharmacy department, data capture of the staff movements was necessary. Due to the ongoing operations of the Pharmacy, the days which the researchers were permitted to observe were restricted. Two days of the week highlighted as being “busy” by the Stores manager were selected for observations of the department. This allowed the researchers to gather the maximum amount of data possible working within the restrictions and with minimal intrusion to limit disruption to the department. The use of action research through observations was selected as the most useful method, as it allowed the researchers to gain a better understanding of the processes of the department which may have been oversimplified if interviews or questionnaires had been used (Maiden & Rugg, 1996; Paetsch, Eberlein, & Maurer, 2003). Interviews or questionnaires may also have produced idealized versions of the tasks undertaken from the staff involved which may have skewed the results of the study. As the results of this study were intended to have a real-world purpose in the optimization of the pharmacy department, accurate data obtained by the researchers firsthand were deemed to be most appropriate for the analysis rather than the potentially idealized or incomplete versions gathered from staff perceptions.
The team set up five video cameras to record the movements of staff in key areas of the department (Figure 4 and Figure 5) over the course of 2 days, a Monday and a Wednesday. Monday was highlighted as a busy day by the Stores manager, it being the day when the majority of bulk deliveries arrived for sorting, with Wednesday having a large number of smaller deliveries spread throughout the day. The cameras were synchronized time wise through the use of a mobile phone time set by satellite. Further time calibrations were made following video analysis to ensure events were noted in the order they occurred.
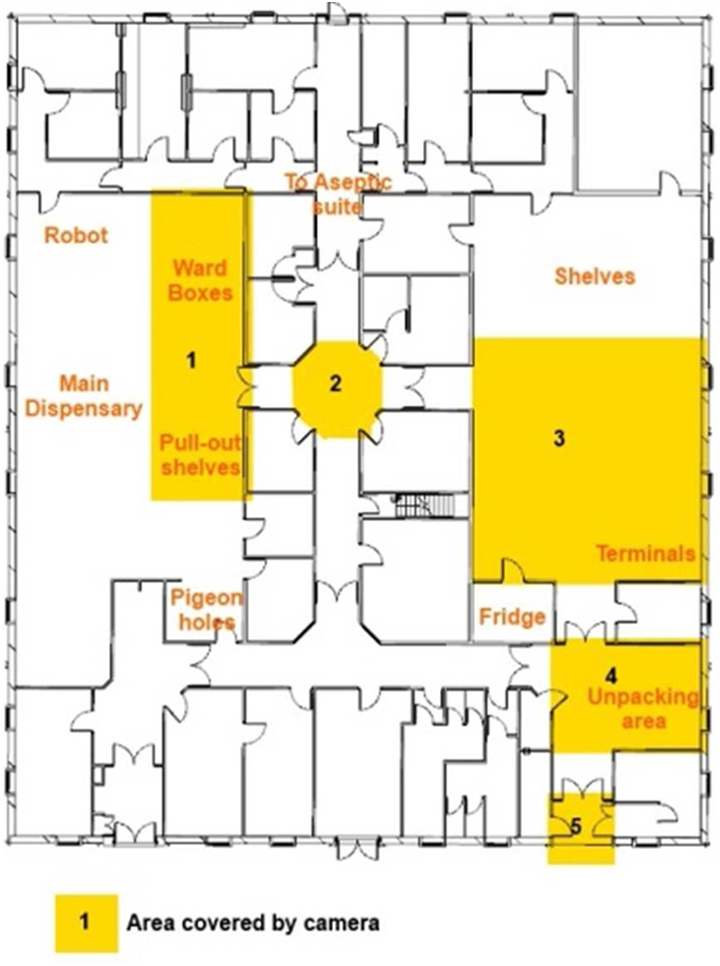
Camera locations.
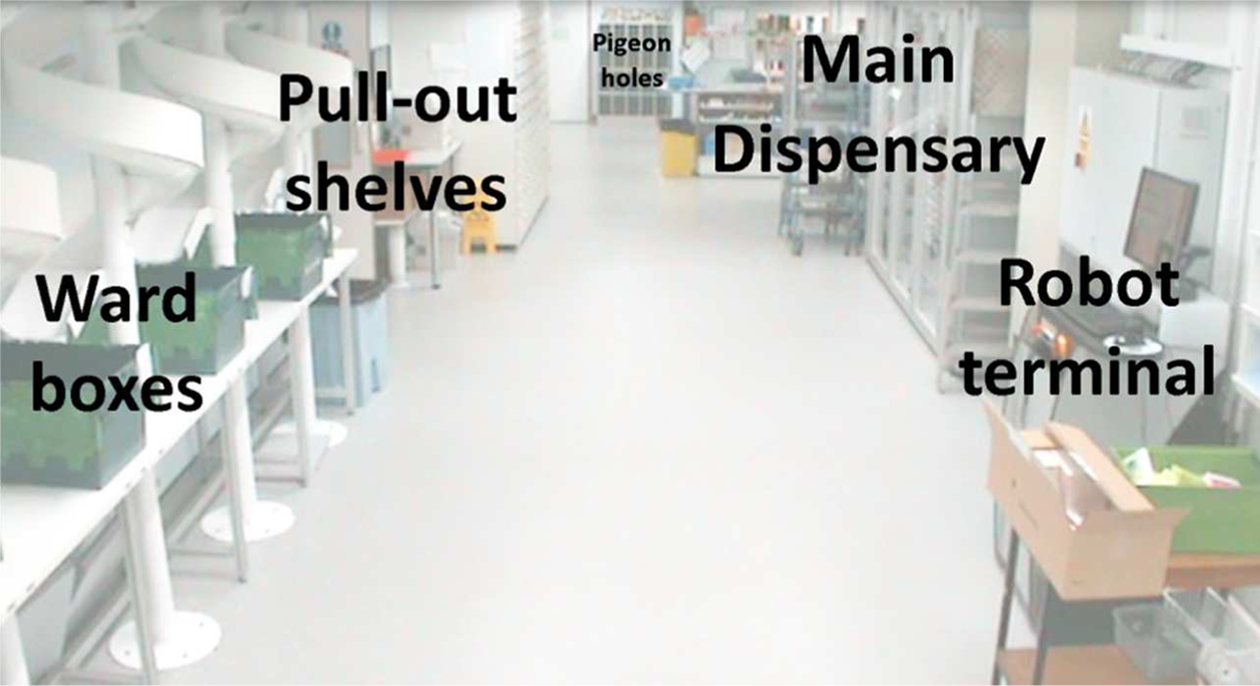
View of camera 1.
Staff members were requested (and consented) to wear colored sashes to identify which team they belonged to. Blue sashes were allocated to the Stores team, while the Dispensary team were left unsashed as they were more likely to interact with patients, and the department wished to control infection spreading through interactions and for the staff to remain professionally attired at all times. Red sashes were given to the Aseptic team, which operates from the rear of the department but share common walkways with the teams being investigated, so it was key to distinguish them from the unsashed Dispensary team.
Anonymity of staff during the study was ensured through careful control of the video recordings made across the two days. Staff were informed prior to the beginning of the study that data collected would be anonymized during analysis and reports. Only members of the project team had access to the video equipment and footage. Following completion of each day’s recording, the footage was transferred to a secure external hard drive and erased from the camera storage systems. This external hard drive was then secured in a locked cabinet to which only members of the research team had access. In reports made to the Trust following the completion of the project, where still imagery was taken from the footage to aid understanding, participants’ defining features were blurred to prevent identification. During analysis of the footage, anonymous staff IDs were used to prevent staff being named within data capture logs. On completion of the study, all footage were deleted from the external hard drive.
Staff were allowed to go about their daily duties unhindered, with cameras being placed as out of the way as possible to minimize disruption to the department. Staff were briefed as to the presence of researchers in their morning “huddle,” and interaction between the researchers and staff was limited to discussions with the Stores manager at the end of each observation day. The researchers worked in rotational shifts observing around the department, taking detailed notes to help their understanding of the processes observed but ensured they never blocked or hindered access to pharmacy functions for the staff members.
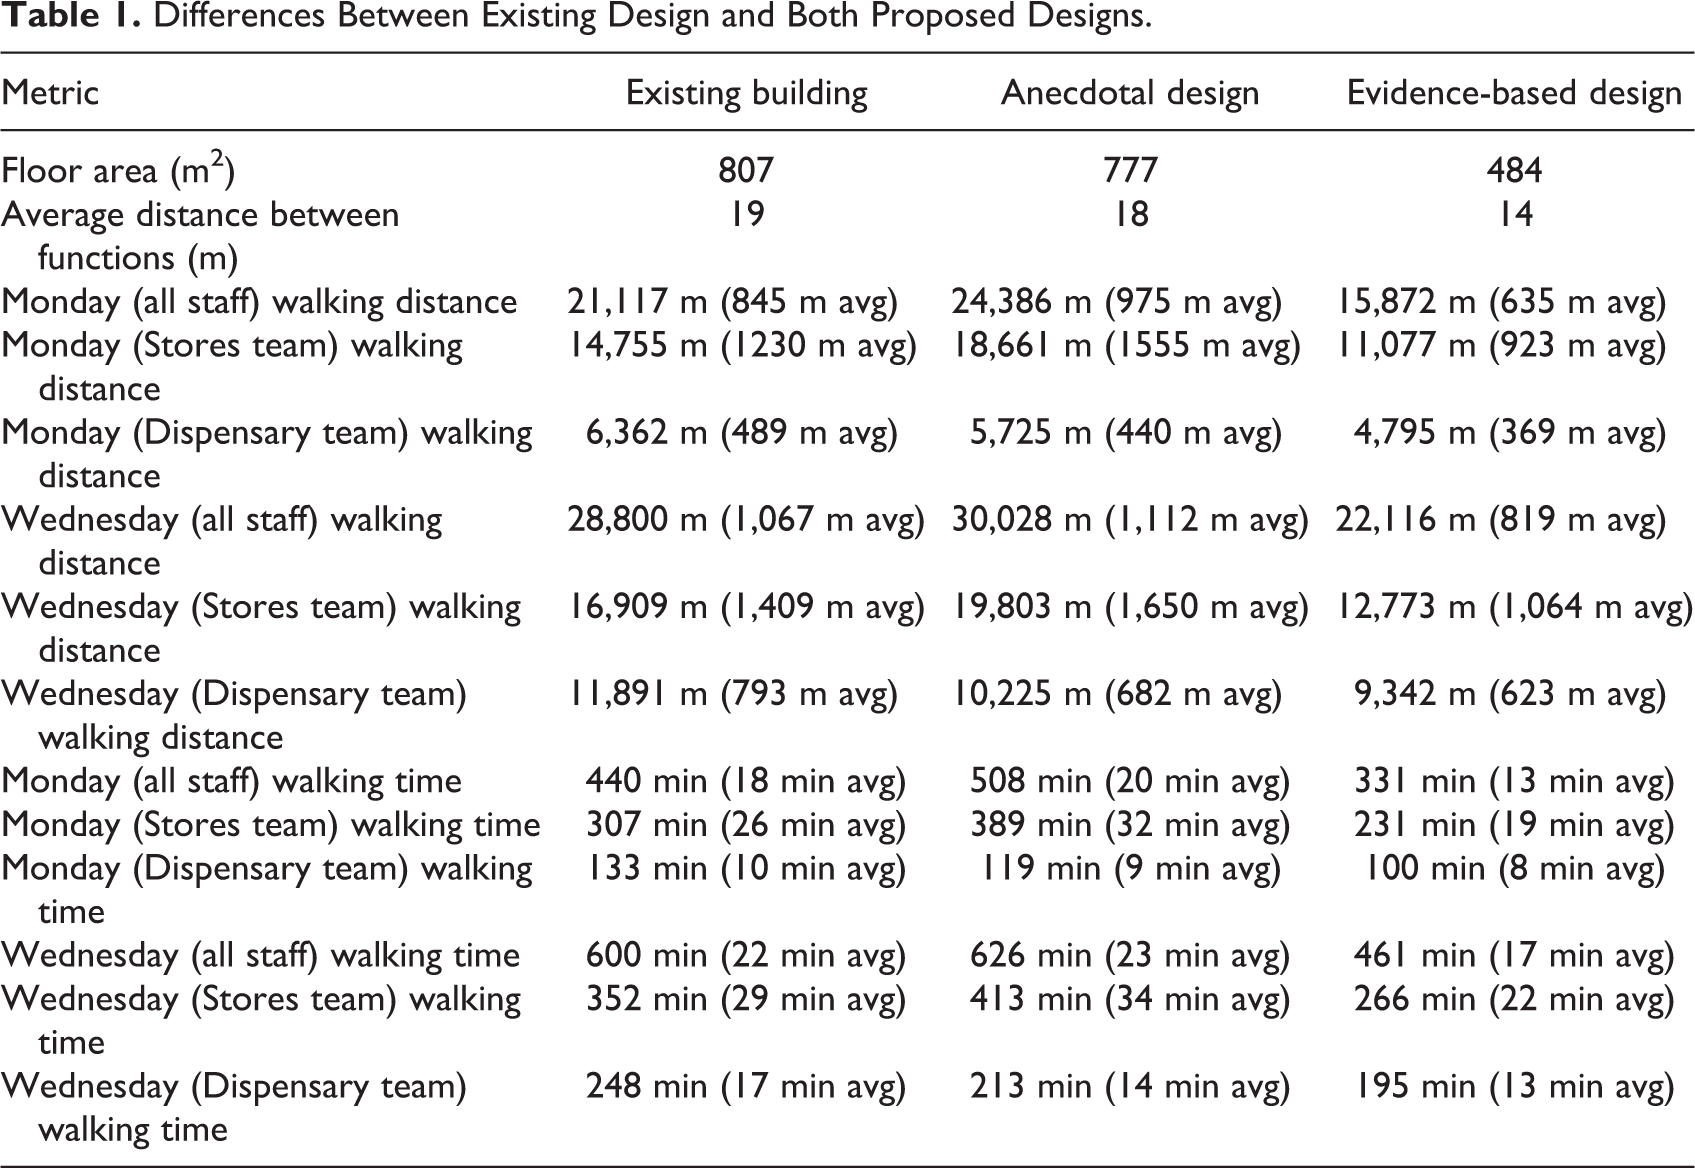
The videos were analyzed manually by the research team, and the movements of each staff member were noted from which a frequency analysis was created (Figure 6). The distance between each function is shown in Figure 7. Each staff member was uniquely identified by the research team during video analysis allowing for their movements for the day to be tracked which gave the causal movements for each member of staff. Using this raw data, a simulation model was produced using BuroHappold’s 3-D agent-based simulator SmartMove, replaying the 2 days’ events for analysis. Using an approximation from the videos, an average walking speed of 0.8 m/s was identified for staff which, when combined with the frequency matrices and distance matrices, led to the total amount of time staff spent walking around the pharmacy department (Table 1). As anonymity and privacy of the staff was a concern during the study, the distances and times shown are aggregates for all staff in the teams.
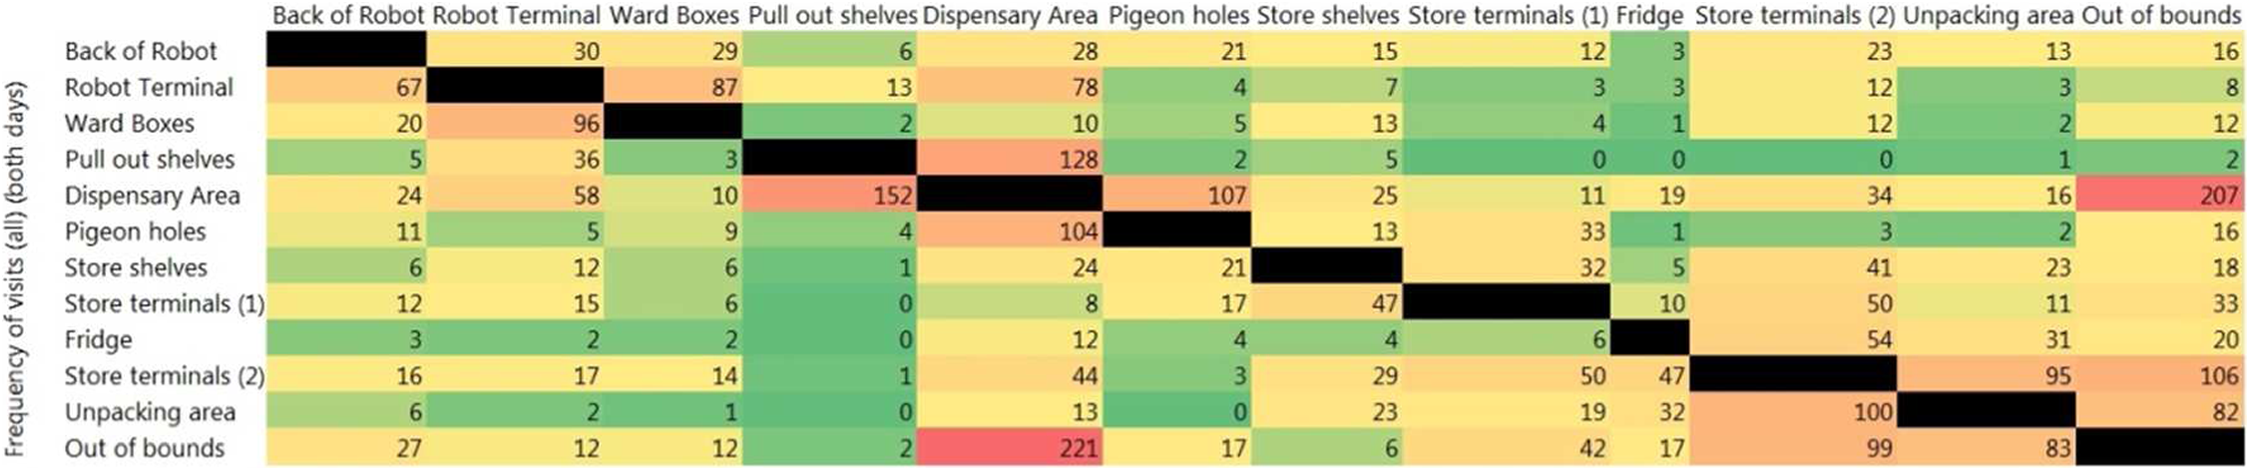
Frequency of movements across both days.
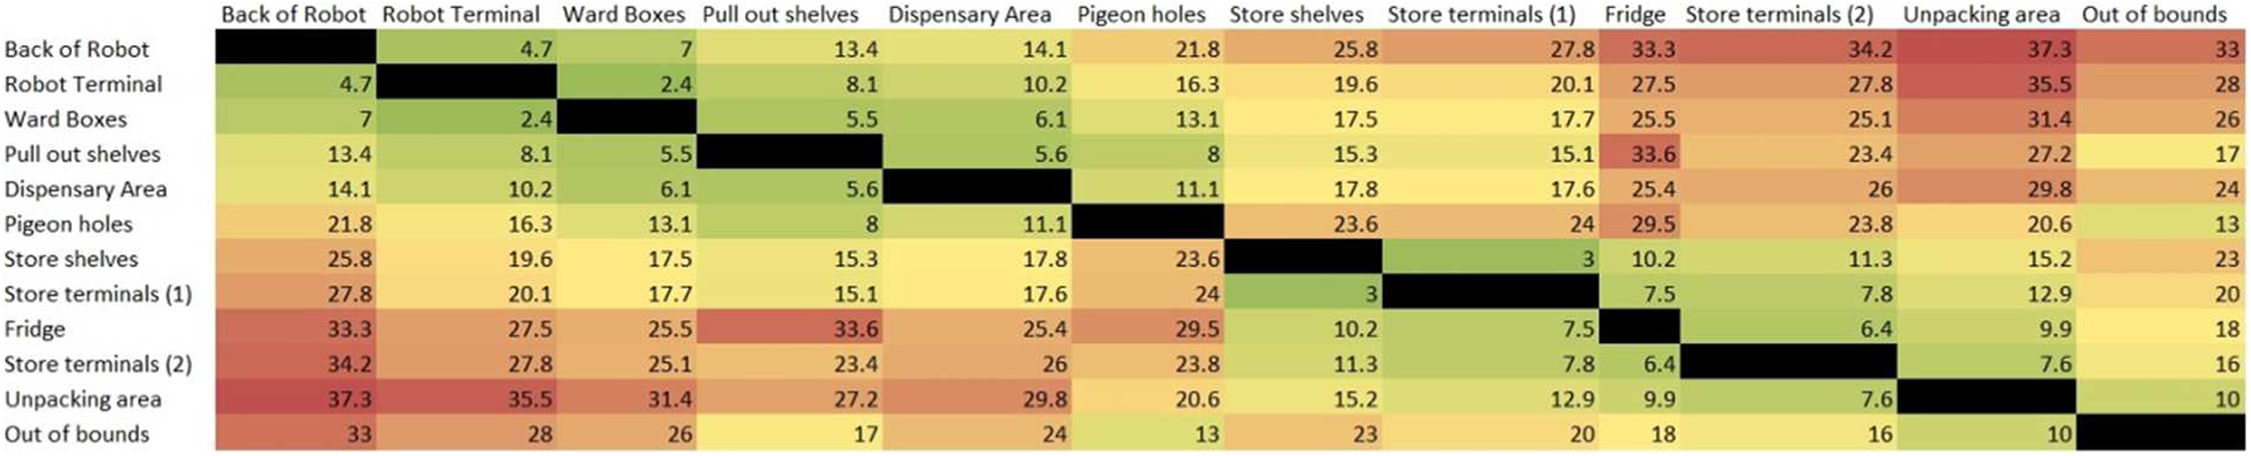
Distance between functions (meters).
Differences Between Existing Design and Both Proposed Designs.
Results
From the video analysis, 1,494 movements between functions were recorded on the first day and 1,984 on the second (totaling 3,478 movements across both days). From this, the researchers were able to draw conclusions as to which pairs of functions were closely related with respect to the process of tasks. It was found that there were strong process relationships between Store-related functions and functions primarily believed to be used most by the Dispensary team. The frequency matrix highlighted that a large proportion of staff movements were made between the ward boxes and key robot functions and between the unpacking location with key store functions.
Prior to the data collection phase of the study, it was the belief of the stakeholders that the main inefficiency was caused by the location of the robot, situated in the heart of the Dispensary areas. It was felt that the robot should serve as an interface between the Stores team and the Dispensary team, and as such, an initial design was produced by the architects (Figure 8), which placed the robot as the central function. This anecdotal design was produced following the architects’ discussions with the Trust and the heads of both the Stores and Dispensary teams, where processes directly associated with the robot were reported as a central part of the work of both teams, which were conveyed and implemented into the anecdotal design. This design was analyzed by the researchers using the data collected from the existing layout to predict the differences in walking time, walking distance, and resulting efficiency (Table 1).
Initial design based on anecdotal evidence from staff and stakeholders.
Although the design was smaller in total area (reduced by 29.5 m2), the predicted distance and time spent walking by the staff increased by 9%. While the design achieved potential monetary savings from a smaller floor area, there was a predicted increase in nonproductive time by the Stores team undertaking their tasks, outweighing the decrease in nonproductive time attributed to the Dispensary team. As seen in Table 1, the total walking distances and walking time across all staff were measured to have increased in this anecdotal design.
Following a discussion of the findings with the Trust responsible for the pharmacy and the architects, highlighting the observed interface and movements of staff between functions in the Stores area and those which were believed to be used most by the Dispensary team, a new design was developed (see Figure 9). Examples of pairs of functions that were found to have a high frequency of movement between them include the pull out shelves and store terminals and between the pigeonholes and store terminals. To create a stronger interface between the Stores and Dispensary working areas, the robot was moved away from its centralized position This new design places pairs of functions which had a high frequency of movements between them closer together, such as the unpacking area with the second set of store terminals. while still allowing Dispensary terminal access and closer access to the back of the robot for the Stores team. In this design, 65% of functions have been moved closer together, of which they are 11 m on average closer together (Figures 10 and 11).
To create a stronger interface between the Stores and Dispensary working areas, the robot was moved away from its centralized position
Evidence-based design following study.
Stores work area in the proposed design.
Dispensary work area in the proposed design.
The analysis of this design (results in Table 1) showed a reduction in the walking time and distance by 24% for both the Stores staff and Dispensary staff. Dynamic simulation, using SmartMove, of the staff activities was used to verify the predictions and confirmed that tasks would be completed in three quarters of the time it takes in the existing design.
Conclusion
This study has demonstrated the use of an evidence-based approach to optimize proposed healthcare facility designs for key aspects of efficiency and well-being. It has highlighted the dangers of anecdotal designs based on perceptions without evidence. In this case study, the anecdotal design had a predicted increase in walking time and distance of 9% by placing the robot as the central focus, pushing functions with high adjacencies further apart. The evidence-based design has predicted a decrease of 24% in walking time and distance for staff, bringing commonly linked functions (such as the store terminals and pull out shelves) closer together. It is predicted to save 238 min from this 2 days of evidence-based design, as opposed to an increase of 194 min in the anecdotal design. It is proposed that these efficiency gains will also improve staff morale, by reducing fatigue over the busiest days in the pharmacy department. The differences between the three designs are shown in Table 1.
Discussion
By obtaining evidence of the current situation in the pharmacy department, recommendations were able to be made with regard to the design of the new building. This article has shown the process taken and the improvements made between the three designs (Table 1). Predicted key gains for the pharmacy department include the reduction in “wasted” time spent walking between tasks, reduced from 49,917 m in the existing layout to 37,988 m in the proposed layout across the 2 days analyzed, saving just under 12 km across all staff in walking distance. This equates to an approximate saving of 248 min. The majority of these savings are attributed to the Stores team who are currently the ones making lengthy journeys to functions currently housed in the Dispensary area. While the anecdotal design made improvements for the Dispensary staff, the evidence-based design makes improvements for all staff members, reducing the walking distance by approximately 457.36 m across all staff members over the 2 days recorded.
Predicted key gains for the pharmacy department include the reduction in “wasted” time spent walking between tasks
The use of video analysis helped inform the estate directors and pharmacy managers how their department was operating, shifting focus from the robotic dispensary equipment toward a more integrated layout between the Stores team and the Dispensary team. It highlighted how even managers who work alongside their teams may not fully appreciate the working processes undertaken by their teams. This was highlighted best with the use of action research by the team collecting the data and analyzing it with an outsider’s viewpoint. This also allowed efficiency gains to be made before the new building design was finalized as, without this evidence-based work, the Trust may have opted for the anecdotal layout, without realizing the downsides of this.
The use of video analysis helped inform the estate directors and pharmacy managers how their department was operating
The use of evidence-based design in healthcare buildings should prove an asset to trusts wishing to make the best use of their space at minimal cost; however, gathering the evidence can take a lot of work. The video analysis gave the team the best data available with minimal intrusion to the department. Interviews and questionnaires would have been cheaper and quicker methods of data collection, but the reliability of the data may have been compromised. The order in which staff conduct tasks over a working day may not be accurately remembered by the staff member being interviewed, and the number of trips between functions would be difficult to obtain. Other techniques considered by the team included the use of radio-frequency identification (RFID) tagging for the staff members, which provided great effect in recording the movement of neonatal intensive care unit nurses (Greenwood, Sharma, & Johansson, 2015), but it was decided that the size and scope of this project did not warrant the extra cost of the RFID equipment. Perhaps if the study had been conducted over a longer time frame, then RFID tagging would have been beneficial.
The video analysis used in this study was the biggest time factor for the researchers, as this was done manually over the course of several days. Further work branching from this study could be to develop techniques for automating the data capture process, where video analysis is deemed to be the best course of action. Although such techniques were utilized in the analysis of nursing home observations (Hauptmann et al., 2004), they were limited in uses outside of that study due to the computer vision tools being specifically trained for the purposes of that study.
At the time of writing up this study, the new pharmacy department is in the process of being constructed. Once construction is complete and the building has been used for a period (to account for the potential “honeymoon effect”), a postoccupancy study would be worthwhile to understand the actual benefits of the evidence-based design versus the predicted benefits.
Limitations
One of the biggest limitations of this study is the human element in observing the pharmacy staff going about their work. There have been numerous studies conducted on the effect that the feeling of being observed can have on the actions of humans (Bateson, Nettle, & Roberts, 2006; Burnham & Hare, 2007; Ernest-Jones, Nettle, & Bateson, 2011). The feeling of being watched experienced by the pharmacy staff was limited by the use of video cameras; however, it should be noted that the possibility of the staff altering how they underwent their tasks may have occurred. The research team tried to account for this by ensuring the video cameras were kept out of the way and the team themselves remained hidden and unobtrusive to allow the pharmacy staff to relax and continue their normal working procedures. Selecting the two busiest days for analysis kept the pharmacy staff busy dealing with deliveries, diverting attention from the observations.
This research did not specifically focus on and process the effect of efficiency on individual staff. The negative outcomes of excessive walking, such as lowered cognitive function and fatigue, may be mitigated with the proposed, evidence-based, design, potentially increasing staff well-being and reducing the chance of fatigue-induced mistakes. These potential benefits, though implied through the research, were not explored as they were out of scope of the original research purpose. However, it is recommended that further research should explore the effect of the reduced walking distances in the proposed design on the individual staff members following a postoccupancy study.
The floor area between the existing design and the evidence-based design is a reduction of 322.8 m2 which may be a contributing factor to the reduction in the distance between functions. However, the findings suggest that the use of evidence-based design to highlight which functions should be closer together helped reduce this floor area by removing the split of functions in Stores area and Dispensary area, thus reducing the amount of space needed to house all of the functionality of the pharmacy department.
Due to the nature of the Pharmacy’s workings, the research team was restricted to only being able to observe the work processes over a 2-day period. It is also the nature of industrial projects that move along at a faster pace than academia would like, which put additional time constraints on the research project’s completion. Due to these restrictions, the research team opted to observe on the busiest working days (as defined by the Stores manager) to allow for a “worst-case” scenario to be identified and analyzed.
Finally, the efficiency gains highlighted in this article were produced based on real data from the existing building and simulated on the proposed design rather than seen occurring in person. While the data are as accurate as possible and provide reliable representation of staff movements, some movements may have been missed either through bad camera placement not picking up certain areas of the stores or through human error in the data collection. It should be noted that the efficiency gains reported for the proposed design relies on the processes of the staff remaining the same. Similarly, any additions or advancements in technology within the department may also impact on the efficiency gains of the proposed design. The data collection period only lasted 2 days which were highlighted to be particularly busy with deliveries. As such, quieter days may see less of an improvement than that reported, but with 65% of functions now being closer together, even quiet days should see some improvement in efficiency.
Implications for Practice
Evidence-based design, by incorporating the needs and workflows of the end users, is shown to offer operational efficiency improvements for healthcare design.
This case study highlights the significance of using people-centered design in ensuring new buildings fit in with the workflows of end users.
This case study also highlights methods of measuring people movement for use in evidence-based design.
The time lost by staff through extended walking distances between functions is shown to quickly add up to account for nearly 25% of working time. The anecdotal design decreased efficiency by a further 9%. This highlights the benefits of using evidence-based design principles during projects as opposed to relying on anecdotal testimony.
Footnotes
Declaration of Conflicting Interests
The author(s) declared no potential conflicts of interest with respect to the research, authorship, and/or publication of this article.
Funding
The author(s) disclosed receipt of the following financial support for the research, authorship, and/or publication of this article: This work would not have been possible without funding from the Engineering and Physical Sciences Research Council (EPSRC) and BuroHappold Engineering Ltd.