
Abstract
Visibility enables or prohibits healthcare professionals’ ability to monitor, control, or manage situations in healthcare settings. Visibility has a significant impact on patient safety, including patient fall rates and mortality rates, and on the performance of healthcare professionals, including situational awareness and communication. This article provides a conceptual visibility framework synthesizing visibility analysis models, tools, and metrics. The framework uses four dimensions that capture the experiential phenomena of users, such as visual relationships between specific sets of users/targets, how the orientation of the seeing entity changes visibility patterns, and the unequal visibility levels of seeing and being seen. The framework particularly focuses on how the layout and the resulting patterns of visibility reflect and influence the user experience and organizational functions. By illustrating the similarities and differences of various models in the framework according to the dimensions, this article describes how various visibility analysis models, tools, and metrics can be applied to design and research.
The importance of visibility has long been recognized since the end of the 18th century when the utilitarian philosopher Jeremy Bentham proposed the Panopticon prison design: The guards could clearly see the prisoners while the prisoners’ views of the guards were often obscured (Bentham, 2008). Visibility, being able to see (or being seen by) space, other people, or objects (Lim, Kim, & Zimring, 2019), significantly affects individual experiences and behaviors, and its importance in healthcare settings is even more critical. Visibility has a significant association with patient safety, such as patient fall rates (Choi, 2011; Pati et al., 2019), mortality rates (Leaf et al., 2010; Lu et al., 2014; Ossmann, 2016), and with the performance of healthcare professionals, including hand hygiene compliance (Nevo et al., 2010), situational awareness (Cai & Zimring, 2012; Gunn et al., 2015), communication (Gharaveis et al., 2018; Gharaveis, Hamilton et al., 2019; Gharaveis, Shepley, et al., 2019; Lim et al., 2019; Lu & Zimring, 2012), and teamwork (Gharaveis et al., 2018; Gharaveis, Hamilton, et al., 2019; Gharaveis, Pati, et al., 2019; Stroebel et al., 2019).
There has been a significant effort to understand the visibility determined by layout that enables researchers and designers to investigate the impact of the built environment on individual and organizational outcomes. Various analysis methods and tools are used in healthcare settings to capture diverse aspects of the spatial and visual attributes (Haq, 2018; Haq & Luo, 2012; Sadek & Shepley, 2016). Many researchers have contributed to the development and refinement of various models and tools for the general description of visibility in relation to the whole space, such as Isovist (Benedikt, 1979), visibility graph analysis (VGA; Turner et al., 2001), and visual access and exposure (VAE; Archea, 1984).
There are also situations, especially for strong program settings such as courtrooms or hospitals (Hillier et al., 1984), where users have specified roles and locations. For instance, in an intensive care unit (ICU) setting, nurses have specific people they need to see—patients—and patients have specific people they want to be seen by—nurses or providers. Several studies have developed tools that can analyze the visibility of specific agents or subjects. For instance, the Spatial Positioning Tool (SPOT) focuses on the specific location of agents (Markhede et al., 2010), the targeted visibility model specifies the location of targets (Lu & Peponis, 2014; Lu & Zimring, 2012), and the agent visibility analysis (AVA) model measures interpersonal visual relationships among various entities (Lim et al., 2019).
Spatial analysis approaches, including Space Syntax, have been developing for the last 40 years and have been applied to healthcare settings since the 1990s (Haq & Luo, 2012). Such studies in healthcare settings not only investigate relationships between layout and dependent variables but also develop new and composite variables for their focus (Haq, 2018). Sadek and Shepley (2016) reviewed existing and newly developed tools for a comprehensive overview of studies in healthcare settings. However, little research has focused on providing systematic structure for understanding properties of visibility that can capture continuous development of tools and metrics.
This article provides a conceptual visibility framework that captures the similarities and differences of various visibility analysis methods and tools. The framework assembles existing tools for thinking about visibility in built environments, focusing particularly on how the layout and the resulting patterns of visibility reflect and influence user experience and organizational functions. Specifically, the framework uses selected dimensions in relation to experiential phenomena of users, such as visual relationships between specific sets of users/targets, how the direction the seeing entity is facing changes visibility patterns, and the unequal visibility levels of seeing and being seen. The systematic dimensions of the framework are expected to improve applicability to real-world situations and facilities by enhancing the understanding of desired visibility relationships. The goal of this article is to make visibility analysis a more precise and accessible practice for analyzing designs for practice and research and eventually improving user experiences.
To achieve this goal, the article follows four major steps. First, it introduces important terminology used in this article. Then, the following section provides an outline of the framework and explains major dimensions of the framework that compare and contrast properties of visibility. The next section introduces existing analysis models, tools, and metrics that can analyze different aspects of visibility identified in the framework. Lastly, this article analyzes a hypothetical layout using the existing models, tools, and metrics mapped on the framework in order to illustrate how the results of visibility patterns can differ and how the framework can be applied.
Terminology for the Conceptual Visibility Framework
We provide a systematic framework that assembles existing tools to measure specific patterns of visibility for a given layout. The goal of this framework is to address how patterns of visibility determined by the layout of built environments impact all possible uses of a space over time and for a given organizational or cultural program.
It is useful to examine these terms individually. By visibility, we mean the physical potential of seeing or being seen. This article differentiates the two types of visual structure that reflect the likelihood that a person or an object that is seen will actually be noticed and acted on as possible area and likely area. By possible area, we mean visibility to or from any point in a space, even if it requires turning the head or the body to achieve a 360° cone of vision. This is defined by Benedikt and others as Isovist (Benedikt, 1979). By likely area, we mean the likelihood of a location seeing other spaces with an accumulated area of limited-angle cones of vision (i.e., viewsheds with a limited angle for clear sights) or the likelihood of a location being seen if we measure how many limited-angle cones of vision they appear in. Archea (1984) terms these likelihoods of seeing and being seen as VAE, respectively. By layout, we mean all aspects of built environments that impact visibility: the overall configuration and the shape of a space, and the design and placement of walls, furniture, windows, and curtains, and so on. For the purposes of this article, we focus primarily on a layout at the scale of a large, complex open space or the floor of a building such as an open-plan workspace or medical unit. To keep the language simple, we refer to such settings as space. By all possible uses of a space, we mean how different users or organizations might use the space over time. By a given organizational or cultural program, we mean the use of a space by a specified set of users. Some spaces within organizations, such as courtrooms or hospital wards, have a relatively narrow range of activities that occur in them and have specifically designated spaces where these activities occur. Other settings, such as an art gallery or building lobby, might allow a much wider range of activities. Peponis and his colleagues call these strong program spaces and weak program spaces (Hillier et al., 1984).
Main Dimensions of the Framework
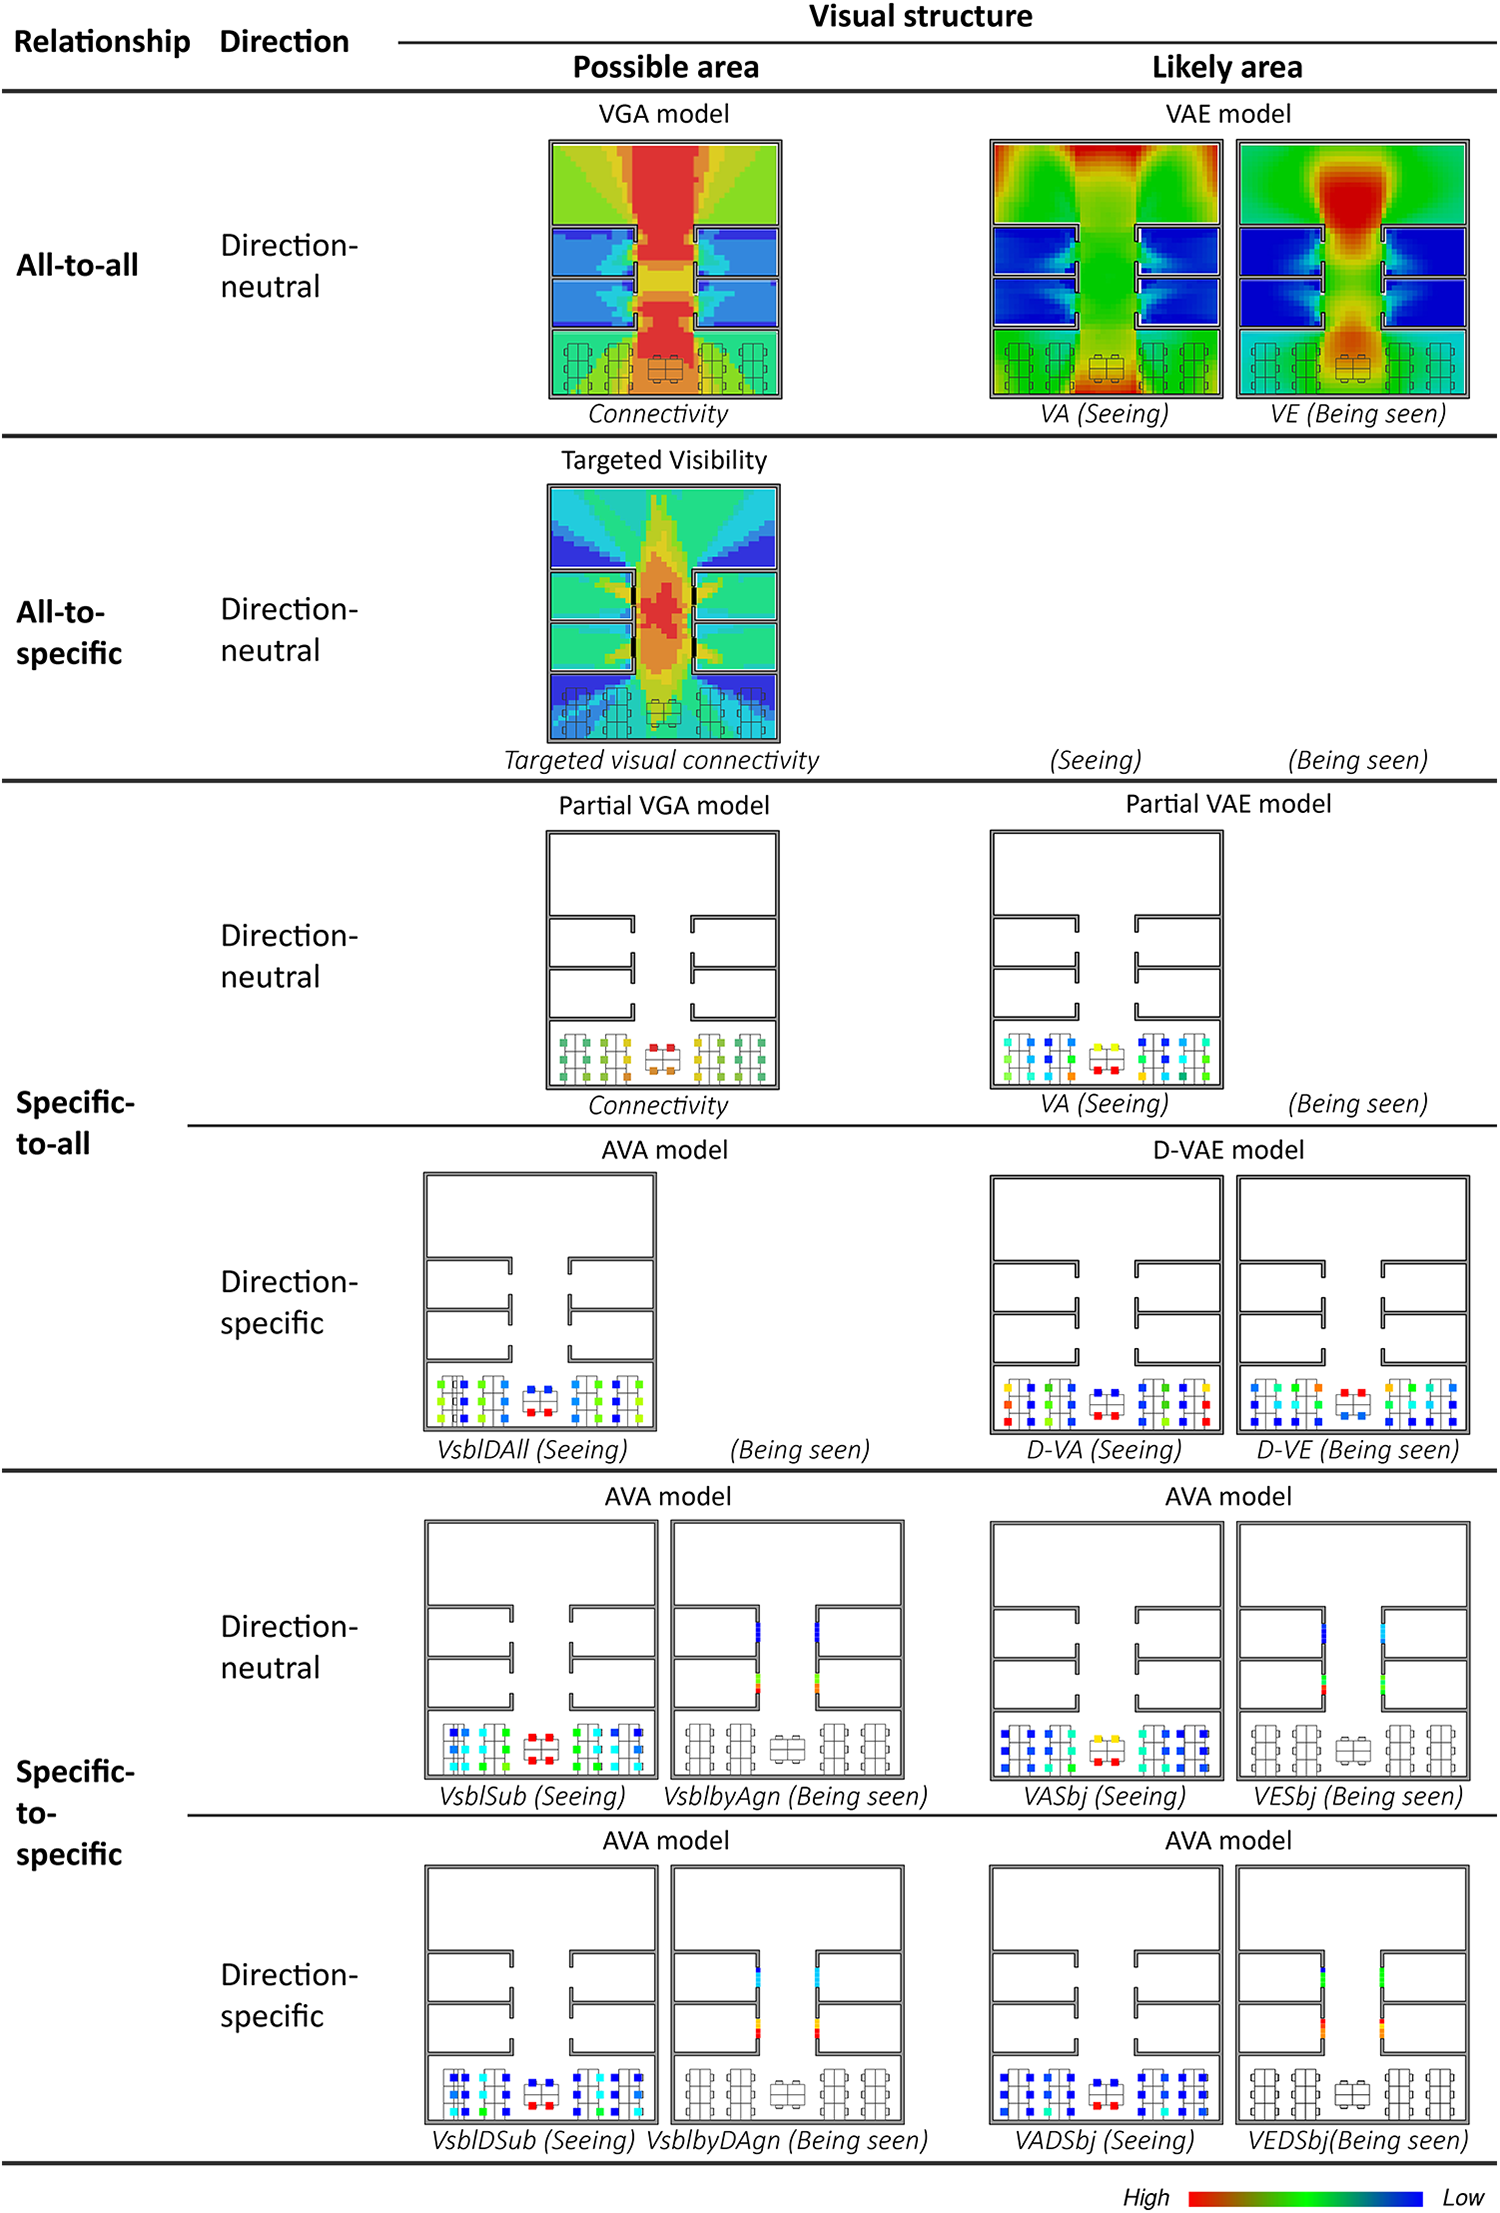
This conceptual framework consists of four dimensions for measuring specific patterns of visibility: (1) the likelihood versus the possibility of seeing or being seen given the way human perception works; (2) the focus on seeing or being seen by all versus by a specific location; (3) whether the direction the seeing entity is facing is considered—direction-specific versus direction-neutral; and (4) the distinction between seeing versus being seen. Using the combinations of these dimensions, the conceptual framework illustrates different visibility attributes with examples of individual or organizational goals that each visibility pattern may impact (Table 1). The dimensions of the framework are expected to help designers, researchers, or managers apply the framework to their own situations.
Conceptual Visibility Framework With Examples of Individual Experiences and Behaviors.
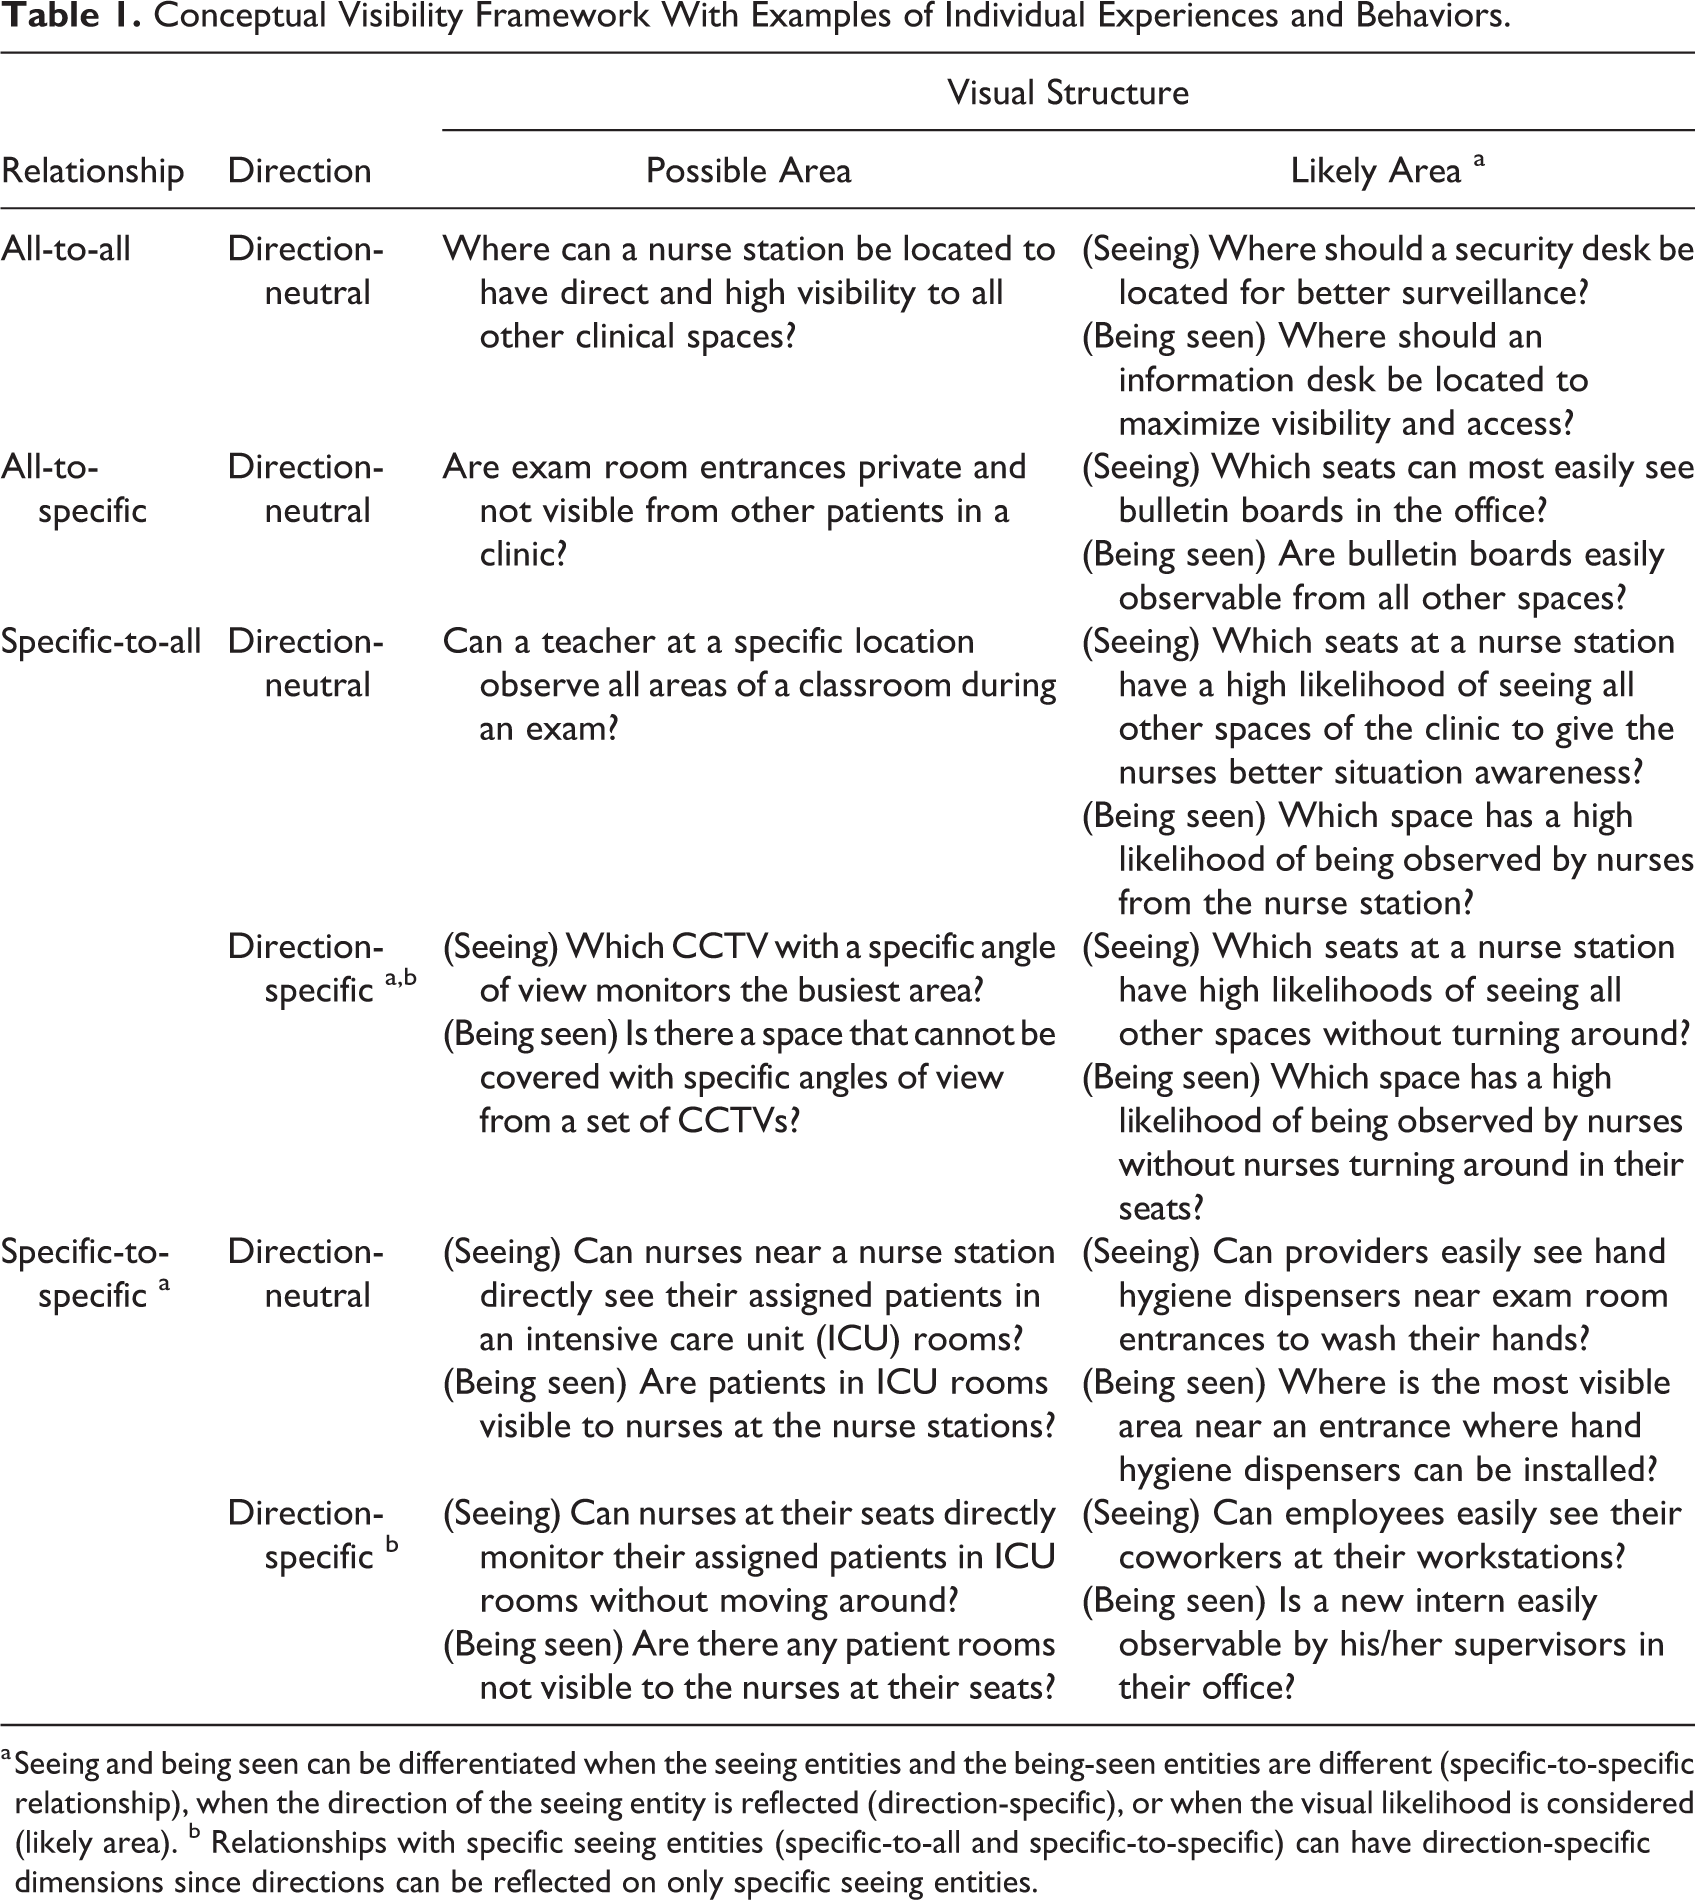
a Seeing and being seen can be differentiated when the seeing entities and the being-seen entities are different (specific-to-specific relationship), when the direction of the seeing entity is reflected (direction-specific), or when the visual likelihood is considered (likely area). b Relationships with specific seeing entities (specific-to-all and specific-to-specific) can have direction-specific dimensions since directions can be reflected on only specific seeing entities.
Possible Versus Likely
This distinction comes from the two main streams of previous analysis tools: Benedikt’s (1979) Isovist and Archea’s (1984) VAE. By summing all the locations that can possibly be viewed from a location, we create the possible area, which Benedikt and others termed the Isovist (Benedikt, 1979). However, people are more likely to see and respond to people and objects in their limited-angle cone of vision where they can see more clearly and not have to turn (e.g., 60°) from the front plane of their head (Abramov et al., 1991; Crossland, 2011; Panero & Zelnik, 1979; Stein & Reynolds, 2000). We can assess the likelihood of a location seeing other spaces (visual access [VA]) and being seen by other spaces (visual exposure [VE]) by calculating the accumulated area of multiple limited-angle cones of vision and by measuring how many limited-angle cones of vision they appear in, respectively. For example, if a given employee appears in multiple cones of vision as the supervisor looks at other locations while surveying a space, that employee is more likely to be seen. This is the likely area: the more times a location appears in a specific degree visual cone (e.g., 60° cone), the greater its likelihood to be seen (Figure 1). It is likely that the two visual constructs have distinct impacts on experiential outcomes, but this intuition needs more confirmation. While the impact of the two constructs has long been studied individually, the impact of the two constructs has not yet been empirically compared.
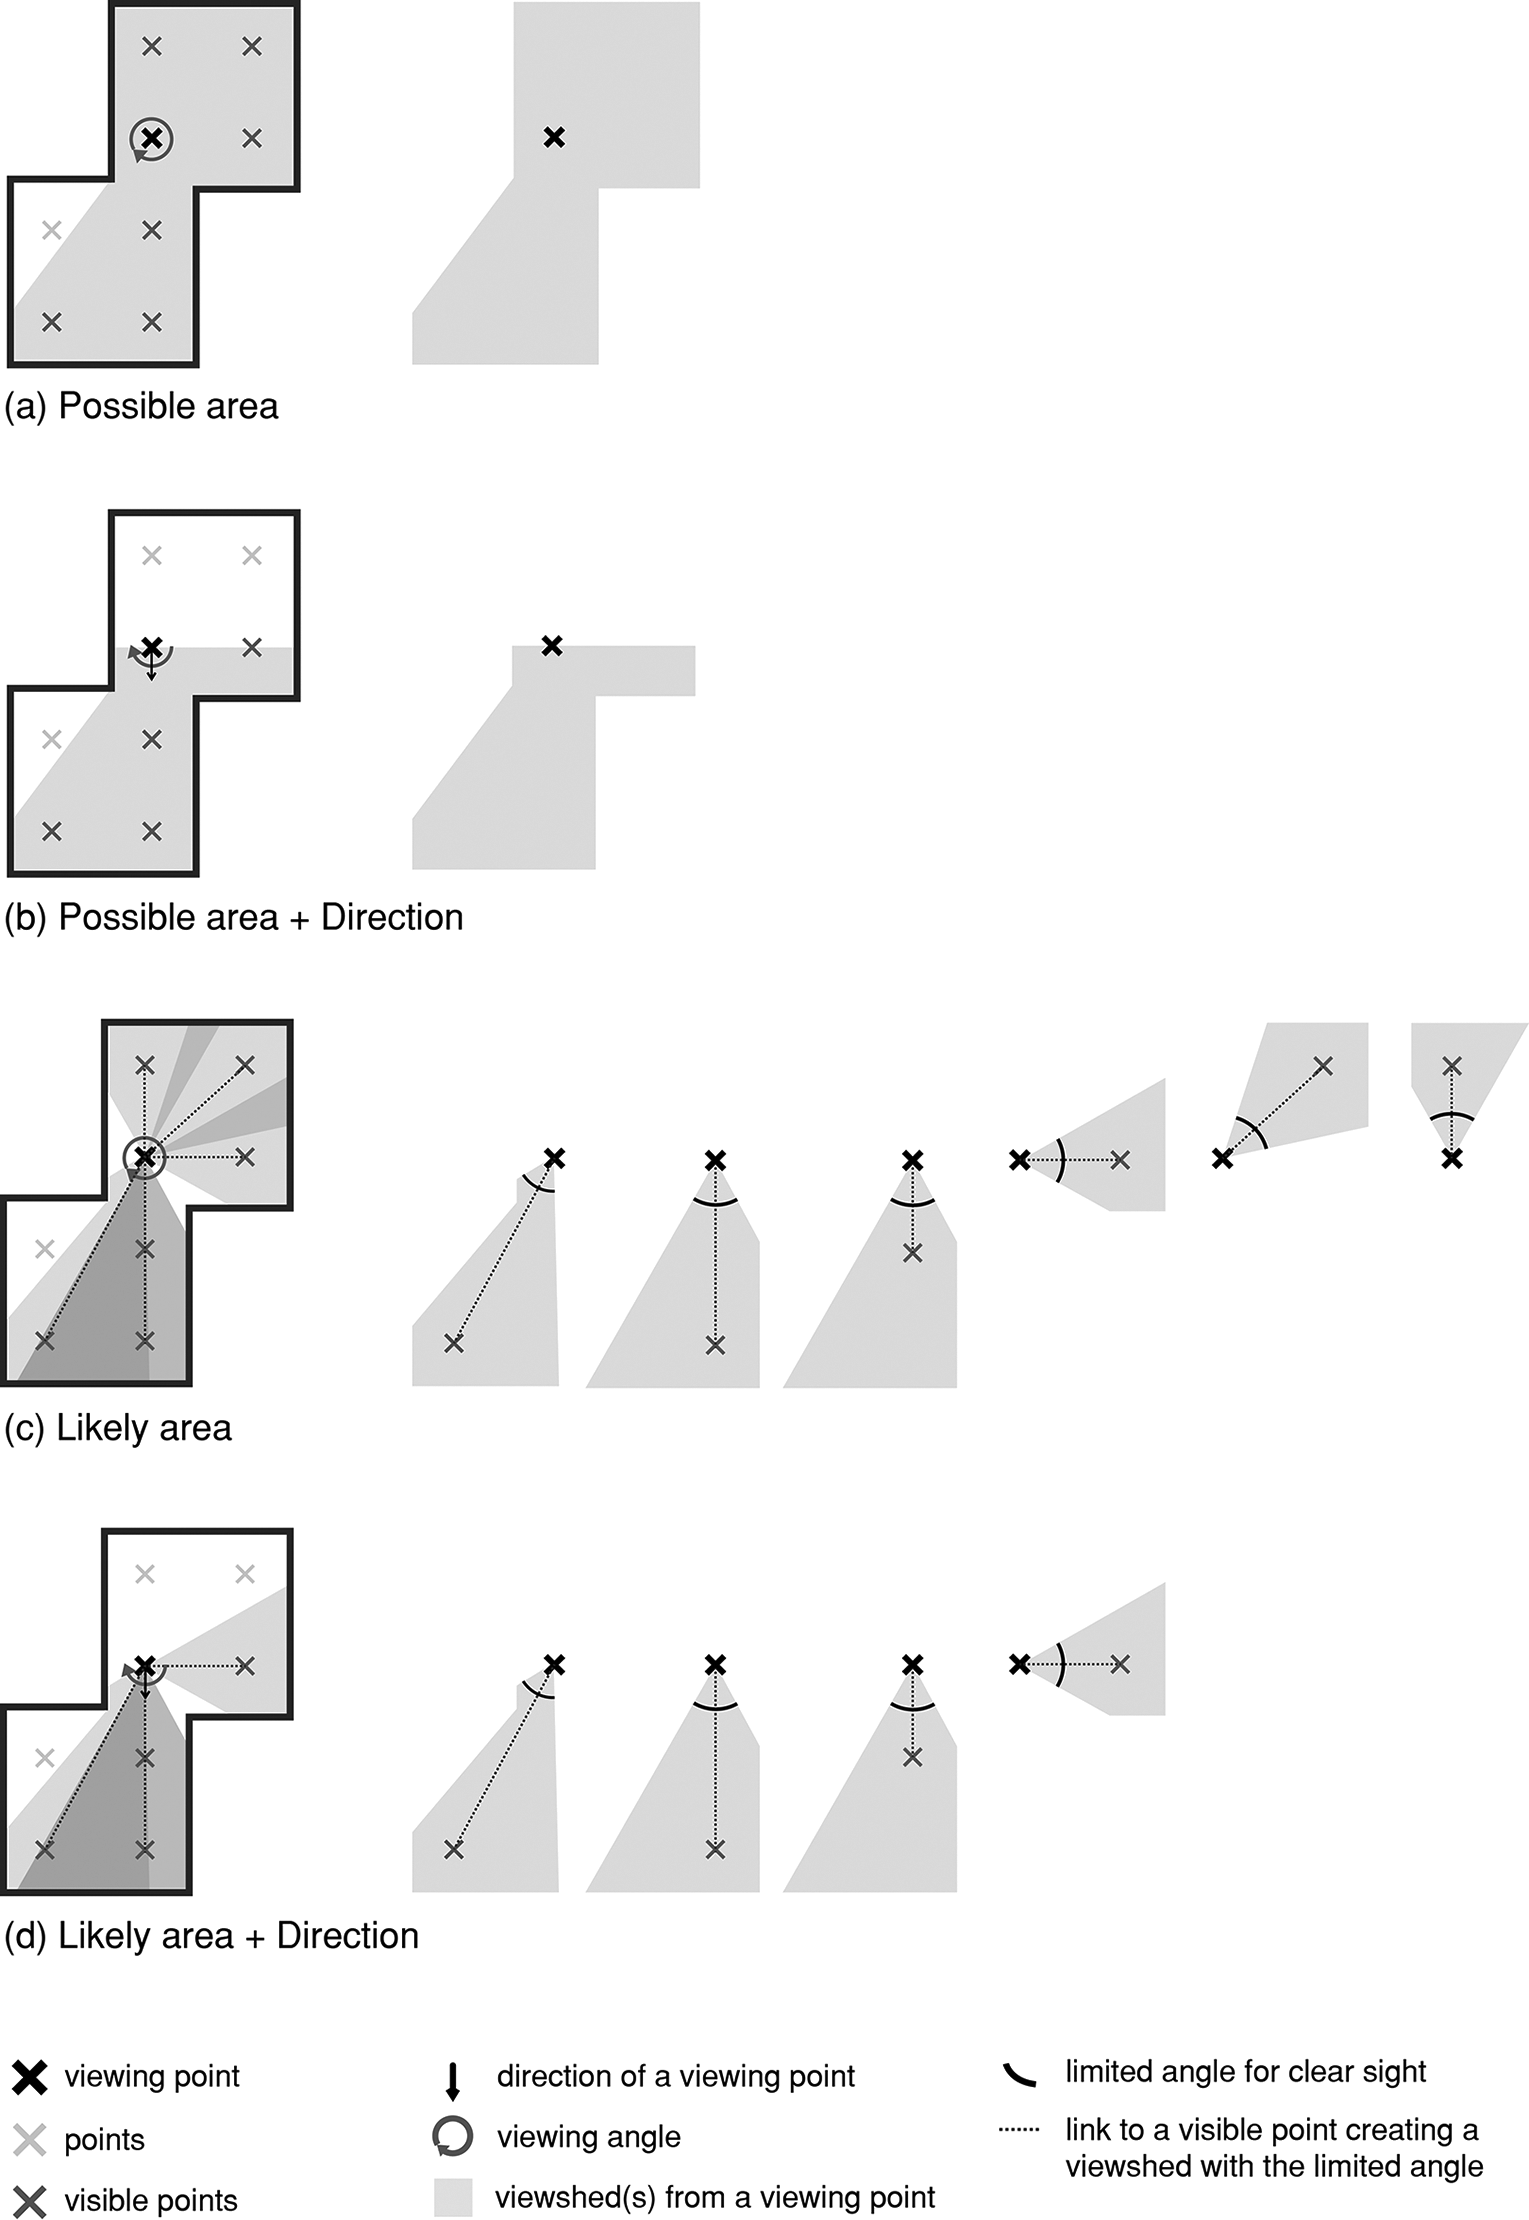
Four visibility metrics from two dimensions (possible area vs. likely area and direction-neutral vs. direction-specific) and generated viewsheds for each construct. The combination of two main distinctions generates four different visibility constructs, and the number and shape of their viewsheds vary.
All Versus Specific
It is sometimes useful to understand the visual characteristics of all locations in a space, such as any position in a museum where visitors can go to view art or any location where a piece of art can be positioned. We call a metric that describes the sum total of all locations an all metric, which provides a summative description of a space: how well on average a space affords seeing or being seen. In other situations, it is more important to understand the visual experience of people in specific locations, such as nursing stations where nurses need to see the heads of the patients’ beds. We call these metrics specific metrics. For instance, Gharaveis and his colleagues differentiated general visibility and between-staff visibility in an emergency department setting (Gharaveis et al., 2018; Gharaveis, Pati, et al., 2019), which can be understood as examples of all and specific metrics, respectively.
The all-versus-specific goals establish four kinds of potential relationships for seeing entities and being-seen entities: people at specific locations who want to control seeing or being seen at all locations (specific-to-all relationship) or at specific locations (specific-to-specific relationship), and people at all possible locations who want to control seeing or being seen at all locations (all-to-all relationship) or at specific locations (all-to-specific relationship). This dimension is reflected in the first column of the framework (Table 1).
Direction-Specific Versus Direction-Neutral
Direction is a critical factor affecting visibility. When you work at your workstation, study in a library, or work in a nurses’ station, you have a specific orientation that you face, due to the layout of the furniture and the chairs. It is harder to see backward than to see the area in front of your seat. Direction-specific visibility is defined by describing the viewshed with a specific viewing angle, such as a 60° or 180° cone of vision from the direction that the seeing entity is facing. Direction-neutral means that every direction the seeing entity can turn is weighted equally. As shown in the framework, only relationships with specific seeing entities can have a direction-specific dimension, since the being-seen entities and all-seeing entities cannot have specific orientations. While this distinction is obvious from an experiential standpoint, there is not yet enough evidence confirming the different impacts of direction-specific and direction-neutral visibility patterns.
Seeing Versus Being Seen
The levels of seeing and being seen are not always the same. Seeing other people provides different information and experience than being seen and has varying significance for different roles and goals. For example, nurses seeking to monitor patients might place greater emphasis on seeing rather than being seen; a supervisor may seek to observe employees, and the employees may feel a loss of autonomy as a result. However, a designer contemplating where to place an information desk might wish to choose a location that maximizes being seen, and a guard who seeks to observe unobtrusively may want to find a location that minimizes being seen. As we have suggested above, the locations that maximize the likelihood of seeing or being seen are often at different locations: a vantage point in the corner of a space might be able to see more than one in the center of a space, if we assume that people typically face a given direction. This differentiation of seeing and being seen occurs when the seeing entities and the being-seen entities are different (e.g., nurses seeing patients), when the direction of the seeing entity is reflected (e.g., while they may be able to see you, you cannot see people standing behind you without turning around), or when the visual likelihood is considered (e.g., VE). This dimension is reflected in certain cells of Table 1 for corresponding visibility patterns.
Existing Models, Tools, and Metrics for Visibility
Many researchers have developed analytical methods to quantify the visibility of spaces. This section describes how these existing models and tools can be mapped on the conceptual framework (Table 2). Refer to Sadek and Shepley (2016) for an extensive review of several of the existing models and tools covered in this article.
Conceptual Visibility Framework With Existing Analysis Models, Tools, and Example Metrics.
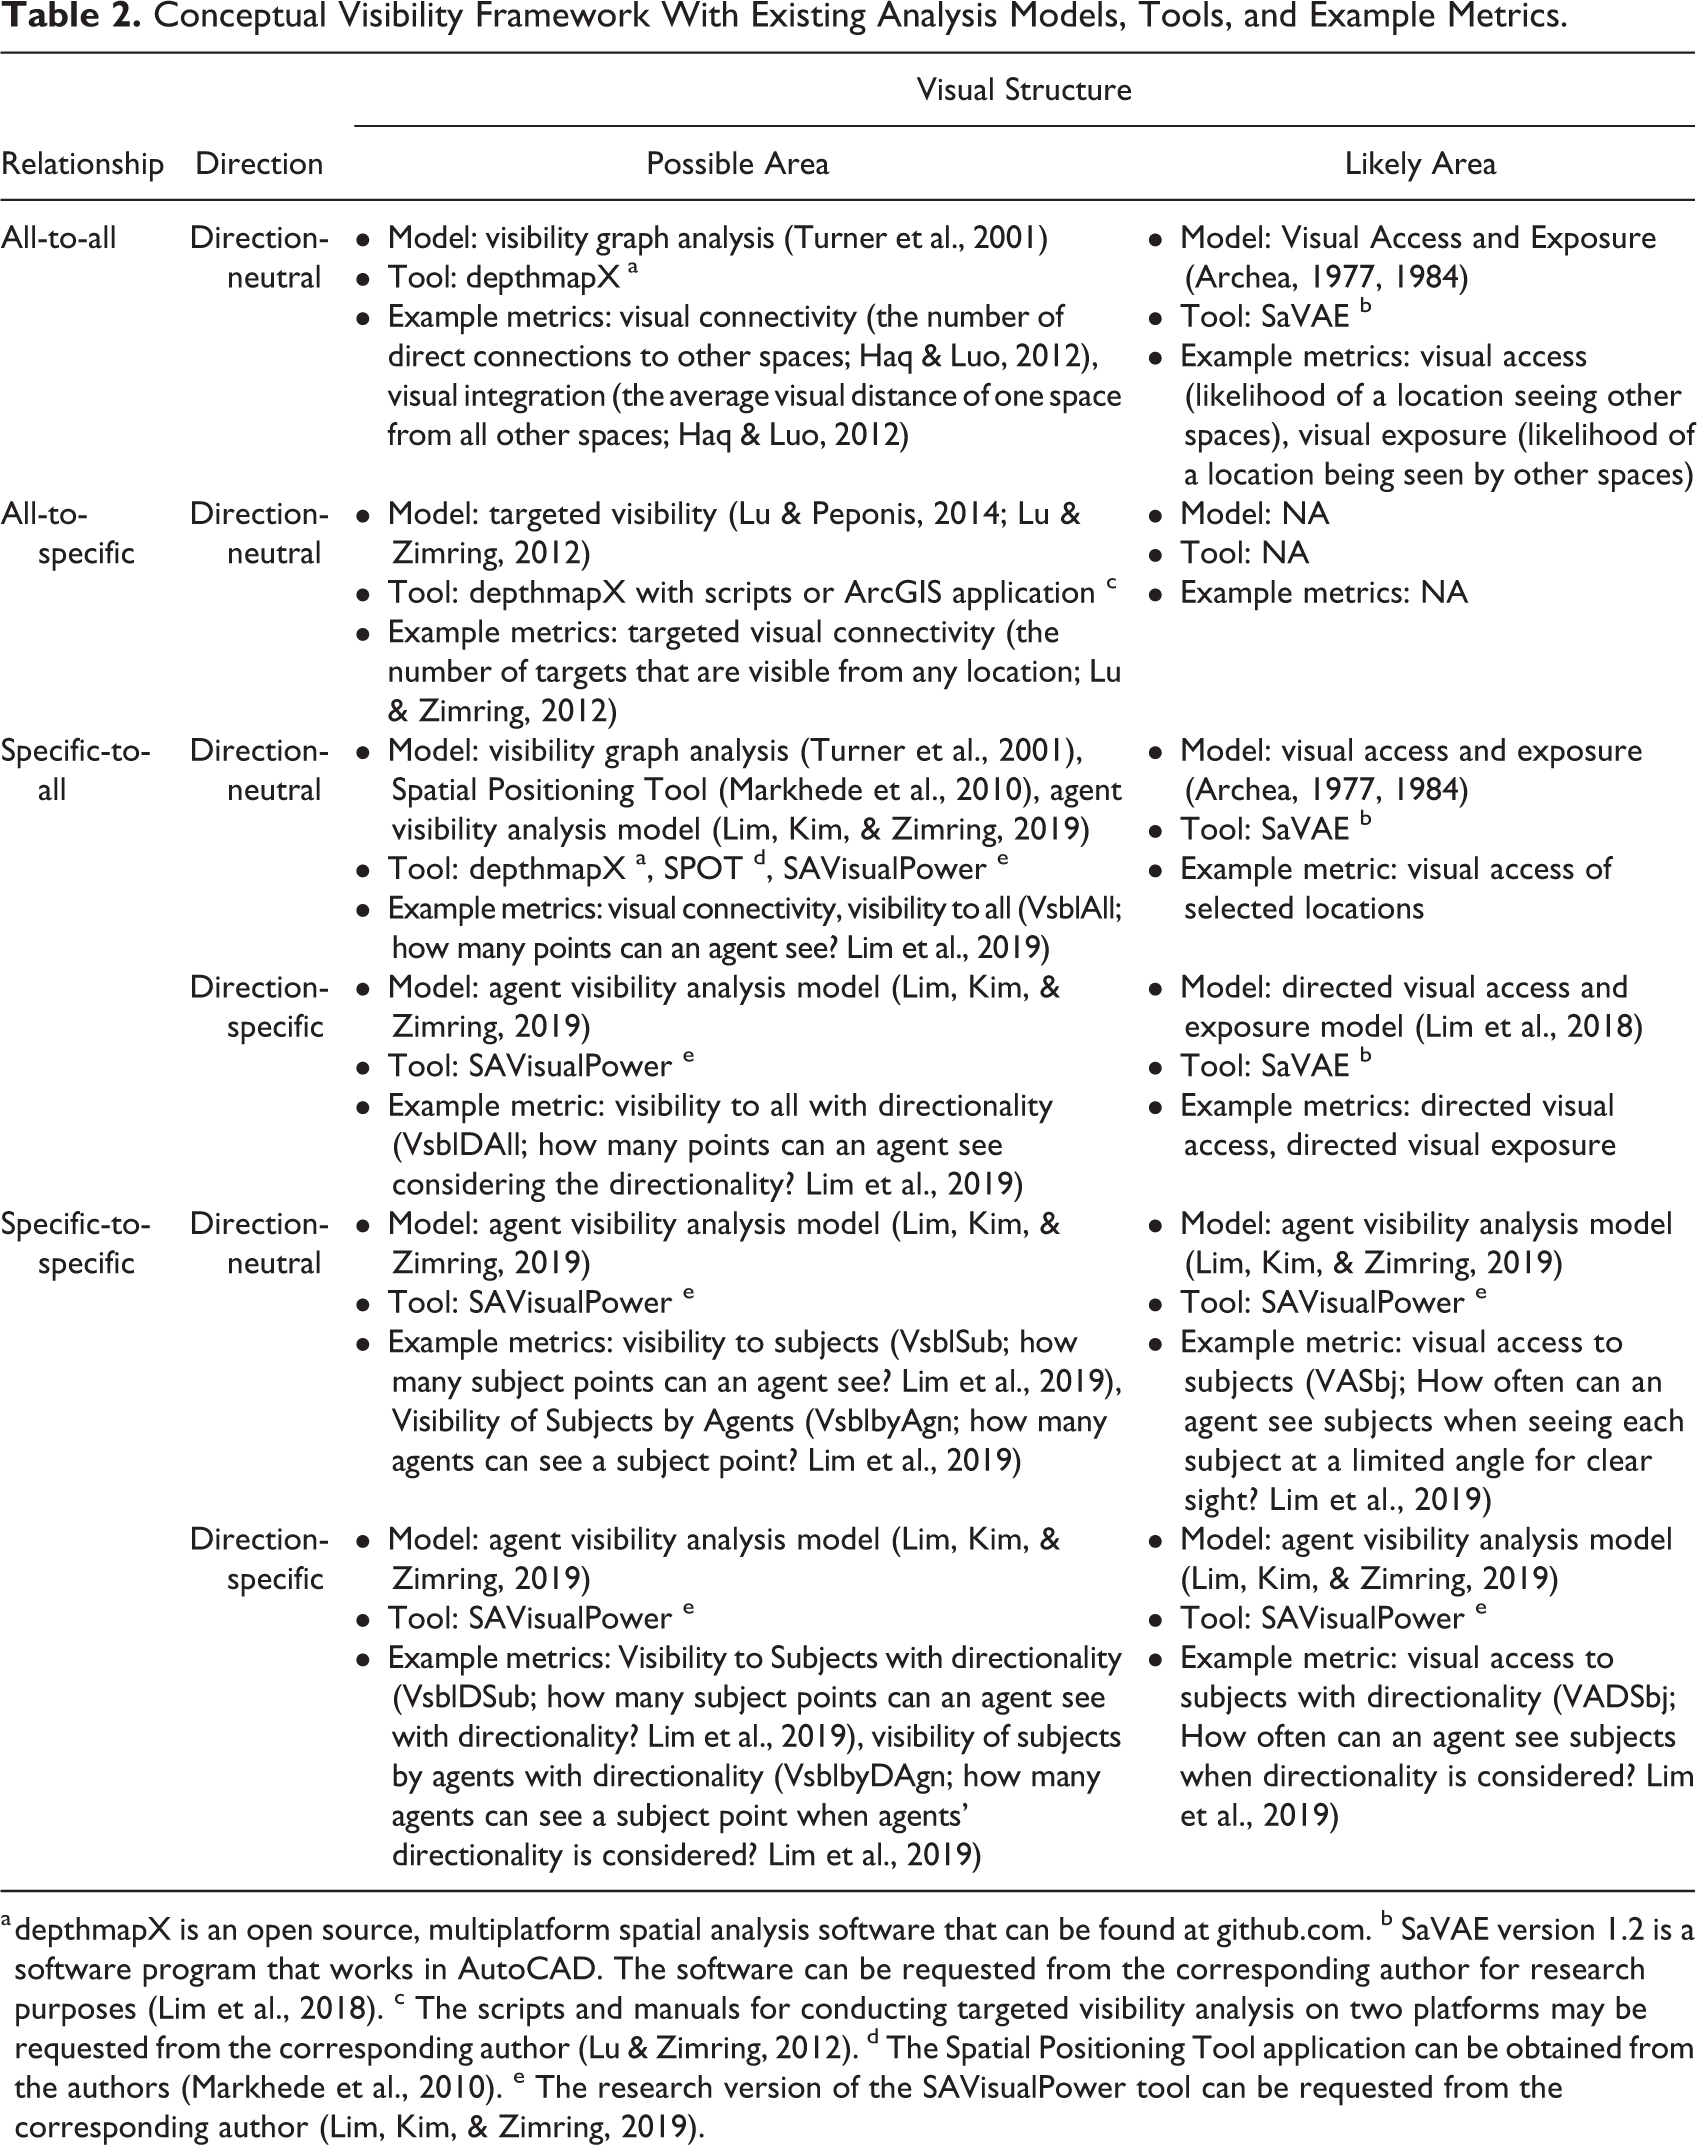
a depthmapX is an open source, multiplatform spatial analysis software that can be found at github.com b SaVAE version 1.2 is a software program that works in AutoCAD. The software can be requested from the corresponding author for research purposes (Lim et al., 2018). c The scripts and manuals for conducting targeted visibility analysis on two platforms may be requested from the corresponding author (Lu & Zimring, 2012). d The Spatial Positioning Tool application can be obtained from the authors (Markhede et al., 2010). e The research version of the SAVisualPower tool can be requested from the corresponding author (Lim, Kim, & Zimring, 2019).
Models, Tools, and Metrics for Possible Visible Area
As a fundamental contribution to the analysis of visible area, Benedikt (1979) introduced the Isovist, which represents the 360° visible field from a given location and developed measures of the size and shape of the Isovist to describe visual experience. Based on Benedikt’s Isovist and other theoretical studies, including Hillier and Hanson’s graph-based analysis approach (Hillier & Hanson, 1984) and e-partitions proposed by Peponis et al. (1997), VGA was developed by Turner et al. (2001).
VGA enables the investigation of configurational relationships by constructing visibility graphs between spatially located nodes (a grid of points) without generating Isovist polygons for all positions. Among several quantified spatial properties of VGA, the visual connectivity variable is particularly relevant to the framework in this article. Visual connectivity represents a set of directly visible (or immediately connected) points from a location, which can be thought of as equivalent to the area of a viewshed (Isovist) polygon from the location. In other words, visual connectivity measures how many points are visible from a certain location.
Along with these theoretical contributions, there have been efforts for computational implementation of the analysis of the visible area. Turner (2001, 2007) developed a program called depthmap as a computational implementation of VGA, enabling analysis of possible visible areas as part of what we call all-to-all relationships. This tool can also analyze the visible area of a specific-to-all relationship by selecting only the location of the seeing entity who is observing at specific locations.
Focusing on the occupied space of the specific seeing entity, Markhede and colleagues developed an Isovist-based spatial analysis software called the SPOT, which can analyze the possible visible area of the specific-to-all relationship (Markhede et al., 2010). Lu and Peponis (2014) and Lu and Zimring (2012) proposed targeted visibility, focusing on the visibility of preselected subjects using scripts on depthmap or ArcGIS platforms. This targeted visibility can analyze the possible visible area of the all-to-specific relationship of the framework. Furthermore, the AVA model, developed recently by Lim, Kim, and Zimring (2019), enables the analysis of specific-to-all relationships and specific-to-specific relationships using a software tool called SAVisualPower on AutoCAD. By specifying agents as seeing entities, differentiating the being-seen subjects, and reflecting orientations of agents, this model quantifies interpersonal visual relationships. More interestingly, the AVA model differentiates the subjects of visibility—agents seeing general space (e.g., nursing floor), other agents (e.g., other nurses), and objects (e.g., patient beds)—enabling comprehensive yet precise visual relationships in healthcare settings.
Models, Tools, and Metrics for Likely Visible Area
Another fundamental theoretical contribution was made by Archea (1977, 1984), who developed the VAE model. The VAE model provides objective measures of visibility due to the layout of the physical environment with two different variables: VA and VE. VA represents the likelihood of seeing others in the environment, whereas VE refers to the potential of being seen by others. The VA measures accumulated numbers of visible points within a limited angle (e.g., 60°) viewshed from a location to all visible points. In other words, VA refers to the sum of points within the limited degree viewsheds when they are generated toward each visible point. While VA starts from the seeing entity’s perspective, VE counts the instances of being included in the viewsheds generated from all seeing entities to all visible points, from the perspective of a being-seen entity. Together, VA and VE can analyze the likely visible area of all-to-all relationships, and VA of the selected points can illustrate specific-to-all relationships (Table 2).
There have been continuous developments and refinements of the VAE model in both the computational and theoretical approaches. The model has been implemented in several computer programs developed by Choi and other researchers (Choi, 1982; Choi et al., 2008; Lim et al., 2018). Furthermore, Lim et al. (2018) extended the VAE model by reflecting the orientation of the seeing entity in their directed VAE (D-VAE) model, which can analyze the likely visible area of the direction reflected specific-to-all relationships. Additionally, the AVA model developed by Lim, Kim, and Zimring (2019) can analyze the likelihood of seeing (and being seen by) other agents/objects using the SAVisualPower software as part of specific-to-specific relationships in the framework.
The difference between the metrics of possible and likely visible areas becomes more explicit when we compare the way the metrics are calculated. The two models (Turner’s VGA and Archea’s VAE) use the same unit of analysis—a set of vertices or points within a boundary of space. While Turner’s visual connectivity counts a number of visible points within one 360° viewshed from a location, Archea’s VA and VE counts the accumulated numbers of visible points within multiple limited-degree viewsheds generated from a point to all other visible points. For example, when 10 points are visible from a location (connectivity = 10), VAE calculates the accumulated numbers of points within a total of 10 limited-degree viewsheds. In this sense, Turner’s visual connectivity represents how much a person can see at a certain location when the person looks around (360°), while Archea’s VA and VE represent how likely a person can see or be seen clearly (with limited angle) when the person looks around (360°). These metrics represent the possible visible area and the likely visible area in the framework, respectively. Figure 1 illustrates the distinct ways of calculating metrics of the possible versus likely visible area and the direction-neutral versus direction-specific visible area.
Results of the Analyses Within the Framework
One of the goals of this article is to explain how the results of visibility patterns can differ and how the results can be interpreted or applied for desired psychological and organizational experiences. For this purpose, using the existing models, tools, and metrics described in the framework (Table 2), we analyzed a hypothetical layout as an example. This hypothetical layout is a simple layout of an outpatient clinic where a waiting area is in the front of the clinic, four exam rooms are in the middle, and a workstation for all the caregivers is located in the back (Figure 2). The results are visualized with color schemes from red (the highest) to blue (the lowest) in Figure 3 and interpreted in relation to possible experiences in the outpatient healthcare setting.
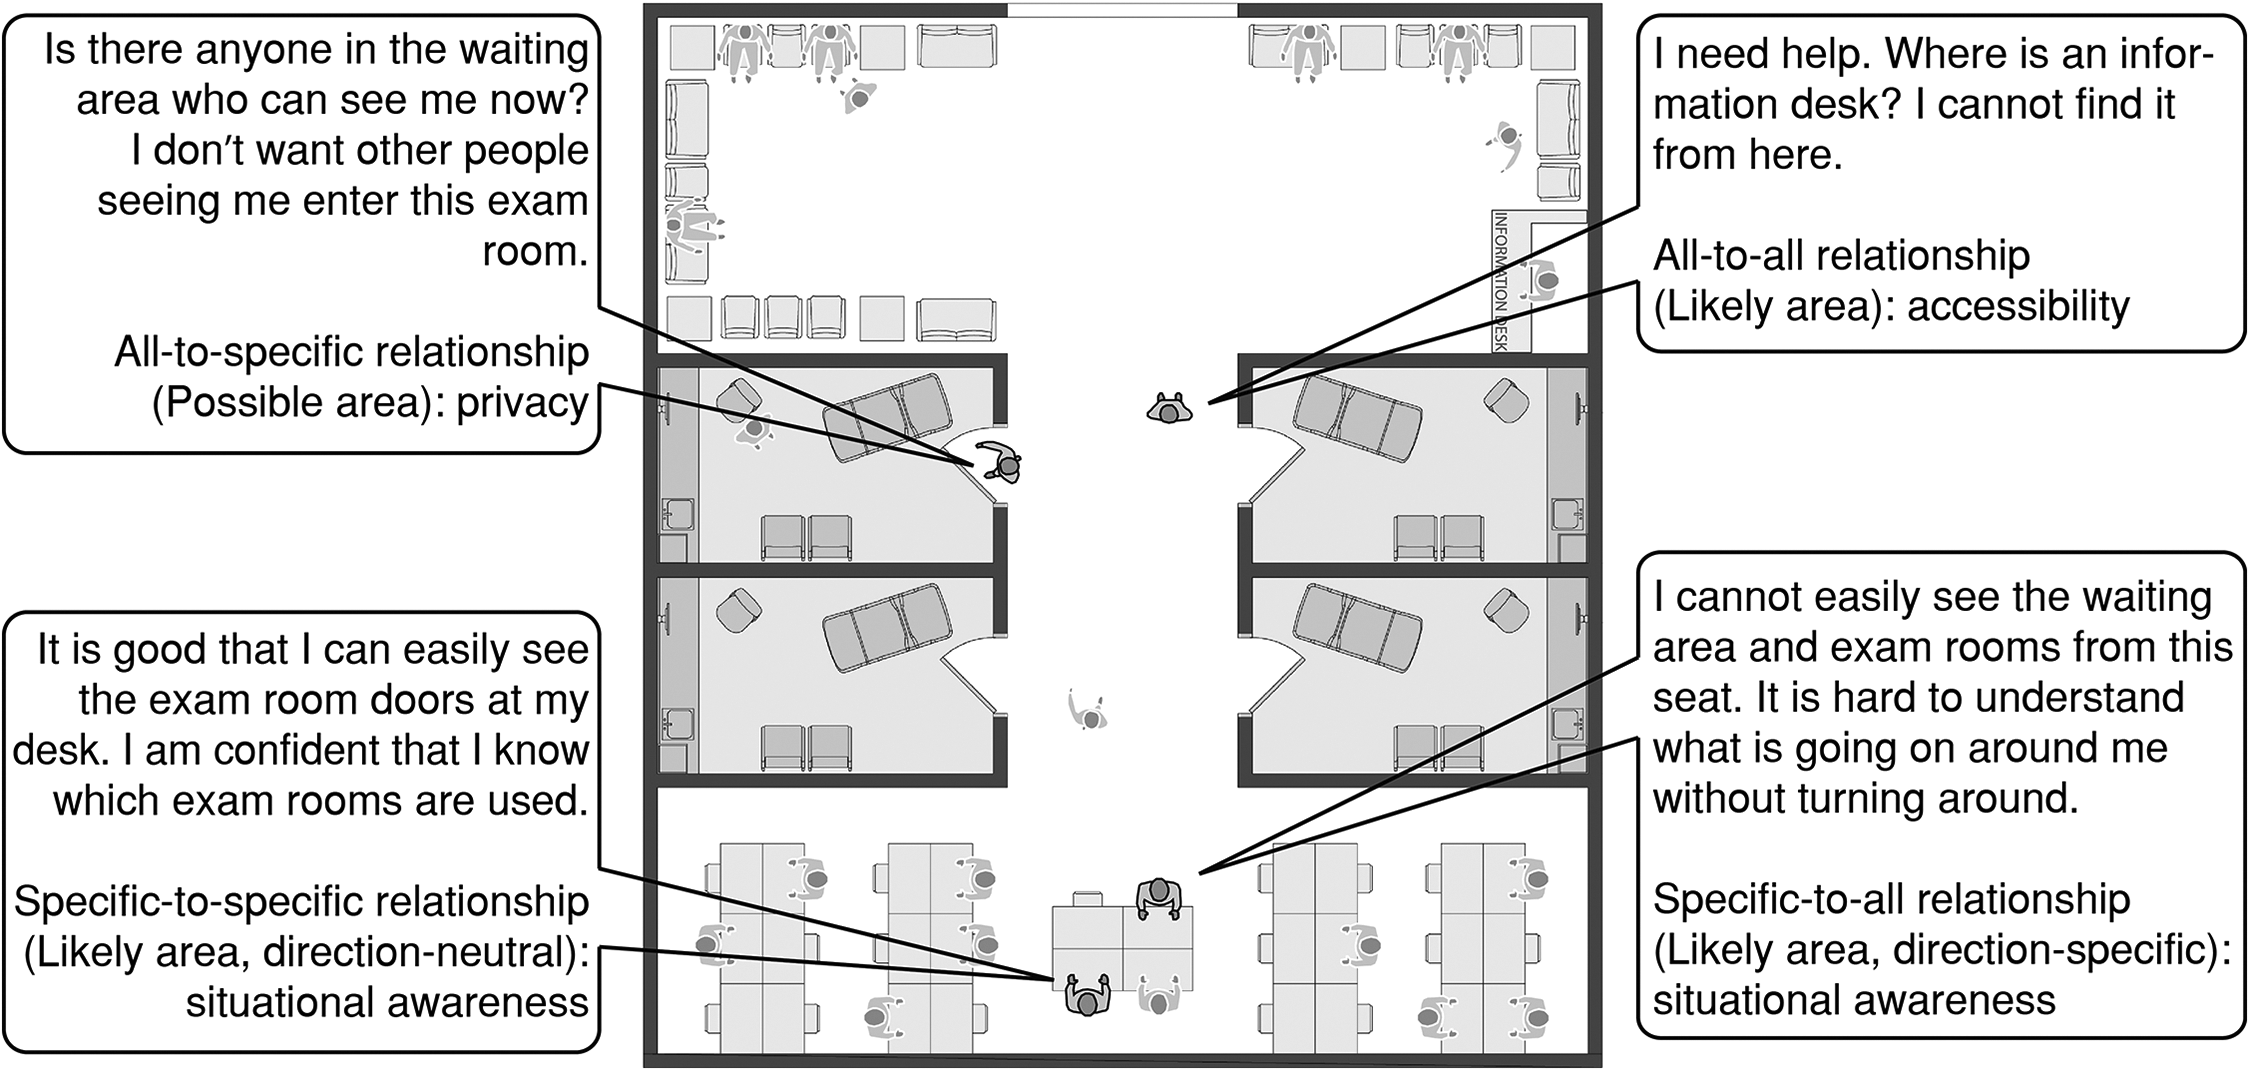
A hypothetical layout with possible experiences in an outpatient setting. Patients and staff members may have certain experiences due to visibility relationships determined by architectural and furniture layout.
Results of visibility analysis using various analysis models (variables) following the framework. These results convey distinct visibility information and patterns according to the selected dimensions of the framework.
The all-to-all relationship describes the visibility of spaces in relation to all other spaces. This relationship allows individuals to understand and experience general visibility as properties of spaces, such as accessibility or connectivity to all other spaces. For this relationship, the result of the possible area shows that the middle corridor of the layout has high visibility (represented in red), which indicates that it has the highest visibility to all other clinic areas. Interestingly, VA and VE analyses report similar but different results to the high visibility area of the possible area (connectivity). Among the high visibility red areas of the possible area, the top and bottom edge areas have high VA to other areas, while the middle areas have high VE to the clinic. These results enable us to understand and utilize two different roles of high-visibility areas. For example, an information desk can be located in a high VE area where it is likely to be observed by others (accessibility), while a security desk can be located in a high VA area where it is easy to observe all other areas (surveillance).
The all-to-specific relationship specifies the targets of visibility. It describes to what extent certain targets are seen by all other spaces. This relationship may regulate levels of privacy or conspicuity by controlling the amount of direct exposure or the likelihood of being seen. For this relationship, the targeted visibility was used to analyze the area that can directly see predetermined targets. The targets for the hypothetical layout are the exam room doors, represented in bright yellow in Figure 3. As expected, the middle area of the corridor has high visibility to the exam room doors, expanding to both the waiting area and the workstation in the back. However, in healthcare settings where privacy is a critical concern, exposing the patients’ entrance and exit from the exam rooms to other patients in the waiting area may not be preferable. By altering a layout of the clinic and reanalyzing the visibility relationship with the targeted visibility, designers or organizations can understand how to lower the visibility of the exam room doors from the waiting area to increase patient privacy.
Agents can also be predetermined in visibility relationships similar to subjects. The specific-to-all relationship represents the visibility of certain agents and promotes understanding of the extent to which these agents, such as employees, caregivers, and preselected areas, can see all other spaces or be seen by them. Situational awareness of caregivers to all other spaces can be a good example to explain the results of the specific-to-all relationship. To provide appropriate care to patients in need, healthcare settings require an adequate level of situational awareness (Cai & Zimring, 2012), which is “being aware of what is happening around you and understanding what that information means to you now and in the future” (Endsley & Jones, 2011, p. 13). Caregivers can be aware of their surroundings with visibility to other spaces from their specified locations. The results of this relationship were manually drawn by partially selecting the results of the VGA model and the VAE model, which we refer to as partial VGA and partial VAE models. As shown in the results of the possible area, four seats in the middle area of the workspace have high visibility to all other spaces. However, according to the likely area and the likely area with directionality, the visibility of the four seats is not always high. The two seats facing the exam rooms have high VA, while the other two seats have high VE. This result indicates that the two seats with high VA to all other spaces provide better situational awareness compared to the other two seats to caregivers. When directionality is reflected in the likely area, the two seats facing back from the exam rooms have low VA, indicating that caregivers cannot have situational awareness of all other spaces without putting in additional effort (i.e., turning around).
The specific-to-specific relationship represents the visibility of certain agents to predetermined subjects, which can be other agents (e.g., nurses) or objects (e.g., exam rooms). This visibility relationship also plays an important role in supporting desired experiences or goals of agents. For instance, the visibility of ICU nurses to their assigned ICU rooms can support the awareness of patients, improving patient safety with fewer falls and lower mortality rates (Choi, 2011; Leaf et al., 2010; Lu et al., 2014; Ossmann, 2016). This relationship facilitates behavioral changes by controlling the visibility of related subjects. For example, caregivers’ compliance with hand hygiene procedures may increase if the visibility of sinks, posters, or hand-sanitizing dispensers are improved (Nevo et al., 2010). We can analyze visibility patterns of the specific-to-specific relationship using the AVA model. As shown in the figure, four seats in the middle have a high possibility and likelihood of seeing exam room doors. Of these four seats, the two seats facing the exam rooms have high visibility of the exam room doors when directionality is reflected. Additionally, exam room doors closer to the work area are more easily exposed to nurses (especially to nurses who sit in the middle of the work area).
Conclusion
Visibility as an attribute of the built environment supports or hinders organizational and psychological experiences. Using experiential phenomena (i.e., likelihood vs. possibility, all-versus-specific location, direction-specific vs. direction-neutral, and seeing vs. being seen) as main dimensions, this article proposes a conceptual framework. Through the framework, we compare and contrast various aspects of visibility that affect psychological and organizational experiences of users and link existing models, tools, and metrics for measuring each visibility pattern.
While the visibility framework is expected to enhance the systematic understanding of visibility relationships, there are some important visibility aspects outside the framework. For example, Cho and Kim (2011) developed the layered and weighted VAE model, which enables the visibility analysis of different heights of seeing agents with a weighting function, which is not embedded in the framework. The purpose of the framework in this article is to enhance the understanding of visibility in terms of engaged entities and experiences, not to reflect all previous metrics. As a result, this article does not review all existing visibility analysis tools or other critical tools used in the field of healthcare design, such as observation or simulation tools.
The visibility framework defined in this article will reinforce the practical use of visibility analyses to other possible experiences beyond some of the practical examples described in the article. In particular, the framework will enable researchers, facility managers, and designers to view visibility relationships from the perspective of agents and users. The visibility framework will support designers and researchers to identify appropriate visibility relationships to focus on and analyze the relationships with corresponding tools, and then to interpret results in relation to the desired experiences of users for their situations and facilities. The goal is to provide concepts and tools that make an analysis of layout and visibility a more routine part of design and research.
Executive Summary of Key Concepts
Visibility has a significant impact on user experiences in healthcare settings. Nurses being able to see patients is significantly correlated with lower rates of patient falls and death. Healthcare professionals being able to see each other is associated with improved situation awareness and communication. A deliberate design for visibility can support users of healthcare settings achieve certain experiences and goals, which makes understanding and quantifying the visibility of users important. This article introduces a conceptual visibility framework that assembles existing tools for thinking about visibility in built environments, focusing on individual experiences and behaviors in relation to visibility patterns. The framework will help researchers, designers, or facility managers identify appropriate visibility patterns for evaluating their facility design to improve user experiences.
Implications for Practice
Researchers and designers can identify appropriate visibility analysis models, tools, and metrics for their research and design. Researchers can expand the framework to include other important experiential phenomena as main dimensions, identify the gaps in the framework, and develop further analysis models and tools to fill the identified gap. Facility managers can analyze their facility using multiple visibility patterns to evaluate the design affordances of their facility for user experiences and identify potential areas of improvement.
Footnotes
Acknowledgment
The authors would like to thank Sonit Bafna, Jennifer Dubose, and Megan Denham for their generous comments.
Declaration of Conflicting Interests
The authors declared no potential conflicts of interest with respect to the research, authorship, and/or publication of this article.
Funding
The authors received no financial support for the research, authorship, and/or publication of this article.