
Abstract
Aims:
This studied aimed to compare rates of reoperation for patients who received primary ankle arthrodesis (AA) versus total ankle replacement (TAR) for posttraumatic indications between 2010 and 2016 Q2 using a nationwide claims database.
Methods:
A retrospective cohort study analyzing patients who received primary AA or TAR for posttraumatic indications was performed using PearlDiver. Reoperations assessed included prosthetic joint infection (PJI), hardware removal, adjacent joint fusion, and local open reduction internal fixation (ORIF). Multivariable logistic regression was used to compare rates of reoperations at 1 and 2 years postdischarge.
Results:
A total of 862 (74%) patients received AA and 318 (26%) patients underwent TAR for a posttraumatic indication. At 1 year, 305 (35.4%) AA patients had at least 1 reoperation compared with 55 (17.3%) TAR patients (OR 2.32; 95% CI, 1.68-3.26). At 2 years, 364 (42.2%) AA patients and 66 (20.8%) TAR patients had at least 1 reoperation (OR 2.51; 95% CI, 1.84-3.45). ORIF, hardware removal, and adjacent joint fusions were more likely for AA patients at both time intervals (all Ps < .05).
Conclusion:
Patients who received primary AA for posttraumatic indications exhibited higher rates of major reoperations in the short to medium term compared with patients who underwent TAR.
Levels of Evidence:
Level III: Retrospective cohort study
“Posttraumatic osteoarthritis (PTOA) comprises approximately 12% of all OA cases and imparts a financial burden of more than $3 billion dollars annually.”
Osteoarthritis (OA) is one of the most prevalent musculoskeletal conditions in the world, affecting approximately 15% of the entire adult population and more than 27 million individuals in America alone.1-3 It has been estimated that adults older than 45 years have a 40%, 45%, and 25% chance of developing OA of the hand, knee, and hip joints, respectively, by age 85 years. 4 Symptomatic OA of the ankle joint is less common, comprising only 1% of all OA diagnoses. 5 Posttraumatic OA (PTOA) comprises approximately 12% of all OA cases and imparts a financial burden of more than $3 billion dollars annually. 6 The ankle joint is disproportionately affected by trauma with regard to the development of OA: between 80% and 90% of ankle OA cases are of a posttraumatic etiology, whereas trauma plays a role in only 2% to 10% of OA cases in the hip and knee joints.1,3,5-8
Although displaced fractures within the ankle joint may be initially treated with open reduction and internal fixation (ORIF) to achieve anatomic reduction, PTOA may still develop. 3 If initial nonoperative management fails, subsequent progression to debilitating end-stage PTOA usually warrants definitive operative measures. The most common operative management involves either ankle arthrodesis (AA) or total ankle replacement (TAR). Historically, AA has been the standard of care in the operative management of end-stage OA.1,9 However, due to poor functional outcomes and the accelerated development of adjacent joint disease following AA, TAR has become a popular alternative.10-13 This shift in preference may be illustrated by the fact that, between 2004 and 2009, national utilization of TAR increased by 57% while utilization of AA remained the same. 14 Despite shifting utilization, prior studies comparing postoperative complication rates and reoperations following AA versus TAR have failed to establish a clear, consistent advantage of either procedure.15-17
The purpose of this study was to compare rates of major reoperations in the short to medium term experienced by patients diagnosed with prior or current ankle trauma and/or PTOA and treated with either primary AA or TAR. It was hypothesized that reoperation would be more prevalent in patients that received primary AA. A large nationwide patient database was utilized to assess outcomes at a national level.
Materials and Methods
Patient records were obtained from PearlDiver (PearlDiver Inc), a commercially available administrative claims database with deidentified inpatient and outpatient data. Researchers identify patients, procedures, and complications using the International Classification of Diseases, Ninth Revision and Tenth Revision (ICD-9/ICD-10) and the Current Procedural Technology (CPT) codes. The dataset utilized contains deidentified medical records of approximately 15 million patients from 2010 through June 30, 2018 (end of Q2) from provider groups across the United States. The data are collected by an independent data aggregator and is inclusive of all payors. Institutional review board exemption was granted for this study since provided data was deidentified and compliant with the Health Insurance Portability and Accountability Act (HIPAA). This research did not receive any specific grant from funding agencies in the public, commercial, or not-for-profit sectors.
A retrospective cohort study design was used to compare rates of postoperative reoperations for patients that received primary TAR versus AA. TAR was defined using CPT code 27702, ICD-9 procedural code 81.56, and corresponding ICD-10 procedural codes. Tibiotalar AA was defined by CPT codes 27870 and 29899, ICD-9 procedural code 81.11, and corresponding ICD-10 procedural codes. Only primary procedures from 2010 through 2016 Q2 were included to ensure a 2-year minimum follow-up for all included patients. Inclusion criteria was a preoperative history or active diagnosis of PTOA, traumatic arthropathy, lateral/medial malleolar fractures, and/or other distal lower extremity fractures. Patients with an active ankle infection at the time of the index procedure were excluded. A full list of inclusion and exclusion criteria codes is provided in the Supplemental Appendix Table A.1.
Demographic data and preexisting clinical characteristics were queried directly from the PearlDiver database which included age, sex, United States region (Northeast, South, West, Midwest), Charlson comorbidity index (CCI), and the prevalence of major preexisting comorbidities. CCI is a metric that illustrates the burden of preexisting comorbidities and predicts 10-year mortality risk. It is inclusive of conditions such as heart disease, kidney disease, and diabetes. PearlDiver software also allows for analysis of cost data associated with total reimbursement for an episode of care or just those associated with a particular diagnosis. This study investigates the total reimbursement associated with initial AA/TAR and related sequelae at 1 and 2 years after.
Rates of reoperation were queried from the database using ICD-9, ICD-10, and CPT codes for the 1- and 2-year postdischarge periods. Reoperations assessed included prosthetic joint infection (PJI), hardware removal, fusions of adjacent joints, and ORIF of local fractures. PJI was defined by procedural codes that indicate an operative intervention for a diagnosed deep joint infection in order to exclude superficial wound complications. Hardware removal included all degrees of hardware removal, from pin removal (CPT-20670, CPT-20680, etc) to implant explantation (CPT-27704). The query was designed such that PJI and hardware removal did not overlap to avoid double-counting patients with infectious sequelae. To ensure postoperative hardware removal, adjacent fusions, and ORIF were not components of the initial operative management, the query period for these complications started 1 week after discharge from the inpatient or outpatient encounter associated with the index procedure. The codes used to identify reoperations are detailed in the Supplemental Appendix Table A.2.
Study Population
Between 2010 and 2016 Q2 in the PearlDiver data, 1180 patients met inclusion criteria for posttraumatic indications managed surgically: 862 (73%) patients received primary AA and 318 (27%) underwent primary TAR (Figure 1). Patient demographics differed between the 2 cohorts, namely in age distribution, prevalence of comorbid conditions, and total cost (Table 1). Traumatic arthropathy was the most common diagnosis in both cohorts: 452 (52%) patients in the AA cohort and 226 (71%) patients in the TAR cohort. The most common diagnoses on record at the time of the index surgery for each cohort are listed in the Supplemental Appendix B.1.
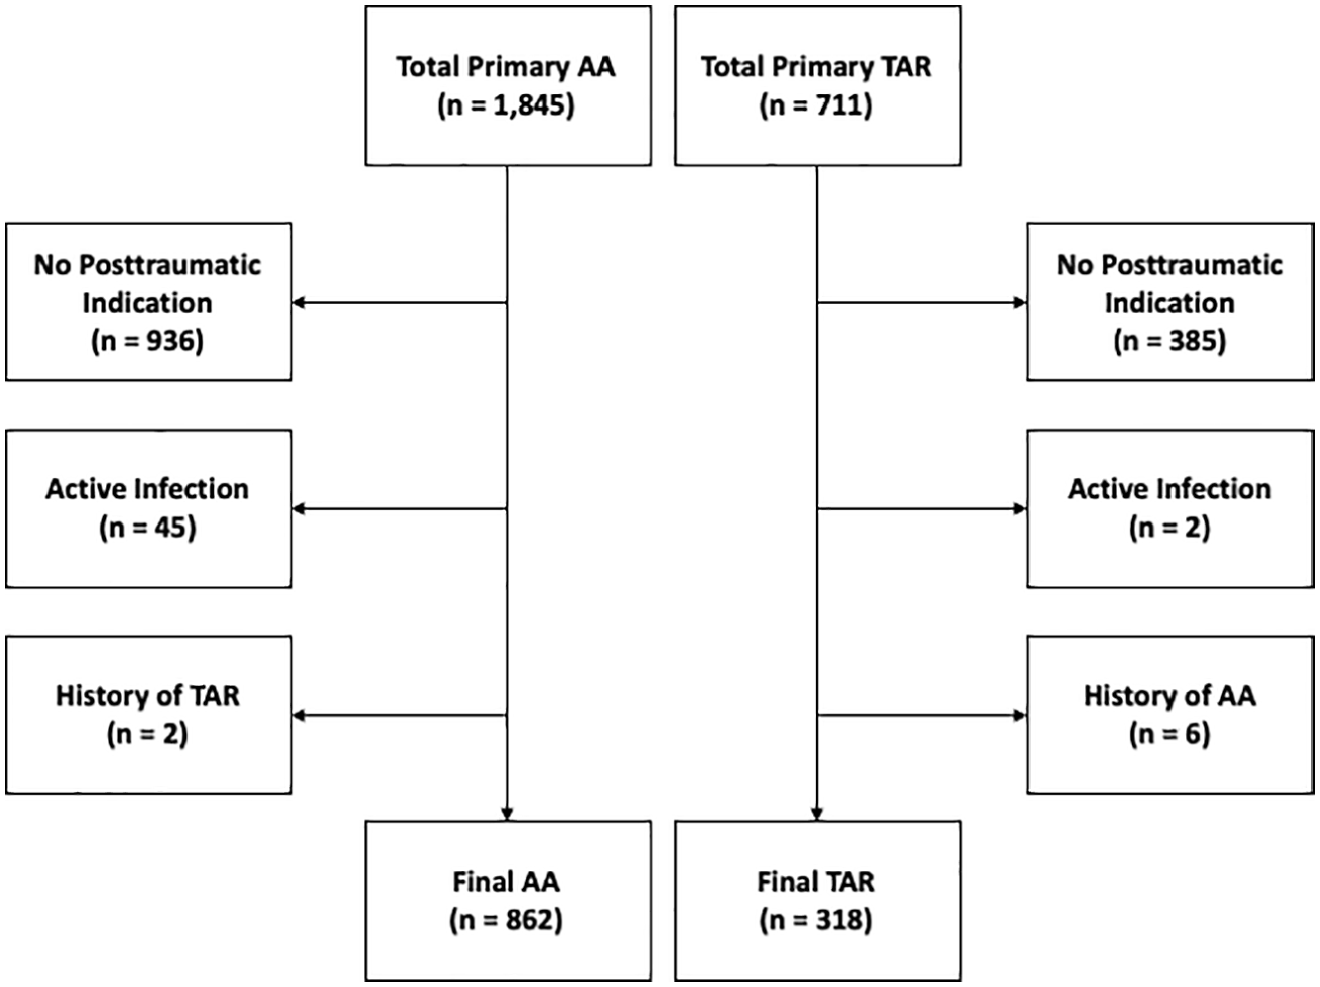
Flowchart showing application of exclusion criteria. The final ankle arthrodesis (AA) and total ankle replacement (TAR) cohorts were defined by excluding non-posttraumatic indications, active ankle infections, and past histories of AA or TAR.
Comparison of Demographic, Clinical Characteristics, and Cost.
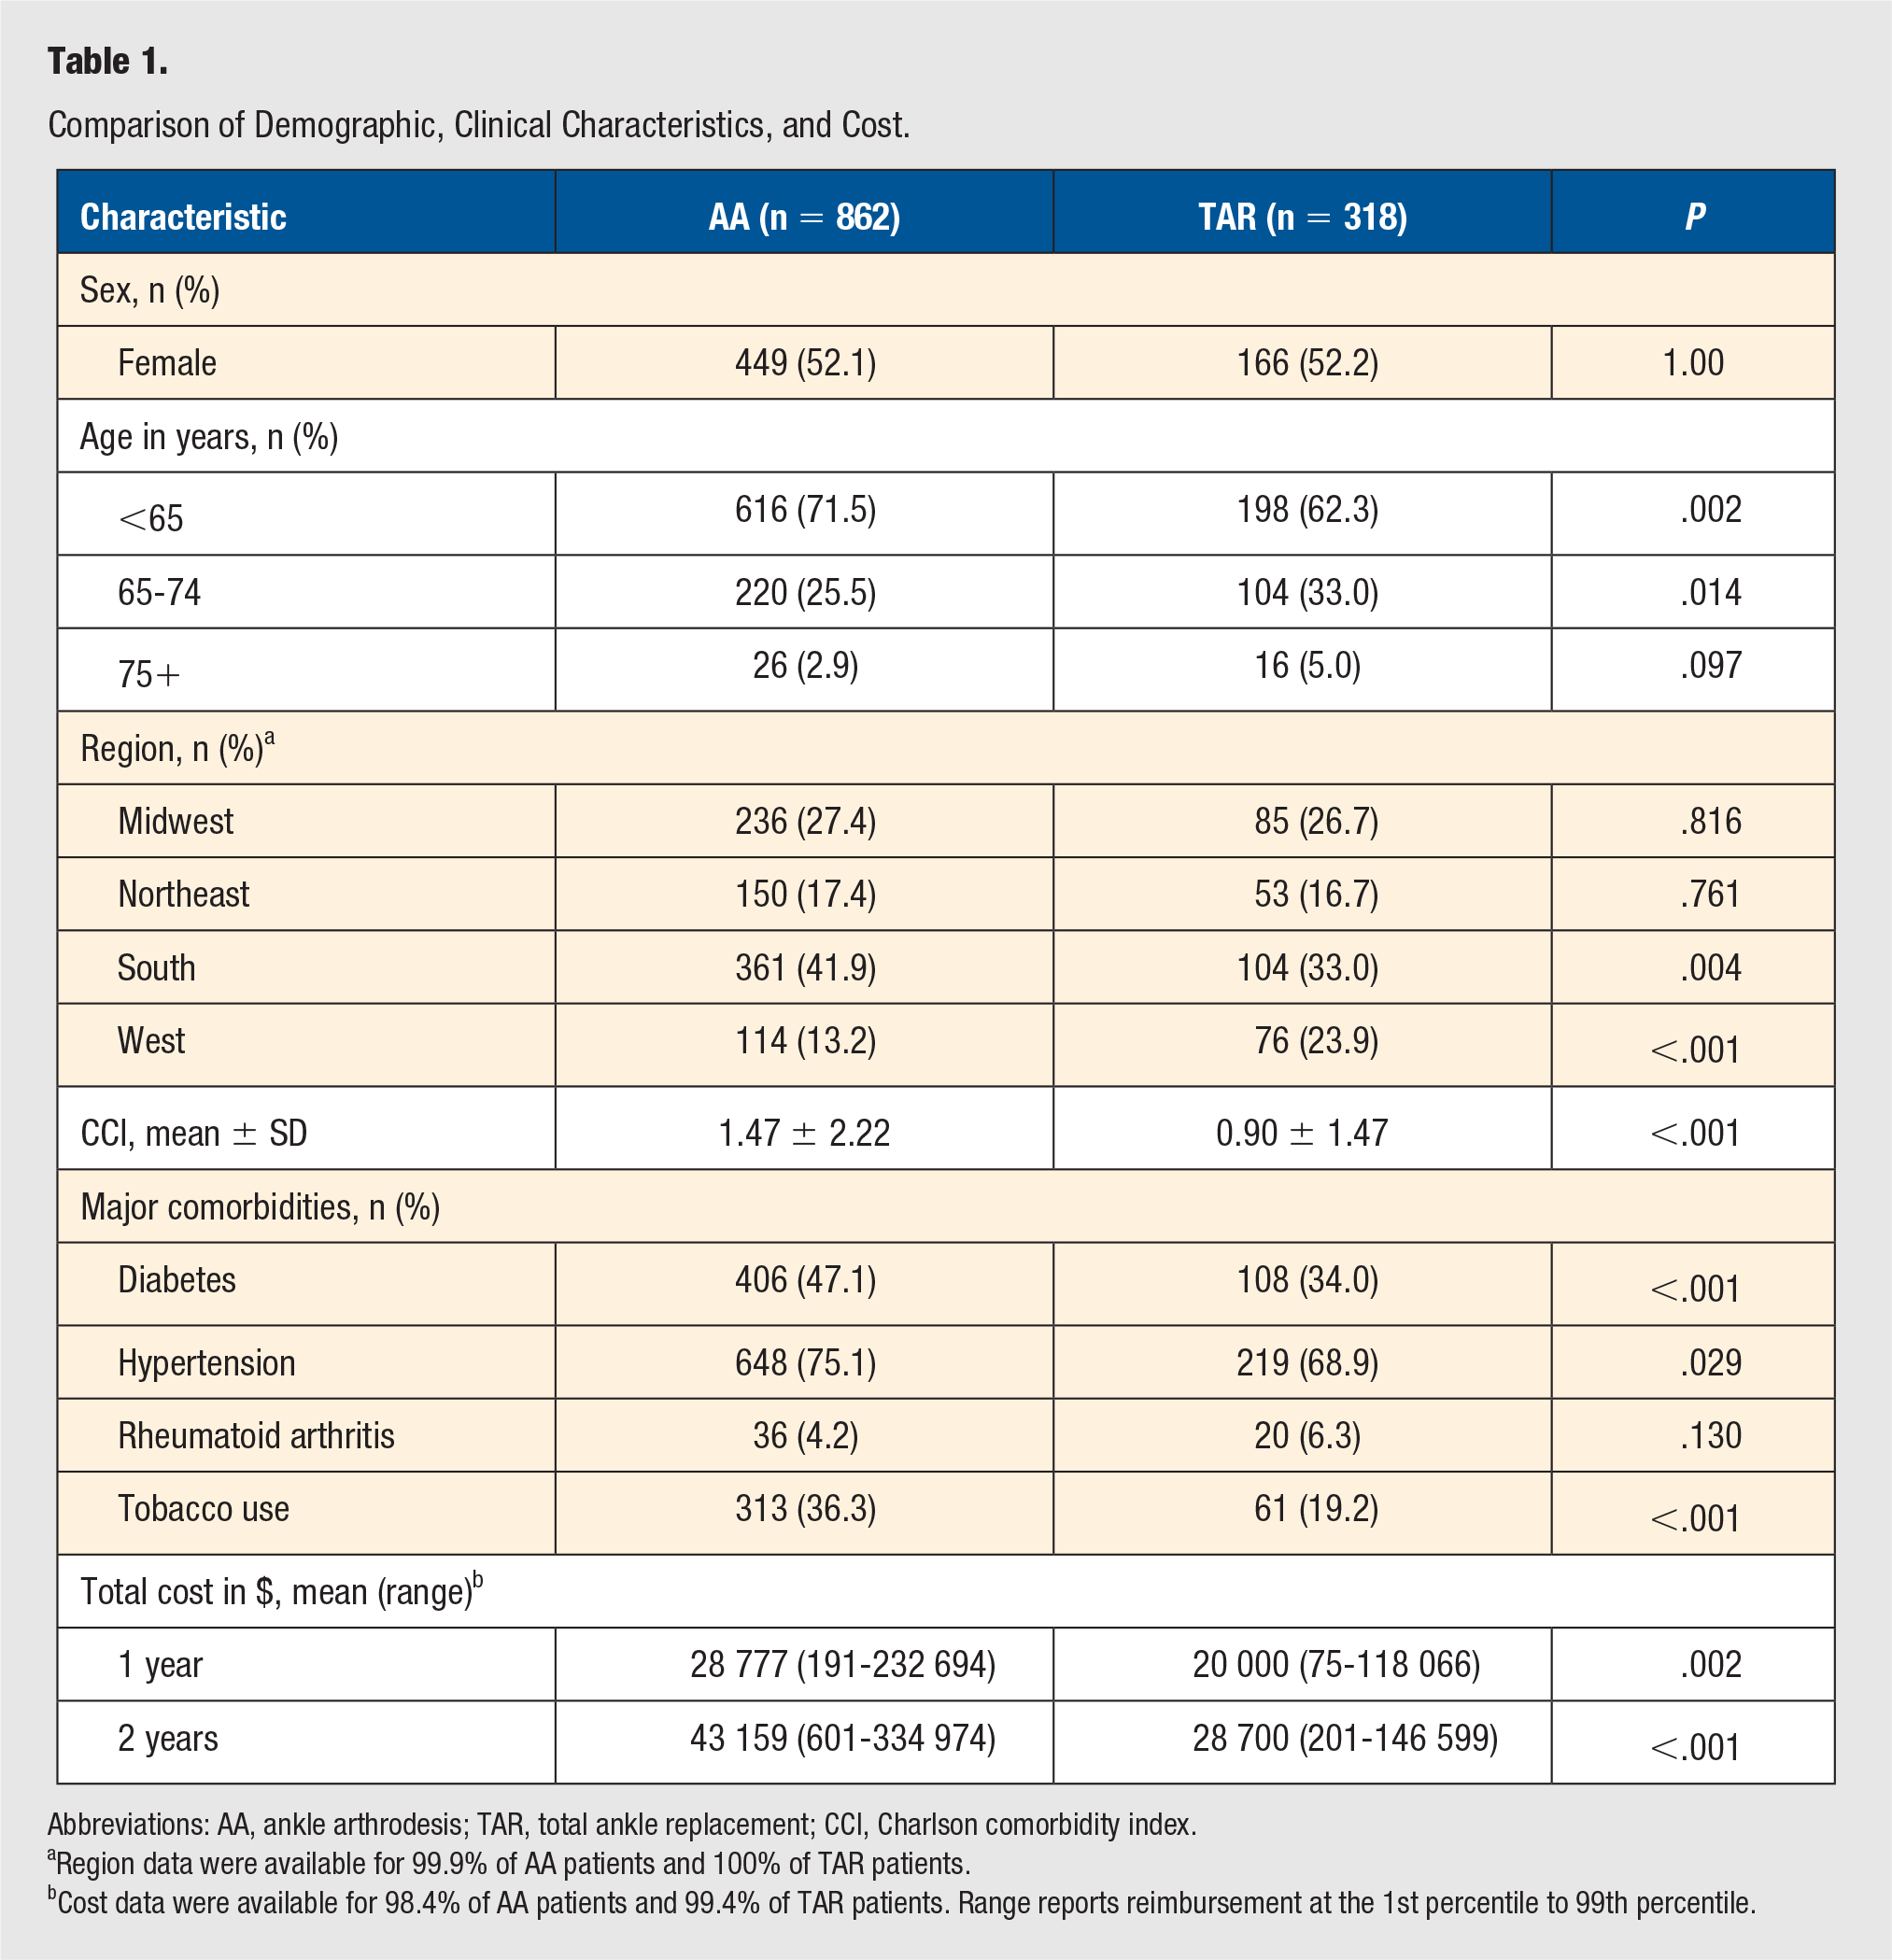
Abbreviations: AA, ankle arthrodesis; TAR, total ankle replacement; CCI, Charlson comorbidity index.
Region data were available for 99.9% of AA patients and 100% of TAR patients.
Cost data were available for 98.4% of AA patients and 99.4% of TAR patients. Range reports reimbursement at the 1st percentile to 99th percentile.
Statistical Analysis
Statistical analyses were performed using R statistical software (R Project for Statistical Computing) integrated with the PearlDiver software with an α level set to .05. Demographic data, clinical characteristics, and cost data were compared using chi-square analysis for categorical variables and Welch’s t test for continuous variables. Odds ratios (OR) with corresponding 95% confidence intervals (CI) were calculated using multivariable logistic regression adjusting for potential confounders, including patient age, sex, diabetes, tobacco use, and CCI to compare rates of reoperation at 1 and 2 years postindex procedure.
Results
Reoperations within 1 and 2 years were queried for both patient cohorts (Table 2). Rates of at least 1 reoperation were higher in the AA cohort both at 1 year (305 [35.4%] vs 55 [17.3%]; OR 2.32; 95% CI, 1.68-3.26) and 2 years (364 [42.2%] vs 66 [20.8%]; OR 2.51; 95% CI, 1.84-3.45). Local ORIF was more likely in patients who underwent AA at 1 year (108 [12.5%] vs 13 [4.1%]; OR 2.91; 95% CI, 1.65-5.55) and 2 years (112 [13.0%] vs 19 [6.0%]; OR 2.05; 95% CI 1.25-3.53). Additionally, patients who received AA were more likely to have hardware removal at both 1 year (141 [16.4%] vs 22 [6.9%]; OR 2.62; 95% CI, 1.65-4.33) and 2 years (196 [22.7%] vs 32 [10.1%]; OR 2.56; 95% CI, 1.72-3.91) following the index procedure. Patients who underwent AA also exhibited higher rates of adjacent fusion procedures at 1 year (108 [12.5%] vs 14 [4.4%]; OR 2.83; 95% CI, 1.63-5.29) and 2 years (146 [16.9%] vs 17 [5.3%]; OR 3.47; 95% CI, 2.10-6.11). Although PJI was more common among patients who received AA at both time postoperative time intervals, neither reached statistical significance.
Major Postoperative Reoperations in Patients Who Received AA and TAR for Posttraumatic Indications.
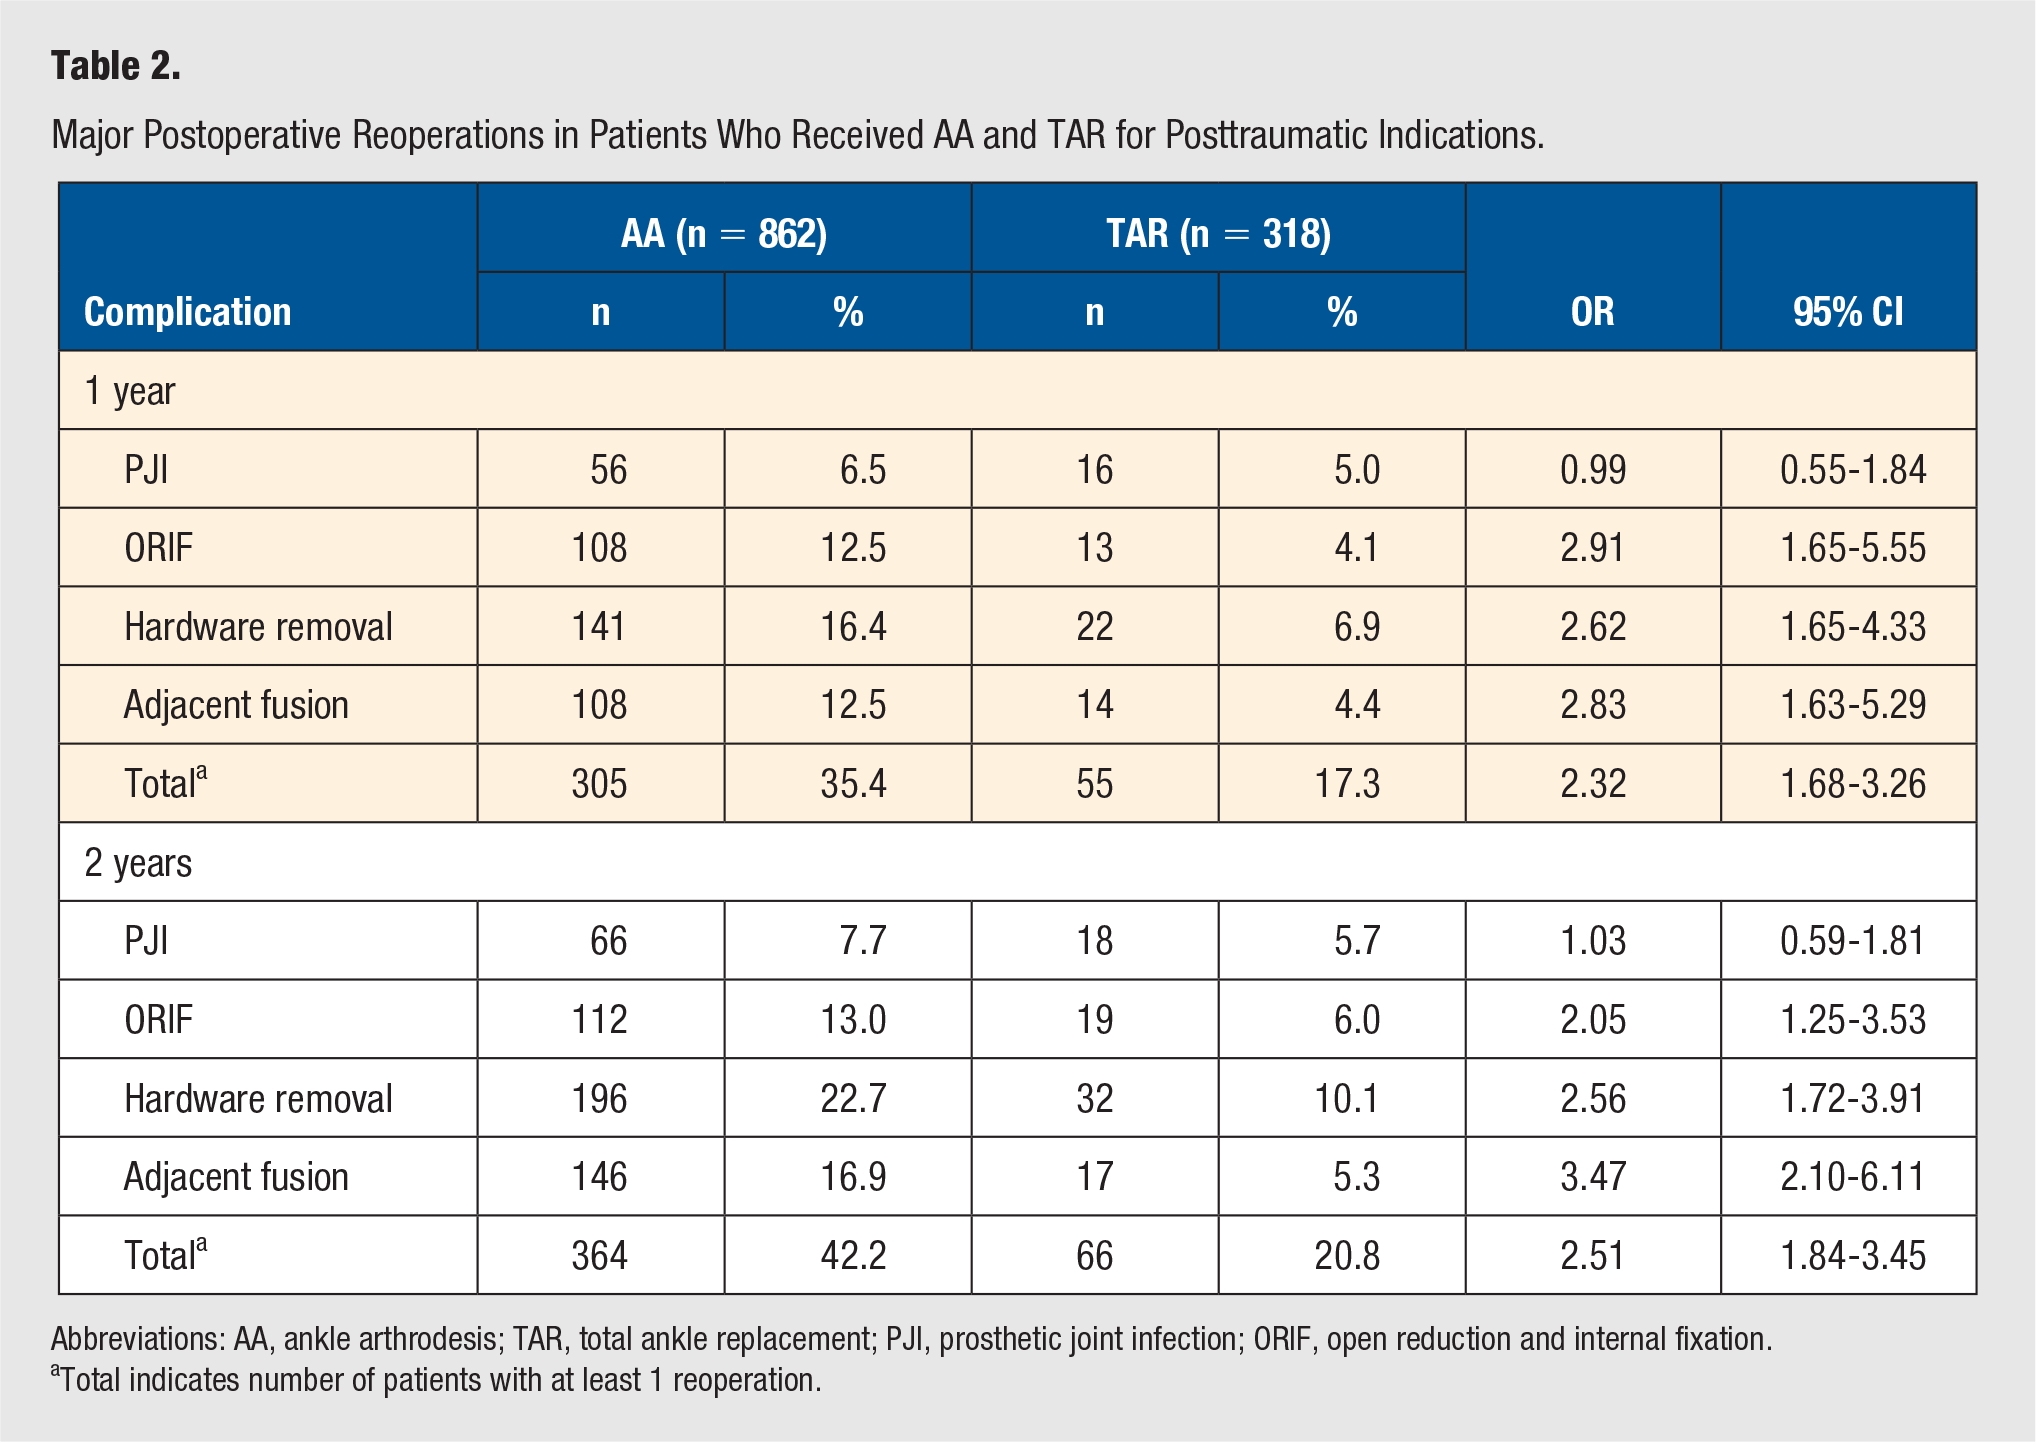
Abbreviations: AA, ankle arthrodesis; TAR, total ankle replacement; PJI, prosthetic joint infection; ORIF, open reduction and internal fixation.
Total indicates number of patients with at least 1 reoperation.
Post hoc power analysis using the effect size showed this study was powered at 14.4% and 20.3% for PJI at 1 year and 2 years, respectively, and powered >90% for all other complications. To achieve 80% power and detect small differences in rates of PJI at 2 years postoperatively between the AA and TAR cohorts, assuming expected incidence reported in recent literature, 18 the cohorts would have to be 1057.
Discussion
A clear consensus on the best operative management of end-stage PTOA has not yet been reached. The present analysis illustrates subsequent operative intervention was more common following AA compared with TAR for posttraumatic indications in the short to medium term. This included higher rates of subsequent local ORIF, hardware removal, and adjacent joint fusion compared to patients that received TAR. Although PJI was more prevalent in the AA cohort, it was not statistically more likely at either time interval.
Patients who received AA were younger and more likely to have diabetes and use tobacco. This result is similar to findings from prior work.9,15,17,19 AA has traditionally been recommended for younger, more active patients, whereas TAR has been used in older, lower demand patients. 1 Patients with diabetes are less likely to receive TAR due to increased risk of neuropathy, pressure ulcers, septic arthritis, and possibly early-onset osteolysis.20,21 Similarly, tobacco use is a relative contraindication to TAR due to an increased risk of poor functional outcomes and wound complications,22,23 though it is also associated with a higher risk of wound complications and nonunion following AA.20,24
Prior studies have reported higher postoperative complication rates following AA compared to TAR.17,25,26 The present study reached a similar conclusion with regard to subsequent operative intervention. Rates of subsequent local ORIF were higher in the AA cohort at both time intervals. Such intervention includes management of arthrodesis nonunion, which prior literature has estimated to occur in 12% of patients, 24 as well as augmentation of malaligned internal fixator constructs. 27 ORIF following either procedure could also reflect reduction of intraoperative (eg, medial malleolar fractures during TAR) or periprosthetic fractures. Higher rates of hardware removal following AA at 1 year (16.4% vs 6.9%) and 2 years (22.7% vs 10.1%) also aligns with prior studies. Deep implant removal accounts for a large proportion of reoperations following AA and recent literature reported comparable rates to the present study at 1 year (18.8% 18 vs 16.4%). Use of an external fixator with subsequent removal is another possible element especially in a posttraumatic setting.27,28 Adjacent joint fusion was more prevalent in the AA cohort at each postoperative time interval. This result was also found by Stavrakis and colleagues who reported patients receiving TAR were less likely to receive subtalar fusion (hazard ratio [HR] 0.45; 95% CI, 0.24-0.83) after the index procedure. 19 High rates of subsequent adjacent fusion procedures in these patients is likely attributed to accelerated development of adjacent joint disease following fusion of the tibiotalar joint.10,12,13
Lower rates of reoperation following TAR contrasts results from prior studies.15,25,29,30 This result may be secondary to the higher burden of preexisting comorbidities in the AA cohort, as is illustrated by higher average CCI score, increased experience among surgeons performing TAR, 19 and/or longer survivorship associated with newer generation TAR implants. 31 From an economic standpoint, though TAR may be more costly than AA initially, 18 the present analysis found AA was significantly more expensive at both 1- and 2-years post-index procedure. This result suggests lower rates of reoperation may ultimately make TAR a clinically and financially superior option for certain patients in the short to medium term,11,32 though a more granular financial analysis of long-term outcomes is warranted.
PJI was more common in the AA cohort at both 1- and 2-year postdischarge. Stavrakis et al 19 found patients who received TAR were less likely to develop a PJI postoperatively as compared with patients who underwent AA (OR 0.28; 95% CI, 0.10-0.80). Merrill et al 33 reported higher rates of readmission for patients who received AA (4.4%) versus TAR (1.4%), and PJI was the most common reason for readmission following AA. Since patients who receive AA tend to have more preexisting comorbidities,9,26,33 it is possible that these patients’ poorer overall health status plays a larger role in the development of postoperative complications than differences between the procedures themselves. This predisposition may explain why PJI was more prevalent but not statistically more likely for patients receiving AA after adjusting for CCI and other potential confounders. Additionally, as indicated by the power analysis, our study may be underpowered to detect significant differences in rates of PJI. Future large-scale randomized controlled trials are warranted to better understand the risk profile associated with each of these procedures in the long term.
There are several limitations to this study. Although various arthrodesis techniques and arthroplasty implants exist,25,34-36 it is not possible to characterize or differentiate these and other granular operative details in a claims database. The complicated nature of medical billing creates a possibility of coding bias with the manual entry of billing codes. Though such errors are inherent to any analysis of administrative claims data, the Center for Medicare and Medicaid Services (CMS) recently reported such instances comprise only 1.0% of payments. 37 Despite the available data being accurate, however, complications can be underreported in claims databases. 38 Furthermore, there is a particular lack of specificity and standardization in literature reporting on ankle joint replacements in terms of methodologies used to query patients and define outcome metrics.30,39,40 To increase the validity of comparing complication rates following AA and TAR, this analysis focused on similar complications requiring reoperation. However, despite the size of the PearlDiver database, the post hoc power analysis showed this study may be underpowered to detect small differences in effect size for PJI, a major complication of interest. The possibility of unreported complications and inability to quantify indirect costs to patients such as lost wages are related limitations of the cost comparison. Furthermore, while a true comparison of total cost would entail a much longer follow-up, analysis of true long-term outcomes (eg, 20-year follow-up) is not possible in PearlDiver. Because this study includes patient data from both prior to and after 2015, both ICD-9 and ICD-10 codes were used to query patients. Given that codes do not match exactly across ICD-9 and ICD-10, a translator application was used to identify and include all corresponding codes. The inclusion criteria chosen did not explicitly include diagnosis codes for soft tissue injuries that can lead to PTOA; consequently, the analysis may not have captured all possible cases of PTOA. Additionally, because some codes used to define hardware removal are not specific to the ankle joint (CPT-20670 and CPT-20680), it is possible that hardware removal from other locations was captured. Last, radiographic images, patient satisfaction, and functional outcomes data are not available within PearlDiver.
Strengths of the present study include the ability to longitudinally track large cohorts of patients and adjust for confounding variables (eg, CCI) in comparisons of reoperation rates following AA and TAR performed for similar indications. Additionally, while prior database studies have been limited to single payors such as Medicare or single care settings (eg, only inpatient data in the National Inpatient Sample), this analysis includes patients from all payors and both the inpatient and outpatient setting, which improves the external validity of the data.
Conclusion
Patients who received primary AA for posttraumatic indications exhibited higher rates of major reoperations at 1- and 2-year postdischarge relative to patients that underwent TAR. Rates of hardware removal, local ORIF, and adjacent joint fusion were higher among patients that underwent AA, though incidence of PJI was comparable. More research analyzing larger samples is needed to characterize longitudinal clinical outcomes of these procedures, further analyze differences in outcome based on indication, and delineate the risks and benefits of each at the individual patient level.
Supplemental Material
sj-pdf-1-fas-10.1177_1938640021993630 – Supplemental material for Reoperation Rates Following Total Ankle Arthroplasty Versus Ankle Arthrodesis for Posttraumatic Indications
Supplemental material, sj-pdf-1-fas-10.1177_1938640021993630 for Reoperation Rates Following Total Ankle Arthroplasty Versus Ankle Arthrodesis for Posttraumatic Indications by Bailey J. Ross, Ian Savage-Elliott, Victor J. Wu, Travis R. Flick, William F. Sherman and Ramon F. Rodriguez in Foot & Ankle Specialist
Footnotes
Declaration of Conflicting Interests
The author(s) declared no potential conflicts of interest with respect to the research, authorship, and/or publication of this article.
Funding
The author(s) received no financial support for the research, authorship, and/or publication of this article.
Ethical Approval
Institutional review board exemption was granted for this study since provided data was deidentified and compliant with the Health Insurance Portability and Accountability Act (HIPAA)
Informed Consent
Not applicable.
Trial Registration
Not applicable.
Supplemental Material
Supplemental material for this article is available online.
References
Supplementary Material
Please find the following supplemental material available below.
For Open Access articles published under a Creative Commons License, all supplemental material carries the same license as the article it is associated with.
For non-Open Access articles published, all supplemental material carries a non-exclusive license, and permission requests for re-use of supplemental material or any part of supplemental material shall be sent directly to the copyright owner as specified in the copyright notice associated with the article.