
Abstract
Air pollution is a leading environmental determinant of health, yet few studies have assessed how long-term exposure to fine particulate matter (PM2.5) at the neighborhood level relates to life expectancy, a key indicator of population health and well-being. We conducted a nationwide ecological analysis of 66,717 U.S. census tracts to evaluate the association between average PM2.5 concentrations (2011–2014) and life expectancy at birth (2010–2015). PM2.5 estimates were derived from the Environmental Protection Agency’s Downscaler model, and sociodemographic covariates, including poverty, income, education, insurance coverage, housing conditions, and racial composition, were obtained from the American Community Survey. In unadjusted models, each 1 microgram per cubic meter (µg/m3) increase in PM2.5 was associated with a 0.23-year reduction in life expectancy. After adjusting for tract-level sociodemographic characteristics using multivariable linear regression, the association persisted at 0.19 years (p < 0.001). Interaction models revealed that this negative association was significantly stronger in tracts with higher proportions of Black residents, indicating a disproportionate burden among structurally marginalized communities. These findings suggest that air pollution contributes meaningfully to spatial inequities in life expectancy in the United States. By integrating environmental exposure data with neighborhood sociodemographic conditions, this study highlights the intersection of place, pollution, and structural disadvantage. Public health and environmental policy efforts should address not only overall reductions in air pollution but also its uneven distribution across communities. Understanding how place-based exposures reinforce existing social and racial inequities is critical to advancing health equity.
INTRODUCTION
Ambient fine particulate matter, or PM2.5, poses a serious and sustained threat to population health.1,2,3 PM2.5 refers to airborne particles with an aerodynamic diameter less than or equal to 2.5 µm, that is, particles of various irregular shapes that behave as 2.5-micron (or smaller) spheroid particles. PM2.5 can be inhaled deeply into the lungs and even enter the bloodstream, contributing to a range of adverse health outcomes. 4 Chronic exposure has been linked to increased risk of cardiovascular disease, respiratory illness, cancer, developmental health, and premature mortality.5,6,7,8 PM2.5 is particularly significant to public health because of its ubiquity; it arises from numerous sources, including traffic emissions, power generation, industrial activity, and wildfires. 9 Despite regulatory advances, air pollution continues to exact a measurable toll on human life, and the burden of this exposure is not evenly distributed across communities. 10 These disparities are not merely geographic; they are deeply tied to the social, economic, and political characteristics of place. Where individuals live influences their exposure to environmental hazards, access to resources, and vulnerability to health harms. 11 Neighborhood-level factors, including historical disinvestment, infrastructure, green space, and healthcare availability, moderate the effects of pollution on population health.12,13 As a result, studying air pollution through a place-based lens may reveal how systemic inequalities are inscribed onto the physical environment and translated into health outcomes.
Environmental injustice is a well-documented phenomenon in which low-income communities and communities of color bear a disproportionate burden of environmental hazards.14,15,16,17 Historical and contemporary policies, including redlining, exclusionary zoning, industrial siting, and disinvestment, have placed marginalized populations in closer proximity to highways, refineries, and other pollution sources.18,19,20,21 Simultaneously, these communities often face barriers to health care access, quality housing, and economic opportunity. Structural racism, expressed through residential segregation and inequitable resource allocation, amplifies these disadvantages and may increase vulnerability to pollution-related health impacts.22,23 Yet few studies have explicitly tested whether the health effects of PM2.5 are greater in racially marginalized communities, particularly using data at the local level where these disparities are most pronounced. Although prior research has documented unequal exposures, relatively few studies have empirically tested whether racial composition modifies the health effects of pollution at such a granular geographic level.24,25 This analysis helps bridge that gap by examining whether predominantly Black communities face amplified health risks, not just greater exposure.
We prespecified the share of residents who are Black as our primary contextual moderator for three reasons. First, Black communities in the United States have experienced the most well-documented, structurally driven inequities in both air-pollution exposure and life expectancy, rooted in residential segregation and disinvestment. 26 Second, at the census-tract scale, the American Community Survey (ACS) measures Black population with smaller relative sampling error than several other minoritized groups, providing more precision for interaction estimates. 27 Third, narrowing to a single, theory-driven moderator avoids multiple-comparison penalties and overfitting from simultaneously testing many race/ethnicity terms. 28 This focus does not imply an absence of disparities in other groups; rather, it reflects a data-informed, hypothesis-driven choice for this analysis.
Prior work has demonstrated a consistent relationship between long-term PM2.5 exposure and life expectancy at the county level. For example, Correia et al. found that a 10 µg/m3 reduction in PM2.5 was associated with a 0.35-year increase in life expectancy across 545 U.S. counties from 2000 to 2007. 29 Previously, Pope et al. examined changes in life expectancy across 211 U.S. counties and found that a 10 µg/m3 reduction in PM2.5 between the early 1980s and early 2000s was associated with a 0.61-year increase in life expectancy. 30 However, counties can obscure important within-area heterogeneity, failing to account for how environmental exposures and health outcomes vary from neighborhood to neighborhood.
Two recent census-tract-level analyses used multilevel models to partition geographic variation and examine contextual modification. deSouza et al. related PM2.5 components (e.g., organic matter, sulfate) to age-specific mortality risk (ASMR), showing stronger associations in underprivileged tracts. 31 Boing et al. examined PM2.5 and ASMR and reported that associations were larger in lower socioeconomic status tracts. 32 Together, these studies emphasize the importance of neighborhood context and, in one case, particle composition; however, both focus on mortality risk, not life expectancy, and prioritize socioeconomic disadvantage rather than directly testing racial composition as an effect modifier.
Conversely, these studies do not (i) evaluate life expectancy as the outcome at the census-tract scale using a unified national model; (ii) explicitly test whether racial composition (% Black) modifies the PM2.5–health association after adjusting for socioeconomic covariates; or (iii) quantify how the PM2.5 gradient changes across racial-composition strata while distinguishing the baseline level from pollution effect differences.
Of note, although ASMR contains more detailed age-specific information, we chose life expectancy as our primary outcome because it provides a single, interpretable summary measure of mortality that can be compared directly across census tracts. Life expectancy is less sensitive to small-area fluctuations in age-specific death counts at the census tract level and is widely used in environmental justice and population health research to communicate inequities in longevity.33,34,35
Our study closes these gaps by modeling tract-level life expectancy nationwide with a prespecified PM2.5 × % Black interaction, adjusting for several social determinants of health. We leverage daily tract-level estimates of PM2.5 from the Environmental Protection Agency’s (EPA’s) Downscaler model, life expectancy estimates from USALEEP, and sociodemographic data from the ACS. Using linear regression models, we quantify the relationship between pollution and life expectancy while adjusting for structural factors such as poverty, income, educational attainment, insurance status, and housing characteristics.
We hypothesize that higher long-term PM2.5 exposure is associated with lower life expectancy and that this association is more pronounced in tracts with higher percentages of Black residents. By examining these patterns at the granular tract level across the entire United States, this study provides a geographically detailed, equity-focused view of how PM2.5 pollution and structural factors combine to shape the longevity of American communities.
METHODS
Study design and data sources
Institutional review board approval was not pursued, as the study relied exclusively on secondary analysis of publicly available, de-identified data and did not involve human subjects as defined by federal regulations. All data processing and statistical analyses were conducted using R (version 4.5.0). 36
We conducted a retrospective cross-sectional ecological study to assess the relationship between long-term ambient PM2.5 exposure and life expectancy at the census tract level across the contiguous United States and to determine whether this relationship was modified by racial composition. Alaska, Hawaii, and U.S. territories were excluded due to geographic discontinuity and limited availability of harmonized air pollution and sociodemographic data at the census tract level. The unit of analysis was the census tract, a geographic unit commonly used for neighborhood-level analyses. 37 Census tracts offer a finer spatial resolution than counties or ZIP codes and are widely used to assess place-based health disparities, as they approximate neighborhood-level contexts relevant to both exposure and resource access. 38 In 2015, there were 73,057 census tracts in the United States; however, due to limitations in data availability and reporting across key variables, our final analytic sample included 66,717 tracts spanning 48 states and the District of Columbia. 39
Life expectancy data were obtained from the United States Small-Area Life Expectancy Estimates Project (USALEEP), a collaboration between the National Center for Health Statistics (NCHS), the Robert Wood Johnson Foundation, and the National Association for Public Health Statistics and Information Systems. USALEEP provides estimates of life expectancy at birth for nearly all census tracts in the United States, based on mortality data from 2010 through 2015 and population estimates from the 2010 Census and the 2011–2015 ACS.14
PM2.5 data were sourced from the Centers for Disease Control and Prevention’s National Environmental Public Health Tracking Network. 40 We used modeled daily PM2.5 predictions from the U.S. EPA’s Downscaler model at the census tract level for the years 2011–2014. 41 These modeled estimates provide consistent, high-resolution data even in areas without ground monitoring stations. The Downscaler blends Community Multiscale Air Quality (CMAQ) model outputs with EPA Air Quality System monitoring data using a Bayesian space–time statistical fusion approach that smooths random noise and improves prediction accuracy in locations with sparse monitoring coverage. 42 This fusion framework produces tract-level PM2.5 estimates with higher spatial resolution and reduced measurement error compared with relying on monitors or CMAQ alone, making it well-suited for small-area epidemiological analyses.
To characterize chronic exposure, we averaged PM2.5 concentrations over the 4-year period for each tract. It should be noted that this measure estimated ambient PM2.5 concentration and was used as a proxy of exposure. This timeframe was selected to align closely with the life expectancy estimates from USALEEP, which reflect mortality patterns from 2010 to 2015. Although the exposure and outcome periods overlap slightly, this alignment was intentional to ensure that long-term environmental exposures corresponded with multiyear mortality risk.
Sociodemographic covariates were obtained from the 2010–2014 5-year ACS and included the percentage of the population living below the federal poverty level, median household income (in 2014 dollars), percentage of adults without a high school diploma, percentage of residents identifying as non-Hispanic Black, percentage of uninsured individuals under age 65, percentage of renter-occupied housing units, and total tract population. Because these socioeconomic and housing variables are conceptually and statistically interrelated, they were included solely as confounding adjustment variables. We do not report or interpret their coefficients.
We selected tract-level covariates based on a conceptual framework in which structural, social, and economic conditions shape both exposure to air pollution and baseline life expectancy. Economic context was captured using median household income and percent of residents living below the federal poverty level, which reflect material resources and economic deprivation. Educational attainment (percent of adults without a high school diploma) and health care access (percent uninsured) represent structural barriers to knowledge, employment, and medical care that influence chronic disease and mortality risk. Housing-related measures, including percent renter-occupied units and percent of households living in crowded conditions, index residential precarity and constrained housing choices closely linked to neighborhood disinvestment and environmental exposures. These socioeconomic and housing variables were included solely as contextual confounders of the PM2.5–life expectancy relationship and were not interpreted as independent causal effects.
Percent non-Hispanic Black was included separately as a variable of substantive interest and as an indicator of racialized residential segregation that shapes both environmental exposures and baseline health conditions in the United States. Because racial composition is central to our research question, we report and interpret its coefficient and its interaction with PM2.5.
All datasets were merged using standardized 11-digit Federal Information Processing Standards codes, which uniquely identify census tracts across the United States. 43 To ensure tract-level alignment across sources, only tracts with complete life expectancy, PM2.5, and sociodemographic data were retained. Where variables were reported as proportions (e.g., insurance coverage), we converted them to percentages for consistency and interpretability. We performed complete-case analysis, excluding any tracts with missing values in exposure, outcome, or covariate fields.
Statistical analysis
We used multivariable linear regression models to estimate the association between long-term PM2.5 exposure and life expectancy at the tract level. This modeling approach was chosen for its interpretability and suitability for ecological data analysis. Models included a covariate-adjusted specification and an interaction model to assess effect modification by racial composition. Specifically, we included an interaction term between PM2.5 concentration and the percentage of Black residents in each tract to evaluate whether the relationship between air pollution and life expectancy varied across communities with different racial compositions.
To assess potential spatial dependence among observations, we calculated Moran’s I statistic on the residuals of the adjusted model. 44 This diagnostic evaluated whether spatial autocorrelation remained after controlling for covariates, which could suggest unmeasured spatial confounding.
We then fit an adjusted model including all covariates. To assess effect modification by racial composition, we included an interaction term between PM2.5 and the percentage of Black residents. We also explored interaction effects graphically by estimating marginal effects at varying levels of racial composition. All continuous predictors were mean-centered prior to modeling.
Model diagnostics were conducted to assess residual normality, linearity, and multicollinearity, including the use of variance inflation factors (VIFs). We prespecified VIF < 3 as low concern. All statistical tests were two-sided, with a significance threshold of p < 0.05. We conducted standard regression diagnostics to evaluate model assumptions. Residual-fitted and scale-location plots were inspected for functional form and homoscedasticity, and normal Q–Q plots were used to assess approximate residual normality. Potentially influential observations were examined using externally studentized residuals, leverage values, and Cook’s distance, flagging cases with |rstudent|>3, leverage > 2p/n, and Cook’s D > 4/(n − p − 1). As sensitivity checks, models were re-estimated after excluding tracts with |rstudent|>3 and after winsorizing life expectancy at the 0.5% tails.
RESULTS
Sample characteristics
The final analytic dataset included 66,717 U.S. census tracts with complete data on life expectancy, ambient PM2.5 exposure, and sociodemographic covariates. The mean life expectancy across all tracts was 78.4 years (standard deviation [SD] = 4.0), ranging from 56.9 to 97.5 years. PM2.5 exposure, averaged from 2011 to 2014, had a mean concentration of 9.5 µg/m3 (SD = 1.6), with values ranging from 3.9 to 16.6 µg/m3. Although these national means are informative, they conceal pronounced geographic variability in both pollution burden and health outcomes. Additional tract-level characteristics are summarized, including economic indicators and racial composition (Table 1).
Summary Statistics for Census Tract Characteristics, United States, 2011–2015 (N = 66,717)
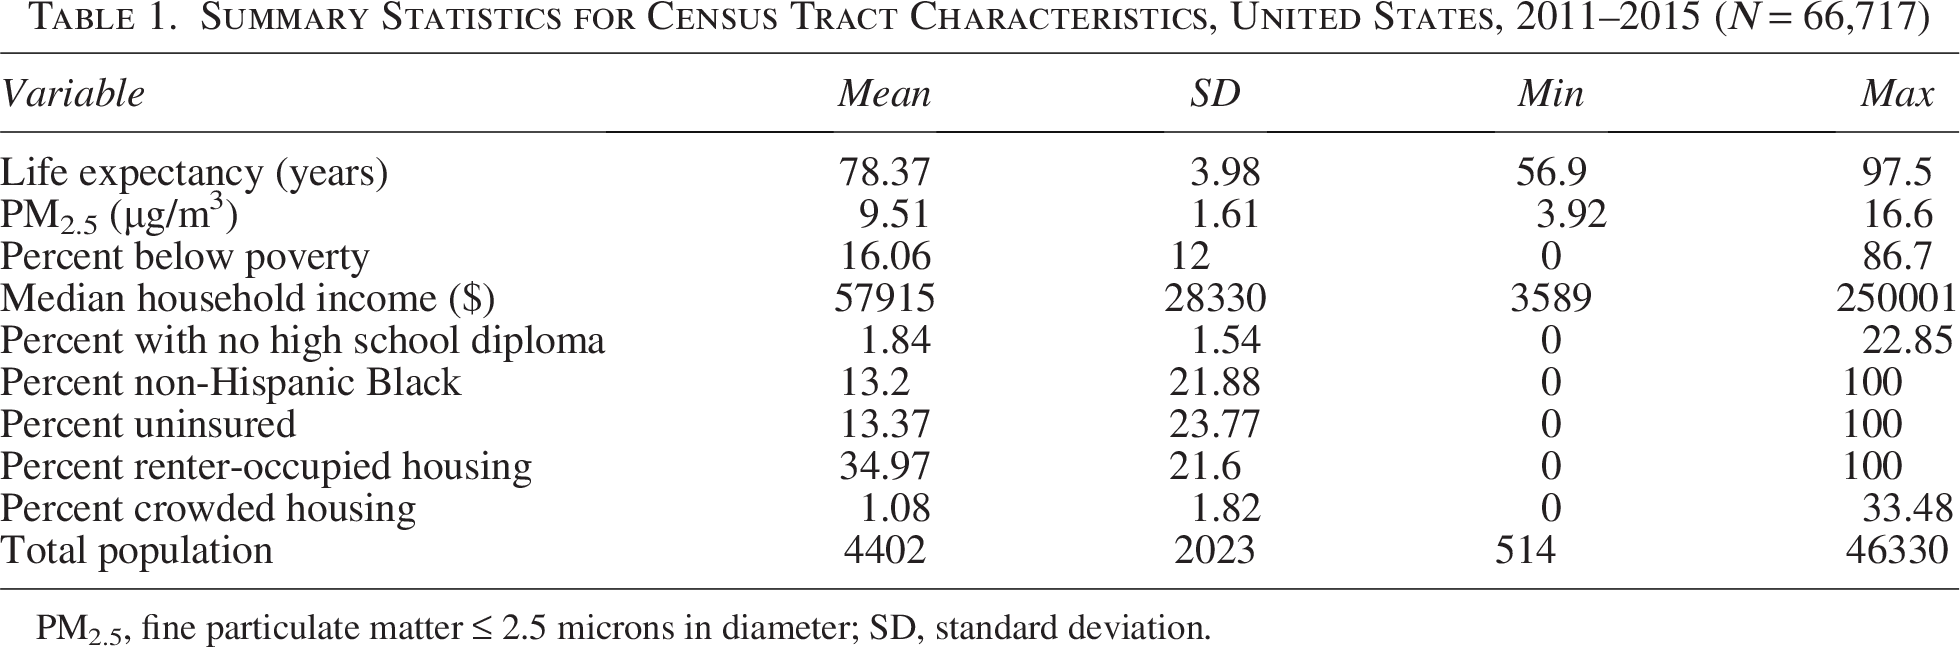
PM2.5, fine particulate matter ≤ 2.5 microns in diameter; SD, standard deviation.
The geographic distribution of PM2.5 and life expectancy across U.S. census tracts is shown through spatial mapping (Fig. 1). PM2.5 concentrations were generally higher in parts of California, the Midwest, and the Southeast, while life expectancy showed stark disparities, with lower values concentrated in the Deep South and portions of the Southwest. Blank areas on the maps represent census tracts with missing or suppressed data for either life expectancy or PM2.5; these tracts were excluded from analysis due to incomplete information.
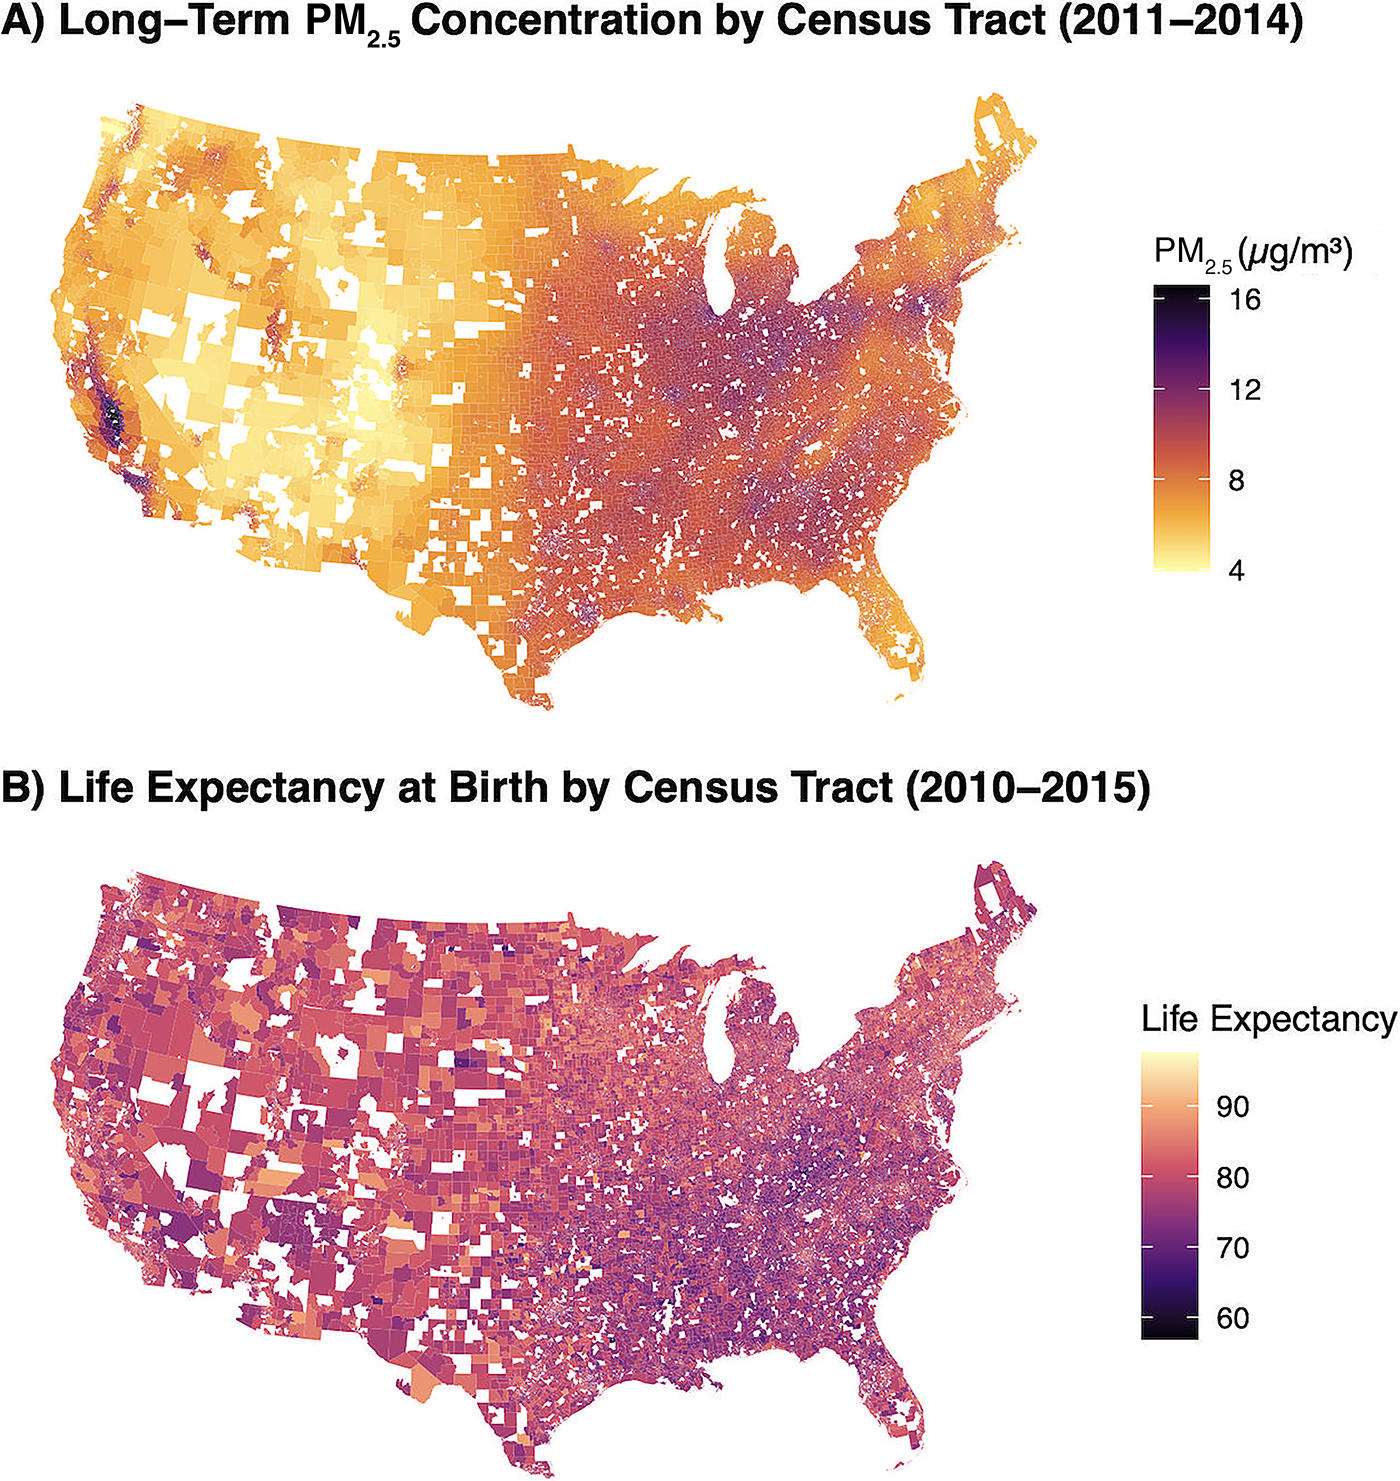
Census-tract-level distributions of PM2.5 and life expectancy.
Adjusted model
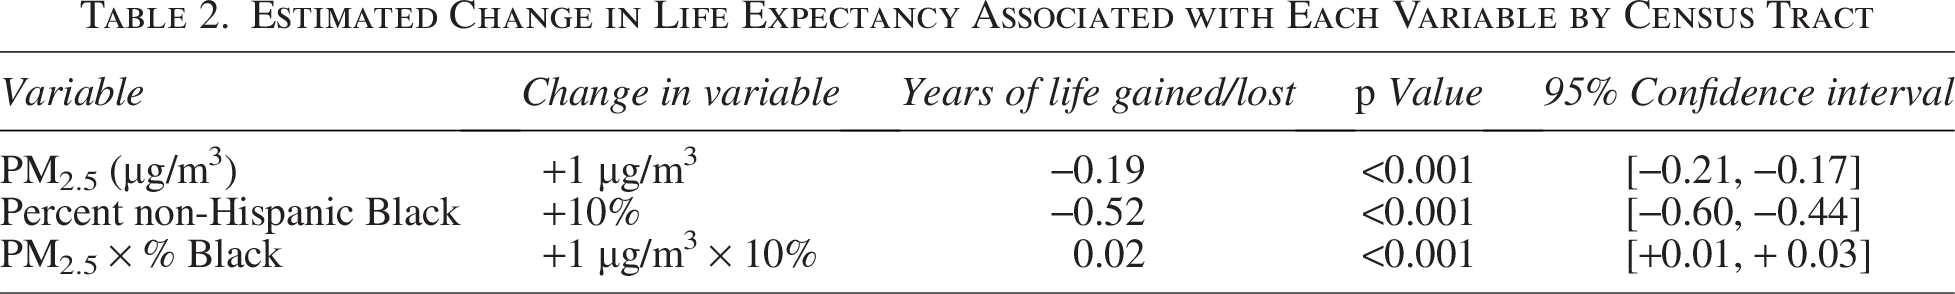
In the adjusted model, which controlled for poverty, income, education, insurance status, housing tenure, and racial composition, PM2.5 remained significantly associated with lower life expectancy. Each 1 µg/m3 increase in PM2.5 was associated with a 0.19-year decrease in life expectancy (p < 0.001).
Table 2 presents the estimated associations for PM2.5, percent Black, and their interaction. We then refit the model with predictors standardized (z-scores; mean 0, SD 1), so coefficients are comparable across variables. The outcome remained in years, so estimates represent years of life expectancy per 1 SD increase in each predictor (Fig. 2).
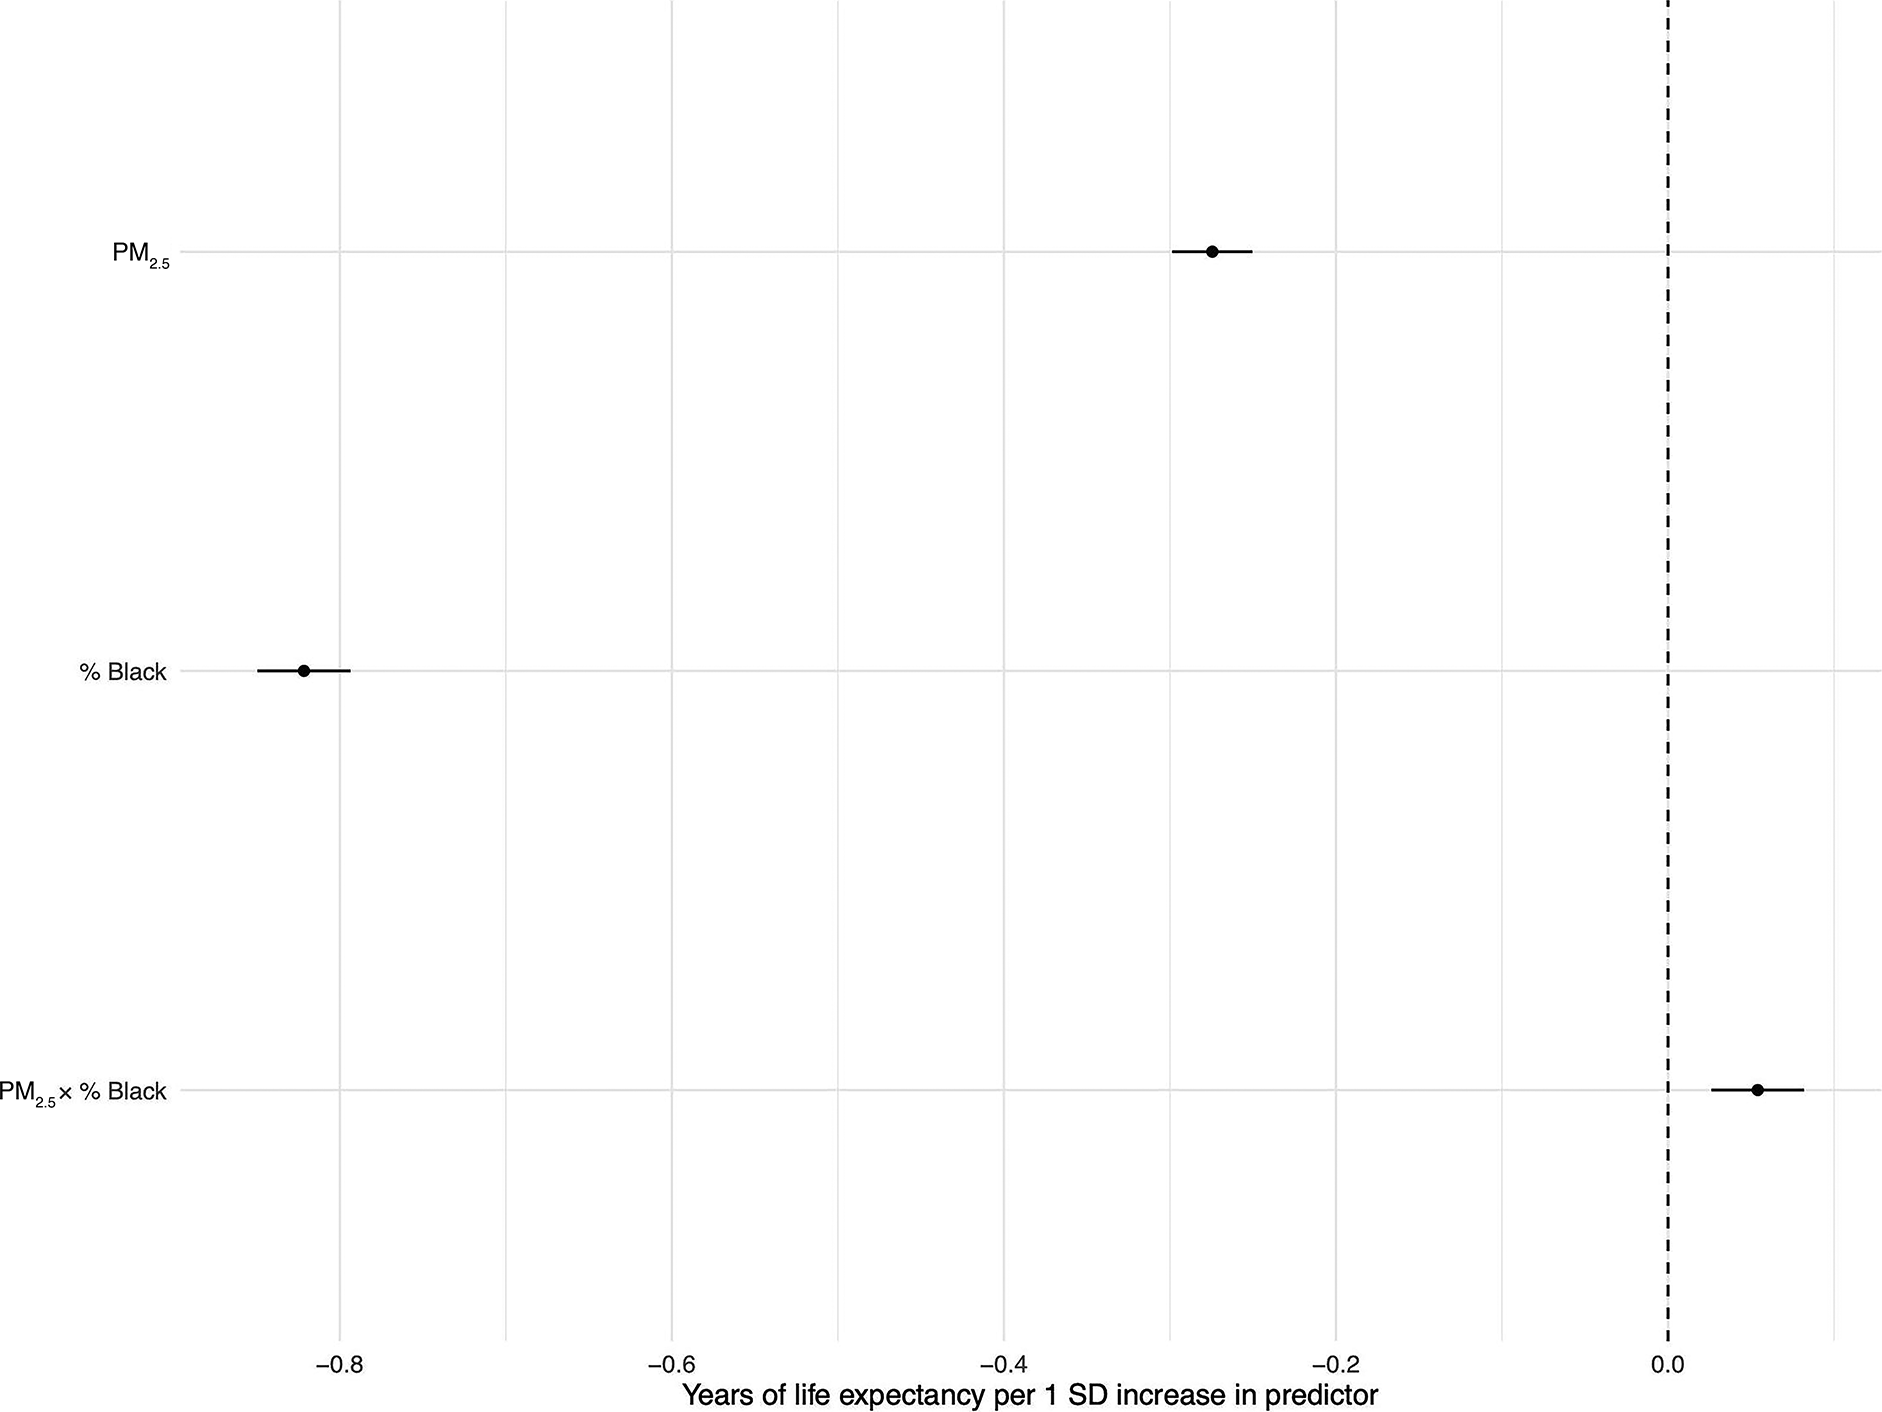
Adjusted regression coefficients for life expectancy. Points show coefficients from the adjusted linear model with predictors z-scored (mean = 0, SD = 1); horizontal bars are 95% CIs. The x-axis is years of life expectancy per 1 SD increase in each predictor, holding the others constant (values < 0 indicate lower life expectancy; >0 indicate higher). CIs, confidence intervals.
Estimated Change in Life Expectancy Associated with Each Variable by Census Tract
Interaction model
To evaluate effect modification, we added an interaction term between PM2.5 and percent Black population to the adjusted model. Both main effects remained statistically significant: Each 1 µg/m3 increase in PM2.5 was associated with a 0.19-year decrease in life expectancy (p < 0.001), and each 10-percentage-point increase in percent Black was associated with a 0.52-year decrease (p < 0.001). The interaction term (PM2.5 × percent Black) was also statistically significant (p < 0.001), indicating that the effect of PM2.5 on life expectancy varied by racial composition.
The negative association between PM2.5 and life expectancy was steepest in tracts with lower percentages of Black residents and attenuated as the percentage of Black population increased (Fig. 3).

Interaction between PM2.5 and census tract racial composition. Estimated association between PM2.5 concentration (µg/m3) and predicted life expectancy across census tracts with varying percentages of non-Hispanic Black residents. Model based on data from U.S. census tracts from 2011–2014. Colored lines reflect predicted life expectancy at 0%, 50%, and 100% Black population composition. Predicted values derived from an adjusted linear model. Tracts with higher % Black show attenuated associations between PM2.5 and life expectancy.
Residuals from both the adjusted and interaction models were approximately normally distributed and showed no major deviations from homoscedasticity. No patterns suggesting nonlinearity were observed in residual-versus-fitted plots. Leverage and influence diagnostics did not identify any highly influential tracts. All variation inflation factors (VIFs) were below 3.0, indicating acceptable levels of multicollinearity among predictors. Pairwise correlations among predictors were generally moderate; the largest absolute correlation in the matrix was in the 0.7 range (Fig. 4). Excluding tracts with |rstudent|>3 changed the PM2.5 coefficient from −0.191 to −0.183 (Δ = +0.008; −4.2%), and the PM2.5 × % Black interaction from +0.00153 to +0.00148 (−3.3%); both remained highly significant. Winsorizing the outcome at the 0.5% tails yielded PM2.5 = −0.189 (−0.9%) and interaction = +0.00157 (+2.5%). The pattern of effect modification was unchanged: the PM2.5–life expectancy slope was most negative in low-% Black tracts and attenuated with increasing percentage Black.
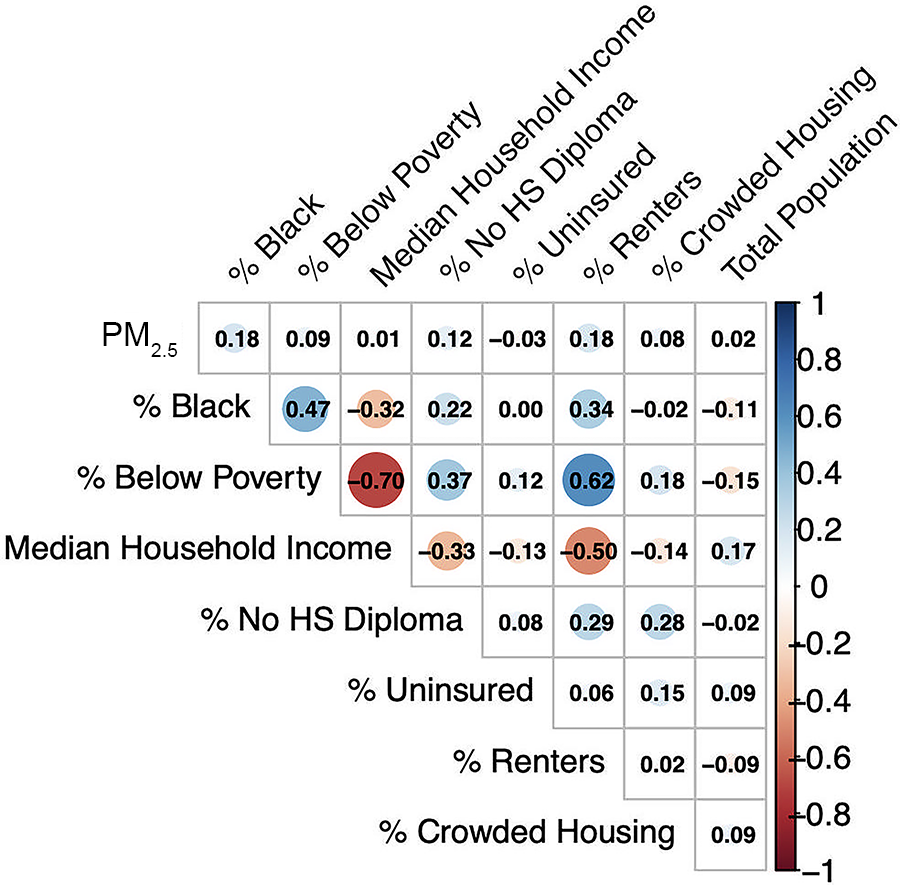
Pairwise correlations among predictors. Tiles show Pearson’s r for all covariate pairs across 66,717 U.S. census tracts (2011–2014); blue = positive, red = negative, with intensity proportional to magnitude.
DISCUSSION
In this national-census-tract-level analysis, higher long-term exposure to PM2.5 was significantly associated with lower life expectancy, even after adjusting for socioeconomic, housing, and demographic conditions. This finding aligns with extensive evidence demonstrating that PM2.5 contributes to population mortality differences. Pope et al. analyzed data from 211 U.S. counties and found that a 10 µg/m3 reduction in PM2.5 between the early 1980s and early 2000s was associated with a 0.61-year increase in life expectancy, accounting for up to 15% of the overall longevity gains in that period.30 More recently, Kim et al. used modeled PM2.5 estimates with finer spatial resolution and estimated life expectancy gains of 0.69–0.81 years per 10 µg/m3 reduction. Their use of modeled exposures extended coverage beyond regulatory monitors and improved geographic representativeness. 45
Compared with the Pope and Kim studies, our work differs in design, scale, exposure levels, and analytic approach. We examined 66,717 census tracts in a cross-sectional framework at today’s lower PM2.5 concentrations (mean 9.5 µg/m3, range 3.9–16.6), whereas prior studies focused on temporal declines during periods of substantially higher pollution. Our cross-sectional estimate of –0.19 years per 1 µg/m3 is different than those reported in longitudinal analyses, which is plausible given the narrower exposure range, finer spatial resolution, and different covariate structures. Taken together, these results reinforce longstanding concerns about environmental injustice and underscore the independent contribution of PM2.5 to population longevity.
Beyond the main effect, we observed a statistically significant interaction between PM2.5 and the percentage of Black residents, indicating that the pollution–life expectancy association varies across communities. The negative association between PM2.5 and life expectancy was steepest in tracts with lower percentages of Black residents and attenuated as the proportion of Black residents increased. This pattern should be interpreted strictly in relation to life expectancy and does not imply reduced vulnerability to pollution among predominantly Black communities.
Instead, the attenuation likely reflects longstanding structural inequities that produce systematically lower baseline life expectancy in many predominantly Black neighborhoods, leaving less variability for pollution to explain statistically. Air pollution exposures and racial residential patterns are also strongly correlated in the United States, meaning that part of the interaction may reflect shared spatial structure rather than true biological effect modification. 46 Moreover, life expectancy captures only one dimension of population health; communities may experience meaningful improvements in morbidity and quality of life with reduced pollution even when gains in longevity are constrained by other determinants such as chronic disease burden or limited access to health-promoting resources. Together, these findings underscore the importance of addressing both environmental exposures and structural determinants of health in efforts to reduce disparities in longevity.
This compounded burden is consistent with substantial evidence that environmental and social vulnerabilities cluster spatially. Historical patterns of residential segregation, redlining, and underinvestment have disproportionately situated Black communities closer to highways, industrial zones, and other pollution sources, while simultaneously limiting access to healthcare, economic opportunity, and other protective factors.47,48,49 Prior work demonstrates that environmental risks, including PM2.5 exposure, are not evenly distributed but are shaped by structural racism and spatial inequality. For example, Alvarez found that states with higher structural racism had significantly greater environmental health risks from air toxics, and Mullen et al. showed that schools serving marginalized students faced higher PM2.5 exposures even under cleaner air scenarios.50,51 Although our design does not assess whether improvements in air quality yield differential gains in life expectancy, the observed disparities highlight how unequal baseline conditions shape vulnerability to pollution-related health impacts and underscore the need for policies that center environmental equity. This underscores the urgent need for targeted interventions, policies that center environmental equity and ensure that historically overburdened communities are not left behind.
We also noted that tract-level life expectancy estimates ranged from 56.9 to 97.5 years. Tracts at these extremes were uncommon and typically represented small populations with atypical residential compositions (e.g., prisons, military bases, college campuses, age-restricted communities). Such settings can yield extreme estimates due to age structures and limited death counts. Diagnostic analyses showed no highly influential observations, and results were robust to outlier handling, indicating that extreme tracts did not drive the main findings.
LIMITATIONS
This study has several limitations. First, the analysis is cross-sectional and ecological in nature. As such, it does not allow for causal inference or account for lifetime exposure histories or individual-level risk factors. Future longitudinal or quasi-experimental designs could better establish temporality and causality. Second, although census tracts offer greater resolution than counties, they still contain internal heterogeneity, and results may be sensitive to boundary definitions. Our findings should therefore be interpreted as reflecting average conditions within tracts, not individual-level effects.
Third, PM2.5 data were averaged over a 4-year period (2011–2014) to align with life expectancy estimates (2010–2015); however, this may not fully capture the cumulative or lagged effects of pollution on health. Longer term exposure histories, if available, may provide a more comprehensive measure of environmental burden. Fourth, some census tracts were excluded due to incomplete data. Of the approximately 73,000 census tracts in the United States, we included 66,717 in the final analysis. Tracts with missing values for PM2.5, life expectancy, or key sociodemographic variables were omitted, which may introduce selection bias if excluded tracts systematically differ from those retained. Related to this, because we relied on modeled PM2.5 concentrations rather than direct measurements, our exposure estimates may not fully capture the true spatial distribution of PM2.5. The EPA Downscaler uses statistical fusion between CMAQ model outputs and ground monitors, but its accuracy depends on underlying emissions inventories and the density of monitoring data. In areas where emissions are underreported or monitors are sparse, modeled concentrations may be biased or overly smoothed, particularly in locations with highly localized sources. These limitations, which are common to small-area environmental exposure studies, may lead to exposure misclassification.
Fifth, although the models adjust for a range of structural factors, unmeasured confounding remains possible. Variables such as access to health care, neighborhood safety, or environmental co-exposures (e.g., NO2, lead) were not included due to data limitations. Relatedly, residual spatial autocorrelation represents an additional limitation. Residual diagnostics from our adjusted model revealed statistically significant spatial autocorrelation (Moran’s I = 0.245, p < 0.001), suggesting that geographically proximate census tracts had more similar residuals than expected by chance. This pattern implies that unmeasured spatial processes or omitted geographically patterned variables, such as local healthcare infrastructure, land use characteristics, or co-exposures to other pollutants, may partially confound the observed associations. Although our models included several key sociodemographic factors, we were unable to account for all potential spatially structured determinants of health. Future analyses using spatial regression techniques or incorporating additional geographic covariates may help to further disentangle these effects.
Finally, the interpretation of interaction terms in linear models requires care. Although the PM2.5 × percent Black interaction was statistically significant, the absolute effect modification was modest. Nonetheless, given the population scale of this study, even small differences in exposure effects can translate into meaningful public health disparities when considered across communities.
CONCLUSION
This study demonstrates that PM2.5 exposure is negatively associated with life expectancy across U.S. census tracts and that this relationship is moderated by racial composition, with stronger effects observed in predominantly Black communities. By leveraging national data at the neighborhood level, we reveal how environmental and structural inequities jointly shape health outcomes. These findings underscore the need for environmental policy approaches that explicitly incorporate principles of equity and justice.
Efforts to reduce air pollution must prioritize communities that face both elevated exposures and systemic barriers to health, to achieve more equitable health outcomes nationwide. Future policy should focus not only on reducing pollution but also on addressing the structural conditions—like residential segregation, disinvestment, and lack of access to care—that limit the benefits of environmental improvement. Only by integrating place-based strategies with structural reforms can we ensure that cleaner air translates into longer, healthier lives for all communities.
Footnotes
ACKNOWLEDGMENTS
This research made use of publicly available data from the U.S. EPA, the U.S. Census Bureau, and the USALEEP project developed by the NCHS and the Robert Wood Johnson Foundation. I also acknowledge the communities most affected by environmental injustice and health disparities, whose lived experiences motivate this work. No external funding was received, and no individuals contributed to this article beyond the author.
DATA AVAILABILITY STATEMENT
All data used in this study are publicly available. Life expectancy data were obtained from the USALEEP. PM2.5 estimates were sourced from the EPA’s Downscaler model via the CDC National Environmental Public Health Tracking Network. Sociodemographic covariates were derived from the ACS (2010–2014). All datasets are available through publicly accessible government repositories.
AUTHOR DISCLOSURE STATEMENT
The author declares no conflicts of interest.
FUNDING INFORMATION
No external funding was received.