
Abstract
Across the United States, environmental hazards differentially burden low-wealth communities of color due to institutionalized racism and discriminatory practices in zoning, land use, and community development. This is observed in the predominantly African American City of Uniontown, Alabama. Community members in Uniontown have long complained of poor health conditions associated with local operations of the Arrowhead Landfill, the Southeastern Cheese Corporation cheese processing plant, and the Harvest Select catfish processing facility. From March–July 2019, local residents were trained in the use of real-time low-cost PurpleAir sensors for monitoring ambient air pollution. Baseline data on fine particulate matter (PM2.5) were collected. The daily average PM2.5 concentrations ranged from 1.39 to 24.0 μg/m3. An Analysis of Variance and post hoc Tukey’s Honest Significant Difference test were performed to compare the average daily PM2.5 concentrations in the five regions of Uniontown (divided into a control area, east downtown, west downtown, landfill, and sprayfield). The average daily PM2.5 concentration in the five regions ranged from 4.76 μg/m3 (control and sprayfield) to 5.49 μg/m3 (landfill). Although these were below the daily and annual standards set by the Environmental Protection Agency, the levels at the landfill were above the more protective WHO annual standards, suggesting a need for an intervention. Overall, this study provided baseline PM2.5 concentrations that will be used to assess the effectiveness of mitigation efforts that can be taken by the Alabama Department of Environmental Management.
INTRODUCTION
Environmental hazards differentially burden low-wealth communities of color due to institutionalized racism and discriminatory practices in zoning, land use, community development, and local investment.1,2,3,4,5 Differential exposure to polluters such as landfills, incinerators, industrial facilities, concentrated animal feeding operations, Superfund sites, and power plants exacerbates health and economic inequities.1,2,4,6 Other injustices include the denial of basic amenities such as stormwater management and sewer systems, paved roads, clean air and water, and emergency services.1,3,7,8,9,10 The differential toxic exposures and the deprivation of health-promoting resources are also described as “environmental slavery” and “environmental servitude,” reflecting how more affluent and White communities enjoy goods and services at the expense of the communities where the resulting negative externalities (e.g., toxic emissions from goods manufacturing and transport) are concentrated. This underscores how environmental injustices are driven by extractive and exploitative practices and racial capitalism.1,11,12
The cumulative impacts of chemical and non-chemical environmental justice stressors demonstrate how toxic exposures are potentially additive and synergistic.13,14 Salutogenic infrastructure can buffer the impacts of these stressors to improve health outcomes;1,15,16 however, environmental justice is also a movement for the abolition of hazards.4 This is described through two paradigms. The environmental protection paradigm “institutionalizes unequal enforcement” and delays remediation. In contrast, the environmental justice paradigm centers on community engagement and pollution prevention as the predominant strategies instead of pollution cleanup.17
Environmental (In)justice in the rural South
The history of the environmental justice movement began in the rural South with the 1982 Warren County polychlorinated biphenyl (PCB) Landfill Protests.17,18,19,20,21,22 The mass arrest of over 500 demonstrators did not prevent the construction of the hazardous waste landfill in Afton, North Carolina, but it brought Warren County to the center of public attention and spurred national study and recognition of environmental racism.18 The discriminatory siting of hazardous waste facilities is further demonstrated by the alternate site proposed to receive the PCB-contaminated soil: Emelle, AL.23,24 Almost 700 miles away from Warren County, Emelle is in Alabama’s Black Belt in Sumter County. Like Warren County, Sumter County is one of the poorest counties in the state and has a majority African American population. The Chemical Waste Management landfill in Emelle is the largest hazardous waste landfill in the country, known as the “Cadillac of Dumps.”18,25 From 1985 to 1989, 90% of accepted wastes were generated out-of-state.26,27
The decision to dispose of toxic wastes in low-wealth communities of color also speaks to the exploitation of the rural South. Through internal colonialism, large corporations may treat disenfranchised and marginalized communities as “internal colonies” for the placement of environmental hazards and unwanted land uses.28,29,30 This pattern is further evident when considering the combined number of active municipal solid waste, industrial, and construction/demolition landfills; Alabama has more than 3.4 landfills per 100,000 residents31,32 although New York, which is more affluent and has a lower proportion of African Americans, has fewer than 0.3 landfills per 100,000 residents.33,34 This environmental slavery is reinforced by uneven development, poor environmental regulation, unequal enforcement, and procedural inequities.1,4
A review of water quality issues in the deep South and throughout Alabama
The Deep South has been plagued by poor water quality infrastructure for decades. For example, West End Revitalization Association communities, referring to unincorporated post-slavery neighborhoods established during Reconstruction, were threatened by a four-lane highway running from Mebane, North Carolina to Danville, Virginia. This exacerbated existing water infrastructure concerns, affecting affordable housing and housing quality.35 In the historically African American Rogers-Eubanks community in North Carolina, which predates a local landfill, poor sewer infrastructure and water quality were identified by residents.36 In a decision to approve the landfill, Orange County commissioners cited the area’s sparse population (85 households) and considered it “less objectionable” than the previously proposed site.42 This highlights the “path of least resistance” approach that polluting facilities utilize to target low-income communities of color.37 Such entities have been abusing the Deep South as “sacrifice zones” and devaluing low-income communities of color, thereby perpetrating environmental racism.
Alabama itself has a history of sewage problems, and many of its residents lack basic sewage infrastructure. Notably, roughly 25% of the more than 800,000 private septic systems in the state are failing.38 Many Alabamians have even resorted to make-shift plumbing solutions, such as polyvinyl chloride pipes.39 In November 2021, the United States Department of Justice launched an investigation into the Lowndes County Health Department on the issue of providing differential wastewater disposal to predominantly Black communities, compared to White communities.39 The City of Uniontown does not have a mechanical sewage treatment plant; sewage is collected and pumped into a lagoon, and remains are pumped to a sprayfield. However, this system is not fully used for residential sewage because Uniontown’s industrial operations exhaust most of the lagoon’s capacity, and waste from animal processing facilities requires the lagoon waste to sit for extended periods of time.40 Uniontown continues to depend on Sentell Engineering, Inc., an engineering firm that has previously provided poor guidance and further diminishes the capacity of the city to build resilience against a dysfunctional water system.40
A review of air quality issues in the deep South and throughout Alabama
States that make up the Deep South and Black Belt Region of the United States perform poorly regarding air quality, particularly Alabama. An 11-year study of air quality (1999–2009) in Birmingham found that interpolated mean particulate matter (PM2.5) levels ranged from 14.1 to 15.7 μg/m3, which exceeded both the Environmental Protection Agency (EPA) and World Health Organization (WHO) annual standards.41 Furthermore, a study of PM2.5 levels in Birmingham before, during, and after COVID-19 lockdowns found that post-lockdown PM2.5 was 8.6 μg/m3, which exceeds the WHO annual standard and is greater than levels preceding lockdown.42 A case study of North Birmingham found elevated chronic human health risks for its residents, attributable to heavy industrial pollution, a Superfund Site, and the top four Toxic Release Inventory (TRI) facilities.43 In Anniston, Alabama, the Monsanto Company produced PCBs for 40 years, and the city is still plagued by a mixture of asbestos, arsenic, lead, and other compounds at significantly higher rates than the U.S. average, thereby presenting a case of environmental injustice.44 These studies highlight the air quality disparities and inaction that plague the state and emphasize the need for hyperlocal air quality monitoring to identify communities that have been neglected by government efforts.
Purpose
The purpose of this study was to develop a targeted network of PurpleAir (PA) monitors to identify a potential link between the presence of polluters and the ailments experienced by Uniontown residents, and supplement government air quality surveillance. Data collected through this study provided baseline information on human exposure to PM2.5 to inform risk reduction and avoidance behaviors, public health policy, and regulation at the town and county levels.
METHODS
Study area: Uniontown, Alabama
Uniontown is predominantly African American (90.6%) with a median household income of $17,000, well below the state and national averages. Residents are impacted by a cheese plant45,46,47,48 and a catfish mill.45,46,47 Uniontown has also struggled with a poor wastewater treatment system, having caused overflow issues and leaks.40,41,49,50,51 Another major concern is the Arrowhead Landfill, the dumping ground for 4 million cubic yards of coal ash from the Kingston toxic ash spilll.38,39,40,45,47,52,53,54 Residents noted an uptick in illnesses such as asthma, neuropathy, dizziness, respiratory headache, stomach ailments, and allergy-like symptoms.38,39,40,54 Figure 1 depicts the sites of interest that make up the various zones of concern for this study.

Location of sites of interest in Uniontown, Alabama.
Air quality network deployment
We used PurpleAir PA-II monitors (N = 13) to measure the concentrations of PM2.5.55 They utilize laser counters to measure the amount of particles present in an area. Every 120 seconds, the monitor writes mass concentrations (μg/m3) to an onboard microSD card. Community volunteers manually removed the microSD card to retrieve the data and upload them to a secure online folder for analysis.
PurpleAir data analysis
Data was cleaned, plotted, and visualized using Python coding software ©.56,57,58,59,60 Data from each monitor were grouped by geographic “Zones of Concern” with the exception of two isolated control monitors outside of Uniontown (Table 1). New datasets were then aggregated to both the daily mean and hourly mean for each respective location/monitor grouping above. Time series graphs were then created to analyze PM2.5 levels of the areas throughout the study period. The following time series graphs were created for each monitor grouping: average daily measurements over the course of the entire time index, average PM levels aggregated by date to analyze long-term patterns, average hourly measurements over the course of a 24-hour period. To protect the privacy of community air monitoring hosts, specific locations will not be published. Table 1 describes the relative locations and number of monitors within each area, numbered in order of installation.
Distribution of PA-II-SD (PurpleAir-II-Standard Edition) Monitors in Uniontown, AL
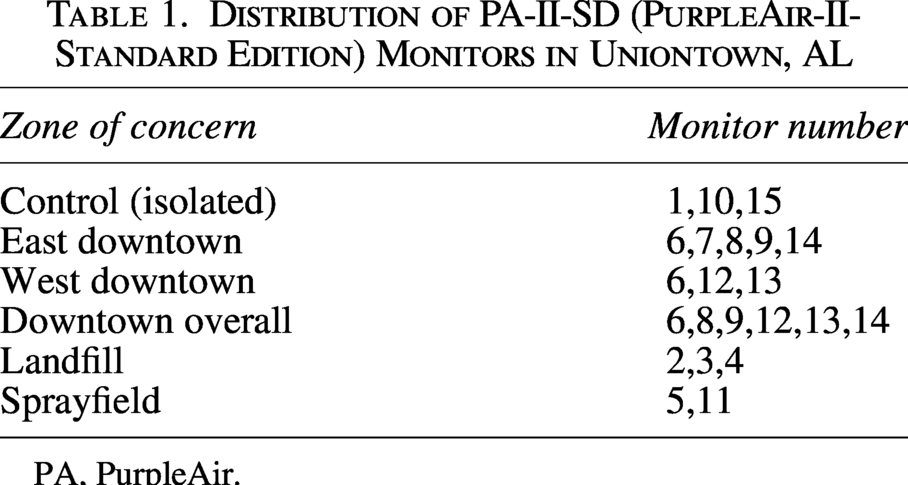
PA, PurpleAir.
Spatial comparisons
From July to November 2019, PM2.5 concentrations were reported as an average daily concentration. Boxplots were created to visualize the distribution of PM2.5 across the different monitors and assigned regions (see Table 1). To investigate differences across the five regions (control, east downtown, west downtown, landfill, and sprayfield), an ANOVA analysis was run. A post hoc test Tukey Honest Significant Difference (HSD) was performed to compare the five regions.
Temporal/diurnal comparisons and traffic-related air pollution (TRAP)
We analyzed weekly patterns and variation by day of week. Average levels were aggregated by time of day (in hours) to analyze daily patterns, and average six-hour periods over the course of a day to examine patterns based on the time of day. The time bins were: 00:00–05:59 (early morning), 06:00–11:59 (late morning), 12:00–17:59 (afternoon), and 18:00–23:59 (evening). This allowed the research team to assess the role of TRAP.61
ANOVA analysis
An ANOVA analysis was performed to compare the average daily PM2.5 concentrations in the five regions of Uniontown (control, east downtown, west downtown, landfill, and sprayfield). HSD test was chosen in order to compare every combination of the five regions.
Existing standards comparisons
We compared PM2.5 levels in Uniontown to daily and annual standards for PM2.5 set by the U.S. EPA as well as the WHO. The EPA’s standards are 12 µg/m3 annually and 35 µg/m3 daily, whereas the WHO’s standards are 5 µg/m3 annually and 15 µg/m3 daily.
RESULTS
The PAs were placed roughly 2.5-3 meters above the ground and shielded from rain, snow, and other weather elements. Each sensor was connected to a power source. Unlike other hyperlocal air monitoring studies, many areas in Uniontown lacked adequate Wi-Fi, so host volunteers were trained to remove the chip manually and upload data outputs. During the early stages of the study period, we checked the sensors bimonthly to ensure functionality and visited the monitoring sites to clean external surfaces as needed. These check-ins became limited as the study period progressed due to logistical constraints.
Spatial differences
Descriptive statistics were calculated for PM2.5 levels at the 13 locations throughout the study duration. Bar graphs displaying the distribution of data are shown in Figures 2–4. Figure 2 displays the geographical region/zone’s average PM2.5 level during the early morning, morning, afternoon, and evening time bins. PM2.5 levels in the cheese sprayfield zone were consistently significantly below the mean across all time bins; the overall PM2.5 level was 0.263 μg/m3 compared to the overall mean of 4.23 μg/m3. In contrast, the city sprayfield zone had the highest mean PM2.5 value, 6.40, and was consistently above the mean across the time bins. Notably, PM2.5 levels in the landfill zone (average PM2.5 = 5.40 μg/m3) and the catfish mill zone (average PM2.5 = 5.07 μg/m3) were also consistently above the average levels for each time zone. The cheese plant zone consistently remained below average PM2.5 levels, though its levels were greater than those of the cheese sprayfield. The control zone was higher than mean levels during the early morning (4.91 μg/m3), morning (5.27 μg/m3), and evening (5.27 μg/m3) time bins, but lower than the mean during the afternoon (4.08 μg/m3) time bin.
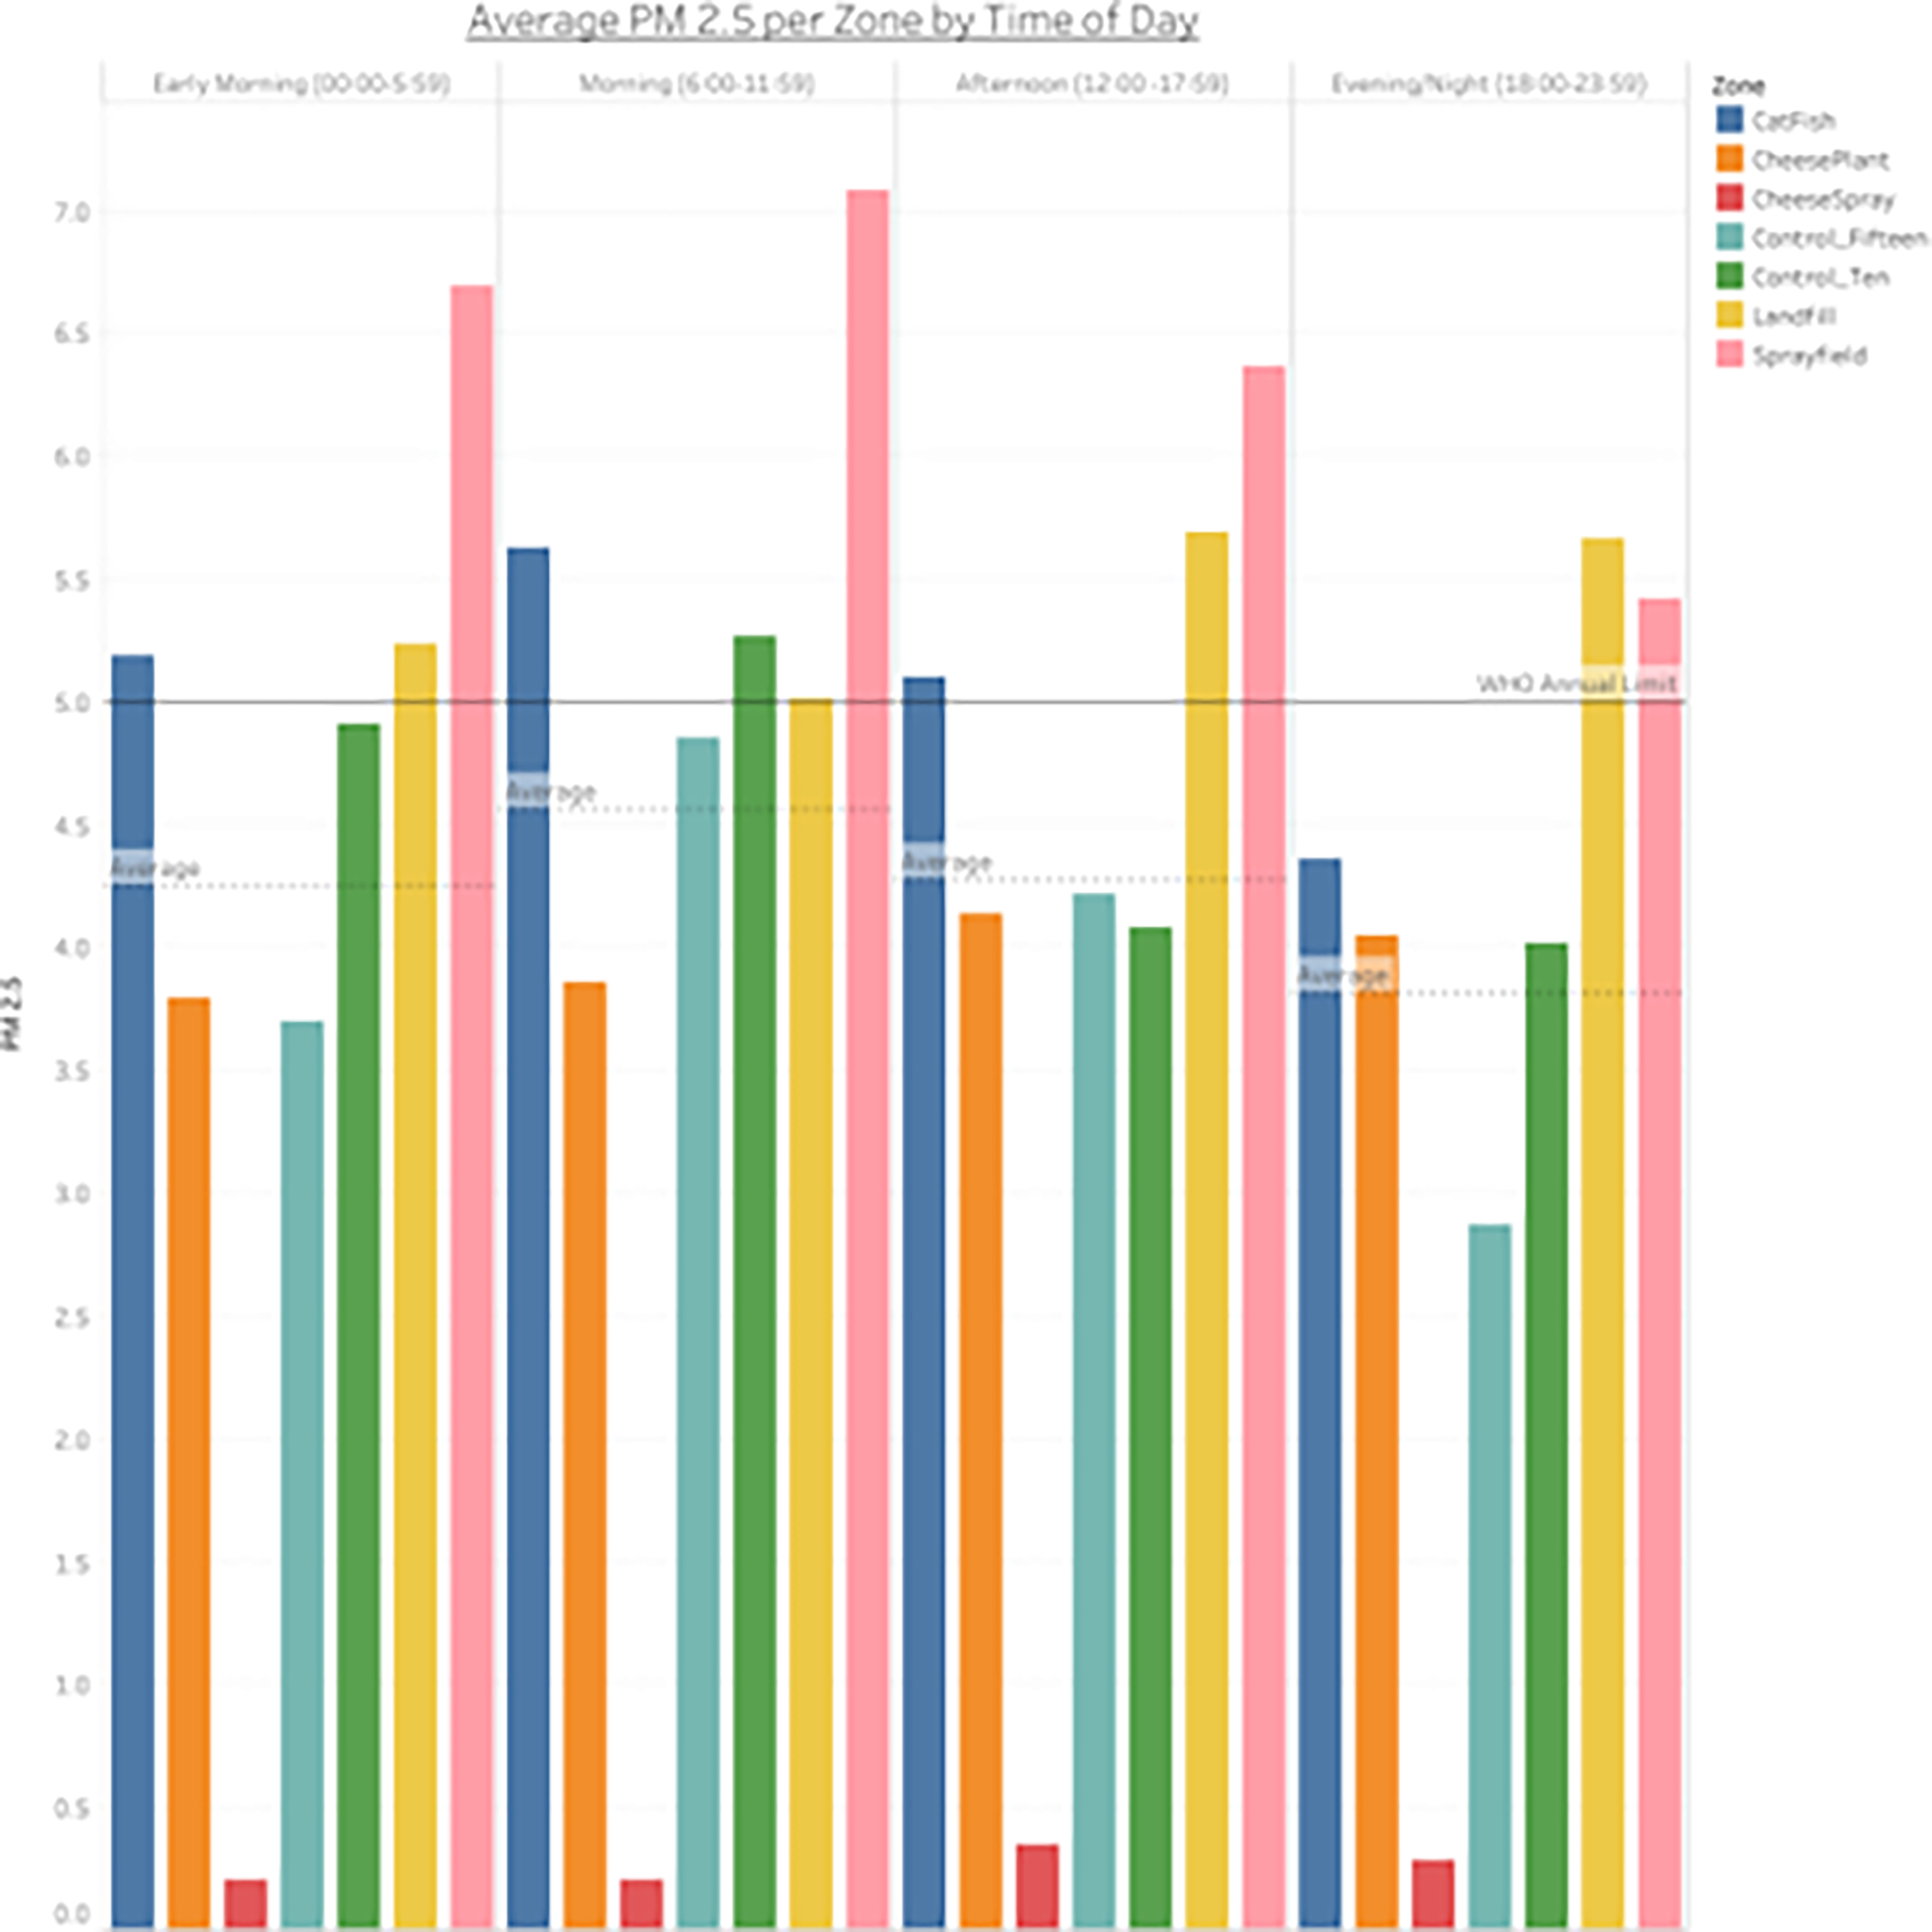
Bar Graph of geographical region/zone’s average PM2.5 (µg/m3) level by 6-hour periods. Average line displays the average PM2.5 level for each 6-hour period. PM2.5, particulate matter.
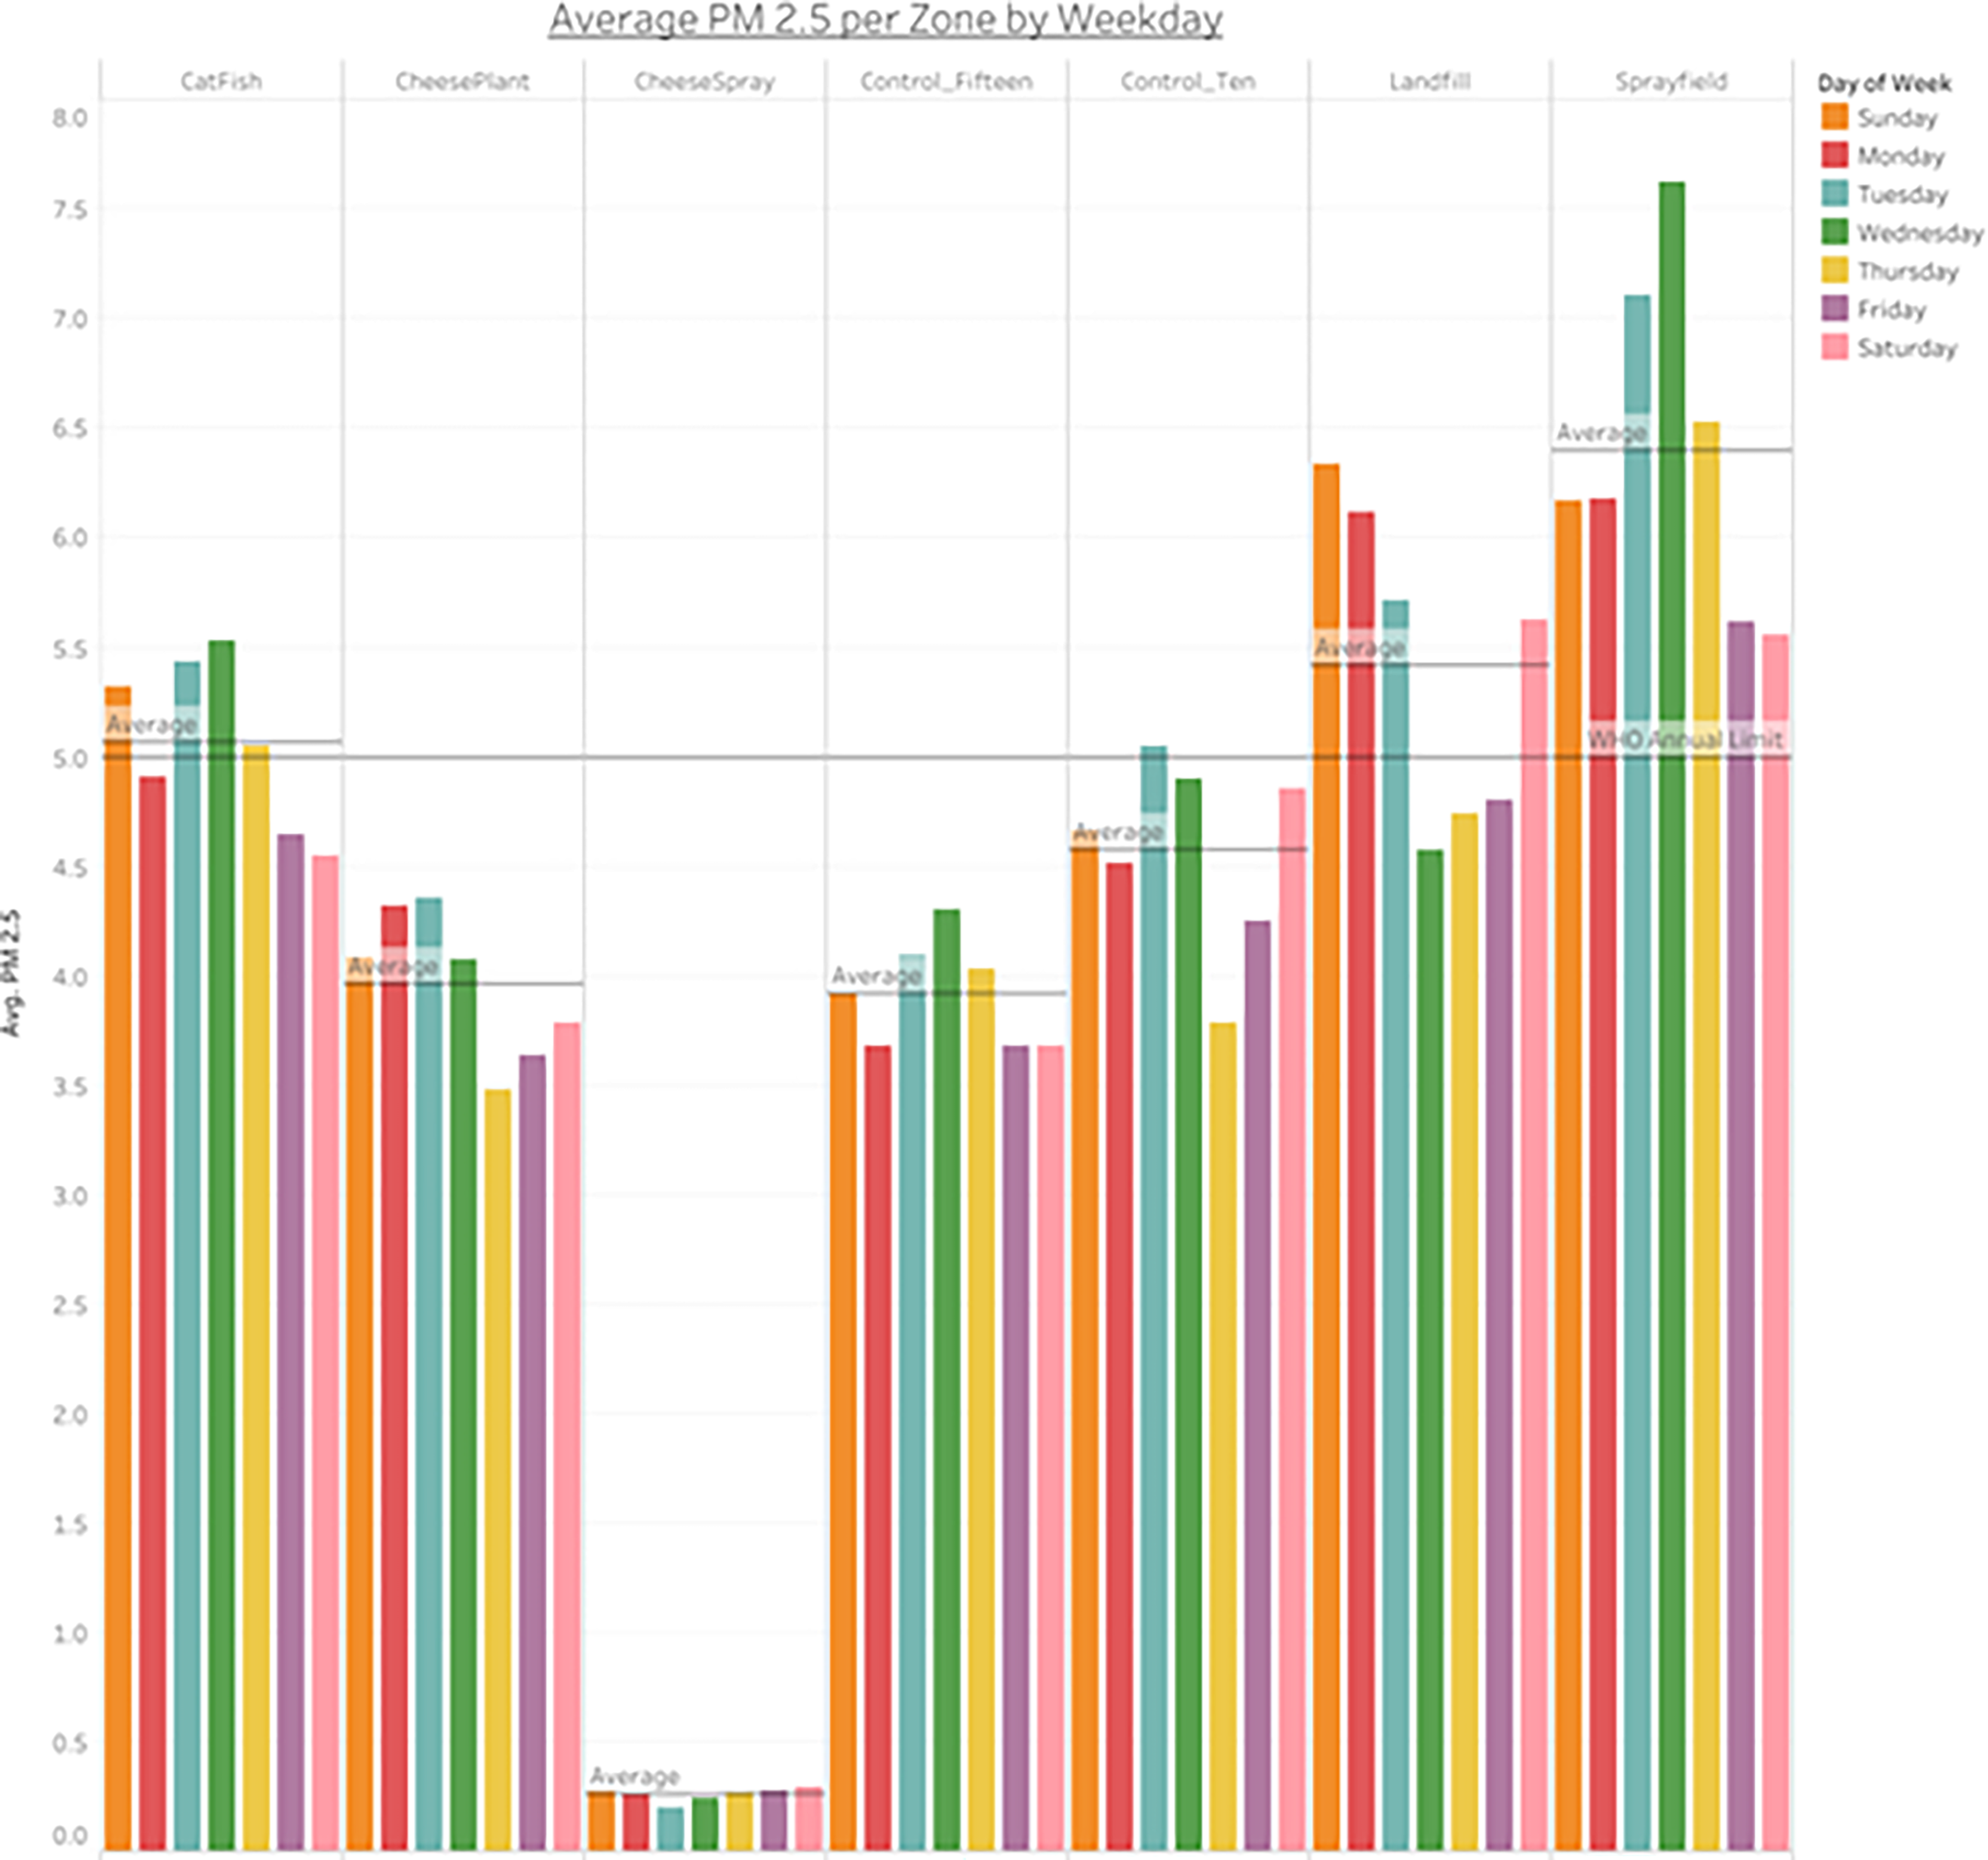
Bar Graph each weekday’s average PM2.5 (µg/m3) level, by the geographical region/zone. The average line displays the average PM2.5 level for each region/zone.
Temporal and diurnal results
Figure 3 shows the average PM2.5 levels per time bin, stratified by the day of the week. The afternoon time bin had the highest average (4.64 μg/m3), although the evening/night had the lowest average (4.16 μg/m3). We also observe a slight gradual decline in PM2.5 levels as the week progresses. For example, Sunday had the highest average PM2.5 (4.76 μg/m3, compared to Friday (4.12 μg/m3). These day-of-week differences are consistent across other criteria air pollutants in the literature.62 Weekends allow us to examine how PM levels respond to sudden large reductions in precursor emissions. Figure 4 provides bar graphs for each day of week average PM2.5 (μg/m3) level, stratified by the geographical region/zone. This bolsters the findings from Figure 3. In particular, we observe a steeper midweek decline as the week progresses at the landfill zone (from 6.34 μg/m3 on Sunday to 4.56 μg/m3 on Wednesday, before steadily rising to 5.63 μg/m3 on Saturday). This is consistent with other studies that have assessed the confounding effect of wind patterns on inter-week air pollution differences.63
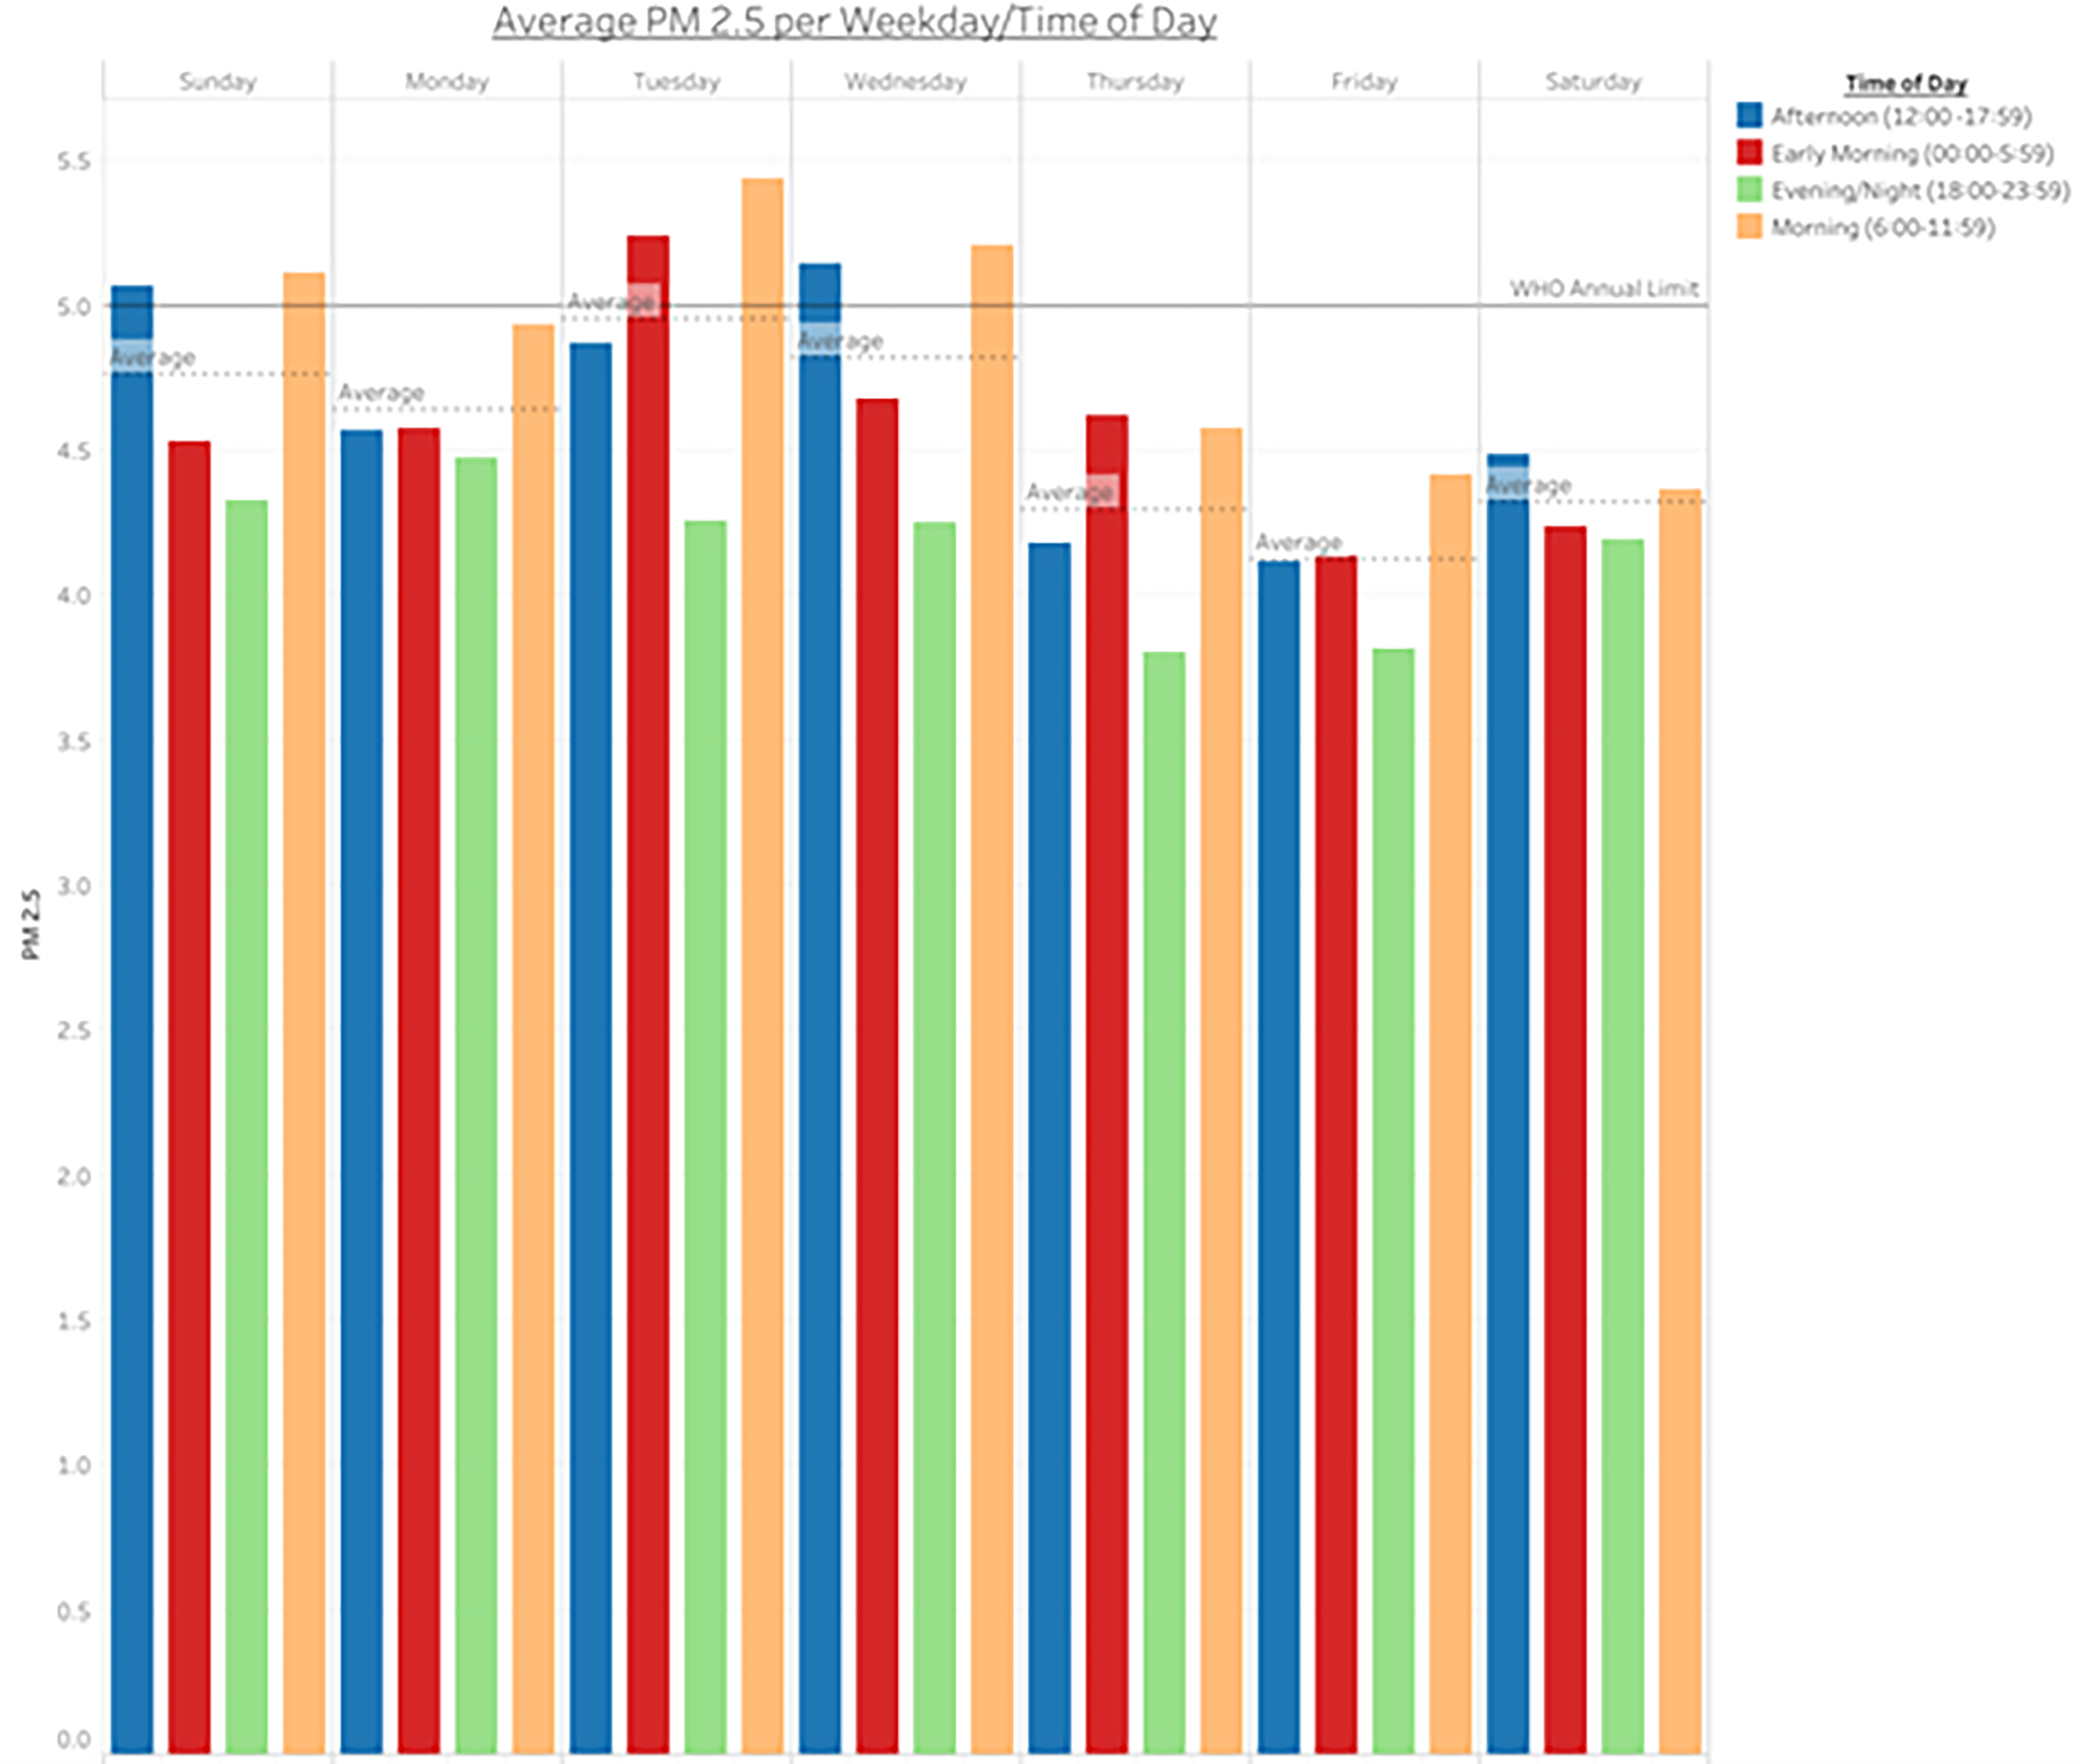
Bar Graph of the average PM2.5 (µg/m3) level per 6-hour periods, by the day of the week. The Average Line displays the average PM2.5 level per each week day.
Traffic-Related air pollution (TRAP) results
Per Figure 3, the average PM2.5 level for the morning time bin was 4.92 µg/m3 from Monday to Friday compared to 4.74 µg/m3 over the weekend. This time bin includes the morning rush hour. Additionally, as previously discussed, the afternoon time bin has the highest average PM2.5 level, 4.64 μg/m3. The afternoon time bin includes the evening rush hour, which takes place from 17:00to 18:00. Figure 2 shows that the PM2.5 levels in the city sprayfield and catfish mill peaked during the morning time bin, whereas PM2.5 levels in the cheese plant and cheese sprayfield peaked during the afternoon time bin. Furthermore, the highest average PM2.5 levels in Figure 2, which exclusively show PM2.5 levels in the defined zones of concern as well as control zones, are in the morning time bin (4.56 μg/m3) and afternoon time bin (4.28 μg/m3), though this is less pronounced than the differences observed in Figure 3/Uniontown as a whole.
ANOVA results
The average daily PM2.5 concentration in the five regions ranged from 4.76 μg/m3 (control and sprayfield) to 5.49 μg/m3 (landfill). Of the ten comparisons, eight were significant, suggesting the need for the HSD test. The two comparisons that were not statistically significant were control versus east downtown (p = 0.074) and control versus sprayfield (p = 0.415). The Tukey HSD test revealed that the mean PM2.5 concentration at the landfill was significantly higher (p < 0.05) than the control (+15.34% increase), as well as east and west downtown (+14.85% and + 8.50% increase), respectively. Notably, the east downtown region (4.78 μg/m3) was significantly lower than the west downtown region (5.06 μg/m3) (p < 0.05). The full breakdown of the pairwise tests is shown in Table 2.
Tukey HSD Pairwise Comparisons of Daily Averages of PM2.5 in Five Regions of Uniontown
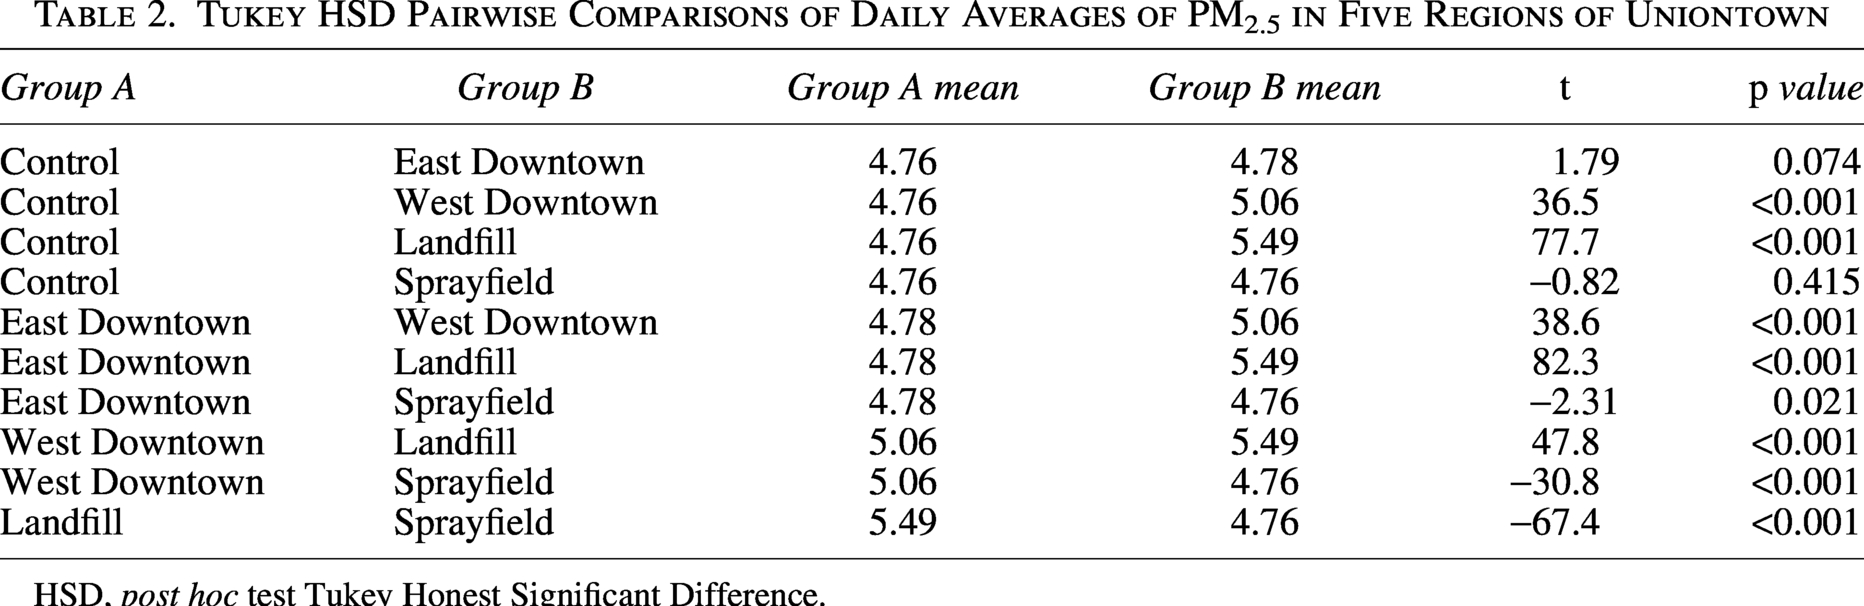
HSD, post hoc test Tukey Honest Significant Difference.
Comparison of uniontown PM2.5 levels to EPA and WHO standards
Though our findings indicated that the entire study area was in compliance with the EPA PM2.5 standards, PM2.5 levels in the landfill, catfish, and city sprayfield zones exceeded the WHO annual standards of 5 μg/m3 per year, which is shown in Figure 4. This is in sharp contrast to the control, cheese plant, and sprayfield zones, all of which were in compliance. Figure 3 shows that on Sunday, Tuesday, and Wednesday, overall PM2.5 levels during the morning time bin, which includes the morning rush hour, were 5.12 µg/m3, 5.44 µg/m3, and 5.21 µg/m3, respectively, all of which exceed the WHO annual standard. PM2.5 levels also exceeded the WHO standard during the afternoon time bin on Sunday and Wednesday, when levels were 5.07 and 5.15 μg/m3, respectively.
DISCUSSION
This study’s results provide a framework for creating hyperlocal air quality networks throughout Black Belt Alabama. We demonstrated diurnal and spatial differences within our study area and determined whether pollution levels met EPA and WHO standards. We identified zones of concern to place PA monitors (N = 13) and a control zone to assess the influence of local industrial sources. Overall, we observe that daily average PM2.5 concentrations in the 13 monitors ranged from 1.39 to 24.0 μg/m3. We also stratified our data into time bins to capture potential rush hour peaks. Overall, the city sprayfield zone had the highest daily average during the study period. Additionally, the overall averages at the sprayfield, landfill, and catfish mill zones exceeded the WHO annual standard, proving a cause for concern and need for remedial action by the Alabama Department of Environmental Management (ADEM). When looking at the time bins, those containing morning and evening rush hours across all zones of comparison had elevated PM2.5 concentrations, indicating that TRAP influenced PM2.5 levels in Uniontown. Overall, low-cost sensors are advantageous for their potential in creating spatially dense networks that can be launched in response to community concerns more quickly than regulatory agencies.64 These networks can also identify more pollution events, identify peaks, and alert community members to mitigation efforts during heightened exposure.
Comparison of uniontown study to low-cost sensor projects in other EJ communities
Low-cost air monitoring networks have been deployed in other communities with varying scales of community involvement and environmental justice focus.65,66,67,68 The Imperial County Community Air Monitoring Project in California exemplifies a community-engaged approach, initiated by community concerns and executed through active community participation for site identification, data collection, interpretation, and action.67 The Identifying Violations Affecting Neighborhoods (IVAN) website was designed to include messaging about the data, air quality, and health, and technical information on the monitors. This project was effective in increasing public health awareness.
A Los Angeles County study used a hyperlocal PA network to assess spatial and temporal variations of PM2.5 levels. Like our study, it lacked a federal monitor for collocation; however, the researchers developed a quality control scheme based on the PA’s two channels instead of including control sensors.69 A PM2.5 study associated with Fourth of July celebrations across California, which also used PAs, revealed the importance of environmental justice to understanding the impacts of fireworks, demonstrating the efficacy of fireworks regulations.70 Another hyperlocal PA network in Cheverly, Maryland assessed the role of local idling trucks and industrial activity on air pollution.71 This study included government partners from the Maryland Department of the Environment who were responsible for a targeted inspection and notices of violations. All parties were debriefed on environmental justice, although ADEM was not in our Uniontown study. Similar to the Uniontown results, average Cheverly PM2.5 levels were below EPA standards but exceeded the WHO annual standard.
Comparison of uniontown study to other communities proximal to landfills and poor waste management
A study in the Clare Estate community in Durban, South Africa, which is within a 2-km radius from the Bisasar Road landfill site, found the mean PM2.5 concentration to be 76.5 μg/m3.72 The South Africa study suggested that residing near the landfill is associated with an increased likelihood of respiratory effects among children, extrapolated through spirometry use in children (N = 23).72 In our study, we did not measure indicators of distress, such as forced expiratory volume. A Baltimore, Maryland study determined whether land restoration sites contained elevated heavy metal concentrations near urban farm “hotspots” and found that these “hotspots” were in pockets of low-income communities of color, which also contained hazardous sites.73 A study of TRI air pollution in St. Louis, Missouri, used ordinal buffer rings rather than our control zone approach, and found that within 1 km of a TRI site, concentrations of communities of color were highest.74 A Charleston, South Carolina study found an inverse relationship between distance to TRI facilities and race/ethnicity, using GIS and applied regression modeling, although our study deployed ANOVA testing. Another TRI study in Maryland used both GIS and regression modeling to determine that tracts with higher proportions of non-white residents and people living in poverty were more likely to be closer to TRI facilities.75 These studies assessed proximity to hazardous sites alone although the Uniontown study focused primarily on personal exposure to PM2.5.
Limitations
Our limitations and challenges included a low youth engagement and leadership turnover within the BBC (Black Belt Citizens) and the Community Advisory Board. Limited youth engagement made it difficult to gauge the effectiveness of consensus building. Staff changes made it difficult to identify a point of contact. This hindered partnership stability, worsened by the COVID-19 pandemic. The pandemic also limited our ability to provide technical assistance, exacerbated by limited Wi-Fi, preventing our team from delivering virtual training.
In terms of data outputs, the PAs only measured PM2.5, limiting our ability to capture multiple pollutants. Additionally, we failed to examine additional media, such as soil and water samples. PAs also have inherent technical limitations. PAs overestimate PM2.5 concentrations relative to regulatory instruments.76,77,78 High relative humidity can cause water vapor to condense on particles, leading to overreporting.79 PAs are additionally sensitive to temperature effects,80,81 so it is recommended to calibrate low-cost monitors with a Federal Equivalence Method or Federal Reference Method to correct systematic error.82 This poses a challenge for communities, such as Uniontown, without specialist knowledge or access to regulatory monitors. Meteorological conditions such as wind direction were not recorded, limiting the ability to analyze pollutant movement from point sources.83
Future studies
There is a critical need to measure odoriferous compounds from landfills such as methane, ammonia, and hydrogen sulfide.84 This will better illustrate the potential impact of the cheese plant on residents, which was within EPA and WHO PM2.5 standards. We will design a website, similar to IVAN Air Monitoring in Imperial County, to promote the study for better recruitment and produce community-relevant and accessible information that moves data toward action. In the future, we will also employ a correction factor to the PA concentrations. EPA results suggest that the PA raw PM2.5 data overestimate PM2.5 by ∼40% in most states under various conditions.85 To address this, we will measure temperature and humidity, and develop a formula based on the EPA’s guidelines.85
CONCLUSION
Communities with EJ issues need tools to quantify their lived experiences and overburdened exposures. CBPR (Community-Based Participatory Research) practices and other community-engaged models are worth the investment. Emerging technologies like low-cost sensors promote citizen science but also present many logistical challenges such as stable Wi-Fi and access to an external power supply. Furthermore, scientifically rigorous methods and QA/QC are critical. Statistically, we found that PM2.5 levels in Uniontown exceeded the WHO guidelines. Through this community-university partnership, we improved environmental health literacy and “inpowered” residents through citizen science training and research on air quality monitoring, explored avenues of environmental risk reduction, and documented baseline PM2.5 concentrations that will be used to examine air quality prior to mitigation efforts that can be taken by ADEM.
AUTHORS’ CONTRIBUTIONS
V.R., methodology, investigation, formal analysis, validation, data curation, original draft preparation, writing—review and editing; L.R., investigation, validation, writing—review and editing; R.A., validation, writing—reviewing and editing; J.A., supervision, writing—reviewing and editing; A.W., data curation, writing—review and editing; J.T., data curation; S.W., conceptualization, methodology, supervision, project administration, writing—review and editing; E.C., writing—review and editing; B.E., writing—review and editing.
Footnotes
ACKNOWLEDGMENTS
The authors would like to thank the Samuel Lawrence Foundation for funding this study. The authors would also like to thank the Black Belt Citizens Fighting for Health and Justice for partnering with them and for helping co-develop contractual documents such as the memorandum of understanding to achieve the objectives of this study. The authors would also like to thank all community residents who attended their community listening sessions and volunteered to host PurpleAir (PA) monitors. Furthermore, the authors would like to thank the Yale School of the Environment faculty and students for partnering with them and administering a community health survey, as well as providing logistical support with the PA deployments.
DATA AVAILABILITY STATEMENT
The quantitative data that support statistical analysis of particulate matter levels in this study are publicly available and can be downloaded, with no access conditions, through the PurpleAir website via https://perma.cc/X4Q3-4ZYP, specifically through the “Real-time Map” (V1.8.52), accessible via https://cheverly.purpleair.com or ![]() . Analyses of the data were performed using Microsoft Excel (V.2205) and SAS OnDemand for Academics. Additional code and datasets used to perform the analyses can be made available upon request to the corresponding author.
. Analyses of the data were performed using Microsoft Excel (V.2205) and SAS OnDemand for Academics. Additional code and datasets used to perform the analyses can be made available upon request to the corresponding author.
AUTHOR DISCLOSURE STATEMENT
The authors declare no conflict of interest.
FUNDING INFORMATION
No funding was received for this article.