
Abstract
Background:
Foot strike type affects running mechanics and may influence overuse injury occurrence. Measuring the interaction between cumulative load and foot strike type may provide additional information that could increase understanding of injury mechanisms.
Hypothesis:
There will be no differences in cumulative loading between runners using rearfoot strike (RFS) and nonrearfoot strike (NRFS) patterns. NRFS runners will have a greater stride rate. There will be differences in per stride metrics of select lower extremity mechanics.
Study Design:
Observational laboratory study.
Level of Evidence:
Level 3.
Methods:
Thirty male participants (age, 22.7 ± 2.9 years; height, 1.79 ± 0.07 m; mass, 70.7 ± 7.86 kg; mean ± SD) ran on an instrumented treadmill for 5 km at 3.15 m/s with their preferred foot strike type (14 RFS, 16 NRFS). Stride rate, foot strike angle, loading rate (LR), per stride and per kilometer (cumulative) vertical ground-reaction force (VGRF) impulse, impact peak, absolute peak, knee negative work, and ankle negative work were calculated and compared across time and between groups.
Results:
Per stride differences were seen for stance time, foot strike angle, and LR (greater for RFS runners, P = 0.003). Per stride and cumulative ankle and knee negative work showed significant differences (greater ankle negative work for NRFS runners, P < 0.001 [per stride and cumulative], greater knee negative work for RFS runners, P = 0.01 per stride, P = 0.008 cumulative).
Conclusion:
Ankle and knee loading metrics showed differences in per stride and cumulative metrics between foot strike groups. Individual variability in VGRF loading patterns was more apparent than group distinctions. The common perception that NRFS runners have a higher stride rate was not supported.
Clinical Relevance:
Individual loading patterns, not just foot strike type, and training session characteristics related to cumulative load should be considered when assessing injury risk.
The popularity of running and its injury prevalence has resulted in considerable discussion and research regarding the mechanics of injury. Running-related injuries have been linked to several aspects of ground-reaction forces (GRFs), but it is unclear whether this is a cause or an effect of injury. Some retrospective studies have linked injury to vertical GRF (VGRF) loading rate (LR)24,25; however, a recent prospective study examining college track athletes reported LR was not associated with injury. 33 Another prospective study estimating absolute peak VGRF through accelerometer data in elite college track athletes found that runners who became injured had greater estimated peak VGRF values. 27 Somewhat related, a study implementing 2 weeks of gait retraining through visual biofeedback where the participants were told to land softer and reduce or eliminate the impact peak of their VGRF curve resulted in 62% lower injury incidence after a year follow-up compared with controls. 14 These studies suggest that some aspects of GRFs may influence injury rate.
Foot strike type affects running mechanics and thus may influence repetitive stress injury rates and the site of injury. A rearfoot strike (RFS) during running has typically been shown to have a larger VGRF impact peak and LR than a nonrearfoot foot strike (NRFS) and therefore may theoretically have a greater injury rate.1,3,7,8,18,21,32,39 However, a recent review of literature determined limited evidence of an association between foot strike type and injury. The low association between foot strike type and injury may be due to a lack of both quality and prospective studies, and further research is needed. 12 Although it did not directly analyze foot strike type, the previously mentioned gait retraining study showed that rates and types of injuries in each group were different, and the researchers assumed that the changes in injury type resulted from changing to a different foot strike type. 14 Many researchers studying foot strike type hypothesize that reduced loading at the knee but increased loading at the ankle and forefoot that comes with a NRFS type could simply be trading the site of injury.8,31 In addition to altering the location of joint loading, foot strike type during running also influences other kinetic and kinematic factors such as stride length and stride rate with NRFS runners exhibiting increased stride rate and decreased stride length.19,20 Increased stride rate and decreased stride length results in an increased number of loading cycles per a given distance, which may offset any difference in load per cycle.19,21,26,39
Measuring the interaction between cumulative load (total load for a given distance) and foot strike type may provide additional information that will help with understanding injury mechanisms. Overuse injuries occur when the accumulated load on a structure becomes greater than its load capacity. 15 Although cumulative load is certainly not the only predictor of overuse injuries, it is important to include the interaction between load magnitude and loading cycles when looking at injury risk.15,17 One prospective study found cumulative peak VGRF to be greater in runners who became injured. 27 To date, no studies have evaluated the effects of foot strike type on cumulative VGRF. Some comparisons of cumulative measures of knee and ankle joint kinetics between foot strike type have been reported. Researchers that have tested runners after an acute conversion to NRFS showed no difference in knee joint force impulse per kilometer 6 or patellofemoral joint stress and reaction force per kilometer. 38 In barefoot runners using their habitual foot strike type, Achilles tendon loading in those running with a NRFS resulted in greater Achilles tendon impulse per step, although cumulative impulse over a mile run did not show a significant difference. 2 The lack of difference in cumulative impulse may have been due to insufficient statistical power. Because of the limited research in this area, additional cumulative measures of runners using a runner’s habitual foot strike type while shod are needed.
The primary purpose of this study was to determine how foot strike type affects cumulative loading in runners. We hypothesized that cumulative loading would not differ significantly between groups. This was based on the hypotheses that there would be differences between foot strike pattern groups in per stride metrics of lower extremity kinetics, with RFS runners having a greater knee negative work, and VGRF LR, impact peak, and impulse compared with NRFS runners, and NRFS runners having a greater ankle negative work, stride rate, and VGRF absolute peak. Greater stride rate in NRFS runners would result in more strides during the run; therefore, the aforementioned metrics, when expressed as cumulative values, would not be significantly different between groups. On the other hand, we hypothesized that greater ankle negative work in NRFS runners would be magnified as a cumulative metric due to the increased number of strides. To determine how well cumulative metrics can be extrapolated from a specific time period, a secondary purpose of this study was to determine whether individual metrics change throughout a 5-km submaximal run. We hypothesized that changes in per stride and cumulative metrics would be similar between strike types.
Methods
Participants
Participants were 30 male recreational runners who were running at least 3 times per week and could run 5 km in under 24 minutes (Table 1). This sample size was chosen based on similar previous studies.2,6,38 This population ran frequently enough to easily complete the required running task with consistent gait and foot strike types. Due to sex differences in running mechanics, only male runners were included.9,11,16 Participants reported no previous running injury in the preceding 3 months, were not in transition between foot strike types, or habitual minimalist shoe wearers. The 30 participants were recruited from the local community. Self-reported foot strike type was used to guide recruitment; however, actual foot strike type was determined during testing (see protocol), resulting in inclusion of 16 RFS runners and 14 NRFS runners. All participants were volunteers and signed informed consent forms approved by the local ethics board.
Subject demographics by group (n = 16 RFS, n = 14 NRFS)
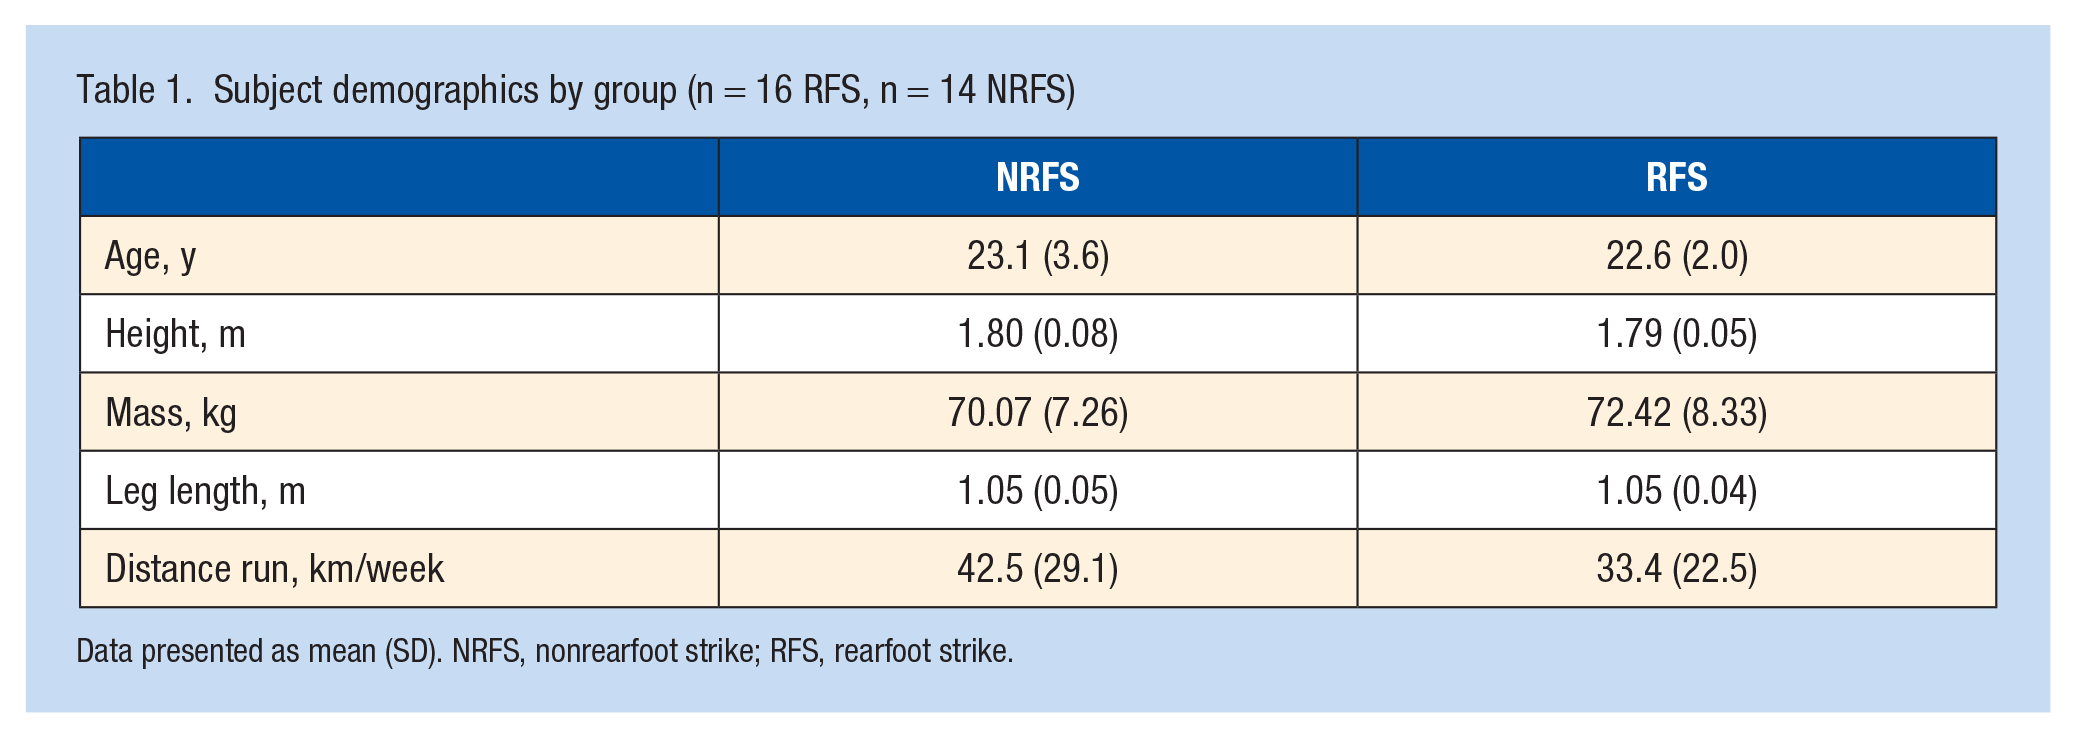
Data presented as mean (SD). NRFS, nonrearfoot strike; RFS, rearfoot strike.
Protocol
Participants were provided with Nike Pegasus running shoes during testing. A total of 36 reflective markers (12.7-mm diameter) were placed bilaterally on the lower body: anterior and posterior superior iliac spines, thigh cluster, medial and lateral femoral condyles, shank cluster, medial and lateral malleoli, posterior, medial, and lateral calcaneus, and over the second toe. A static trial was taken, and then all ankle markers and medial knee markers were removed for greater ease of running. To confirm that participants met inclusion criteria, foot strike type was determined using high speed video (Vicon Bonita; 120 Hz) after a 3-minute warm-up (2.98 m/s) on a split belt instrumented treadmill (Bertec; 1000 Hz). Runners were classified as RFS if initial contact (IC) was made with the heel or posterior portion of the foot and NRFS if contact was made with any part of the foot besides the heel (including simultaneous toe and heel contact). 12 After the 3-minute warm-up period, the treadmill speed was increased to 3.15 m/s for the remaining 25.5 minutes. Once the warm-up was completed and the speed was increased, force and kinematic data were collected in 30-second increments at the 3-, 13-, and 23-minute marks. Kinematic data were collected using a 12-camera motion capture system (VICON Motion Technologies; 250 Hz).
Data Processing
Raw marker trajectories were filtered using a low-pass Butterworth filter at 12 Hz, whereas GRF data were filtered at 50 Hz. Data were then imported into Visual 3-dimensional (3-D) software (C-Motion) for analysis. A 7-segment lower extremity model was built from the static pose and applied to all movement trials. All metrics were only calculated on the right side. Gait cycles were separated by identifying IC and toe-off events from VGRF thresholds (50 N cutoff). Stride, stance, and flight times were calculated from these events and averaged across each 30-second collection interval. Foot strike type was quantified via the sagittal plane foot-to-ground angle at IC using a Euler rotation sequence (1-sagittal, 2-frontal, 2-transverse). Two peak VGRFs were extracted: the first peak, known as the impact peak, and the second absolute peak. The presence of an impact peak was identified visually. Participants were classified as having impact peaks (PIP) if the peak was present during >50% of their strides, in at least 1 of their 3 trials. For any strides that did not contain visible peaks, values were calculated at the mean location of impact peaks present in the same trial. For participants who did not meet PIP criteria, comparable impact peak values were determined at the average stance-normalized location of all strides among PIP. 8 Impulse was calculated as the area under the VGRF curve during stance phase. LR was calculated as the greatest positive VGRF slope over this same interval. To obtain ankle and knee joint work, inverse dynamics were used to calculate joint power. The negative portions of the power curves were integrated to provide the total negative work done at each joint. All kinetic metrics were normalized to bodyweight. Per stride metrics were averaged across all gait cycles occurring during each 30-second collection. Data from a gait cycle were excluded from the average if 1 of 2 conditions were met—either the peak VGRF was outside of the acceptable range (average ± 3 SD for that trial; 5 steps were removed from the study for this reason) or the runner used the alternative foot strike type (5 steps were removed from the study for this reason). Cumulative measures of VGRF peaks, VGRF impulse, and joint work were calculated by multiplying normalized per stride metrics by the number of strides taken per kilometer. The number of strides was calculated as the stride rate multiplied by speed in kilometers.
Statistical Analysis
Each of the 10 per stride metrics and 6 cumulative metrics was compared between groups and across timepoints using a 2 × 3 mixed model analysis of variance (ANOVA; α = 0.05). For each ANOVA, Mauchly’s test for sphericity was tested and corrected for using Greenhouse-Geisser when necessary. When significantly different time main effects were found, pairwise comparisons were made using Holm post hoc tests.
Results
Per stride between-group main effects were seen for stance time (P = 0.003), foot strike angle (P < 0.001), and LR (P = 0.04), all of which were greater for RFS runners (Table 2). Per stride ankle and knee negative work also showed significant differences, with ankle negative work being greater for NRFS runners (P ≤ 0.001) and knee negative work being greater for RFS runners (P = 0.01). Ankle and knee negative work also showed significant interactions between groups and timepoints (P = 0.04 and P = 0.03, respectively), with RFS slightly increasing and NRFS decreasing over time for both variables. LR decreased significantly between timepoints 1 and 3 (P = 0.04). No other per stride significant differences were found.
Per stride metrics
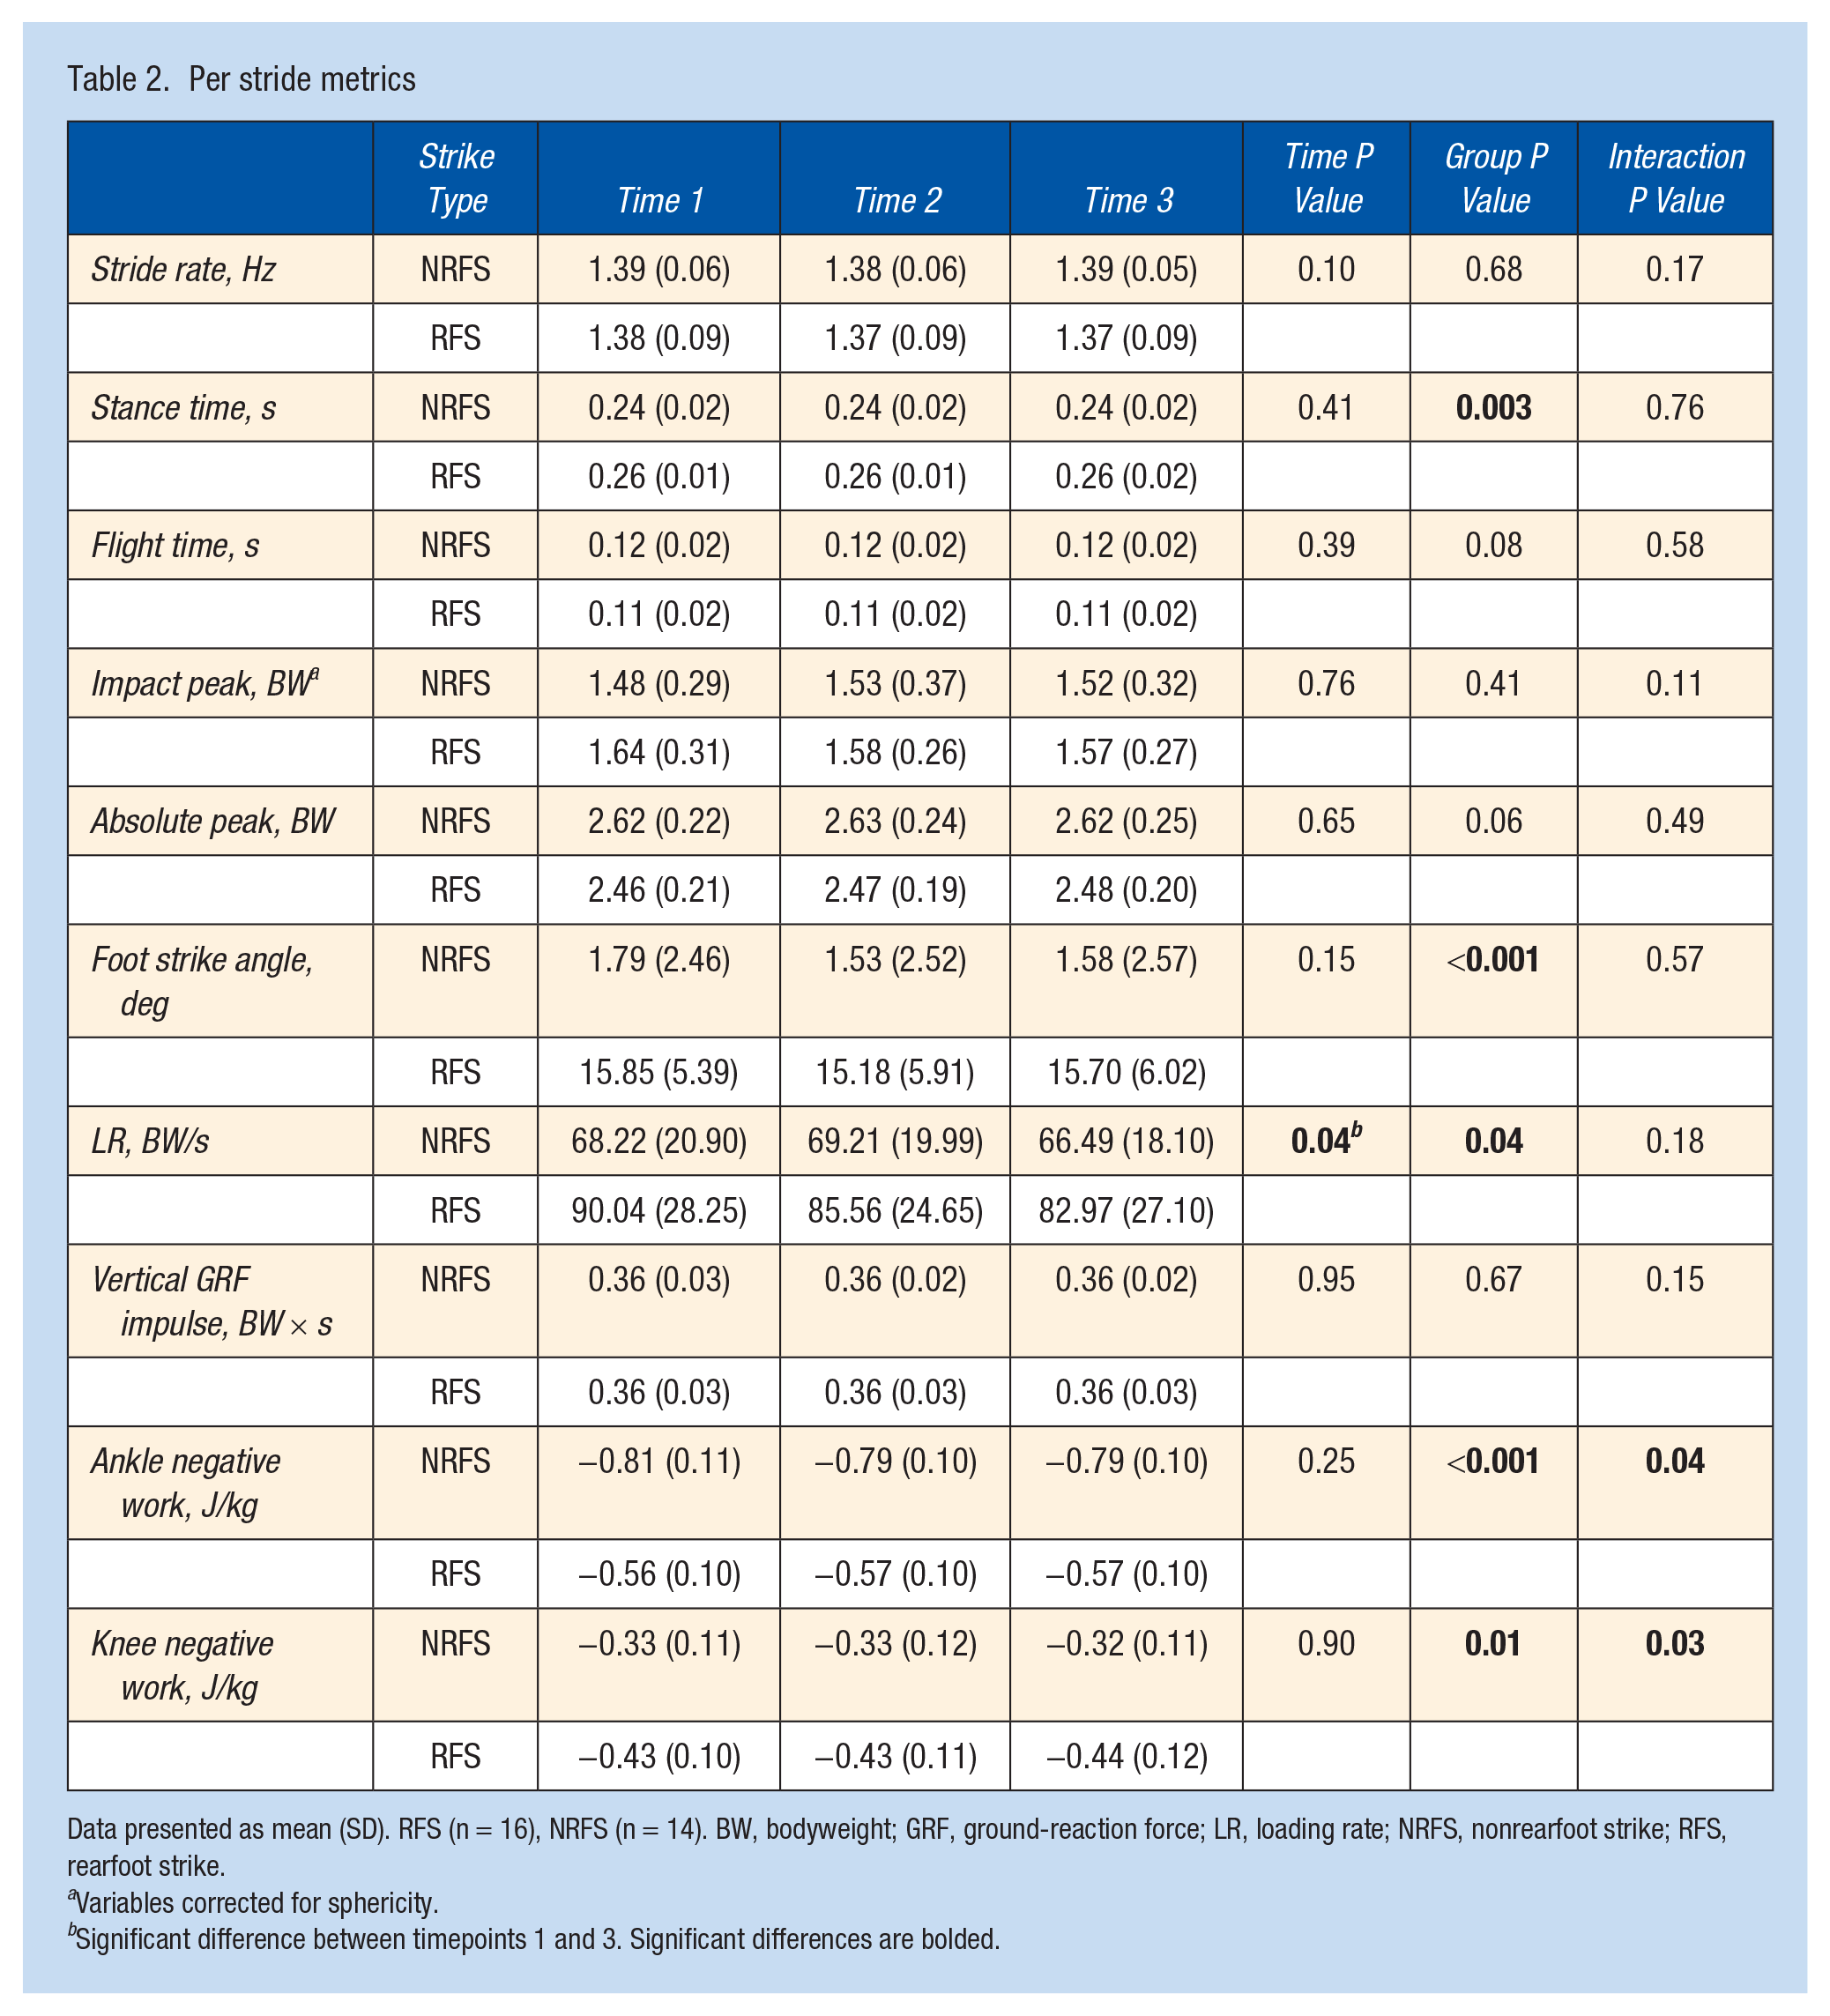
Data presented as mean (SD). RFS (n = 16), NRFS (n = 14). BW, bodyweight; GRF, ground-reaction force; LR, loading rate; NRFS, nonrearfoot strike; RFS, rearfoot strike.
Variables corrected for sphericity.
Significant difference between timepoints 1 and 3. Significant differences are bolded.
Similar to the per stride analysis, cumulative measures of ankle and knee negative work were significantly different between groups (P < 0.001 and P = 0.008, respectively) (Table 3). No group differences were found for any other cumulative metrics. The interaction between group and time was only significant for cumulative knee negative work (P = 0.04), with RFS increasing and NRFS decreasing over time. The time comparisons showed significant differences in cumulative VGRF impulse between times 1 and 2 and between times 1 and 3 (P < 0.001). No other time differences were found.
Cumulative metrics (per km)
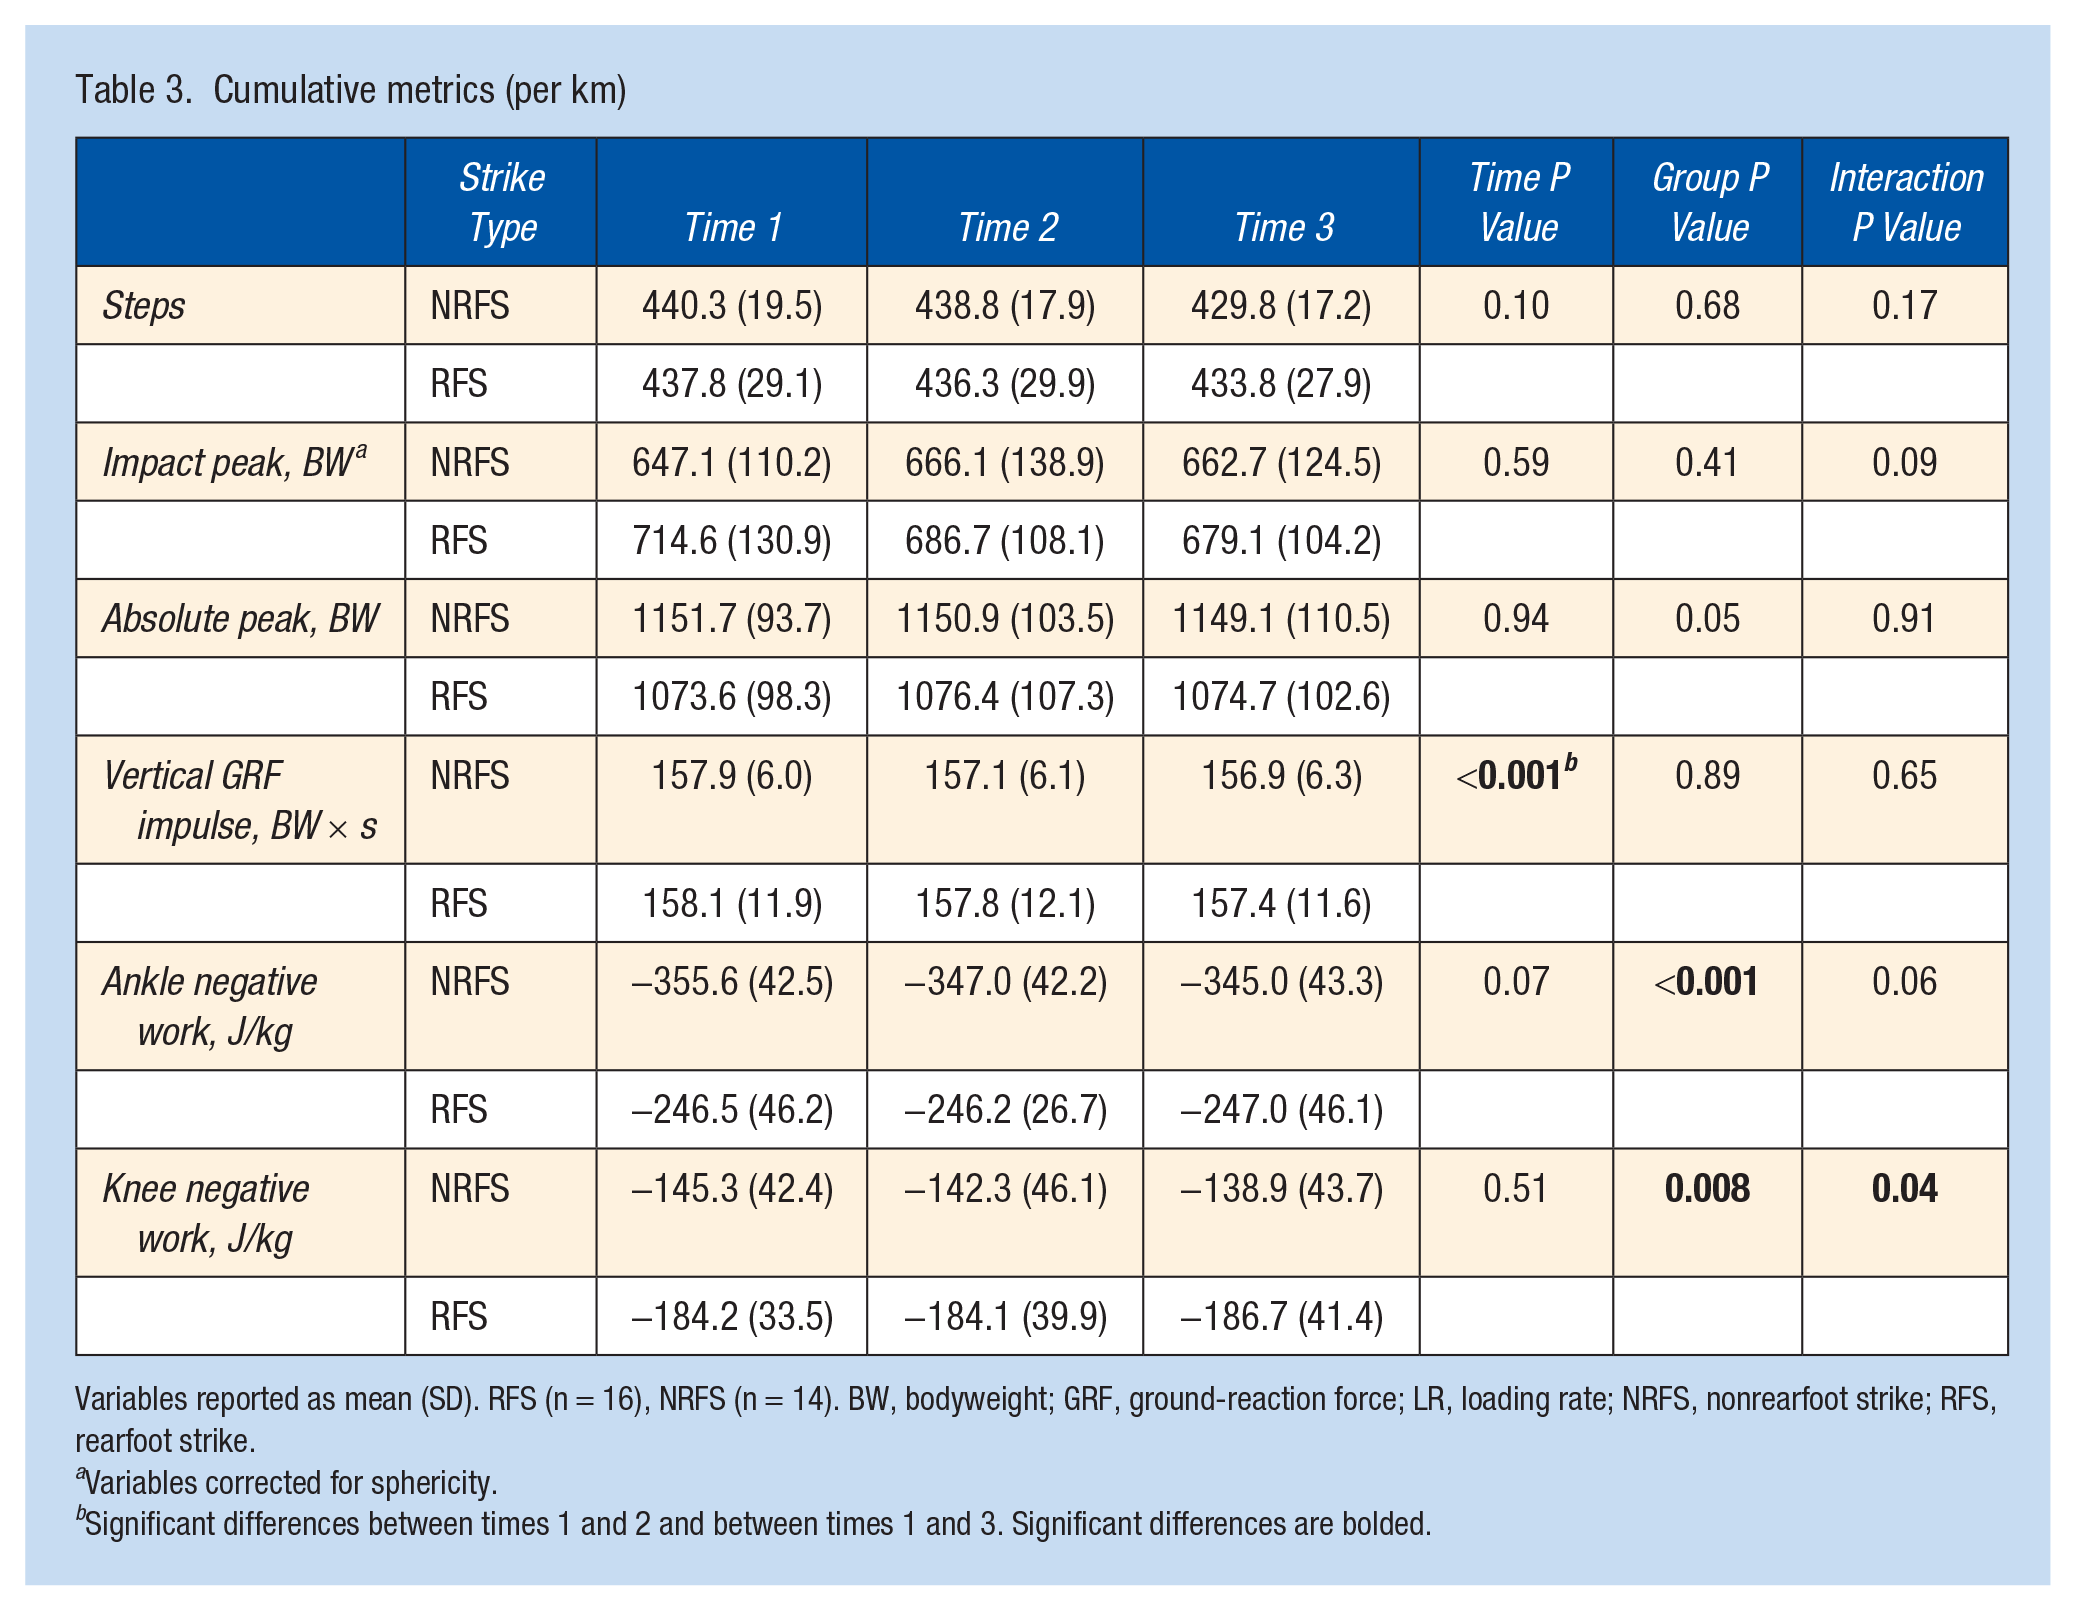
Variables reported as mean (SD). RFS (n = 16), NRFS (n = 14). BW, bodyweight; GRF, ground-reaction force; LR, loading rate; NRFS, nonrearfoot strike; RFS, rearfoot strike.
Variables corrected for sphericity.
Significant differences between times 1 and 2 and between times 1 and 3. Significant differences are bolded.
Discussion
The primary purpose of this study was to determine how foot strike type affects cumulative loading in runners. Our per stride hypotheses were partially supported, with RFS runners having greater LR and knee negative work and NRFS runners having greater ankle negative work. The lack of differences in stride rate between groups led to our hypotheses regarding cumulative loading also being supported only partially. This, combined with no significant differences in per stride VGRF peaks and impulse, led to no significant differences in cumulative VGRF peaks and impulse. In addition, knee negative work remained greater for RFS runners when calculated cumulatively. Ankle negative work was not magnified as a cumulative metric but was still greater for NRFS runners. A secondary purpose of this study was to determine whether individual metrics change throughout a 5-km submaximal run. Our hypothesis that per stride and cumulative metrics would change over time regardless of strike type was only accurate for per stride LR and cumulative VGRF impulse. Both the significant and nonsignificant results provide some insights into running loads when placed in the context of previous literature, as discussed below.
Many of the comparisons between strike patterns revolve around potential differences in spatiotemporal metrics (eg, increased stride rate and decreased step length in NRFS); however, previous empirical studies on this topic are somewhat mixed. We based our hypothesis on several studies showing higher stride rates in NRFS runners,19,21,39 as well as a matching perception throughout the running community. However, a deeper examination of the literature reveals an interesting potential interaction between study design and spatiotemporal metrics (Table 4). After compiling and comparing study characteristics (treadmill vs overground, habitual vs acute strike type, speed, and sex), the defining factor of whether or not there was a difference in stride rate appears to be whether the running speed was set by the researchers (fixed) or self-selected by runners. When fixed, there have been no differences in stride rate. When self-selected, the reverse has been true, even when no statistical differences were noted in selected speeds. Interestingly, in all of the fixed speed studies (including ours), stance time was decreased in NRFS runners without an accompanying decrease in stride rate. In 1 of these studies, 10 decreased stance time was accompanied by a compensatory increase in flight time. In our study, we did not find a difference in flight time; however, the means fell in this direction and could be meaningful with greater statistical power. In summary, it appears that constraining running speed may influence spatiotemporal parameters, and future research should seek to tease out this subtle interaction.
Previous literature on stride rate and foot strike type
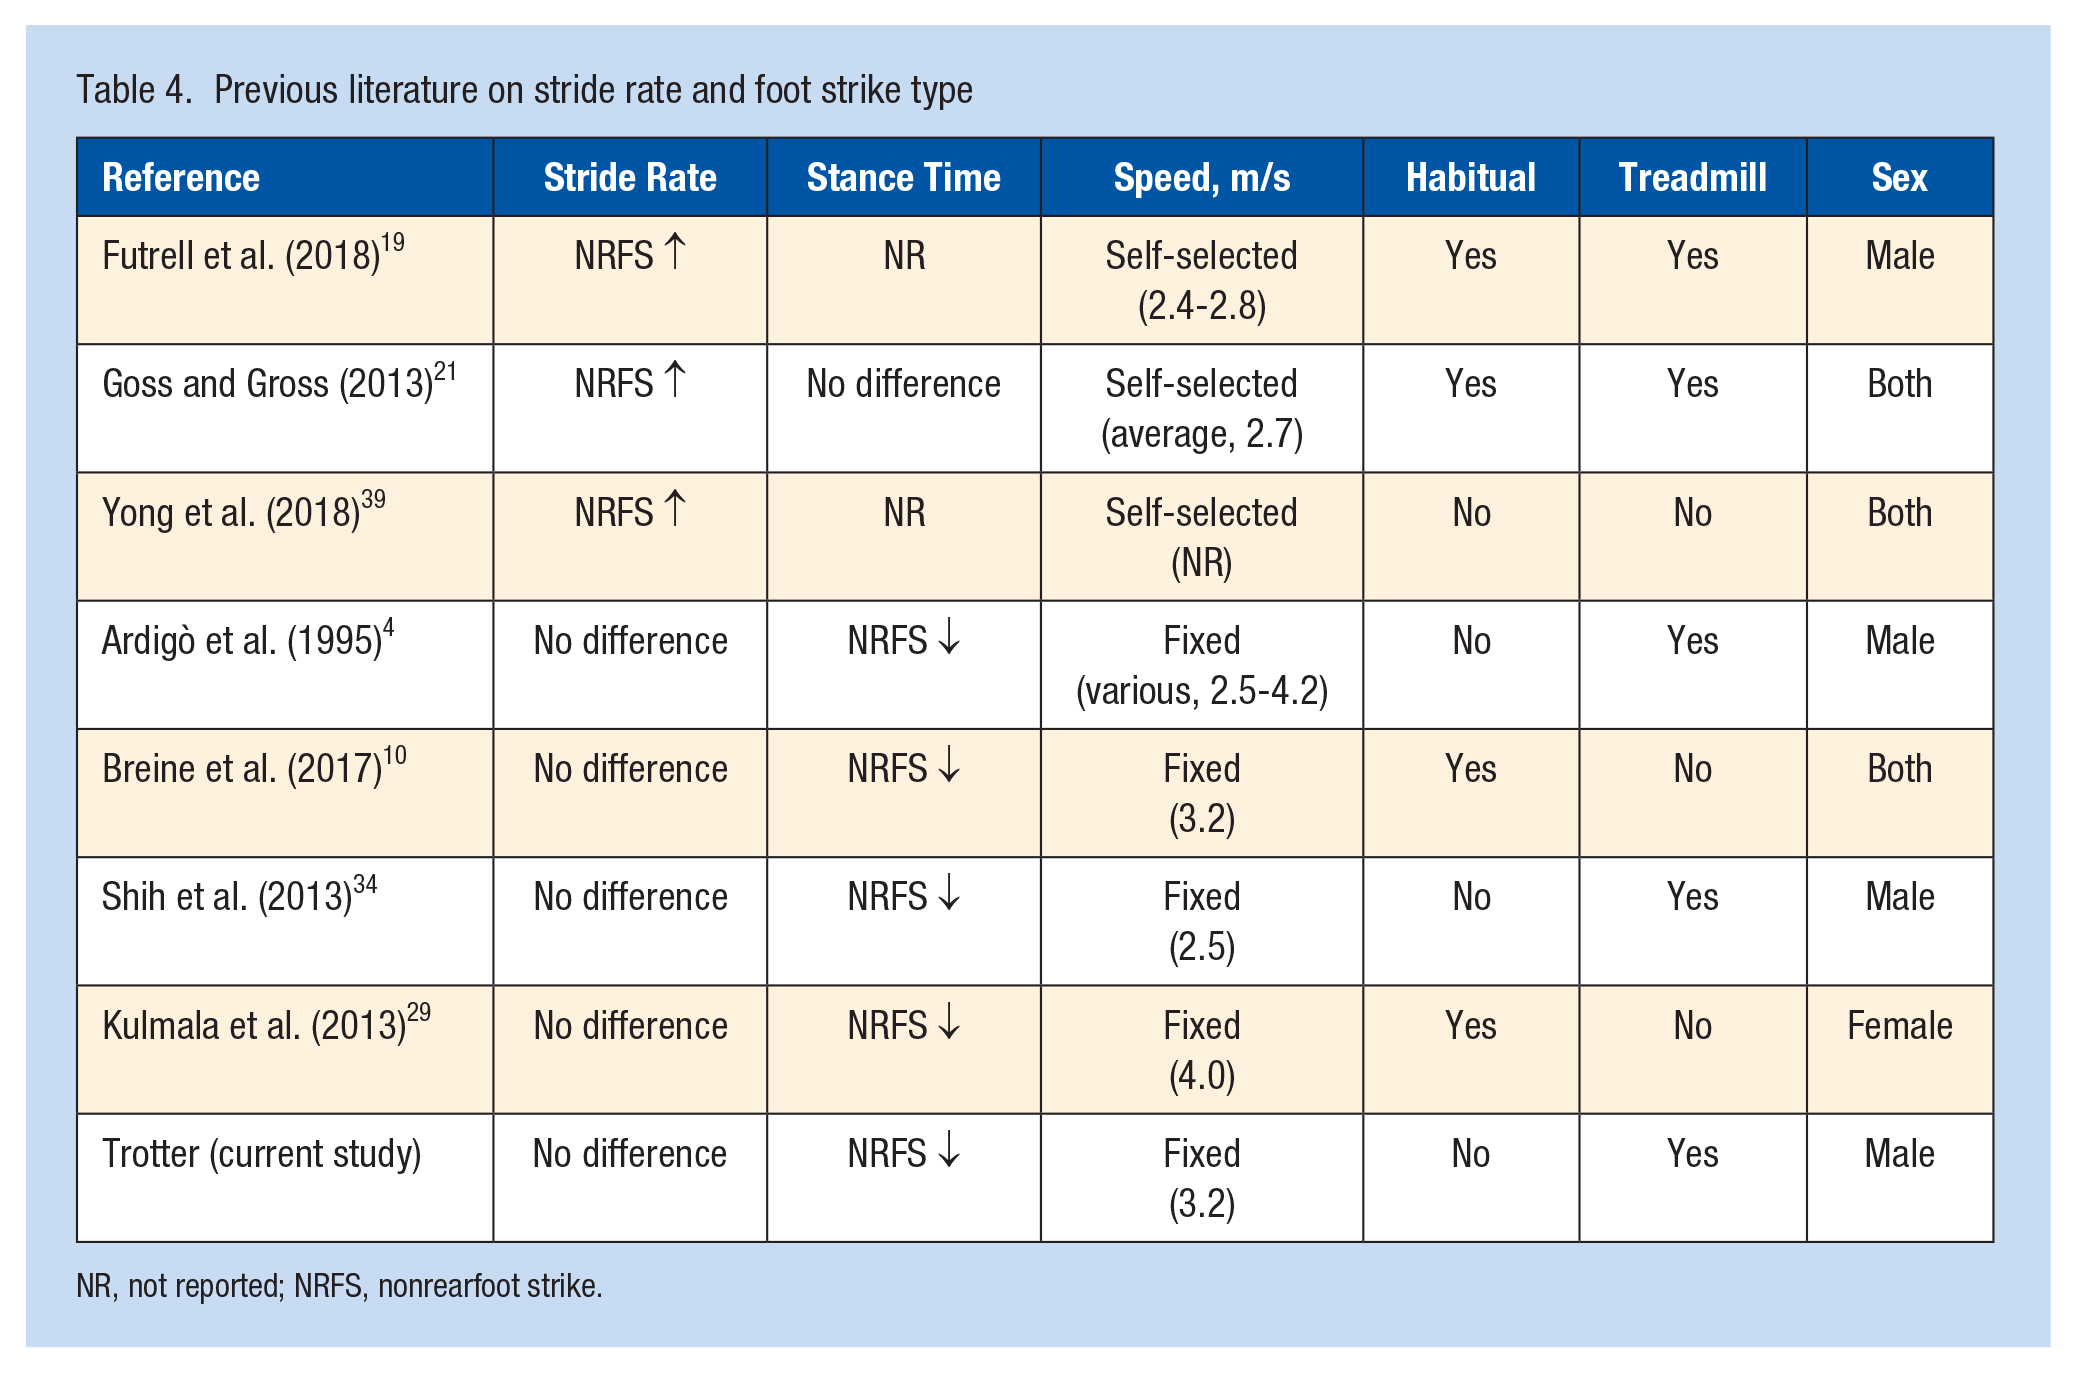
NR, not reported; NRFS, nonrearfoot strike.
Our per stride VGRF results are mostly in line with previous studies. Numerous studies mention the visual absence of an impact peak in NRFS runners; however, only a few studies have quantified this peak due to difficulty in determining a comparable value when a peak is lacking.8,29 In our study, we found no difference in impact peak values between groups, but, consistent with most previous work, we did see a small difference in LR.1,3,7,19,21,32,39 Regarding the absolute peak, previous literature is again mixed. An additional compilation and comparison of these studies suggests that the determining factor in whether there was a difference in absolute peak appears to be whether the study employed habitual or acutely converted foot strike type. Studies on habitual strike types found no difference in peak force,8,10,21,29 whereas acute changes in strike type did.28,30,36,37 Our study employed a habitual strike type and is consistent with the former studies. Certainly, there is a visual difference between groups in VGRF profiles during impact (Figure 1); yet, the implication of these differences is still not clear. For instance, while a NRFS is typically known for having no impact peak, there seems to be a change in LR earlier (right after IC) that has been noted and could be of interest. 30 Determining differences in impact in the frequency domain has also been explored and may be useful in making meaningful comparisons. 22
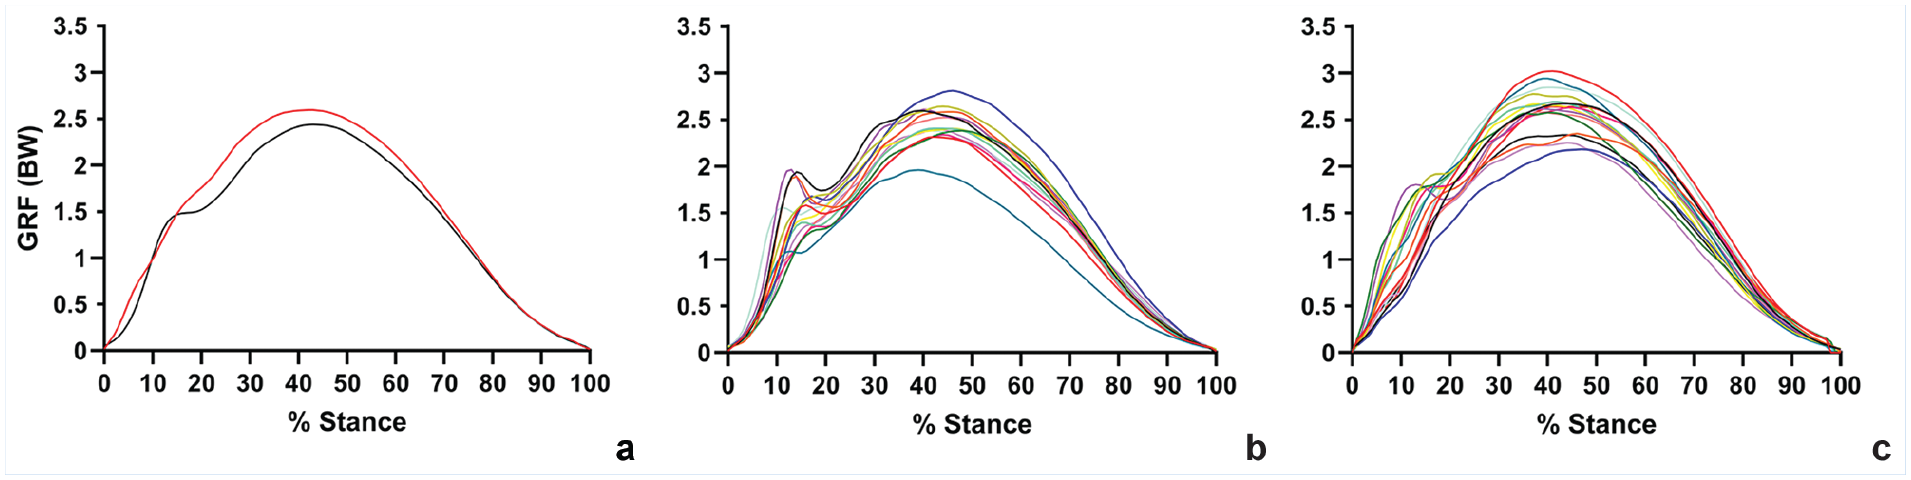
Comparison of VGRF curves for RFS and NRFS runners (at timepoint 3). (a) Group mean VGRF curves (red, NRFS; black, RFS). (b) Mean curves for individual RFS runners. (c) Mean curves for individual NRFS runners. BW, bodyweight; NRFS, nonrearfoot strike; RFS, rearfoot strike; VGRF, vertical ground-reaction force.
When analyzing the VGRF curve to determine impact and absolute peaks, we observed substantial within-group variability (Figure 1). Like other studies, there was an observable difference between groups for the absolute peak when looking at the mean curve (Figure 1a); however, a significant statistical difference was not found, likely due to the high individual variability within strike type groups (Figure 1b and c). Among RFS runners, this variability also influenced the timing of the impact peak, which occurred at approximately 14.5% of stance phase. As seen in Figure 1b, there is variability in the timing and magnitude of the impact peaks, which, when averaged, attenuated that peak. The common perception that NRFS runners do not have impact peaks whereas RFS runners do is not always supported. In this study, 2 NRFS runners displayed impact peaks typical of RFS runners, while 1 RFS runner did not show an impact peak; none of these specific runners had borderline foot strike angles. Considering these most visible variations to the expected VGRF patterns, as well as others that are less obvious, it seems predicting or generalizing injury incidence based on strike type grouping would not be effective. If VGRF peaks are related to injury, looking at an individual runner’s direct loading rather than their strike type would be required.
After finding no significant differences between groups in number of steps, we anticipated that we would see the same differences and trends in cumulative loading variables that we saw in per stride variables. Surprisingly, the normalized cumulative VGRF absolute peak approached significance between groups and may have reached significance with more participants. When each timepoint was extrapolated to a kilometer, VGRF impulse became significantly different across timepoints, possibly due to the compounding of the small differences in stride rate and impulse that were not seen as significant when comparing per stride averages. The difference in both LR and cumulative impulse across time shows that the beginning of a run may have different mechanics, and therefore a different risk profile for injury, than the middle or end of a run. Interestingly, both variables decreased across time, suggesting that the runners were “warmed up” at the end of this submaximal run, rather than fatigued. Thus, a single cumulative calculation may not be an accurate representation of an entire run when extrapolated and care must be taken when interpreting results. Further exploration is warranted to measure variables over longer runs to determine whether additional significant changes occur over time, or whether there is a steady state window and when that occurs. Furthermore, the interaction between length of running sessions and number of running sessions may also contribute to a weekly cumulative load more than just kilometers run.
There were a number of limitations inherent in the study design. Most importantly, only male recreational runners with a fairly high skill level were included in this study and therefore results may not be generalizable across all sexes or skill levels. Also, the first timepoint was taken just after the 3-minute mark when the speed was increased from the warm-up speed (2.98 m/s) to the testing speed (3.15 m/s). Collecting data immediately after the speed increase may have introduced additional variability in that timepoint; however, the change in speed was slight and the standard deviations surrounding this timepoint were similar to the other 2 timepoints.
Running shoes were provided to control for potential confounding influences.13,23 The provided shoe had a 10-mm heel drop, and greater heel drops influence foot strike angle, braking phase duration, and LR. 5 It is possible that using the provided shoes affected RFS and NRFS runners differently. We also used a treadmill to control running speed. Treadmill running increases stride rate and decreases stance and flight time compared with overground running. 35 Although the previously mentioned studies comparing stride rate between foot strike types noticed the fixed speed to be the factor of seeing a difference in stride rate, it could be worth investigating an interaction between treadmill versus overground running and strike type. Limitations with using a treadmill also include a potential issue in attenuating the impact peak due to additional filtering required to remove the extra noise inherent in the treadmill. Only the right limb was analyzed, and asymmetries could have affected results.
Conclusion
In summary, we found differences in per stride and cumulative ankle and knee loading metrics between foot strike groups, as previously observed. However, individual variability in VGRF loading patterns were more apparent than any group distinctions. We also found patterns in previous research suggesting that study design components, specifically self-selected speed and habituation, affect variables such as stride rate and peak VGRF. The common perception that NRFS runners have a higher stride rate was not supported in this study. Finally, we determined that cumulative calculations can be different if taken at the beginning versus the end of a run. Quantifying injury risk is complicated and cumulative damage models should take into account individual load capacity and training session characteristics (eg, warm-up time, length, intensity, and rest time).