
Abstract
Background:
Wearable technology shows promise for monitoring exertional sweat loss, yet its accuracy requires evaluation. This study evaluated the accuracy of 2 commercially available smartwatches for estimating sweat loss compared with gold standard methods.
Hypothesis:
Sweat loss values measured via wearable technology will be determined accurate compared with gold standard methods.
Study Design:
Cross-sectional.
Level of Evidence:
Level 2.
Methods:
A total of 111 participants (age, 40 ± 14 years; height, 171.0 ± 8.9 cm; body mass, 70.8 ± 14.7 kg; VO2max, 46.8 ± 8.7 ml/kg/min) completed up to 4 running trials under varying conditions (indoor/outdoor, distances from 2.5 km to 20 km, and interval runs). Sweat loss estimates from each smartwatch were compared with criterion measurements based on change in nude body mass pre- and postexercise. Validity statistics included tests for error (mean absolute error [MAE], mean absolute percentage error [MAPE]), linearity (Lin’s concordance correlation coefficient [CCC], Pearson’s [r], and Deming regression), equivalence (CI for difference in means), and Bland-Altman plots for bias assessment. Stratified analyses by sex, weight, and fitness category were also completed, along with a chi-square test of independence.
Results:
Both devices demonstrated acceptable overall correlation (CCC range, 0.71 to 0.90) but substantial errors in estimating exertional sweat loss (MAPE range, 25.38% to 33.21%). Stratified analyses yielded similar results, with no additional analyses meeting the combined validity thresholds.
Conclusion:
Wearable devices offer a promising and convenient tool for general sweat loss tracking but lack the precision to replace laboratory methods for hydration management. Traditional methods remain essential for the most accurate measurements.
Clinical Relevance:
Wearable devices provide an accessible option for sweat loss monitoring. This study highlights their potential for general tracking while emphasizing the need for laboratory methods when accuracy is critical, ensuring better guidance for hydration strategies in sports performance and health applications.
As wearable technology continues to advance in sophistication, the number of variables that devices can evaluate, or estimate, are increasing with each new model. Sweat loss is among these novel metrics. Although there are gold standard laboratory-based tests for measuring sweat loss, they can be expensive and/or time consuming. Real-time monitoring during training is unfeasible for the general population and logistically challenging to incorporate into training schedules, even for athletes with an abundance of resources. Thus, continuous, or near continuous, monitoring of sweat loss by relatively accessible and easy-to-use wearable technology represents an advantage to the athlete, if devices are sufficiently accurate.
Maintaining appropriate hydration status and monitoring sweat loss is important for sport performance, especially for endurance athletes, as a loss in body mass greater than 1.5% to 2% has been shown to have deleterious effects on performance.11,19,22 Although it is important to understand sweat loss for peak athletic performance, the actual act of monitoring sweat loss is complex.1,4,20 Some gold standard measurements performed in laboratory settings, such as measuring total body water or plasma osmolality to assess hydration status, are impractical for daily use as they are invasive, expensive, and only provide single-point-in-time measurements, missing the dynamic nature of hydration throughout the day.1,4 Thus, for assessing sweat loss, many researchers and practitioners still recommend a simple process of monitoring changes in nude bodyweight while accounting for any fluid/solid consumption (eating or drinking) and fluid/solid clearance (urine or stool), which has been shown to be both accurate and logistically feasible.1,4,20,25
While wearable technologies that attempt to directly assess hydration status exist, accurately measuring sweat loss with wearable devices remains a significant challenge. Direct measurement sweat sensors have been developed that can use techniques such as microfluidic channels, electrochemical sensors, bioelectrical impedance analysis (BIA) and optical assays to collect and analyze sweat in real time, or near real time.3,9 The Gatorade Gx Sweat Patch (PepsiCo Inc), the Nix Biosensor (Nix Inc), and the Epicore Discovery Patch (Epicore Biosystems Inc) are among some of the devices available commercially. There are additional technologies and prototypes commonly reported in the literature, yet they are often not widely accessible or scalable,26,27-29 and rely primarily on single-use designs, requiring users to purchase new patches for each analysis.3,9,10,29 Although this approach may improve estimations of hydration-related measurements, accurately measuring sweat loss remains a challenge, and the use of a reusable and more accessible sensors would offer many benefits.
Roughly 1 in 3 US adults currently use a wearable device to track their health and fitness. 12 Commercially available smartwatches by both Samsung (Samsung Electronics Co) and Garmin (Garmin Ltd) provide sweat loss metrics, in milliliters, to their users after exercise activities. Although the indirect sweat loss prediction algorithms are not publicly available, developer websites and published data suggest these watches use a variety of factors to predict sweat loss, including anthropometric parameters (weight, height, age, sex), ambient temperature and humidity, exercise type, and data from the watch’s other sensors (eg, heartrate, accelerometer, etc).15,23,24 Although accessibility and ease of use are strengths of these devices, reliance on indirect measurements and proprietary algorithms introduces uncertainty regarding the interpretation and application of sweat loss metrics.
Wearable technology has the potential to provide constant monitoring of exertional sweat loss for people with appropriate devices. However, indirect estimation of sweat loss by these devices necessitates independent validation, which is crucial to ensure consumers can rely on these metrics to make informed decisions about their health and activity. Thus, the purpose of this study is to evaluate the ability of smartwatch devices to accurately estimate sweat loss during exercise compared with gold standard methods.
Methods
The data presented in this study were part of a larger investigation evaluating the use of wearable technology in physically active populations. Participants were included if they regularly participated in moderate to vigorous physical activity (at least 3 days per week). Participants were excluded if they had a contraindication to intense exercise (eg, cardiovascular disease, significant musculoskeletal or neurological impairments, etc) or were pregnant. All participants provided written informed consent before testing, and all procedures were approved by the University’s Institutional Review Board.
Participants completed up to 4 testing sessions, each separated by 1 to 2 weeks, based on researcher and participant availability (days between visits 1 and 2, 11.2 ± 6.4; between visits 2 and 3, 10.8 ± 8.0; between visits 3 and 4, 12.1 ± 6.8). Participants completed VO2max testing at visit 1. They then completed runs of varying environment (indoor, outdoor) and distance (2.5 km, 5 km, 10 km, 20 km, interval run) on visits 2, 3, and 4 to assess sweat loss during those conditions.
Gold standard sweat loss was measured (in milliliters) during visits 2, 3, and 4 by tracking change in nude body mass before and after exercise, restricting fluid intake and urine output outside of exercise and post-testing. Any participants who were not able to restrict fluid intake, urine output, or complete the exercise were excluded from analysis. In addition, urine specific gravity (4410(PAL-10S) Digital Urine Specific Gravity Refractometer, Atago) and urine osmolality (Osmo1, Advanced Instruments) were tested postexercise to assess level of hydration. During each trial, participants wore a Garmin Forerunner 945 (software Version 13.00) and Samsung Galaxy Watch5 (software Version R945USQU1AXB7) on their wrists (visit 2: Garmin left wrist, Samsung right wrist; visits 3 and 4: Garmin right wrist, Samsung left wrist), both of which provided an output estimate of sweat loss in milliliters after the exercise run. Participants put on the devices themselves using manufacturer device instructions, while investigators ensured proper fit so that the watch did not move during activity. Investigators reset watch settings and created individual profiles using the profile settings for each device before each assessment.
Each participant completed an outdoor 5 km run at visit 2, an indoor 5 km run at visit 3, and were assigned to either an indoor or outdoor run of variable distance (2.5 km, 10 km, 20 km, interval run) at visit 4. The interval run consisted of 2 minutes of light running followed by 1 minute of sprint running, repeated 8 times. The interval run began and ended with a 5-minute warm-up and 5-minute cool-down. Cohort determinations for visit 4 were based on self-reported running experience (days per week engaged in running activity) and self-reported ability to complete the distance. Approximately half of each cohort for visit 4 ran their trial distance outdoors, and half ran indoors. All participants were instructed to complete runs at a self-selected light-to-somewhat-hard pace, and all participants wore the same laboratory-provided micro polyester performance shirt during all trials (Cooling Performance Crew, A4 Apparel Ltd). All indoor trials were completed on a treadmill (4Front). All outdoor runs were completed on predetermined GPS-measured routes with standardized start and stop locations. Before the run, participants were made familiar with the route and were monitored manually by laboratory staff during their run via a tracking device (AirTag, Apple Inc). Participants were also given written directions to carry during the run. After all runs, sweat loss values (milliliters) were taken directly from each device’s exercise recording app for further comparison against change in nude body mass (pre- vs postexercise).
Data Analysis
Participant data were collected and managed via a web-based data management system (REDCap) hosted at University of Michigan. 18 Sweat loss metrics were obtained as cross-sectional data provided by the test devices after each trial. All statistics were run in jamovi (The jamovi project [2024]. Jamovi [Computer Software] Version 2.6.13, retrieved from https://www.jamovi.org), and equivalence plots were plotted using an R Shiny app. 14 Study descriptive statistics can be found in Table 1, and participant descriptions can be found in Table 2.
Sweat loss descriptive statistics
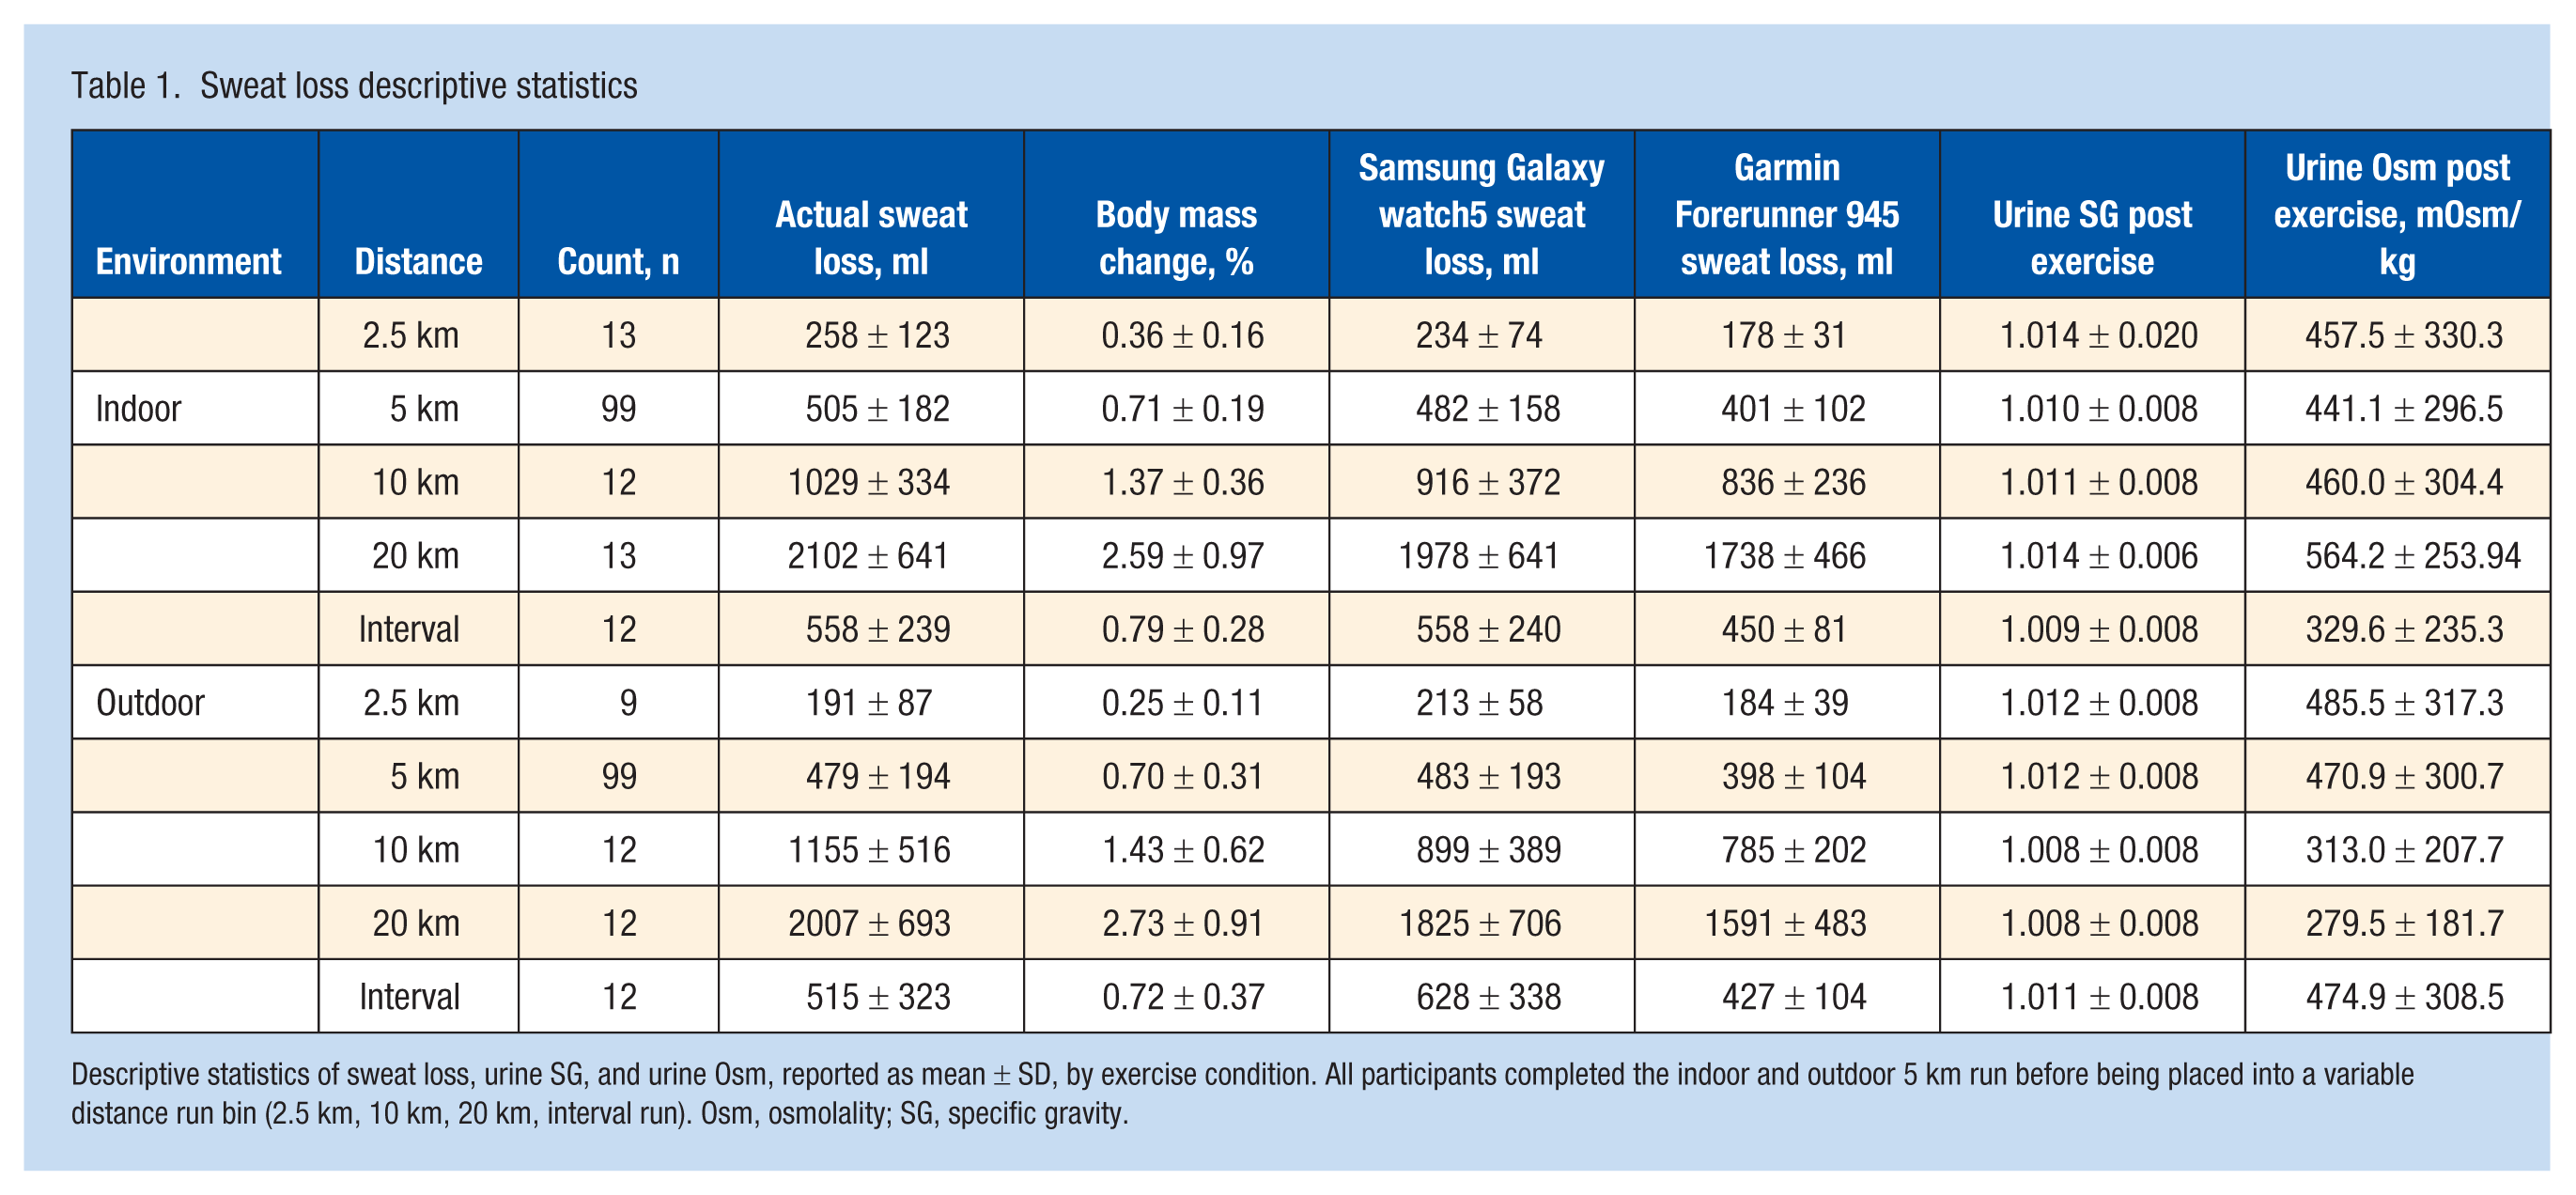
Descriptive statistics of sweat loss, urine SG, and urine Osm, reported as mean ± SD, by exercise condition. All participants completed the indoor and outdoor 5 km run before being placed into a variable distance run bin (2.5 km, 10 km, 20 km, interval run). Osm, osmolality; SG, specific gravity.
Participant descriptive statistics
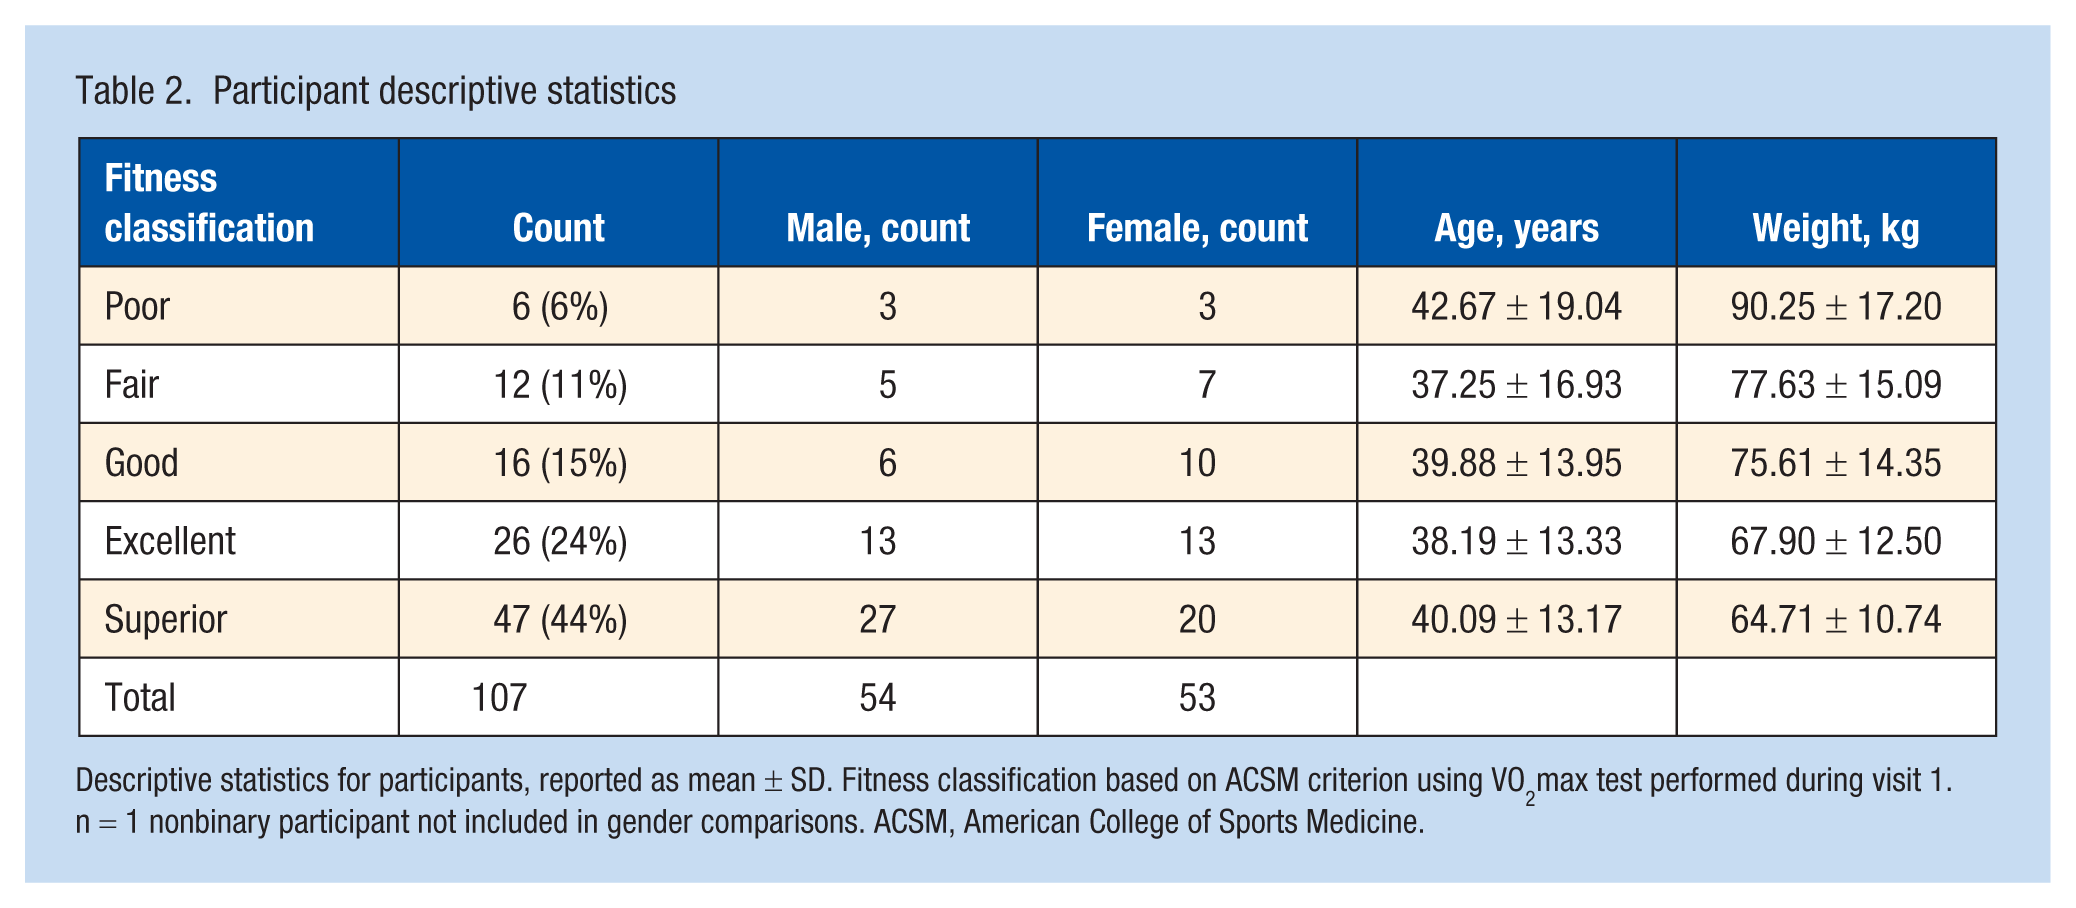
Descriptive statistics for participants, reported as mean ± SD. Fitness classification based on ACSM criterion using VO2max test performed during visit 1. n = 1 nonbinary participant not included in gender comparisons. ACSM, American College of Sports Medicine.
Sweat loss outcomes were evaluated via tests of error, linearity, and equivalence, with visual representation of bias being shown with Bland-Altman plots. The Garmin Forerunner 945 and Samsung Galaxy Watch5 were used as the test measurements for all statistical tests and change in nude body weight as the criterion measurement for sweat loss. Mean absolute error (MAE) and mean absolute percentage error (MAPE) were calculated for error analysis. Linearity was established via Lin’s concordance correlation coefficient (CCC), Pearson’s product moment correlation (r), and Deming regression. Correlation coefficients were interpreted as follows: 0 to <0.2, very weak; ≥0.2 to <0.4, weak; ≥0.4 to <0.6, moderate; ≥0.6 to <0.8, strong; and ≥0.8 to 1.0, very strong. 6 Equivalence testing was performed via CI for difference in means, using the 90% CI from paired t tests and 10% (±5%) of the criterion mean as the equivalence window. Bland-Altman plots are shown to represent bias visually, with upper and lower limits of agreement (Figure 1). In addition to descriptive statistics, a combined validity criteria was set to meet the following: MAPE < 10%, CCC > 0.7, and equivalence supported at 10% (±5%) equivalence window based on 90% CI.
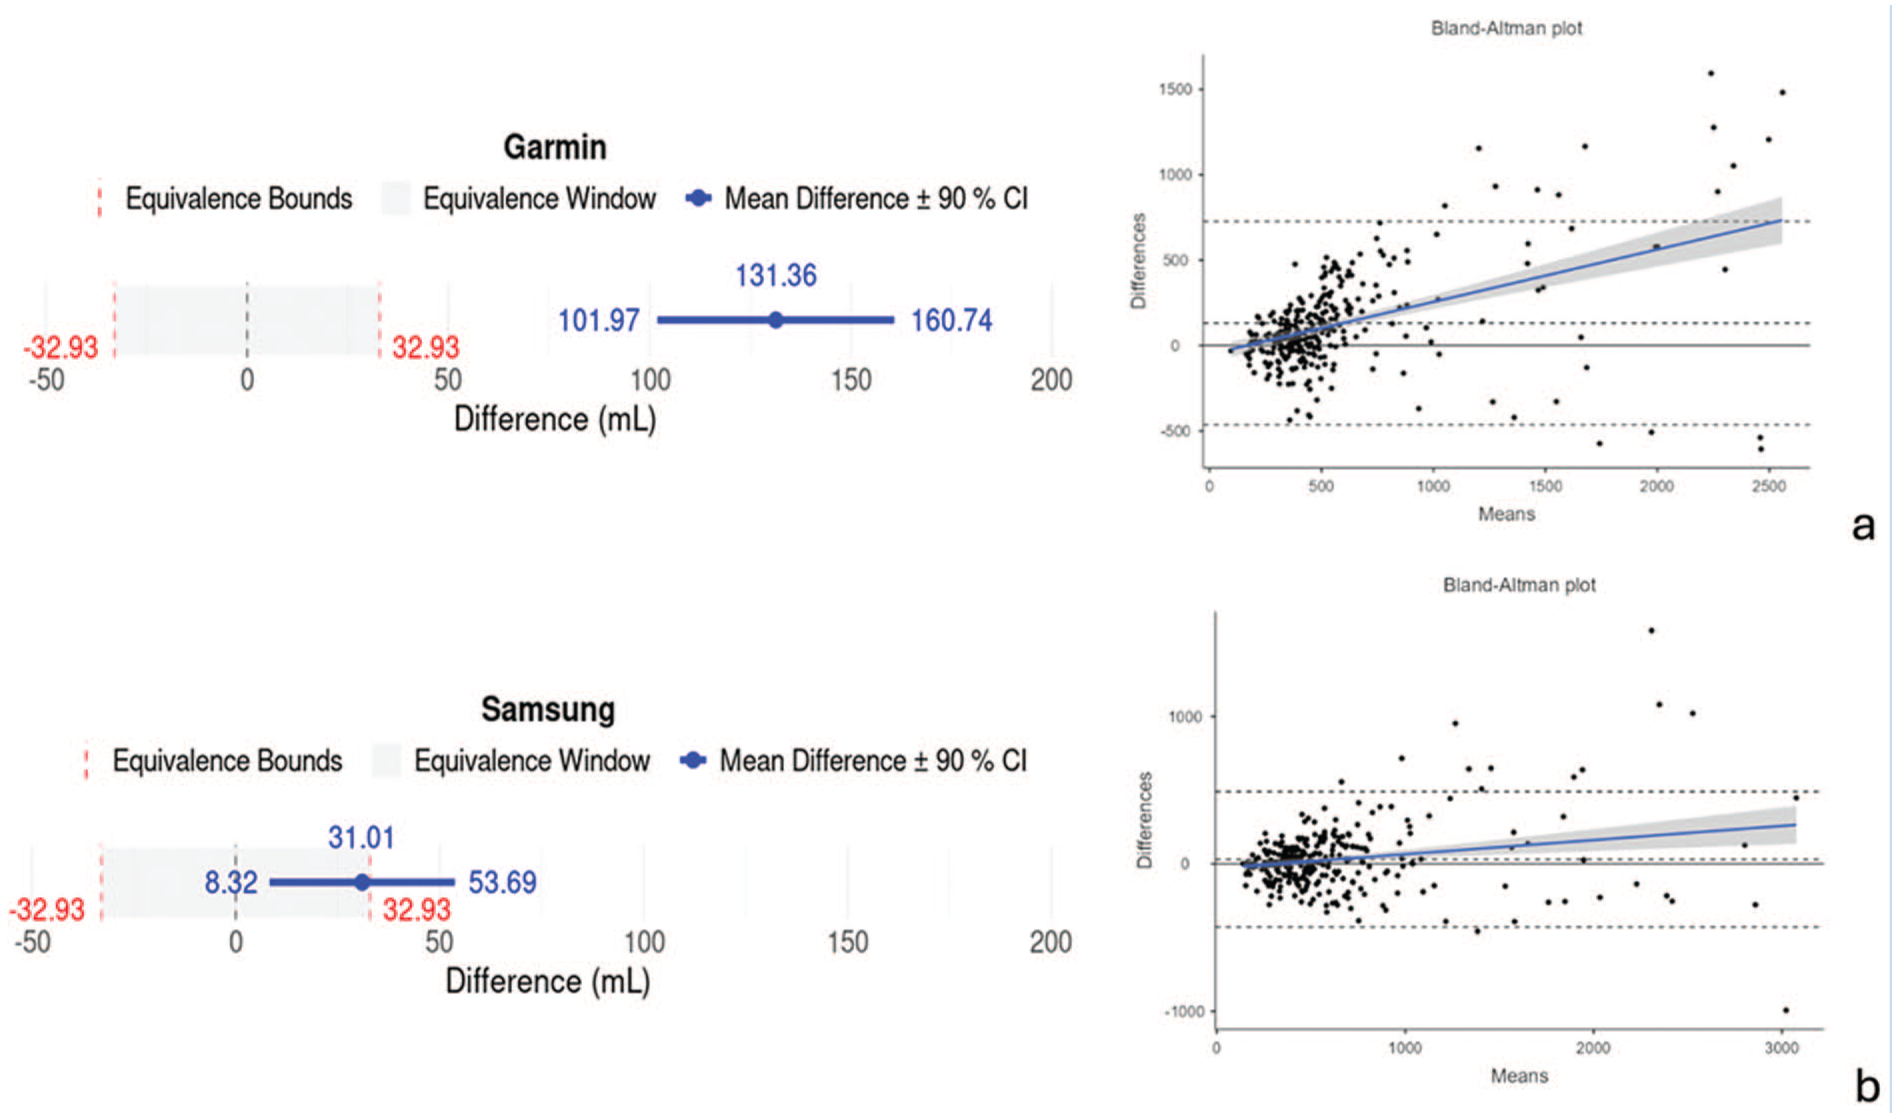
Combined comparisons for sweat loss estimates from (a) Garmin Forerunner 945 and(b) Samsung Galaxy Watch5 compared with criterion measurement. Equivalence window determined based on 10% of criterion mean (±5%). Bland-Altman plots for sweat loss estimation of Blue line represents proportional bias line with shadings representing 95% CIs of proportional bias line. The x-axis is the mean of the 2 measurements, with the y-axis the difference between the 2 measurements. The mean bias line and upper and lower limits of agreement are shown in dashed lines (mean bias being the middle-dashed line). The solid line represents the hypothetical mean bias of 0.
Data were further stratified by distance, environment, and sex for additional validity analyses (Tables 4-6) with equivalence plots and Bland-Altman plots presented in Figures 2 to 4. Additional validity statistics by weight, and fitness category can be found in the supplementary files. A chi-square test of independence was performed between distance at visit 4 and fitness category to determine whether sufficient randomization was observed, or if there was an association between the distance run and the fitness category of the participant. The 5 km distances were excluded for the chi-square test, as every participant performed the 5 km trials. A multivariate analysis of variance (MANOVA) was conducted to examine the effects of distance (2.5 km, 5 km, 10 km, 20 km, interval run) and environment (indoor, outdoor) on absolute percentage error (APE) across 2 devices (Garmin Forerunner 945, Samsung Galaxy Watch5) to determine any group differences and help elucidate appropriate reporting stratifications.
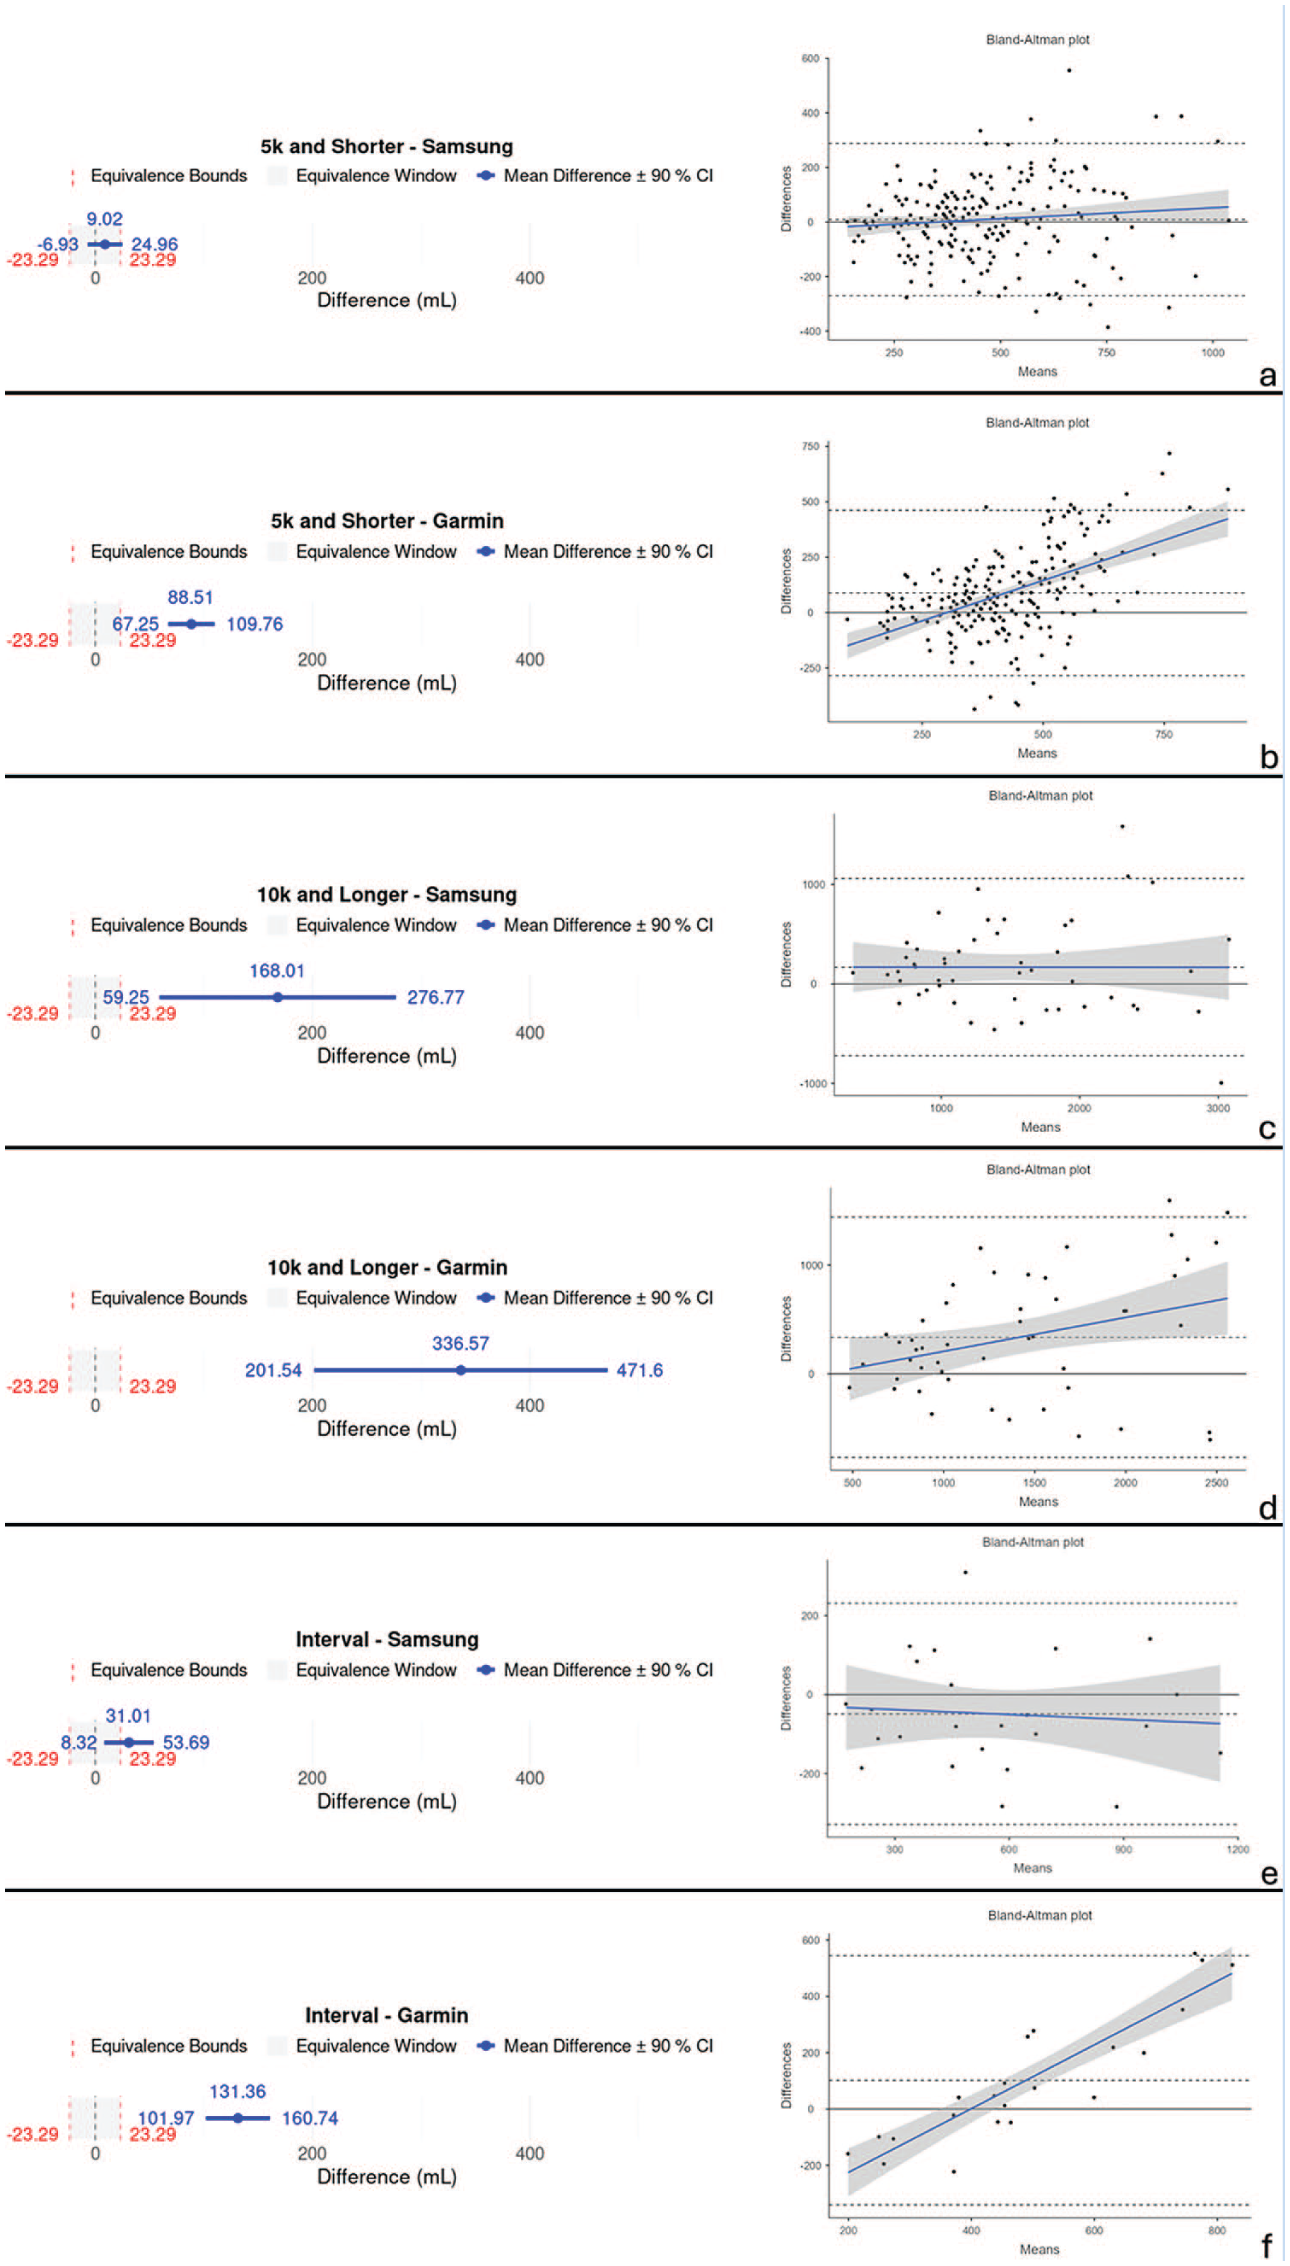
Distance comparisons. Equivalence and Bland-Altman plots for sweat loss data separated by distance conditions, Garmin Forerunner 945 and Samsung Galaxy Watch5 devices compared with criterion measurement. Equivalence window determined based on 10% of criterion mean (±5%). Bland-Altman plots for sweat loss by device and distance. (a) Change in body mass vs Samsung Galaxy Watch5, ≤5 km. (b) Change in body mass vs Garmin Forerunner 945, ≤5 km. (c) Change in body mass vs Samsung Galaxy Watch5, ≥10 km. (d) Change in body mass vs Garmin Forerunner 945, ≥10 km. (e) Change in body mass vs Samsung Galaxy Watch5, Interval run. (f) Change in body mass vs Garmin Forerunner 945, Interval run. Because MANOVA results revealed no significant difference in error between distances, data are presented as short distance (2.5 km, 5 km), long distance (10 km, 20 km), and variable distance (interval run). MANOVA, multivariate analysis of variance.
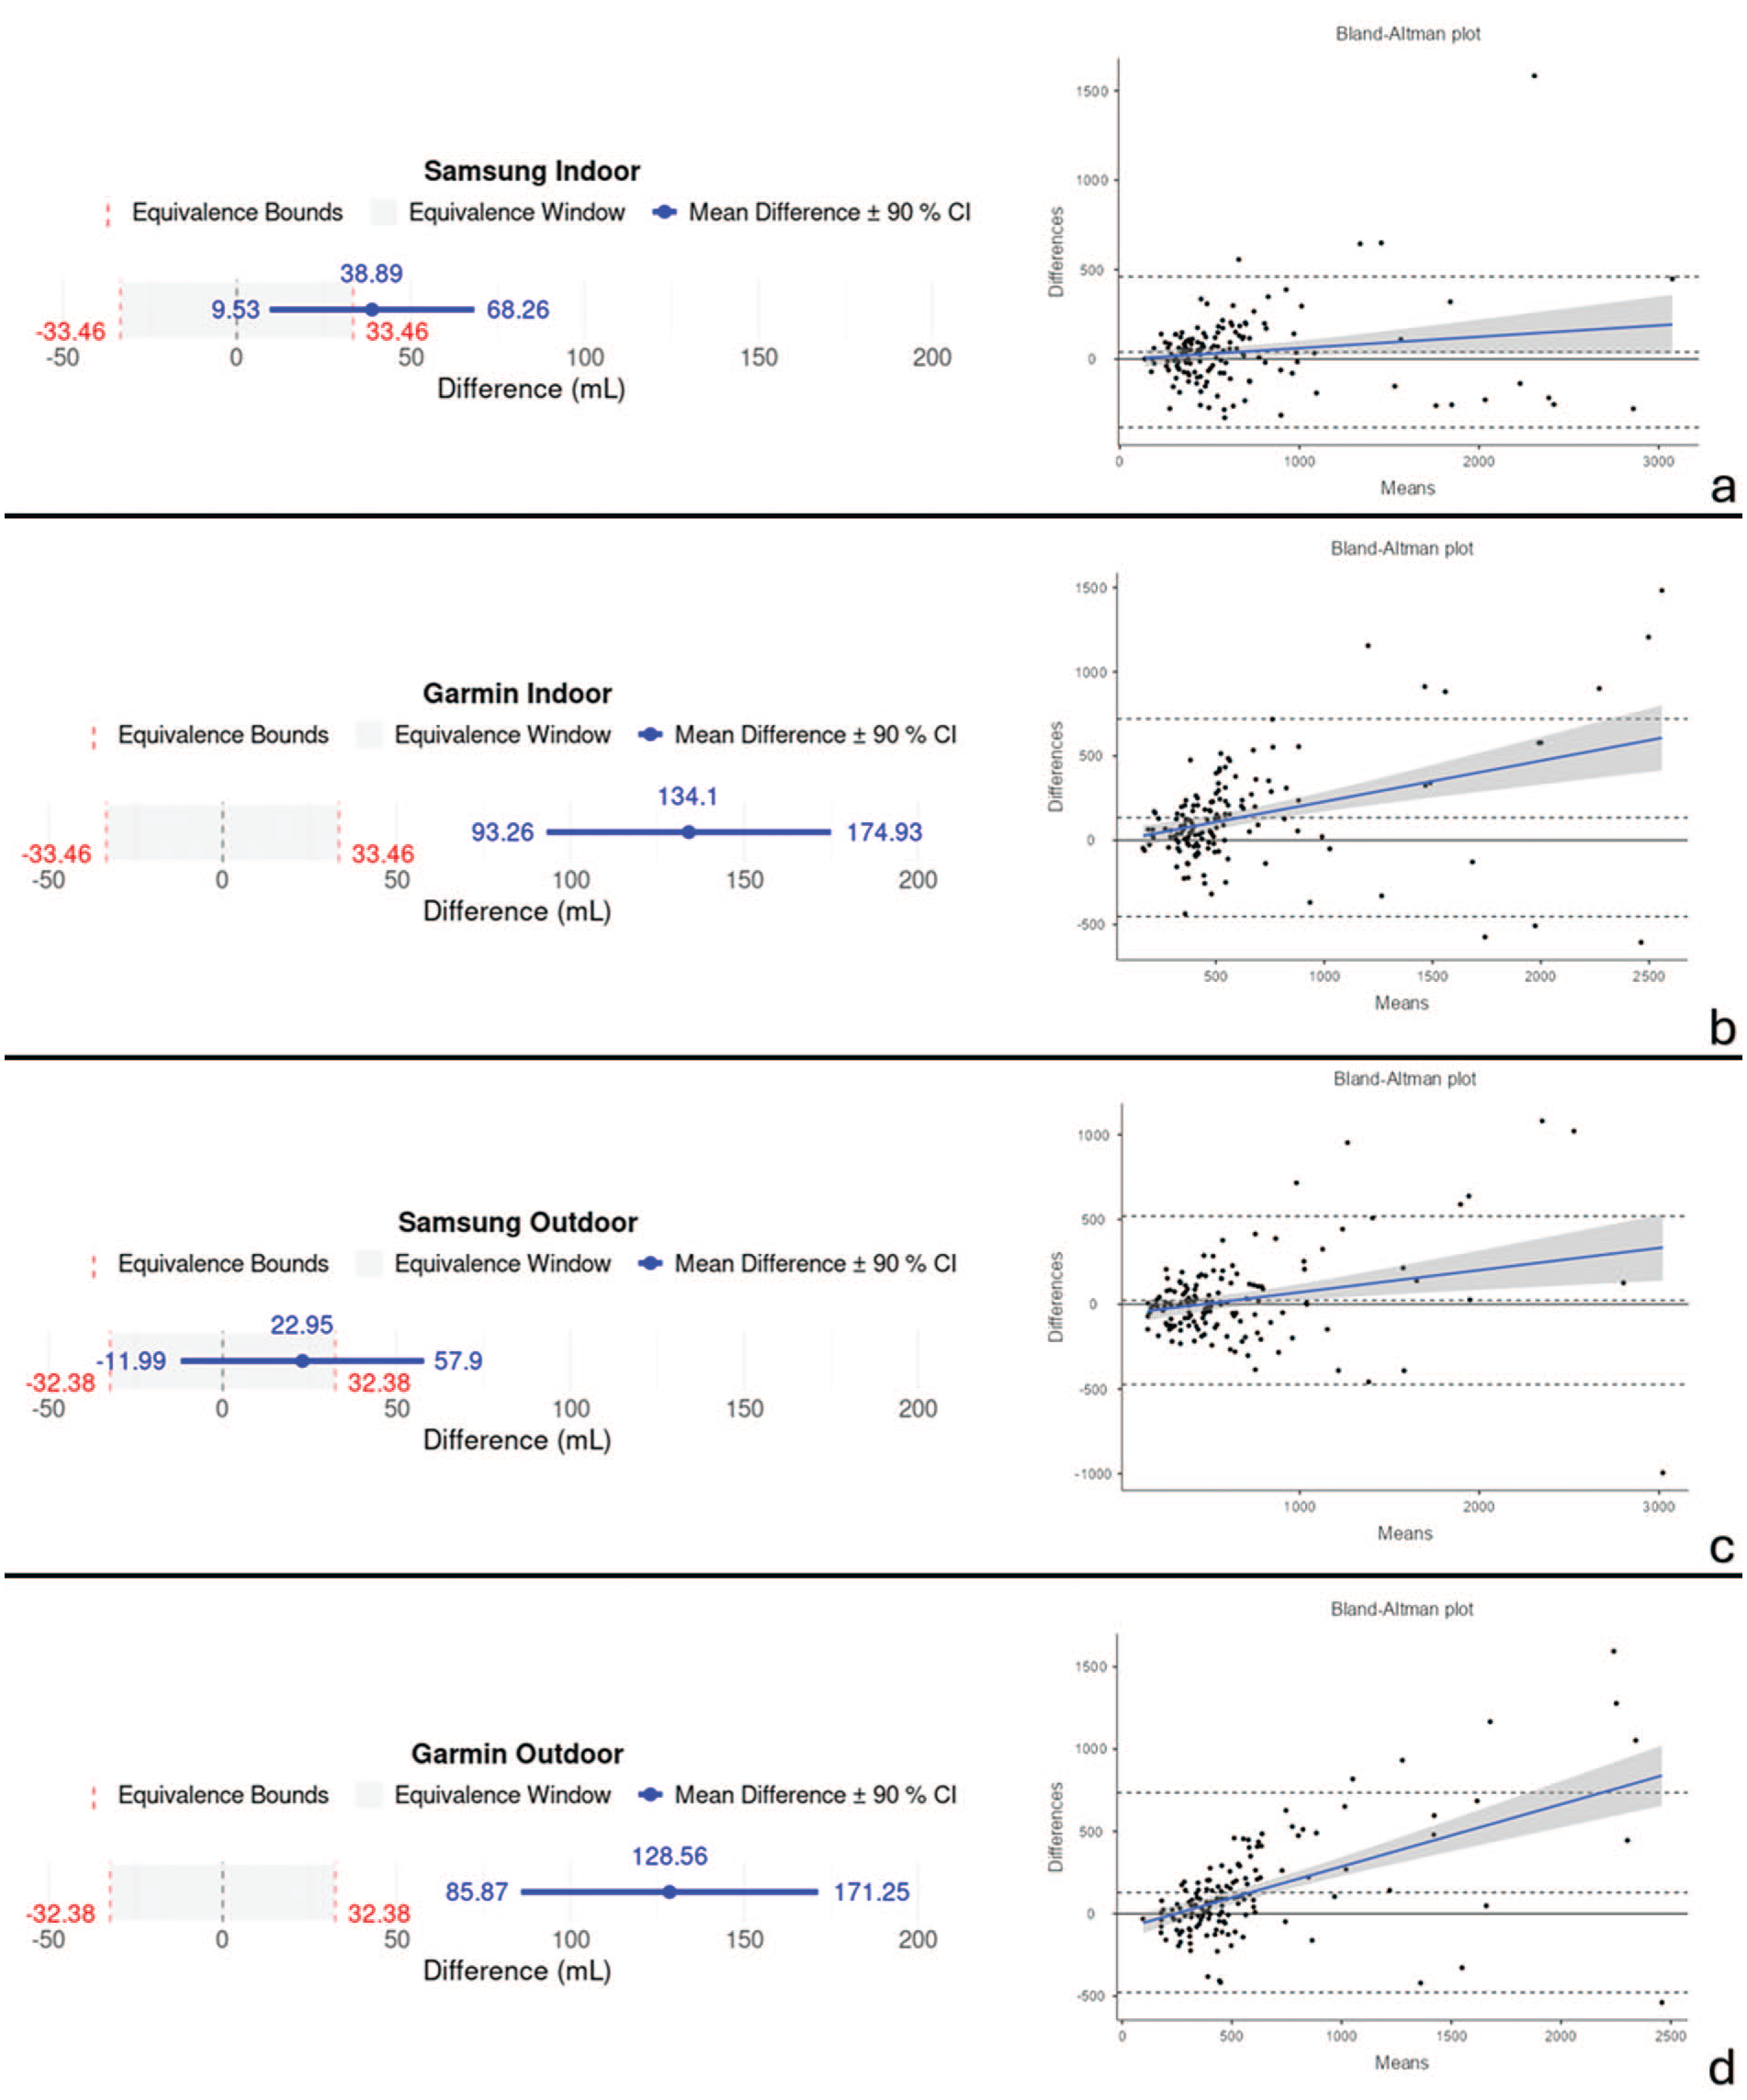
Environment comparisons. (Left) Equivalence plots for sweat loss data for environment (indoor vs outdoor) conditions, Garmin Forerunner 945 and Samsung Galaxy Watch5 devices compared with criterion measurement. Equivalence window determined based on 10% of criterion mean (±5%). (Right) Bland-Altman plots for sweat loss by device and environment. (a) Indoor Samsung Galaxy Watch5. (b) Indoor Garmin Forerunner 945. (c) Outdoor Samsung Galaxy Watch5. (d) Outdoor Garmin Forerunner 945.
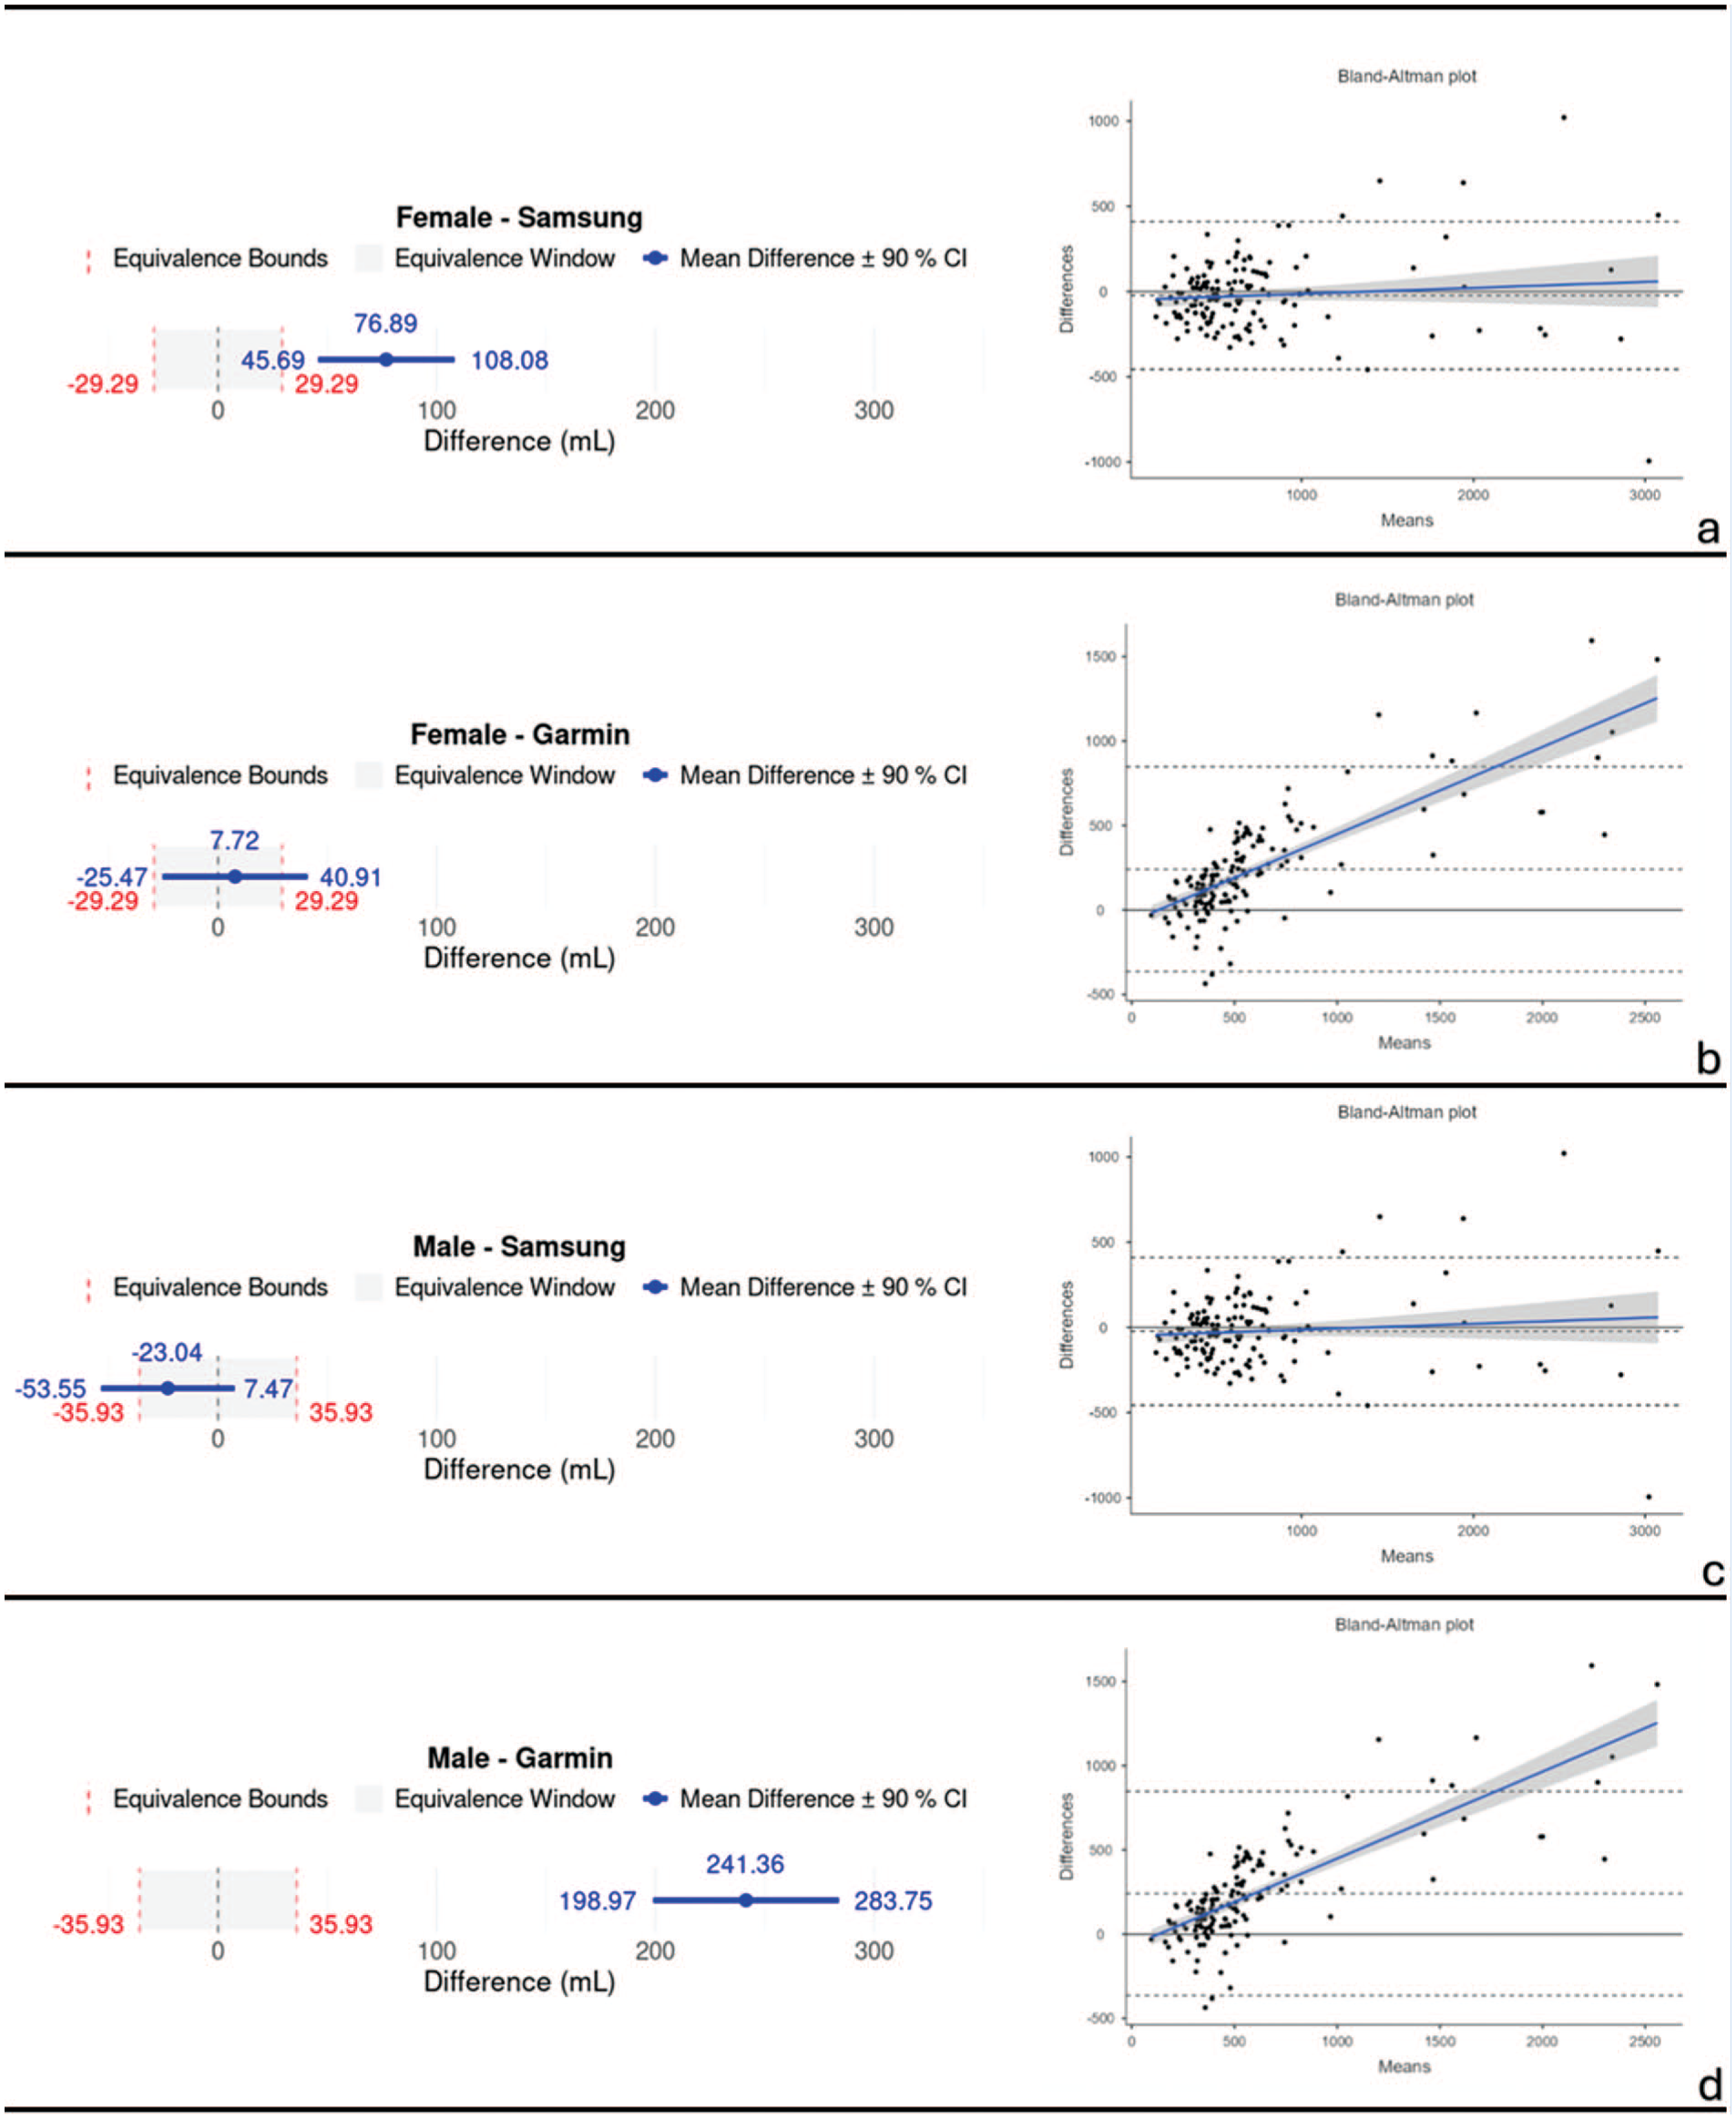
Sex comparisons. Bland-Altman and equivalence plots for Garmin Forerunner 945 and Samsung Galaxy Watch5 compared with criterion measurement. Mean = mean difference, equivalence window determined based on 10% of criterion mean (±5%). (a) Change in body mass vs Samsung Galaxy Watch5, female. (b) Change in body mass vs Garmin Forerunner 945, female. (c) Change in body mass vs Samsung Galaxy Watch5, male. (d) Change in body mass vs Garmin Forerunner 945, male.
Results
A total of 111 participants were enrolled (56 female, 54 male, and 1 nonbinary person), with an average age of 40 ± 14 years, height of 171.0 ± 8.9 cm, body mass of 70.8 ± 14.7 kg, and VO2max of 46.8 ± 8.7 ml/kg/min. The majority (n = 74) of the participant pool were considered to have either excellent or superior fitness levels based on their VO2max classification according to American College of Sports Medicine (ACSM) cut points. 5 The mean sweat loss for all conditions was 658.57 ml (SD = 54.20 ml, median = 480 ml, minimum = 80 ml, maximum = 3300 ml) and range of percent body mass change was 0.25% to 2.73%. Participants were considered euhydrated postexercise based on ACSM standards (urine specific gravity [USG] <1.020; urine osmolality [UOSM] <700 mOsmol). 13 Detailed descriptive data can be found in Table 1 and Table 2. The chi-square test of independence was not significant (chi-square = 29.18; P = 0.40; Fisher’s exact test P = 0.26, n = 96, df = 28), indicating that fitness level did not impact which distance the participants completed at visit 4. For the overall combined data, error testing for these devices ranged from 25.38% to 33.21% MAPE and linearity testing showed moderate to strong correlation with a CCC range of 0.77 to 0.9.
A total of 293 running trials were completed. The Samsung Galaxy Watch5 and Garmin Forerunner 945 produced sweat loss estimates for 291 trials. Combined descriptives and validity statistics can be found in Table 3, including the results from the paired t test associated with the equivalence test for difference in means, and the mean bias and limits of agreement for Bland-Altman plots. Validity thresholds for linearity were met for both devices (CCC = 0.90 and 0.77 for Samsung Galaxy Watch5 and Garmin Forerunner 945, respectively), but were not met for error (MAPE is 25.38% and 33.21% for Samsung Galaxy Watch5 and Garmin Forerunner 945, respectively) or equivalence testing. Validity statistics stratified by distance can be found in Table 4, environment in Table 5, and stratified by reported gender in Table 6, of which no conditions were found to meet the combined validity thresholds. In addition, data stratified by body mass and fitness category can be found in the Supplemental files. Of these additional analyses, none of the conditions or stratifications met combined validity thresholds for either of the devices. The MANOVA results revealed no significant multivariate main effect of distance (Pillai’s trace = 0.04, F = 1.43, P = 0.18) or environment (Pillai’s trace = 0.02, F = 2.60, P = 0.08). The interaction between distance and environment was also nonsignificant (Pillai’s trace = 0.03, F = 1.01, P = 0.43), indicating that error values for these devices were similar regardless of distance or environment. Additional validity statistics, Bland-Altman, and equivalence plots, stratified by weight (Supplemental Table 1, Supplemental Figures 1-2) and fitness category (Supplemental Table 2, Supplemental Figures 3-4), can be found in the Supplementary files.
Overall validity statistics
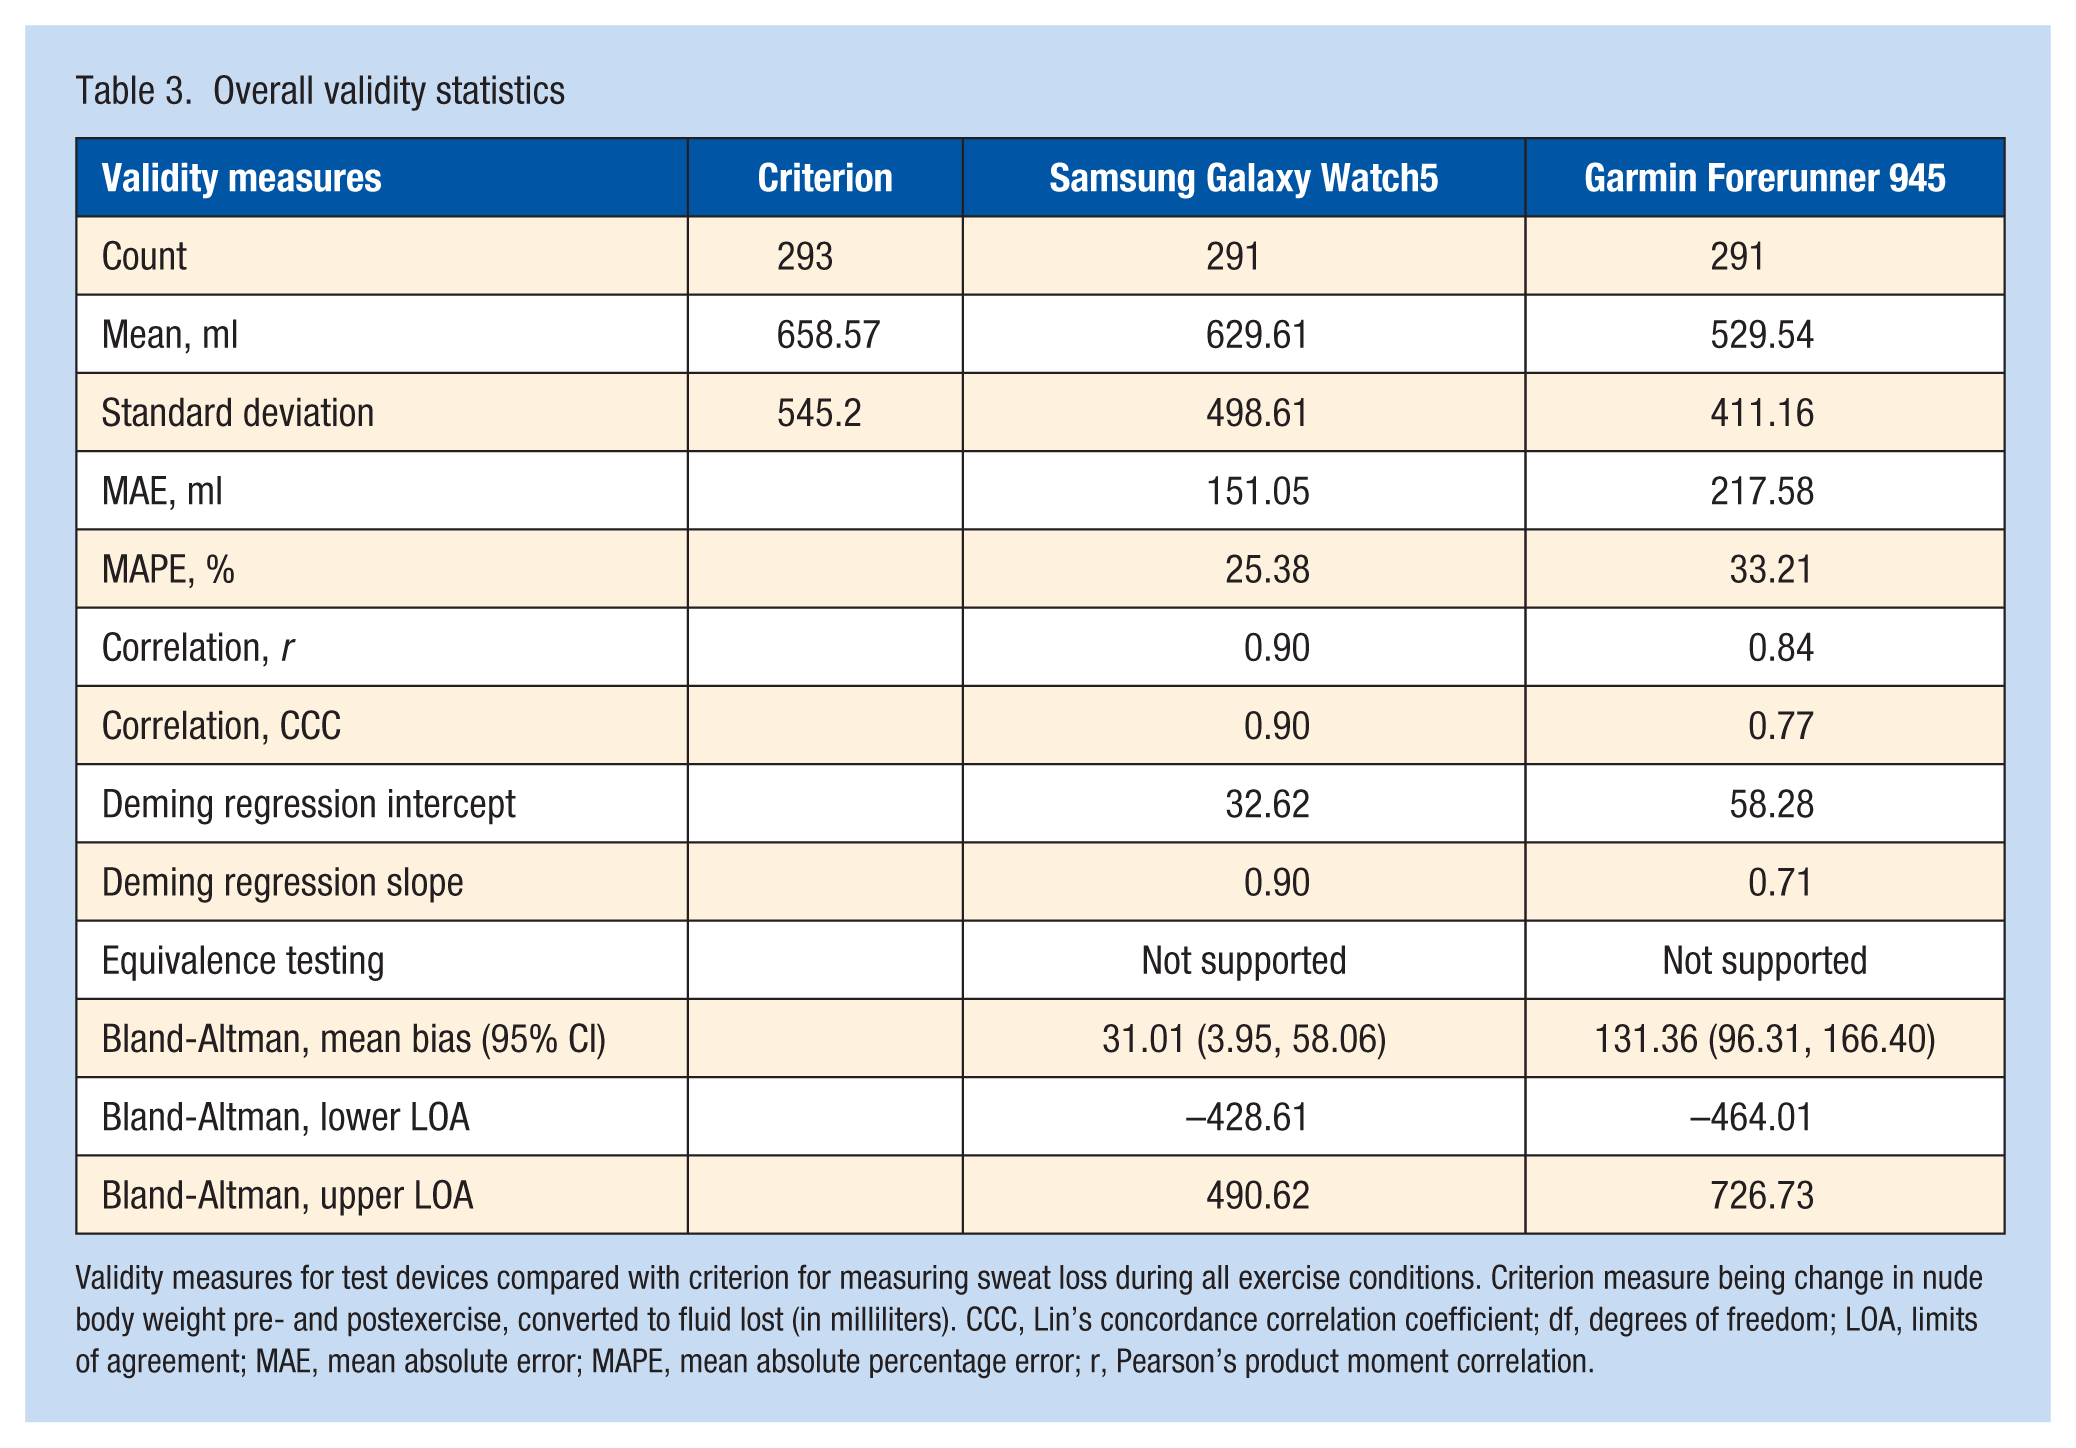
Validity measures for test devices compared with criterion for measuring sweat loss during all exercise conditions. Criterion measure being change in nude body weight pre- and postexercise, converted to fluid lost (in milliliters). CCC, Lin’s concordance correlation coefficient; df, degrees of freedom; LOA, limits of agreement; MAE, mean absolute error; MAPE, mean absolute percentage error; r, Pearson’s product moment correlation.
Validity statistics by distance condition
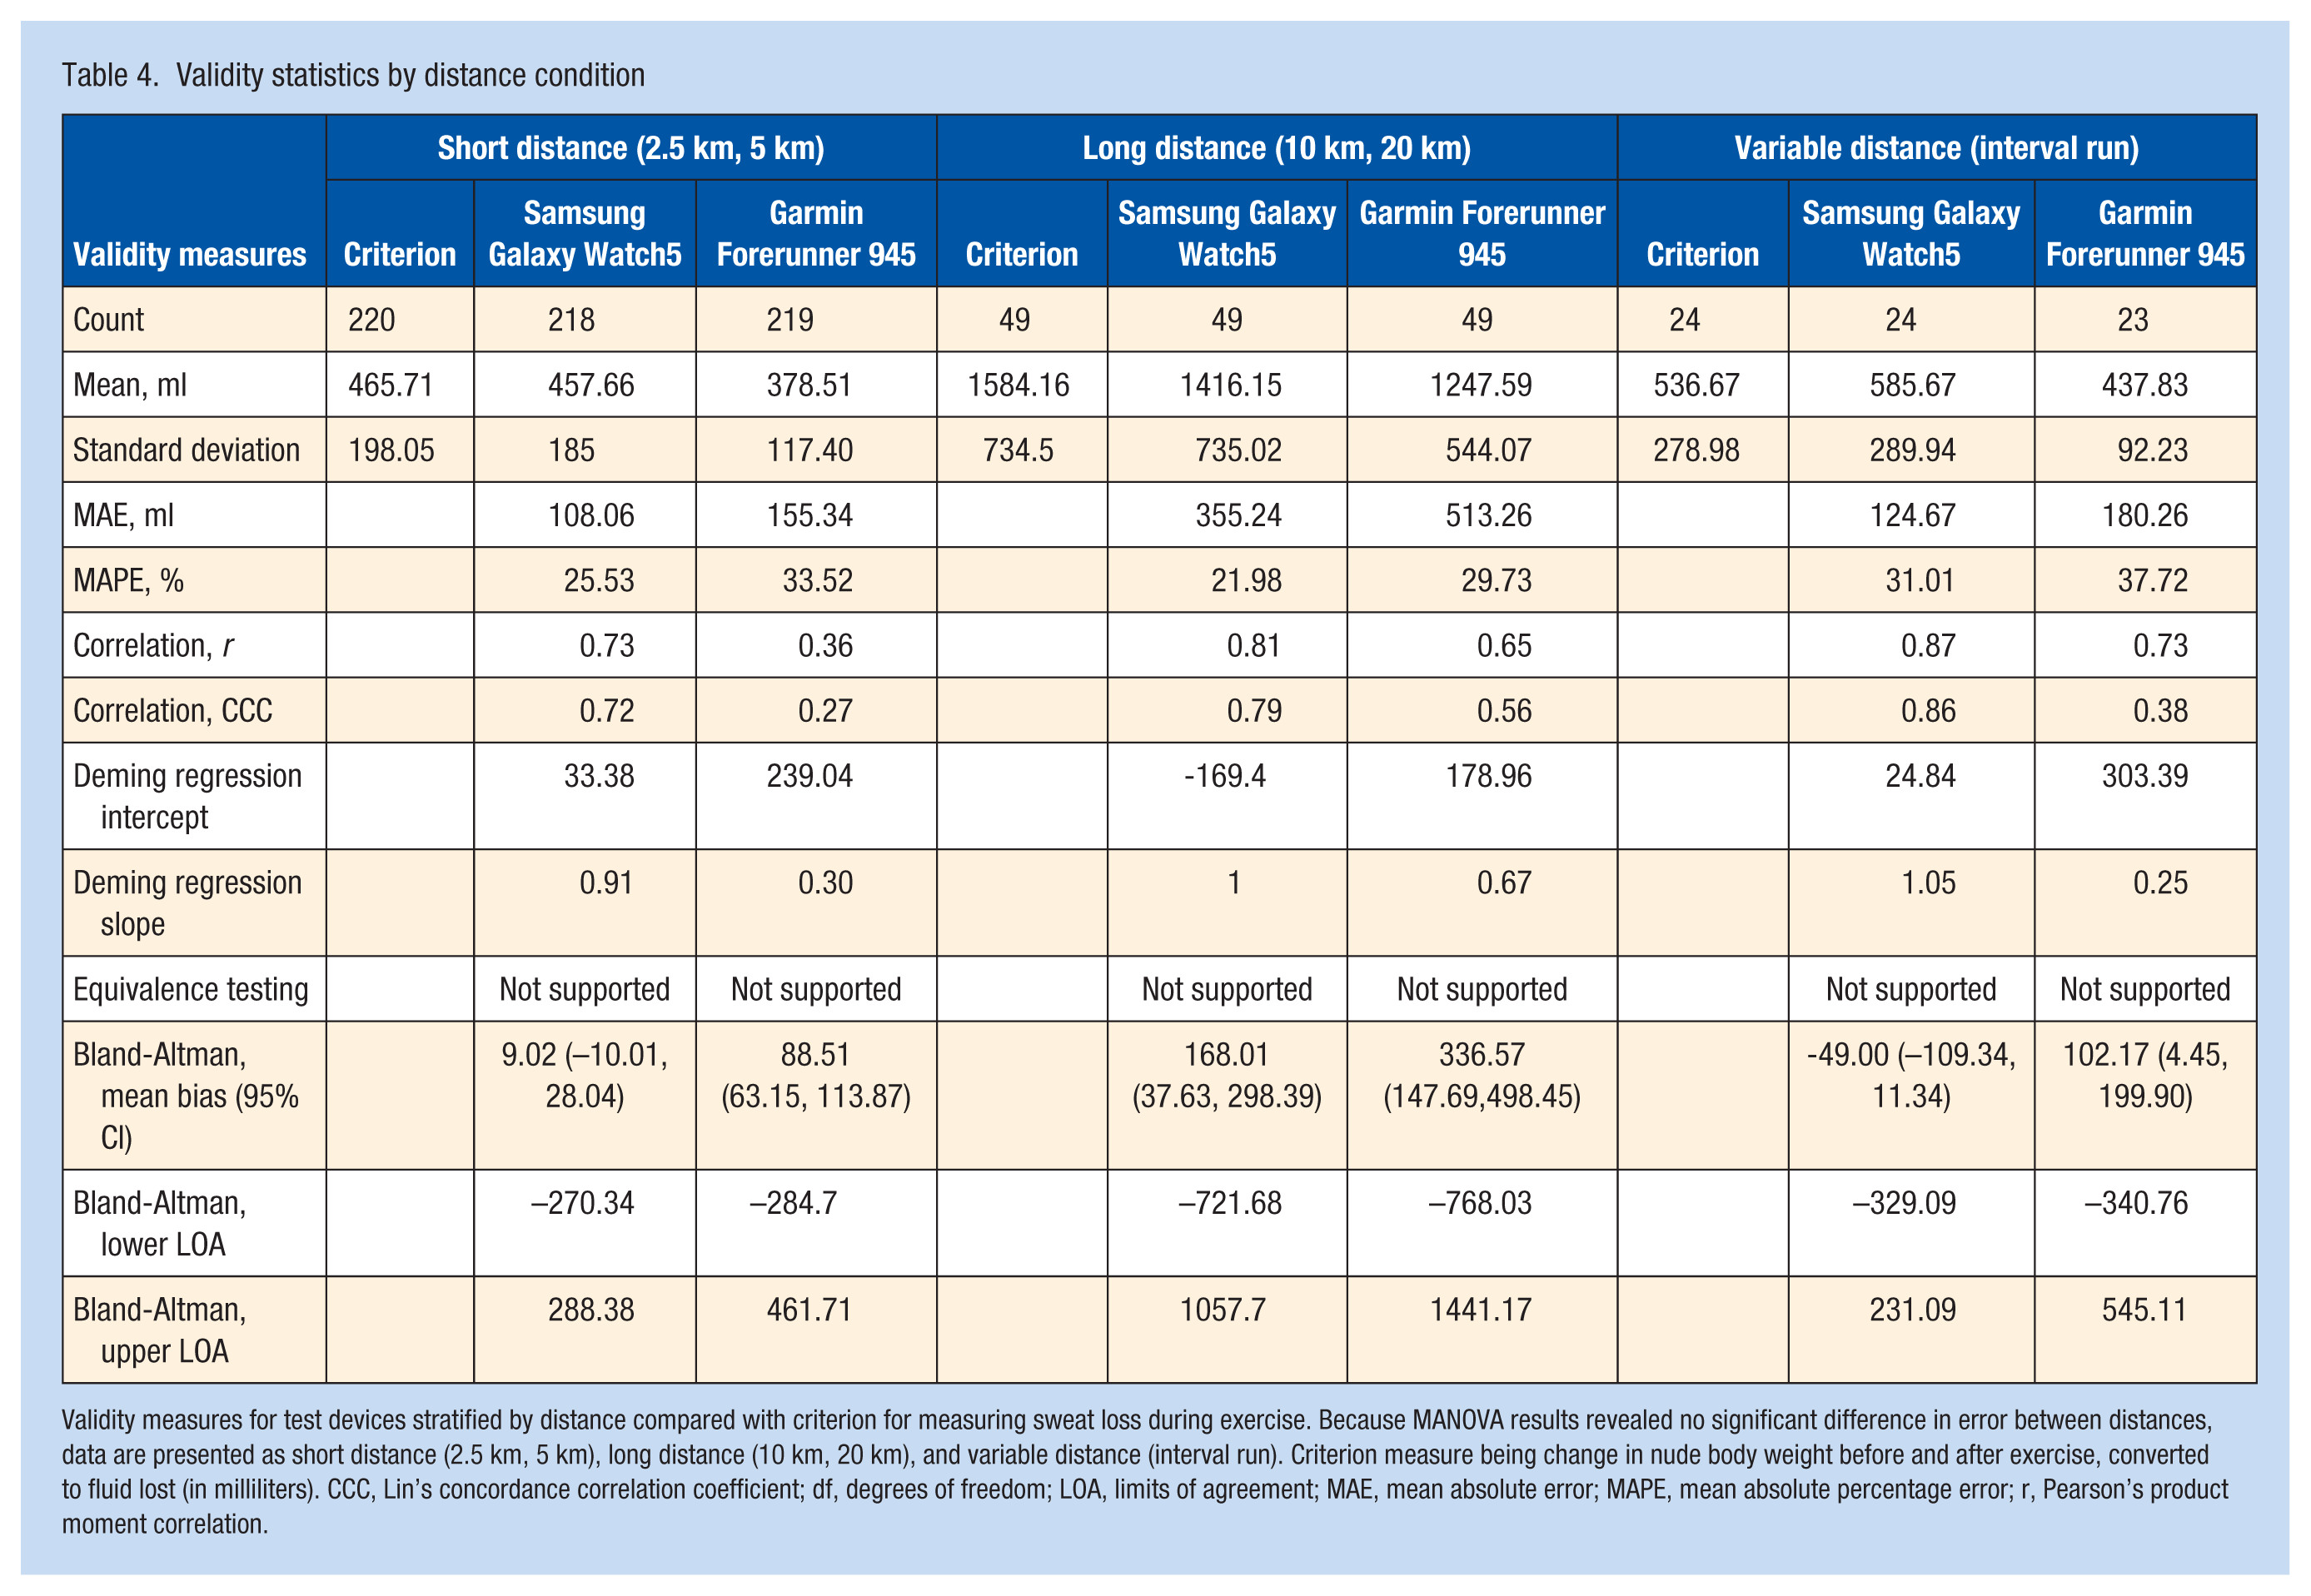
Validity measures for test devices stratified by distance compared with criterion for measuring sweat loss during exercise. Because MANOVA results revealed no significant difference in error between distances, data are presented as short distance (2.5 km, 5 km), long distance (10 km, 20 km), and variable distance (interval run). Criterion measure being change in nude body weight before and after exercise, converted to fluid lost (in milliliters). CCC, Lin’s concordance correlation coefficient; df, degrees of freedom; LOA, limits of agreement; MAE, mean absolute error; MAPE, mean absolute percentage error; r, Pearson’s product moment correlation.
Validity statistics by environment condition
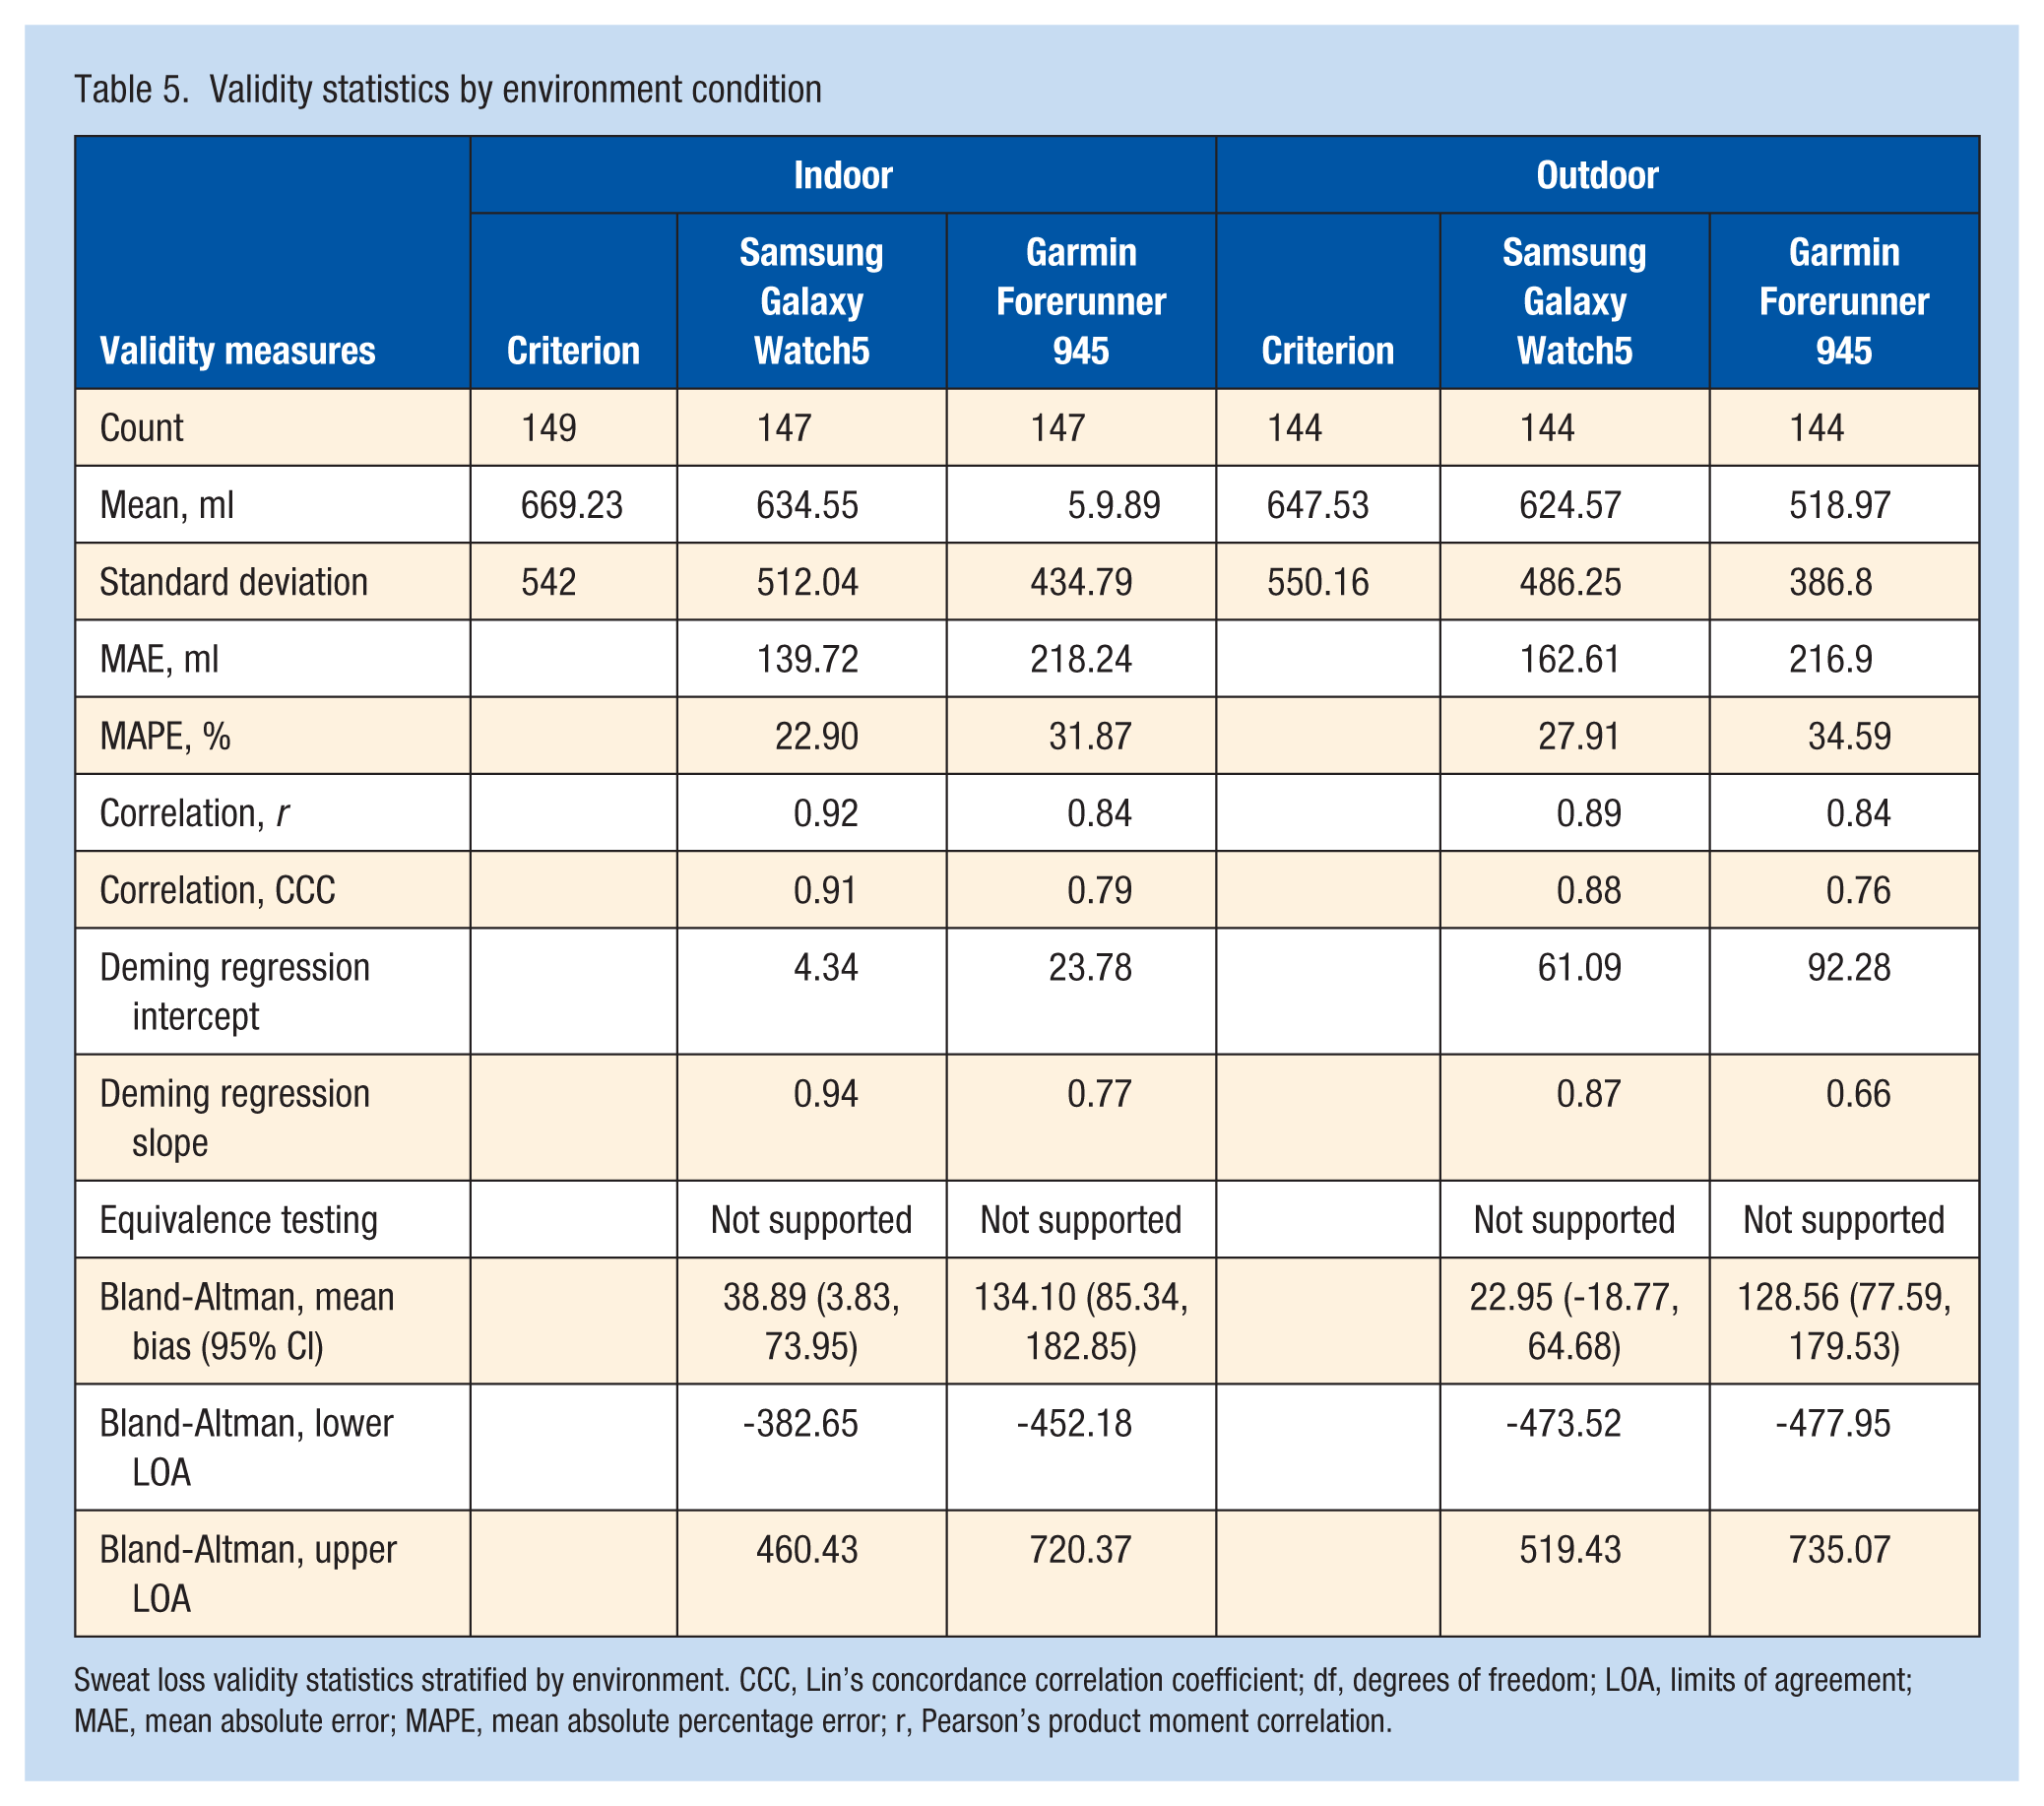
Sweat loss validity statistics stratified by environment. CCC, Lin’s concordance correlation coefficient; df, degrees of freedom; LOA, limits of agreement; MAE, mean absolute error; MAPE, mean absolute percentage error; r, Pearson’s product moment correlation.
Validity statistics by reported sex a
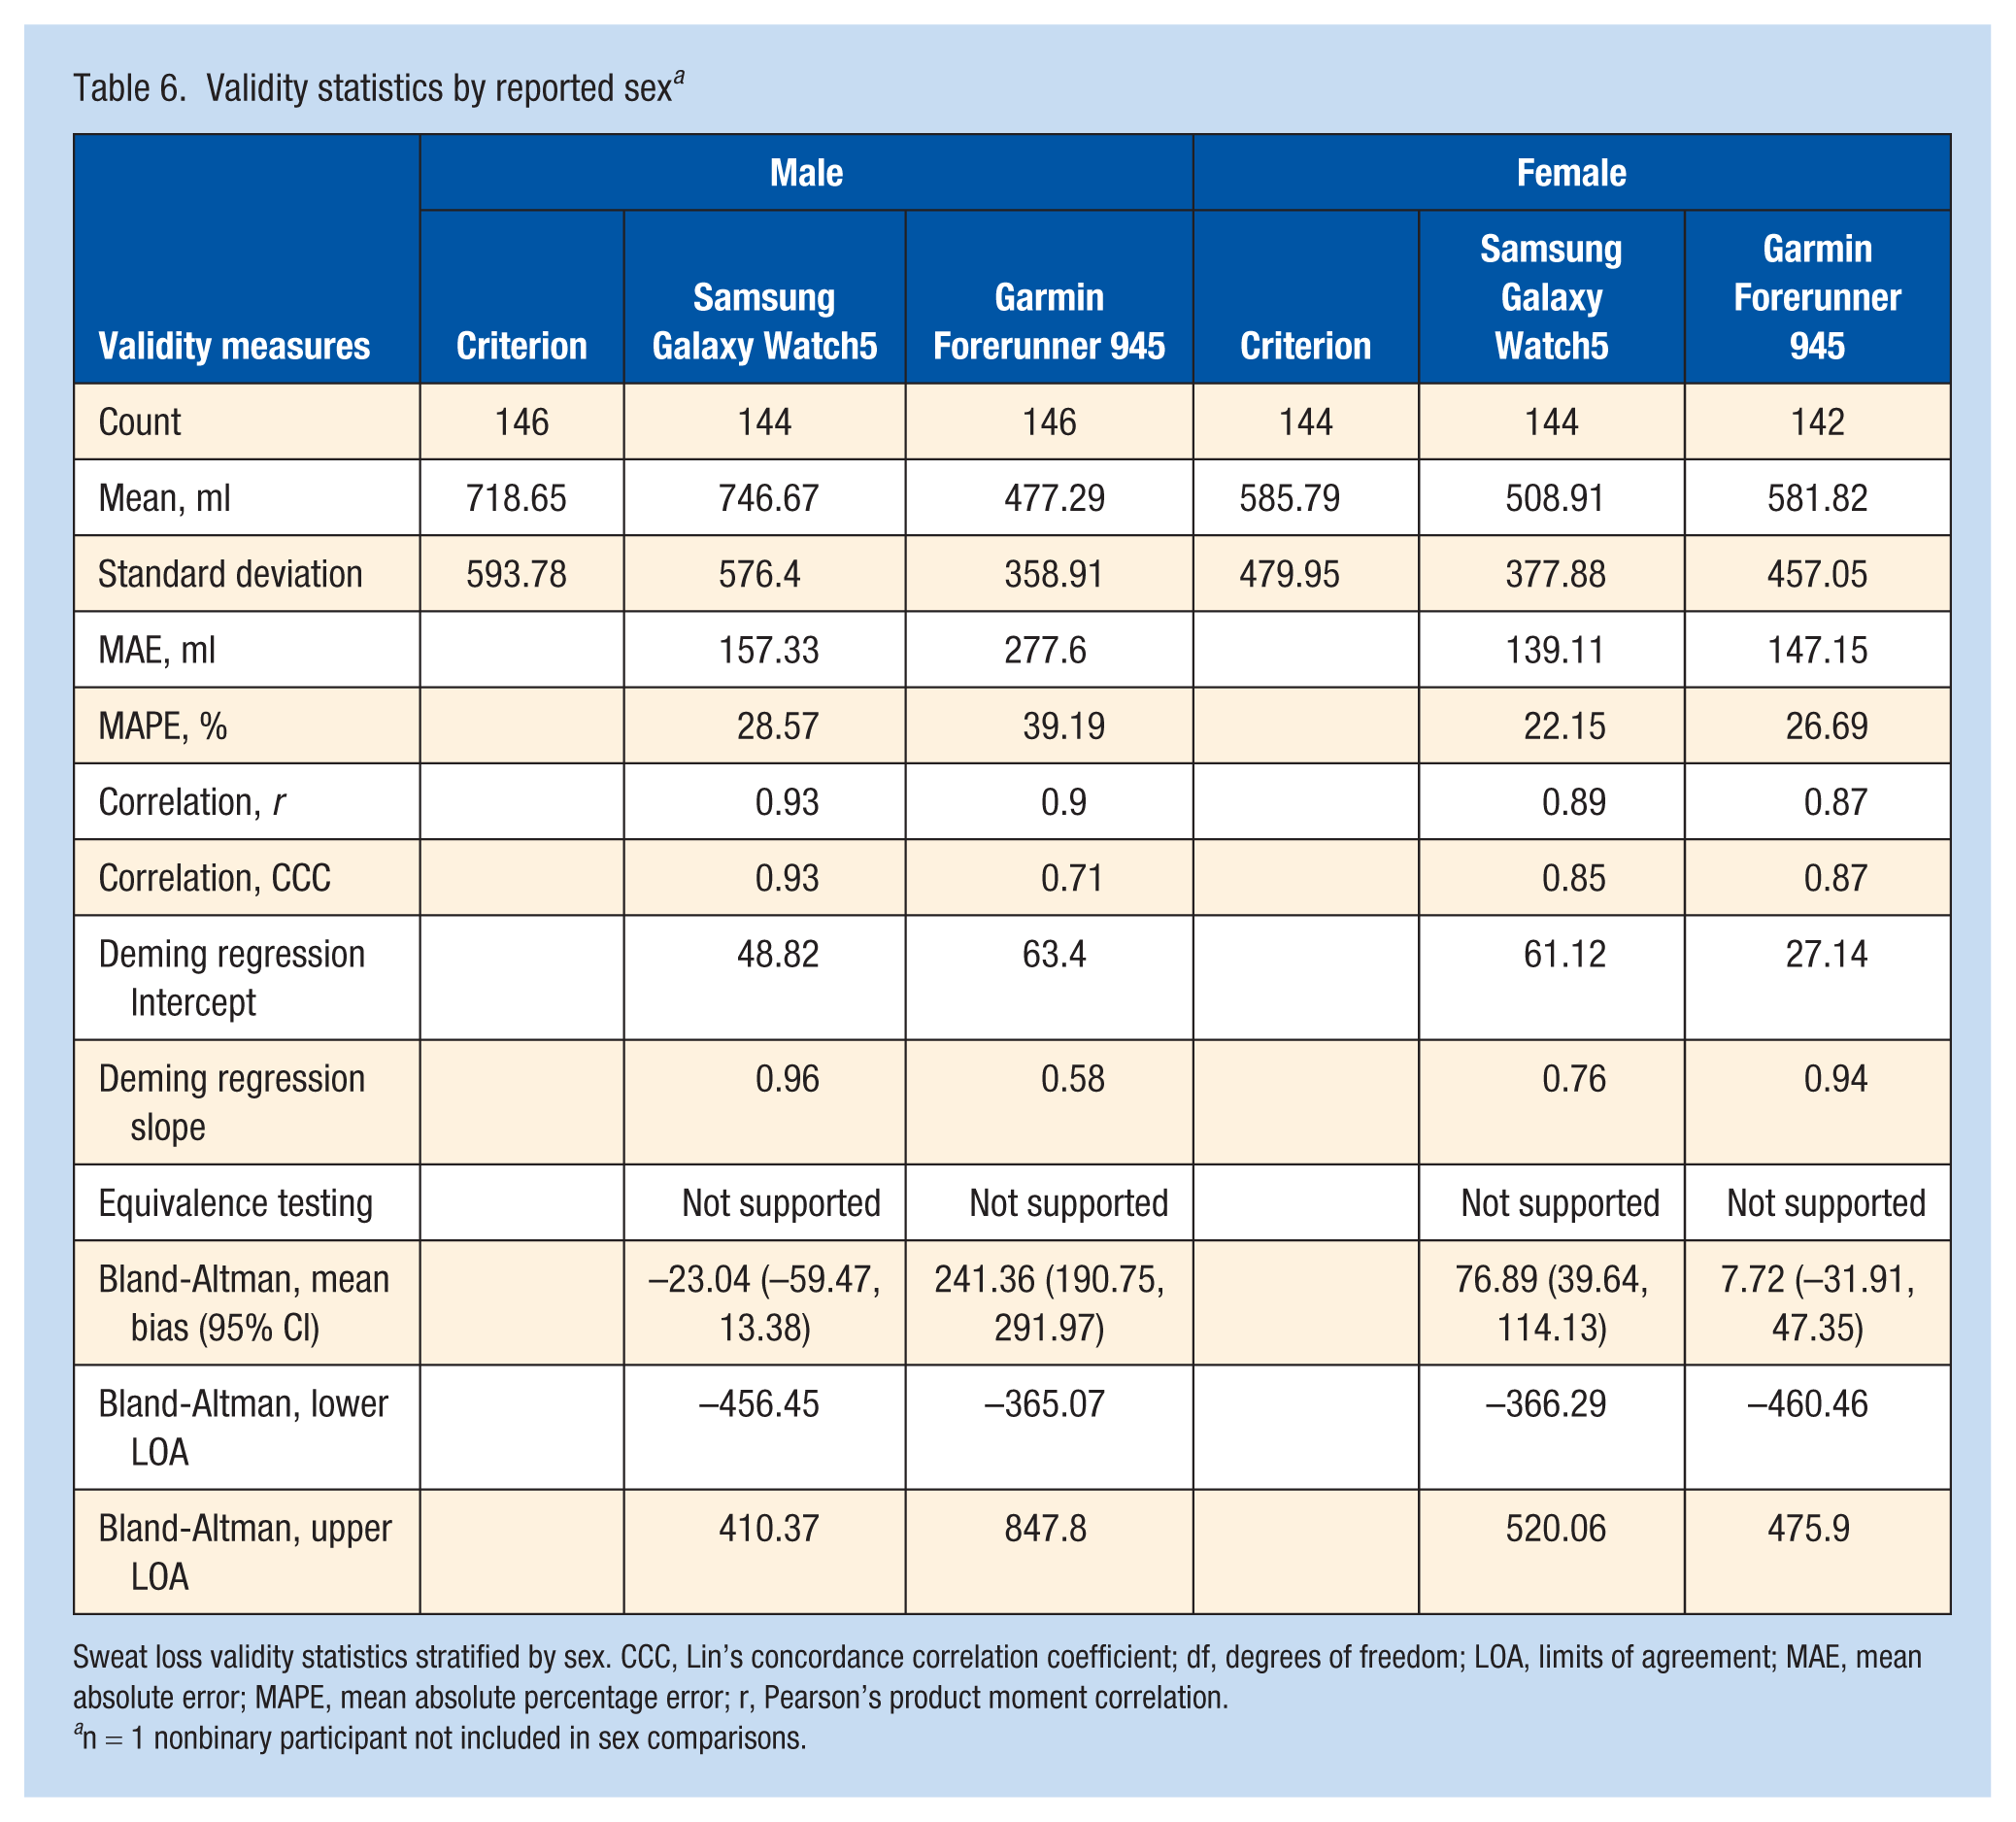
Sweat loss validity statistics stratified by sex. CCC, Lin’s concordance correlation coefficient; df, degrees of freedom; LOA, limits of agreement; MAE, mean absolute error; MAPE, mean absolute percentage error; r, Pearson’s product moment correlation.
n = 1 nonbinary participant not included in sex comparisons.
Discussion
The current study aimed to evaluate the ability of 2 commercially available smartwatches to estimate sweat loss during exercise. The results showed high amounts of error and that neither of the devices tested met the combined validity criteria for linearity, percent error, and equivalence testing when compared with gold standard methods for sweat loss. This indicates that certain output variables from these wearables, such as sweat loss, should be interpreted with caution and do not currently meet validity criteria to be considered accurate replacements for gold standard sweat loss measurement. The discrepancies between wearable device estimates and gold standard measurements, as shown by the validity statistics and Bland-Altman analyses, highlight the current limitations of the devices tested in assessing these variables accurately.
Although correlation values for the overall data were moderate to strong (CCC is 0.90 and 0.77 for Samsung Galaxy Watch5 and Garmin Forerunner 945, respectively), the range for each stratification shows much greater variability in the correlation (CCC is 0.27 to 0.95 for all possible stratifications, including Supplementary Tables) and, combined with error and equivalence testing, did not support validity. The wearable devices demonstrated large errors (MAPE range is 18.08% to 42.78% for all possible stratifications, including Supplementary Tables), which suggests low accuracy for tracking sweat loss during exercise. The devices often underestimated or overestimated sweat loss, contributing to biases across different conditions, as shown in the Bland-Altman plots. However, the linearity assessment shows that each device has an acceptable correlation with the criterion, especially the Samsung Galaxy Watch5. This suggests that these devices may be useful for tracking changes in sweat loss values over time, as opposed to relying on exactly accurate measurement of sweat loss in milliliters, although future longitudinal study designs are needed to substantiate this.
Given the importance of maintaining hydration for both health and performance, and the potential application of these measures by consumers to directly influence hydration strategies, the inability to accurately estimate sweat loss may pose risks for athletes relying solely on these devices for hydration guidance. Specifically, as mentioned above, a loss in body mass >1.5% to 2% has been shown to decreases aerobic exercise performance, and our participants were approaching that value during their 10 km trials (indoor: 1.37%; outdoor: 1.43%) and exceeded it during the 20 km run trials (indoor: 2.59%; outdoor: 2.73%). With the lack of validity present in these devices, those who seek to utilize this technology to monitor sweat loss in milliliters, or to determine when they have reached 1.5% to 2% loss in body mass, should do so cautiously. Since the devices can both over- and underestimate sweat loss by a sizeable margin, using these values for fluid replacement recommendations could lead to over- or underhydrated conditions during or after exercise.
For validity threshold testing in the current investigation, we decided to use the relatively liberal thresholds of MAPE < 10%, CCC > 0.7, and equivalence supported at a 10% (±5%) window of the mean. While widely acceptable thresholds for validity have not been established,7,8 MAPE thresholds of 5% or 10% have been set routinely for assessing validity of physiological monitoring using wearable technologies, such as the evaluation of heartrate and physical activity monitoring. 21 However, researchers and users should evaluate the error values presented here in context of their own requirements, such as general consumer/recreational use, or for more stringent medical monitoring. Further evaluation of these data, and future validation studies on sweat loss in wearable technologies, could ideally lead to established and accepted tiered thresholds based on use-case (i.e., recreational, collegiate/professional athletics, military/tactical athletes, research, etc), which could have a significant impact on guiding ideal levels of accuracy and scrutiny these devices need.
It is generally expected that 1-time use sweat patch sensors that utilize direct sweat measurement will perform better than the indirect sweat loss algorithms used currently by smartwatch technology. However, previous research into sweat patches have also shown mixed results for validity on hydration measures,16,17 although more stringent validation studies with additional analyses are necessary. Current data suggest that sweat patches have MAPE values of approximately 8% to 14% for calculating sweat loss,2,17 which is considerably lower than the 21.98% to 39.19% (for all stratifications) discovered in the current investigation for smartwatches. Direct measurement sweat sensors work via several potential techniques, such as microfluidic channels (capture sweat fluid on skin), electrochemical sensors (detect chemical concentration of sweat), BIA (assess hydration by flow of electric current through the body), and/or optical assays (photo detection of sweat biomarkers) to collect and analyze sweat in real time.3,9,17,29 However, as these techniques are (at this time) a high-cost, single-use technology, this limitation represents a barrier to continued use and adoption by consumers. As technology advances, direct measurement sensors could potentially be integrated into smartwatch devices. Combined with current algorithms and the extensive data already collected by these devices, this integration may address a key barrier by enhancing the accuracy of reusable sensors.
The data in the current study suggest that MAPE for each device remained similar across different distances and environments, even for longer distances (10 km and 20 km) with higher values of sweat loss, and for trials with variable distances between participants (interval run). Therefore, the amount of error in sweat loss prediction appears to be consistent regardless of the condition. However, it is important to note that, for the current study, our sweat loss data ranges from 480 ml to 3300 ml, average percent body mass changes from 0.25% to 2.73%, and only up to 20 km distances. In addition, participants on average were still considered euhydrated after exercise based on postexercise urine collection. Thus, our validity comparisons can be confident only for this range of data, and may not represent accuracy outside of this range, such as for extreme long-distance events where sweat loss may exceed 3300 ml and 2.7% body mass loss, or during light activity where sweat loss does not reach 480 ml. Similarly, there were no major differences in error observed for variances of age, weight, fitness level, or sex of participants; however, female participants tended to have less error (26.69%) compared with male participants (39.19%) when using the Garmin Forerunner 945. The supplemental data also demonstrated that age, weight, and fitness level did not influence error of these devices.
Limitations
As mentioned above, devices such as those tested in this study rely on algorithms that indirectly infer sweat loss based on presumed metrics such as heartrate, pace, weight, etc, which can introduce variability depending on individual differences, environmental conditions, and the specific exercise performed. These algorithms are subject to ongoing evolution by the developers and are rarely made public. Thus, the error rates of these devices likely fluctuate, making it challenging to obtain consistent accuracy measurements over time. Algorithm updates can significantly alter results compared with previous reports or earlier device models and software versions, introducing additional uncertainty. Our investigation kept the devices and software version constant to address this concern; however, regular testing and independent evaluation is important for the ever-evolving hardware and sensor changes, and software and algorithm updates in these devices.
From a methodological standpoint, we were not able to completely randomize participants into different distances for visit 4, as participants who were not able to complete the longer distance runs due to lack of training, personal preference, etc, were excluded from participating in those distance conditions, potentially creating bias in sweat loss metrics for fitness levels across the varying distances. However, the chi-square test of independence was found to not be statistically significant, suggesting that fitness level did not have a role in which distance the participants completed. In addition, although we present validity statistics stratified by environment, other environmental conditions, such as temperature and humidity, were not included in the analysis. However, all devices were validated simultaneously against the criterion measure in the same trial; thus, we do not believe this variability impacted agreement outcomes. Future research should further explore how additional environmental conditions may influence device performance in more ecologically diverse settings. An additional limitation is that wrist placement of the smartwatches during the trials was standardized, rather than randomized. Whereas it is possible that local differences in sweat rate related to hand dominance or vascular distribution could influence measurements, it is important to note that these devices estimate sweat loss indirectly and are therefore less likely to be influenced by localized sweat patterns. Nonetheless, future research should consider evaluating multiple or randomized wear locations to more fully characterize potential differences in device accuracy based on anatomical placement. Finally, Samsung reports that sweat loss can be estimated only when the sweat loss is ≥100 ml. 24 For this investigation, we only had 1 trial that had <100 ml of sweat loss (80 ml), based on criterion values, and all other trials were above this manufacturer threshold.
In conclusion, while wearable technology holds great promise for providing convenient and accessible continuous health and performance monitoring, sweat loss variables should be interpreted with caution until further analyses show that the devices and algorithms have greater levels of accuracy. We recommend that practitioners, coaches, athletes, researchers, and others continue to rely on more traditional laboratory or field methods, such as change in bodyweight for sweat loss when required. Although MAPE values indicated high error rates for both wearable devices, correlations showed an acceptable relationship with nude body mass change, suggesting potential utility in tracking sweat loss over time. However, future longitudinal studies are necessary to confirm these findings.
Supplemental Material
sj-docx-1-sph-10.1177_19417381251388642 – Supplemental material for Evaluation of Exertional Sweat Loss Estimates in Wearable Technology
Supplemental material, sj-docx-1-sph-10.1177_19417381251388642 for Evaluation of Exertional Sweat Loss Estimates in Wearable Technology by Bryson Carrier, Amanda C. Melvin, Jacob R. Outwin, Marni G. Wasserman, Adam P. Audet, Katherine C. Soldes, Kenneth M. Kozloff and Adam S. Lepley in Sports Health
Supplemental Material
sj-png-2-sph-10.1177_19417381251388642 – Supplemental material for Evaluation of Exertional Sweat Loss Estimates in Wearable Technology
Supplemental material, sj-png-2-sph-10.1177_19417381251388642 for Evaluation of Exertional Sweat Loss Estimates in Wearable Technology by Bryson Carrier, Amanda C. Melvin, Jacob R. Outwin, Marni G. Wasserman, Adam P. Audet, Katherine C. Soldes, Kenneth M. Kozloff and Adam S. Lepley in Sports Health
Supplemental Material
sj-png-3-sph-10.1177_19417381251388642 – Supplemental material for Evaluation of Exertional Sweat Loss Estimates in Wearable Technology
Supplemental material, sj-png-3-sph-10.1177_19417381251388642 for Evaluation of Exertional Sweat Loss Estimates in Wearable Technology by Bryson Carrier, Amanda C. Melvin, Jacob R. Outwin, Marni G. Wasserman, Adam P. Audet, Katherine C. Soldes, Kenneth M. Kozloff and Adam S. Lepley in Sports Health
Supplemental Material
sj-png-4-sph-10.1177_19417381251388642 – Supplemental material for Evaluation of Exertional Sweat Loss Estimates in Wearable Technology
Supplemental material, sj-png-4-sph-10.1177_19417381251388642 for Evaluation of Exertional Sweat Loss Estimates in Wearable Technology by Bryson Carrier, Amanda C. Melvin, Jacob R. Outwin, Marni G. Wasserman, Adam P. Audet, Katherine C. Soldes, Kenneth M. Kozloff and Adam S. Lepley in Sports Health
Supplemental Material
sj-png-5-sph-10.1177_19417381251388642 – Supplemental material for Evaluation of Exertional Sweat Loss Estimates in Wearable Technology
Supplemental material, sj-png-5-sph-10.1177_19417381251388642 for Evaluation of Exertional Sweat Loss Estimates in Wearable Technology by Bryson Carrier, Amanda C. Melvin, Jacob R. Outwin, Marni G. Wasserman, Adam P. Audet, Katherine C. Soldes, Kenneth M. Kozloff and Adam S. Lepley in Sports Health
Footnotes
Correction (June 2026):
In Table 5, the MAPE (%) values for the Samsung Galaxy Watch5 and Garmin Forerunner 945 were inadvertently switched. This error has now been corrected.
The authors report no potential conflicts of interest in the development and publication of this article.
References
Supplementary Material
Please find the following supplemental material available below.
For Open Access articles published under a Creative Commons License, all supplemental material carries the same license as the article it is associated with.
For non-Open Access articles published, all supplemental material carries a non-exclusive license, and permission requests for re-use of supplemental material or any part of supplemental material shall be sent directly to the copyright owner as specified in the copyright notice associated with the article.