
Abstract
This teaching case explores MetroCare Health System’s innovative use of artificial intelligence (AI) to improve risk stratification for patients with type 2 diabetes (T2D). Facing substantial operational and financial pressures due to rising chronic disease management costs, MetroCare sought to enhance its traditional risk models, which relied solely on structured clinical data and often misclassified intermediate-risk patients. Leveraging natural language processing (NLP) and machine learning, MetroCare integrated previously untapped social and behavioral determinants from clinicians’ unstructured electronic health record notes into a new predictive model. This AI-driven approach significantly improved accuracy (AUC increased from 0.834 to 0.860), reduced unnecessary clinical interventions by approximately 30%, and generated estimated annual cost savings of about $1.7 million per 1000 patients. The case highlights critical implementation considerations, including threshold tuning to balance intervention precision against potential missed risks, workflow integration challenges, clinician acceptance, and ethical issues surrounding patient privacy and fairness. It illustrates the strategic alignment of innovative IT solutions with organizational goals, offering graduate and executive learners a realistic context to discuss how emerging technologies can transform healthcare operations. Ultimately, students are tasked with determining how best to operationalize this data-driven solution to improve clinical outcomes, optimize resource allocation, and advance MetroCare’s mission in a competitive, value-based healthcare environment.
Keywords
Introduction
Efficient management of chronic diseases represents one of the most pressing operational and financial challenges in contemporary healthcare. Among chronic conditions, type 2 diabetes (T2D) is particularly prevalent, affecting over 38 million Americans, with healthcare costs per patient approximately 2.6 times higher than those without diabetes (International Diabetes Federation, 2025; Parker et al., 2024). Globally, over 540 million individuals are living with diabetes, making it a significant public health issue requiring innovative strategies for effective resource management and patient care (International Diabetes Federation, 2025).
One of the most severe complications associated with T2D is the increased risk of adverse cardiovascular events (ACVEs), including myocardial infarction, stroke, and heart failure. Approximately 50% of diabetes-related deaths are due to cardiovascular disease, underscoring the urgency for improved risk prediction and management (Einarson et al., 2018). In healthcare operations, identifying which patients are most at risk and ensuring timely intervention is critical. This concept, known as risk stratification, allows healthcare providers to allocate resources more efficiently by focusing interventions on patients most likely to benefit, thus avoiding unnecessary treatments for lower-risk individuals (Kraus et al., 2024).
Despite its theoretical promise, traditional risk stratification models relying solely on structured medical data, such as laboratory results (e.g., HbA1c levels), vital signs (e.g., blood pressure and BMI), and historical healthcare utilization, frequently fall short. These models typically classify patients into three categories: low, intermediate, and high risk. While low- and high-risk classifications are often clear, the intermediate-risk group represents a “gray zone” where decisions about intervention are ambiguous. Misclassifications within this group can lead either to overtreatment—wasting valuable resources—or undertreatment—leading to preventable complications (McCarthy et al., 2019). Thus, healthcare administrators and clinicians alike urgently seek more accurate and context-rich methods for patient stratification.
Recent advances in artificial intelligence (AI), particularly natural language processing (NLP) and machine learning (ML), offer new opportunities to address these limitations. By leveraging previously underutilized unstructured data embedded in electronic health records (EHRs)—including clinician notes describing social, behavioral, and environmental factors—healthcare organizations can potentially achieve a deeper understanding of patients’ true health risks and improve operational efficiency. These text-based insights can reveal factors such as economic instability, social isolation, poor diet, inadequate physical activity, and chronic stress—elements that structured clinical data alone often fail to capture but significantly influence patient outcomes (Guerrero-Ramos et al., 2022).
Background and contextual details
To fully understand the implications of adopting advanced risk stratification techniques in healthcare, it is critical to first examine the broader operational and theoretical landscape that underpins this strategic innovation.
The Healthcare Iron Triangle is a well-established framework for conceptualizing trade-offs in healthcare management, describing tensions among three core dimensions: cost, quality, and access (Kissick, 1994). Healthcare organizations frequently find themselves in scenarios where improving one dimension, such as enhancing care quality, seemingly necessitates sacrifices in another, such as increased costs or reduced patient access. These inherent tensions create complex operational dilemmas, making resource allocation especially challenging.
Historically, managing chronic conditions like T2D has epitomized these Iron Triangle tensions. High-quality chronic care—such as personalized patient management programs and intensive preventive interventions—is typically resource-intensive, raising organizational costs significantly. Conversely, managing resources aggressively to control costs can lead to underserving patients, potentially reducing clinical outcomes and patient satisfaction (KC et al., 2019). Balancing these tensions requires accurate patient classification to identify precisely who requires intervention and who can be safely managed with less intensive care (Kraus et al., 2024).
A significant limitation of traditional medical-centric risk stratification approaches is their narrow scope. These models focus predominantly on clinical biomarkers, like hemoglobin A1c (a measure of average blood glucose levels), blood pressure, and cholesterol levels, as well as historical utilization metrics such as outpatient and emergency visits. While these clinical indicators are undeniably essential, they fail to capture critical context about a patient’s broader life circumstances—context that can profoundly affect disease progression and patient outcomes (McCarthy et al., 2019).
Indeed, social and behavioral determinants of health (SBDH) have gained increasing recognition as key drivers of patient outcomes, influencing not only disease progression but also healthcare utilization patterns (Powell-Wiley et al., 2022). Two theoretical models are particularly relevant here. • Social-Ecological Model (SEM): This model posits that health outcomes are influenced by multiple layers of context, including individual, interpersonal, organizational, community, and policy-level factors. SEM emphasizes that external structural conditions, such as economic stability, community resources, and social support, significantly impact a patient’s capacity to manage chronic conditions effectively (McLeroy et al., 1988). • Self-Regulation Theory (SRT): This theory complements SEM by focusing on individual behaviors, attitudes, and psychological processes. SRT describes how individuals set health-related goals, monitor their status, and adapt behaviors accordingly, emphasizing the critical role of individual-level behaviors such as diet, exercise, stress management, and adherence to medication (Bandura, 1991; Carver and Scheier, 1982).
Integrating these theoretical perspectives, contemporary healthcare researchers argue for a more holistic approach that combines traditional medical data with comprehensive social and behavioral determinants to enhance patient stratification accuracy. Advanced machine learning techniques have enabled healthcare organizations to systematically extract these previously unstructured insights from clinical narratives using NLP methods. This capability represents a significant innovation, potentially providing organizations with a robust tool to refine patient classification, better allocate resources, and ultimately achieve simultaneous improvements across the Iron Triangle dimensions of cost, quality, and access (KC et al., 2019).
Despite these promising developments, operationalizing such a strategy presents substantial implementation challenges. For healthcare organizations, utilizing unstructured data involves not only complex technological considerations, such as integrating AI algorithms into existing EHR systems, but also navigating critical organizational issues. These issues include securing clinician trust and buy-in, addressing ethical concerns related to fairness and patient privacy, and managing change effectively to ensure adoption and successful integration into clinical workflows (KC et al., 2019).
Furthermore, healthcare organizations operate in highly regulated environments. Thus, the use of AI tools and unstructured patient data must comply rigorously with regulatory standards such as the Health Insurance Portability and Accountability Act (HIPAA), potentially involving additional oversight mechanisms, data governance strategies, and transparency measures (Centers for Medicare & Medicaid Services, 2022).
In summary, accurately identifying which patients genuinely require intensive intervention and which can safely avoid overtreatment is a critical healthcare objective. Doing so effectively demands an integrated risk stratification approach that leverages both traditional clinical and innovative social-behavioral data sources, balanced against real-world constraints and complexities inherent in healthcare operations. The following case introduces MetroCare Health System as it strategically navigates these issues, offering readers an opportunity to explore the practical, strategic, and ethical challenges at the intersection of healthcare management, AI innovation, and organizational decision-making.
Case description
It was a crisp fall morning in 2024 at MetroCare Health System’s headquarters in Kansas City, Kansas. In the boardroom, a tense meeting was underway. The Chief Medical Officer, Dr Andrea Martinez, had just presented data on MetroCare’s diabetes care outcomes, and the news was sobering. MetroCare was spending nearly $20,000 per diabetic patient each year on average, reflecting national trends of high diabetes costs. With over 50,000 patients with T2D across MetroCare’s hospitals and clinics, the financial burden was immense. The Chief Financial Officer, James Hunt, shifted uneasily. “At this rate, our chronic care programs are becoming unsustainable,” he warned.
Beyond costs, patient outcomes were also at stake. Cardiovascular complications accounted for roughly half of deaths among T2D patients, so preventing these ACVEs—heart attacks, strokes, and heart failure—was a top clinical priority. MetroCare had invested in a chronic care management program to monitor high-risk diabetes patients more closely. However, the program had limited capacity, and deciding who qualified as “high risk” was proving challenging. Emma Davis, the Population Health Manager, voiced her frustration: “Our current risk stratification tools flag the obvious cases—the very sick and the very healthy—but what about those in between? We either over-treat people who might be fine or miss those quietly headed for trouble.” Her observation summed up MetroCare’s dilemma: the intermediate-risk patients were slipping through the cracks of their risk models.
Dr Martinez nodded in agreement. MetroCare’s traditional risk stratification model relied on structured medical data—lab results, vital signs, and diagnoses—recorded during clinic visits. Patients were stratified into low, moderate, or high risk for complications. The extremes were easy: a young patient with mild disease stayed low risk, while an older patient with multiple complications was clearly high risk. The “moderate” group, however, was a gray zone. These patients might have some warning signs (elevated blood sugar and a bit of hypertension) but not enough to definitively trigger intensive intervention. “The transition from low to intermediate risk is the toughest to pinpoint,” Dr Martinez explained, pulling up a chart of recent cases. “Misclassify someone as higher risk than they are, and we enroll them in costly programs they don’t need. Miss a truly at-risk patient, and they could wind up in the ER with a heart attack we might have prevented.”
Everyone in the room understood the operational inefficiencies at hand. False alarms—false positives—meant MetroCare’s care managers spent time on patients who didn’t actually need aggressive intervention, consuming slots in diabetes education classes and specialist clinics. On the other hand, missed risks—false negatives—could result in preventable emergencies and hospitalizations. Dr Martinez reminded the team of healthcare’s “Iron Triangle”—the balance of cost, quality, and access. Every unnecessary intervention wasted resources and budget (harming cost efficiency), and every missed high-risk patient was a hit to care quality. Meanwhile, misallocated resources meant someone else waited longer for care, hurting access. MetroCare’s leadership was effectively juggling trade-offs among all three dimensions. CFO James Hunt chimed in, “Left unchecked, these inefficiencies cascade through our system—higher costs, strained staff, and subpar outcomes. We need to break this cycle.”
To tackle this problem, MetroCare’s leaders needed to re-examine their risk stratification approach. MetroCare Health System (a pseudonym for an anonymized major academic medical center) had a robust data infrastructure and a history of innovation. Serving a diverse population in urban and suburban areas, MetroCare’s network included several large hospitals and dozens of outpatient clinics. The diabetes care team had long used a risk scoring model embedded in the EHR to guide interventions. This model, like those at many U.S. hospitals, was built on biomedical data: patient demographics, lab results (e.g., HbA1c levels), vital signs (blood pressure and BMI), medication usage, and visit frequency. These factors provided a snapshot of a patient’s health status. Based on these inputs, patients were categorized as low, intermediate, or high risk for an adverse event in the next year.
In practice, the model performed well at the extremes. Truly low-risk patients (often younger, recently diagnosed, with well-controlled blood sugar) were correctly left on routine care. High-risk patients (long-standing diabetes with complications and very poor lab results) were appropriately flagged for intensive management—such as enrollment in MetroCare’s Diabetes Care Management Program or referral to endocrinologists and cardiologists. The intermediate group, typically representing about 25%–30% of the T2D population, was another story. These patients had some risk indicators but not enough to trigger automatic inclusion in intensive programs. “It’s a murky middle,” Emma Davis explained to new staff. “For these folks, the decision to intervene is not black-and-white. We often err on the side of caution and intervene, but we’ve found many don’t actually deteriorate—we jumped the gun. Other times, we wait and watch, and that patient ends up in the ICU. Hindsight is 20/20, but our current system doesn’t give us clarity prospectively.”
MetroCare’s leadership realized that misclassification in this intermediate-risk segment was a critical operations problem. An internal audit revealed that in the past year, hundreds of moderate-risk patients had been preemptively enrolled in the intensive management program, yet a large fraction of them remained stable without major incidents. Each unnecessary enrollment used valuable nurse care manager hours, clinic slots, and patient effort—resources that could have been conserved or redirected. Conversely, a subset of patients left in standard care later experienced acute events that the team hadn’t anticipated. “Those are the ones that keep me up at night,” Dr Martinez admitted. “The signs were subtle, or maybe buried in a note somewhere, but we missed them until it was too late.”
Resource constraints made the stakes even higher. MetroCare’s Diabetes Care Management Program could only handle a limited number of high-risk patients at a time—roughly 10% of the total T2D population—given its staffing and budget. At any given moment, intensive interventions (like personalized nurse coaching, dietician consultations, and frequent follow-ups) could only be provided to a small fraction of patients. “It’s like we have a finite number of ‘golden tickets’ for extra care,” James Hunt quipped, “so we better give them to the right people.” Determining the threshold for who gets a “golden ticket” was the crux of the problem. Historically, MetroCare had used a fixed risk score cutoff (based on the EHR model’s probability output) to decide high-risk status. But where to set that bar was debated endlessly—set it too low and you overwhelm the program with false alarms; set it too high and you might miss early intervention opportunities.
By 2024, with value-based care contracts putting pressure on outcomes per dollar spent, MetroCare’s executives set a new strategic goal: improve risk stratification to optimize interventions. They wanted to simultaneously reduce unnecessary costs, prevent avoidable complications, and increase the number of patients getting appropriate care—in other words, to push the boundaries of the Iron Triangle and achieve gains in cost, quality, and access all at once. Achieving this would require better predictive accuracy for those borderline patients and smarter decision rules about when to intervene.
The push for an AI-enhanced solution
It was against this backdrop that Dr Kiran Shah, MetroCare’s Chief Data & Analytics Officer, proposed a bold idea: use the untapped treasure trove of unstructured clinical notes in the EHR to improve risk predictions. “We have years of free-text notes from physicians, nurses, dietitians—all describing our patients’ lives and behaviors,” Dr Shah explained at a meeting of the diabetes care committee. “We’re barely using any of that in our risk models. If we can extract insights from those notes, we might discover predictors of risk that the labs and vitals alone don’t capture.”
Clinicians in the room raised eyebrows. MetroCare’s EHR notes indeed contained rich narratives: a doctor’s impression of a patient’s home life challenges, a nurse’s observation of medication non-adherence, a social worker’s notes on housing instability, or a behavioral health consult mentioning stress and depression. These anecdotes held clues about a patient’s social and behavioral determinants of health (SBD)—factors like socioeconomic status, social support, lifestyle habits, and mental health. Dr Elena Porter, a primary care physician, gave an example: “I have a patient, mid-50s, moderately uncontrolled diabetes. Medically he’s so-so. But I wrote in my notes that he’d lost his job and was evicted last year—extreme stress. Sure enough, his health nosedived afterward. Our current model didn’t flag him as high risk until he landed in the ER. I knew from his situation he was high risk, but that nuance was lost in the data.” Stories like this resonated with the team. The medical model looked only at numbers—lab values and comorbidities—but context like job loss, homelessness, or depression was not quantified in those models.
Dr Shah’s team believed that natural language processing (NLP) and machine learning could turn those note narratives into useful features. Over the past few years, technologies like deep learning language models had advanced dramatically, enabling computers to read and categorize text at scale. MetroCare had recently invested in a data science platform and had two skilled NLP specialists on staff. Under Dr Shah’s direction, they launched a pilot project to augment the risk model with SBD features extracted from text.
Building the integrated risk model
Throughout 2023, the data science team worked behind the scenes with historical data. They pulled 7 years of de-identified usable records for T2D patients (2016–2023), amounting to 4835 patients and over 46,000 patient-visits. For each patient, they compiled all the structured data used in the existing model—demographics, key lab results (e.g., HbA1c), vital signs (blood pressure and BMI), treatment details (e.g., use of insulin or hypertension medications), and healthcare utilization metrics (clinic visits, ER visits, and secure messaging counts). They then turned to the unstructured clinical notes. Using a combination of NLP and a domain-specific large language model, the team systematically scanned thousands of free-text notes to identify and quantify SBD factors for each patient.
They focused on two main categories of text-derived features. • Social Determinants of Health (SDoH): Indicators of a patient’s socioeconomic and psychosocial challenges, as documented in clinician notes. The team used a curated list of clinical keywords and ICD-10 “Z-codes” (codes used for social conditions) to tag notes for issues like economic instability, housing problems, lack of family support, social isolation, and psychological distress. Real-world clinician-annotated Z-codes served as ground truth labels to train supervised learning models, enabling the system to accurately classify similar unlabeled notes. For example, if a note mentioned “job loss” or “financial stress,” the patient’s record would get a flag for economic instability. Mentions of living alone or strained family relationships would trigger a social support flag. These were complex factors previously absent from MetroCare’s risk models. • Behavioral Factors: Signals of the patient’s personal health behaviors and self-care. Using advanced language models, the team classified each patient’s notes regarding exercise habits, diet adherence, and stress management. Essentially, they taught the AI to recognize if the narrative in the chart implied positive or negative behavior patterns. For instance, phrases like “patient reports regular exercise” or “active lifestyle” would mark a positive activity level, whereas “sedentary” or “non-adherent with diet” would mark a negative diet adherence. Stress health and emotional health were gauged from notes mentioning anxiety, coping difficulties, or depression. These behavioral risk factors are modifiable, but often not coded in any structured field—they live in the free-text notes. (The analytical techniques to extract these patterns followed established best practices in health informatics, ensuring methodological rigor).
Features integrated into MetroCare’s risk model (structured medical + text-derived social/behavioral).
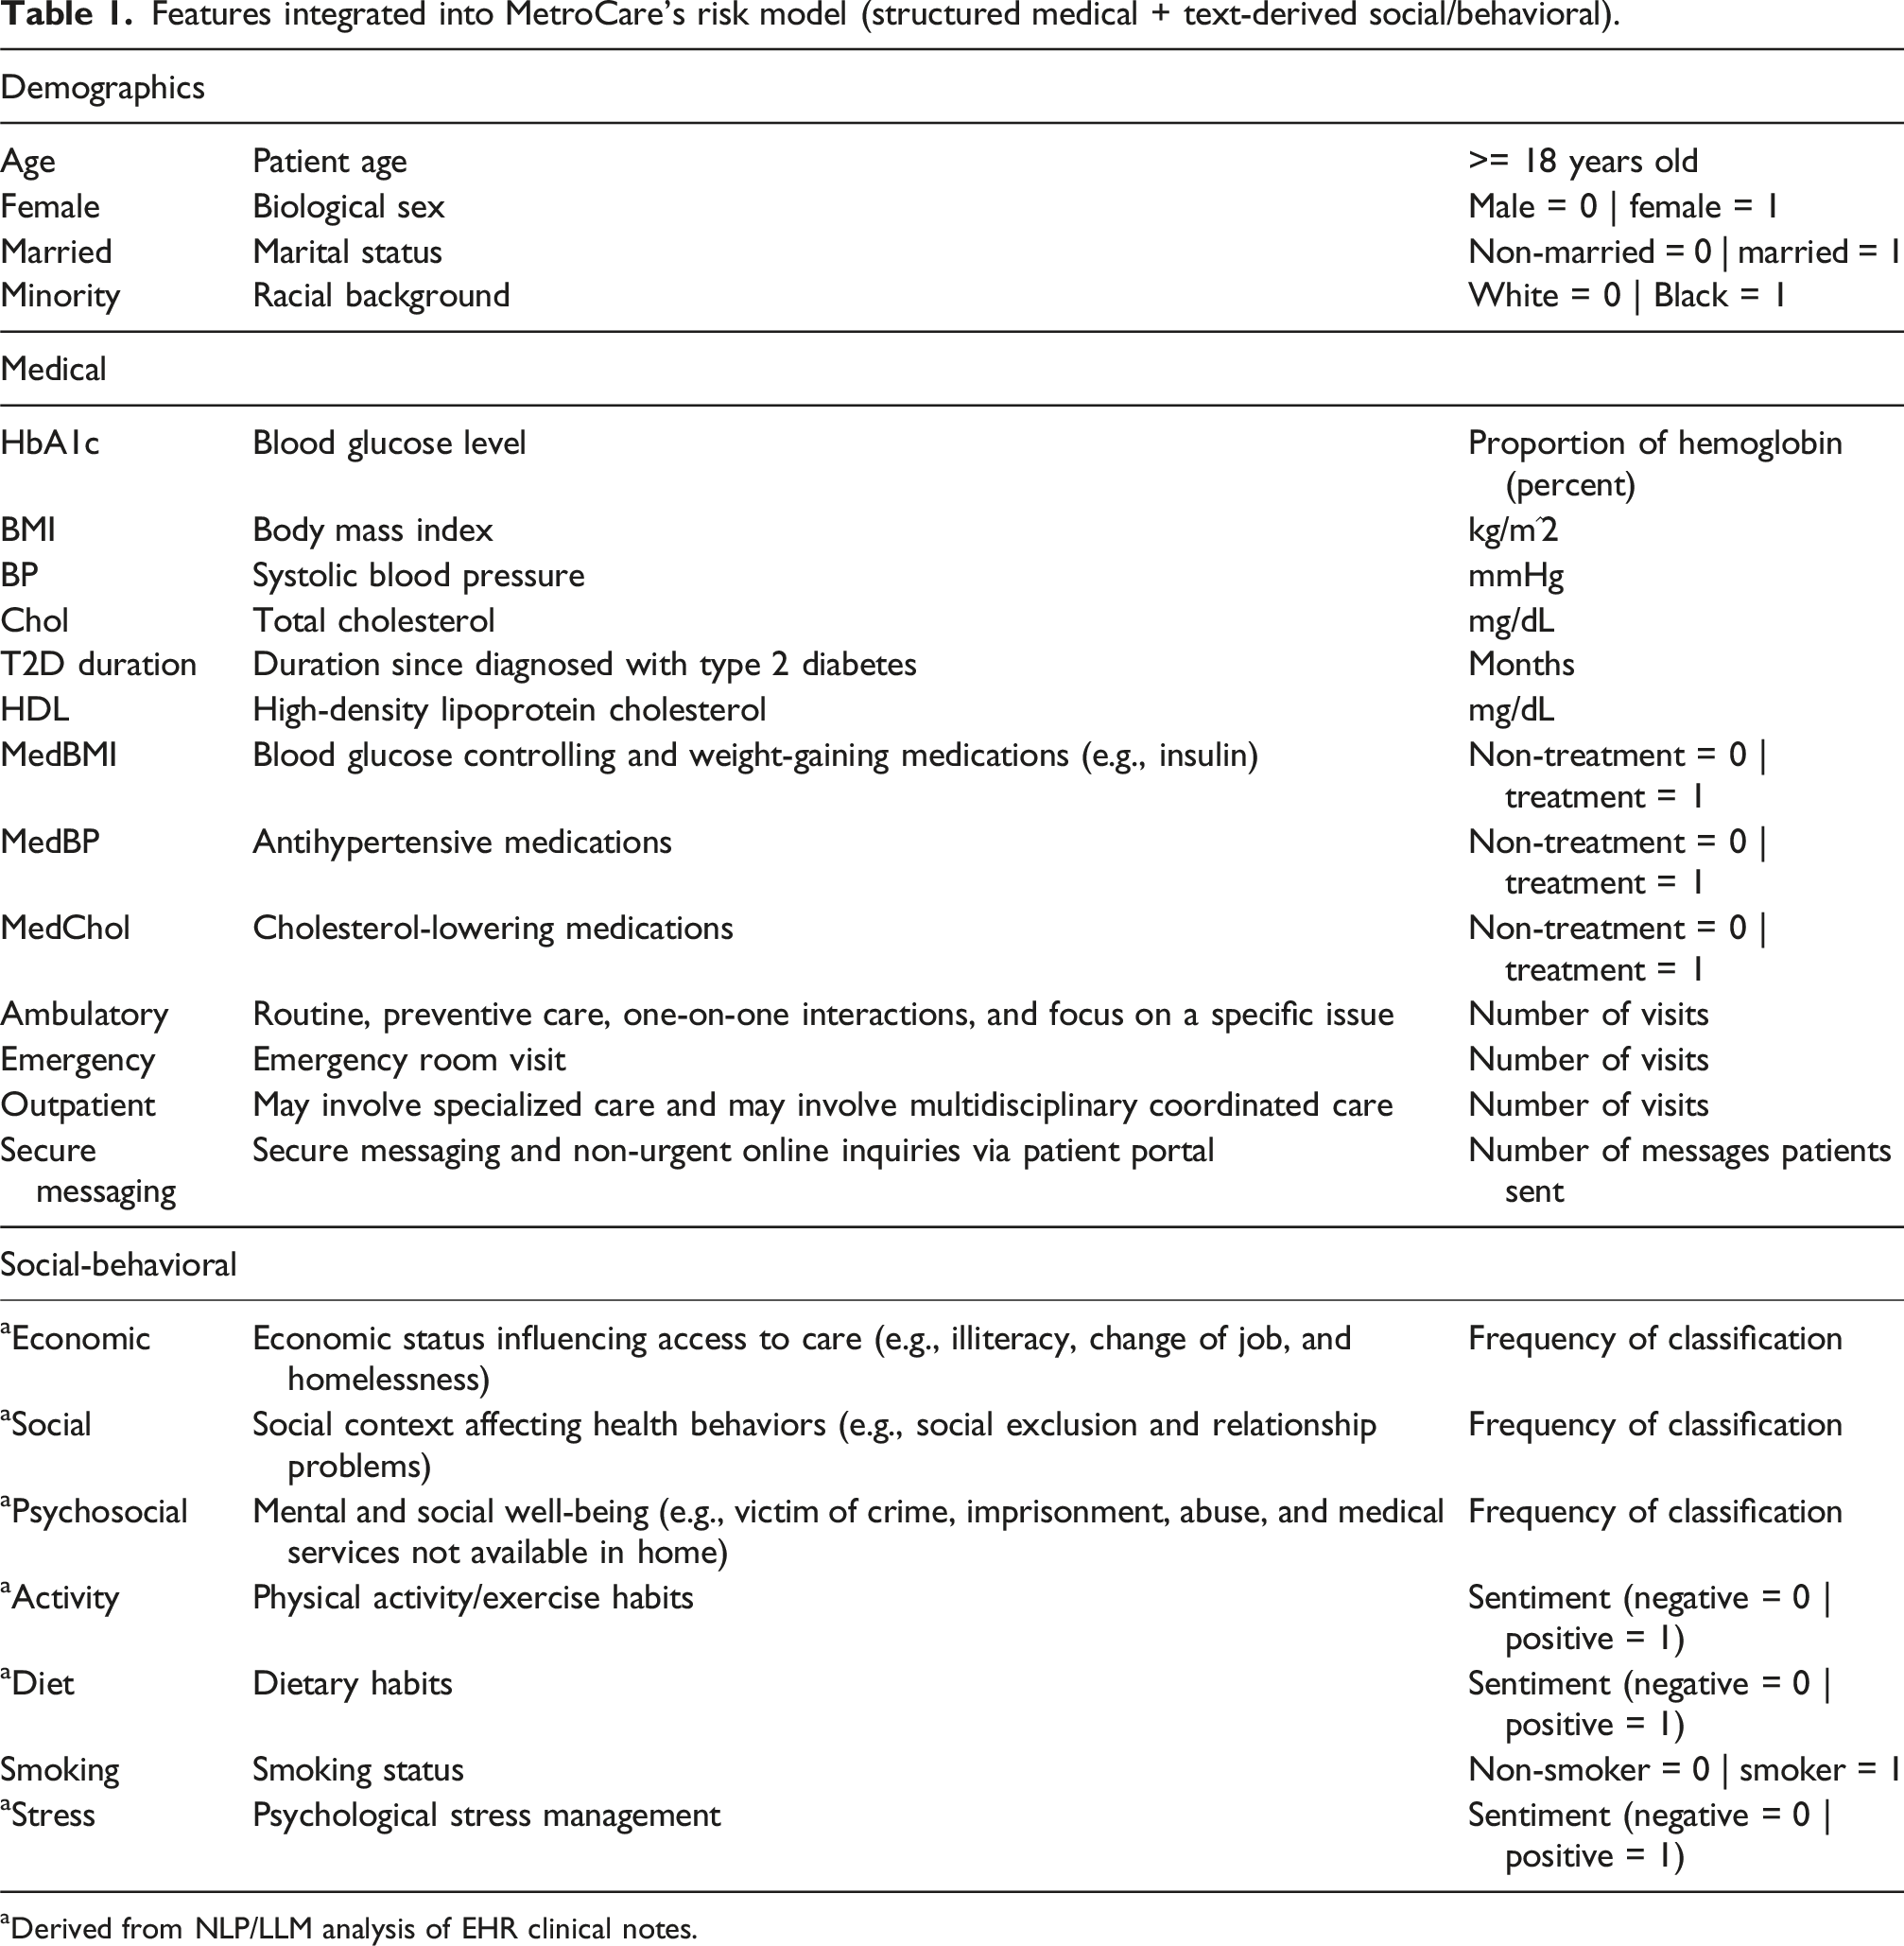
aDerived from NLP/LLM analysis of EHR clinical notes.
With the enriched dataset in hand, Dr Shah’s team developed two predictive models for comparison. • Medical-Only Model (baseline): Using only the traditional demographic, medical, and utilization features (essentially MetroCare’s existing approach). • Full Integrated Model: Using all of the above plus the text-derived SDoH and behavioral features.
Both models were trained to predict the same outcome: whether a patient would experience an adverse cardiovascular event (ACVE) in the next 12 months. (The definition included non-fatal heart attack, stroke, heart failure hospitalization, or similar major events). This 1-year prediction horizon aligned with MetroCare’s annual care planning cycle—each year, decide who needs ramped-up intervention.
The data science team employed an ensemble of machine learning algorithms (including gradient-boosted tree models) to train the predictors. Ensemble models often yield more robust performance by combining the strengths of different algorithms. Given that only ∼21% of patient observations had an ACVE (a relatively imbalanced dataset), they also used techniques to handle class imbalance—oversampling methods and cost-sensitive training—to ensure the model wouldn’t simply overlook the rarer events. The end result for each model was a risk score between 0 and 1 for each patient (a predicted probability of an ACVE within 12 months).
As the models were being developed, MetroCare’s clinicians provided input. They were especially curious—and cautious—about the new SBD features. To gain trust, the team validated that the AI was extracting these features accurately. For social factors, whenever a clinician had officially coded a social determinant (e.g., “Z59.0—homelessness” in a note), the NLP algorithms were 97%–99% accurate in flagging those cases. For behaviors like exercise and diet, there was no standardized code, but spot checks and literature benchmarks convinced the team that the AI’s interpretations matched reality in most cases. This gave clinicians confidence that the model was leveraging meaningful information, not just random noise from the charts.
Results: A new lens on patient risk
By early 2024, Dr Shah’s team had encouraging results. In back-testing on historical data, the Full Model (with social-behavioral inputs) clearly outperformed the Medical-Only Model. In terms of overall discrimination ability, the area under the ROC curve (AUC) for the Full Model was 0.860, compared to 0.834 for the traditional model. This indicated that the new model was better at separating those who would have events from those who would not. “An AUC gain of 0.026 might not sound huge to everyone,” the lead data scientist noted, “but in clinical risk prediction that’s a substantial improvement—it can translate to many lives impacted when scaled to thousands of patients.”
The improvement was most pronounced in the previously murky middle. The Full Model demonstrated markedly better precision for intermediate-risk patients. In fact, when they looked specifically at individuals whom the old model had rated in the 40%–60% risk range (the moderate-risk group), the new model reclassified a majority of them into more actionable categories. Over half (56%) of patients in the intermediate category were reclassified by adding the social-behavioral data—some were downgraded to clearly low risk, while others were bumped up to high risk. This was exactly what MetroCare’s team hoped for: a clearer differentiation. “It’s like we finally put these folks under a better lens,” Dr Martinez remarked upon seeing the results. “Now we know who’s likely okay versus who’s truly a ticking time bomb.”
To illustrate, the team compiled a few anonymized example profiles. • Patient A: A 62-year-old male with moderately elevated HbA1c and blood pressure. Traditional model risk ≈0.45 (45%, intermediate). However, the clinician notes described his excellent adherence to exercise and diet (positive behaviors) and strong family support. The Full Model integrated these positives, lowering his risk to 0.30 (30%, truly low risk). He avoided an unnecessary high-intensity intervention. • Patient B: A 50-year-old female with decent lab numbers (traditional risk ∼0.50) but whose notes revealed severe depression and financial stress after losing her job. Those factors pushed her Full Model risk to ∼0.65 (65%, high risk). Under the old system, MetroCare’s care team would not have flagged her for preventive cardiology workups or stress management support, but the new model identified her heightened risk early.
These kinds of reclassifications meant that MetroCare could target its resources more wisely. Rather than label a quarter of their patients “middle risk, maybe intervene,” they could be far more precise—many previously “maybe” patients were now confidently sorted into yes or no for intervention. Figure 1 illustrates the improvement: the distribution of predicted risk scores with the Full Model was broader and more spread out than with the Medical-Only model. The Full Model was able to push more patients toward the extremes (very low or very high risk) instead of clustering so many in the middle. In essence, the risk stratification became sharper. Reclassification distribution—The Full Model (orange) versus Medical-Only Model (blue). The Full Model produces a wider spread of risk probabilities, with more patients identified at either the low-risk or high-risk ends. Among those who were mid-risk under the old model (in the 0.4–0.6 range, shaded area), the new model redistributed a large portion into clearer low or high categories.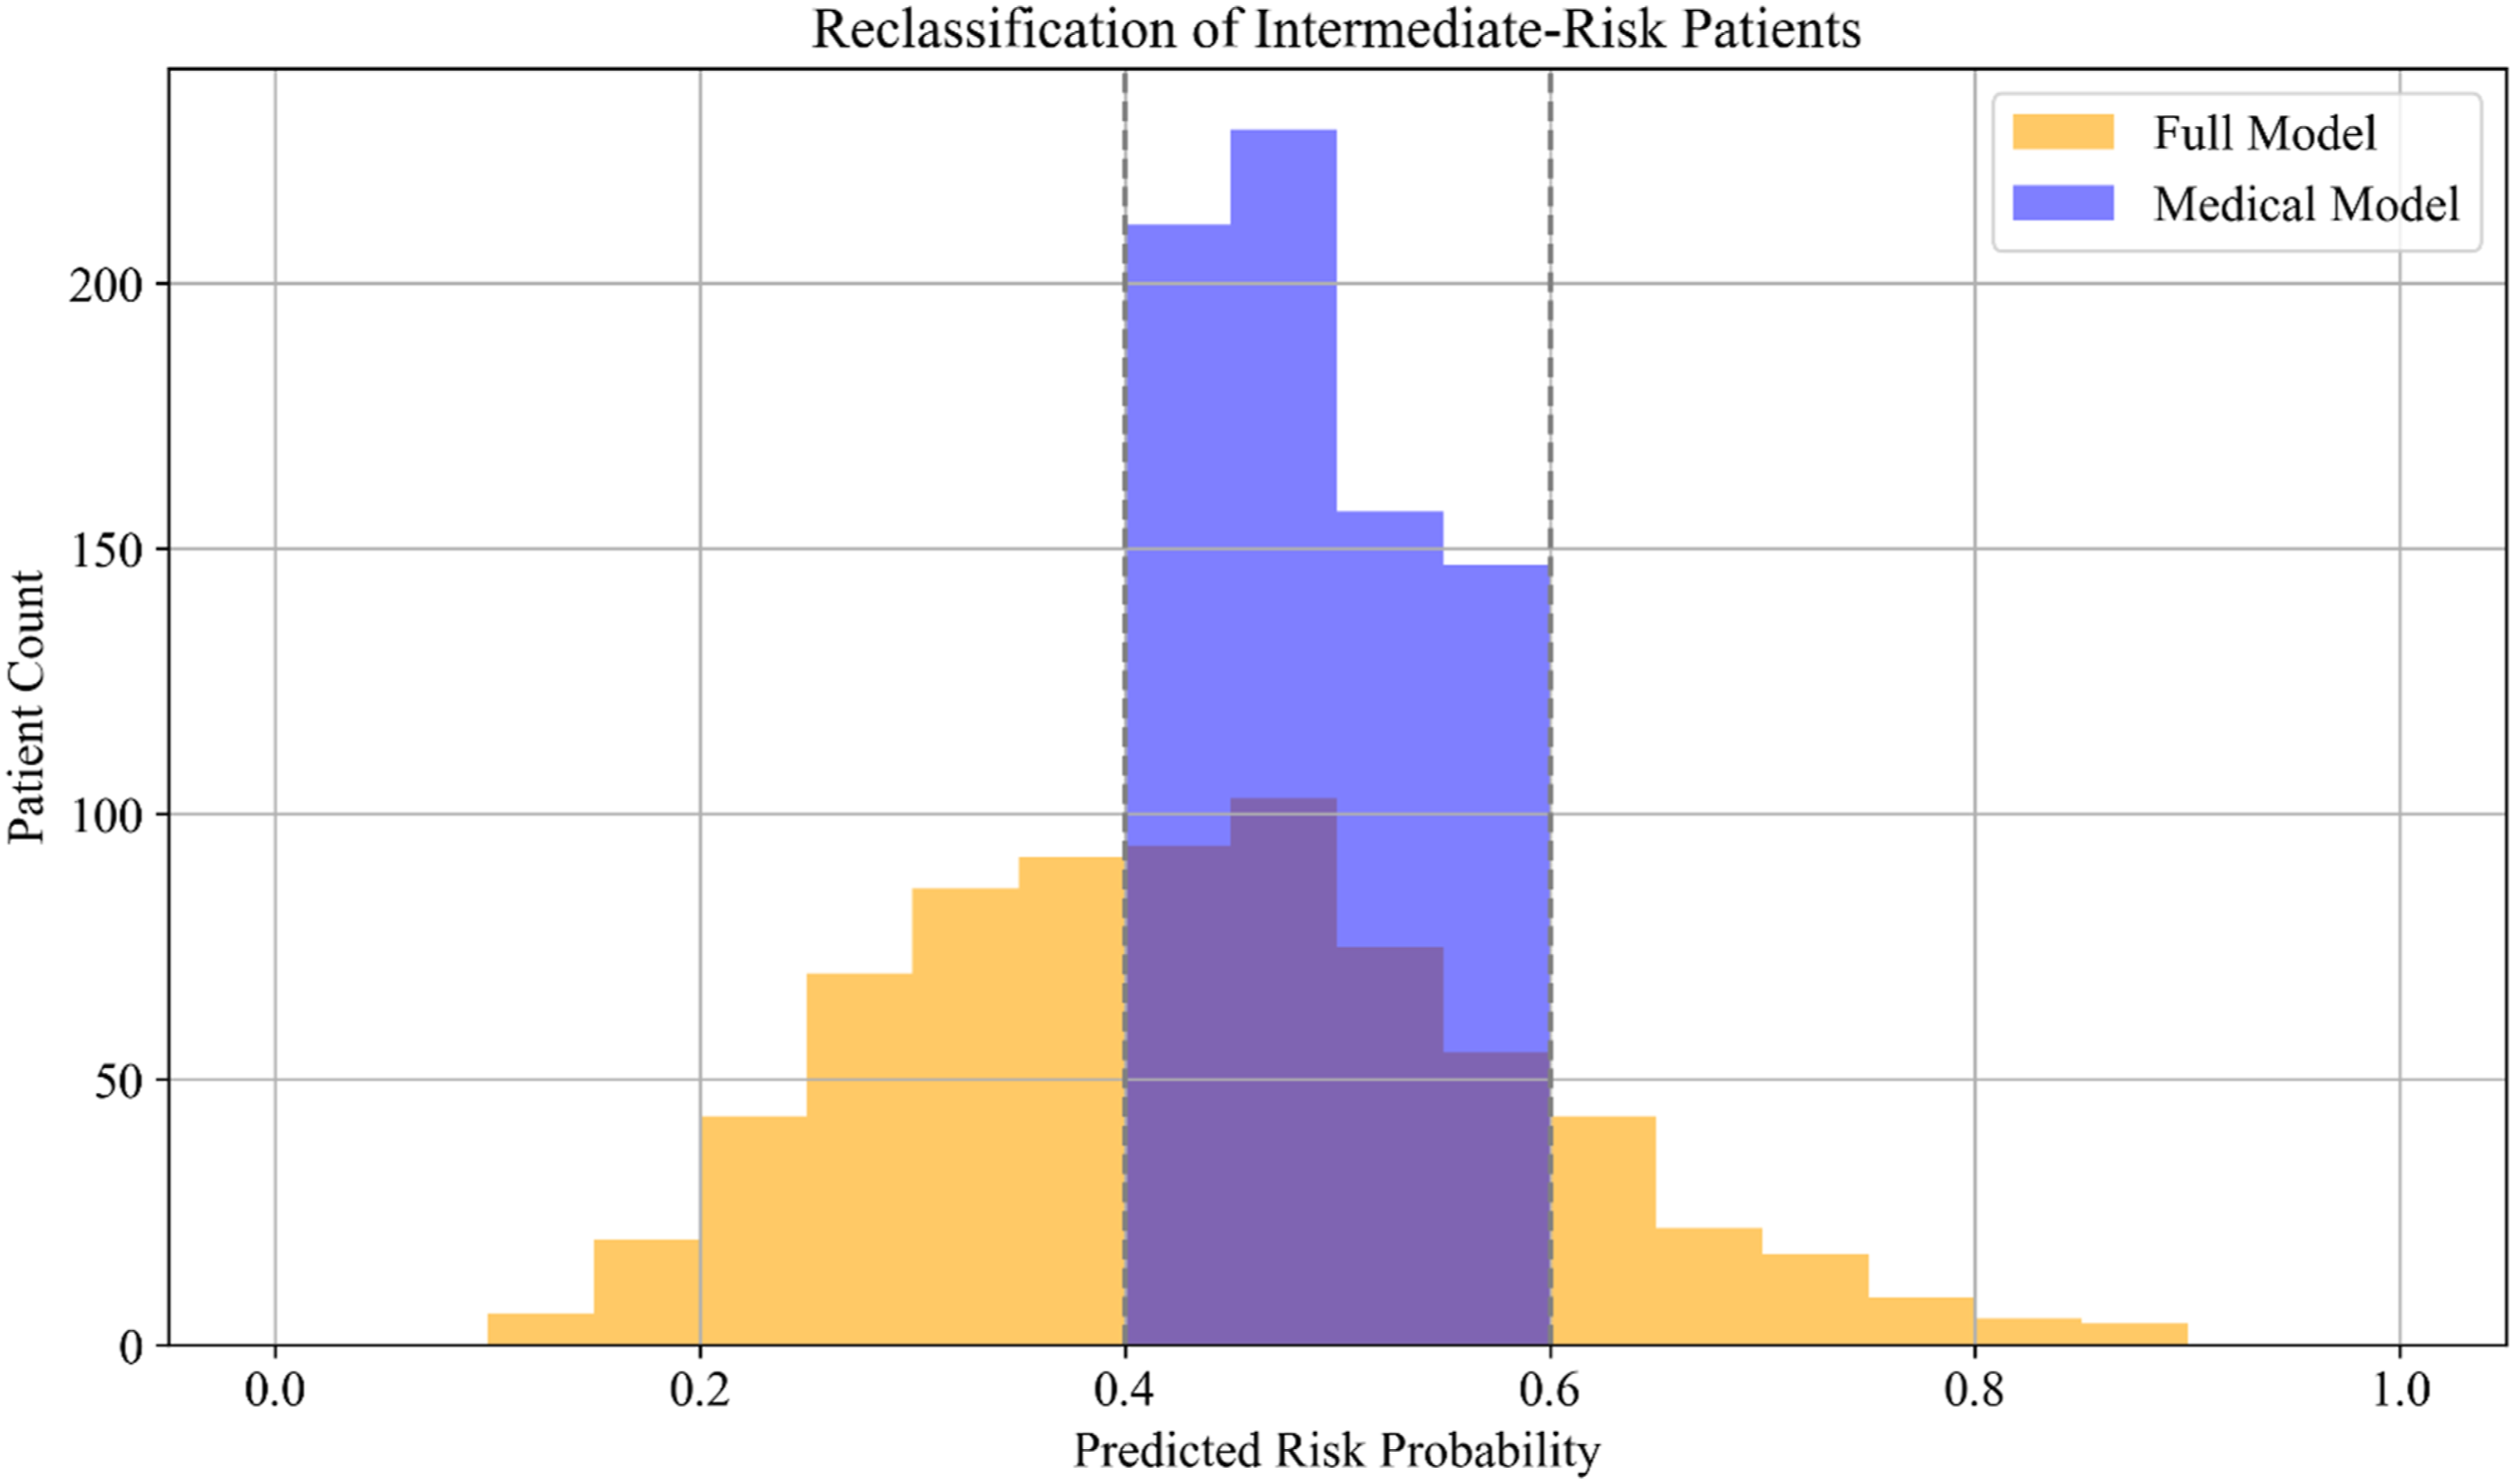
Beyond accuracy, the data science team knew that what really mattered to MetroCare was the operational impact—how many interventions could be reduced without harming outcomes, and what cost savings could result. They conducted a side-by-side comparison of the two models’ outcomes per 1000 patients, assuming each model was used to guide intervention decisions. For a fair comparison, they set the intervention cutoff for each model to achieve roughly the same sensitivity (so that each would catch a similar number of true high-risk patients). The results were striking: using the Full Model, unnecessary interventions (false positives) dropped by about 30%—approximately 206 fewer unnecessary interventions per 1000 patients (a reduction from about 673 down to 467) in the cohort tested. In absolute terms, this represented hundreds of patients spared from extra tests, specialist referrals, or enrollment in intensive programs that ultimately wouldn’t benefit them.
There was a slight trade-off: the Full Model missed a few more actual events (false negatives) than the Medical-Only Model—on the order of 41 more missed cases per 1000 patients. These appeared to be patients whose risk the new model slightly underestimated in its pursuit of higher precision. Importantly, MetroCare’s clinicians judged this trade-off acceptable given that the overall outcomes (true positives identified vs false interventions) improved significantly. The Full Model still captured the vast majority of those who would have events, and the small increase in missed events was considered manageable—likely addressable by downstream clinical judgment. Dr Martinez emphasized, “No model is perfect, but on balance this new approach means far fewer people getting invasive or expensive interventions they don’t need, and only a handful more that we might miss initially—and we have other safety nets for them. We’re not compromising patient outcomes; in fact, by focusing our attention better, overall outcomes should improve.”
From a financial perspective, the new stratification was a revelation. Fewer false positives meant direct cost savings: every avoided unnecessary intervention (like an unneeded stress test or specialist consult) saved money. The team calculated that per 1000 patients, the Full Model’s reduction in false alarms would save approximately $1.71 million in intervention costs, while the slight increase in missed events would incur about $0.79 million in potential downstream costs (treating those few extra unexpected complications). Netting these out, MetroCare stood to save roughly $0.93 million per 1000 patients by using the Full Model, compared to the old model. Across MetroCare’s entire diabetes population, that translated to multiple millions of dollars in savings every year, without harming patient health. In fact, because the care team could redirect resources to truly high-risk patients, they expected overall health outcomes to improve (fewer emergencies and better-controlled chronic conditions)—a win-win that aligned perfectly with MetroCare’s value-based care goals.
Threshold decisions: choosing when to intervene
Buoyed by these results, MetroCare’s interdisciplinary team—clinicians, data scientists, and administrators—turned to the practical question of implementation. One key decision loomed: What risk threshold should they use to classify “high-risk” patients with the new model? The beauty of predictive models is that the threshold can be adjusted to be more or less inclusive. MetroCare could choose to intervene on only, say, the top 10% highest-risk patients, or extend interventions to the top 50%—depending on resource availability and strategic priorities.
Dr Kiran Shah presented a scenario analysis to illustrate the trade-offs. The team simulated three threshold strategies using the Full Model. (1) Scenario 1: “Limited Resources”—High Threshold (e.g., risk score > 0.4): In this scenario, only about 10% of patients (the very highest-risk decile) would be classified as high risk and receive the intensive intervention. This conservative approach prioritized avoiding false positives. (2) Scenario 2: “Moderate Resources”—Moderate Threshold (around 0.30): This represented MetroCare’s baseline strategy, intervening on roughly 25%–30% of patients (a balance between sensitivity and precision). (3) Scenario 3: “Expanded Resources”—Low Threshold (e.g., risk score > 0.2): Here, nearly 50% of patients would be flagged for intervention—an aggressive approach catching almost all who might develop complications, at the cost of many more false positives.
The conclusion from these scenarios was clear: tuning the risk threshold is a powerful lever for MetroCare’s operations. A higher threshold (fewer interventions) could dramatically cut costs and avoid overburdening staff, but if set too high it might leave some patients without needed care. A lower threshold (more interventions) could maximize catching all possible risk but at diminishing returns and unsustainable expense. The Full Model gave MetroCare flexibility to find the “sweet spot” aligned with its resource capacity. “We’re not stuck with one-size-fits-all,” Dr Shah explained. “We can dynamically adjust our policy. For instance, if we have a nursing shortage or budget cuts one quarter, we raise the threshold to focus only on the very highest risk. If we launch a new program or get a grant to expand services, we can lower the threshold to include more patients.” This dynamic approach represented a shift from the old static rule, where the threshold was picked once and seldom revisited. Now MetroCare could essentially treat threshold setting as an ongoing operational decision—a strategic dial to turn as needed.
James Hunt, the CFO, was particularly pleased to see the net benefit analysis. It aligned with MetroCare’s participation in a value-based payment model: preventing unnecessary interventions saved money which, in a capitated contract, the health system got to keep. At the same time, preventing real complications saved the payer (and society) money and improved MetroCare’s quality metrics. “This is the kind of win-win we’ve been talking about for years,” he said. Dr Shah also shared a decision curve analysis (comparing doing nothing vs using the model at various thresholds) which showed that at almost any reasonable threshold between 20% and 70%, the Full Model added positive value—meaning outcomes were better than either extreme of treating everyone or treating no one. This reassured leadership that there was a wide operating range in which using the model would be beneficial, and an optimal range where it was especially powerful.
Implementation and next steps
By mid-2024, MetroCare Health System stood ready to integrate this AI-driven risk stratification into practice. The case now shifts to you, the decision-maker: put yourself in the shoes of MetroCare’s executive team as they plan the rollout. Several questions remain open for discussion. • Threshold Policy: At what risk score threshold should MetroCare initially classify patients as high risk for intervention? How should they balance the desire for fewer false positives (cost savings) against the risk of false negatives (missed events), given their current resource constraints? • Operational Integration: How should the new risk model be incorporated into clinician workflow? For example, should it trigger a dashboard alert in the EHR for front-line providers, or should a centralized care management team use it to outreach to patients? What training or explanation will front-line care teams need to trust and effectively use these AI-generated risk scores? • Monitoring and Adjustment: What processes should MetroCare put in place to monitor the model’s performance and update the intervention threshold over time? How will they know if the threshold should be tweaked upward or downward? Who should be responsible for this ongoing calibration? • Patient Impact and Ethics: Are there any concerns about using social and behavioral data in this way? Could there be privacy or ethical issues in how risk is assessed (e.g., ensuring patients are not stigmatized by certain social factors)? How can MetroCare ensure the model is used to help patients, and not inadvertently harm or bias against them? • Scaling Beyond Diabetes: If this approach proves successful for T2D patients, should MetroCare consider applying similar integrated risk models to other chronic conditions (like heart failure and COPD)? What organizational capabilities would be needed to expand this analytics-driven stratification more broadly?
As the leadership team reconvened in the boardroom to make final decisions, there was a sense of optimism. The Chief Medical Officer, Dr Martinez, looked around at her colleagues—the CFO, the Chief Data Officer, the Population Health Manager, and others—and summed up the journey: “We started with an age-old problem in healthcare: too many needs, not enough resources—and we may have found a solution that makes us better on all fronts. Let’s make sure we implement it wisely.” MetroCare Health System was on the cusp of a data-driven transformation in chronic disease management. The next steps they take would determine just how much they could bend the Iron Triangle, improving cost efficiency, quality of care, and patient access all at once. The challenge for MetroCare’s leaders—and for those analyzing this case—is to translate the promise of analytics into sustainable practice change.
Footnotes
Ethical consideration
The project was approved by the University of Cincinnati Institutional Review Board.
Funding
The project described was supported by the National Center for Advancing Translational Sciences of the National Institutes of Health, under Award Number 5UL1TR001425-03. The content is solely the responsibility of the authors and does not necessarily represent the official views of the NIH.
Declaration of conflicting interests
The authors declared no potential conflicts of interest with respect to the research, authorship, and/or publication of this article.
Data Availability Statement
The data analyzed in this study are subject to HIPAA regulations and patient privacy protections. Therefore, the complete dataset cannot be made publicly available. However, de-identified, aggregated summaries or analyses may be provided upon reasonable request and approval by relevant ethics committees.