
Abstract
Atrial fibrillation (AF) prevalence has increased markedly over the past two decades, underscoring the need for personalized approaches to diagnosis, risk stratification, and therapy. Computational modeling provides a framework to integrate patient-specific anatomy and electrophysiology, offering mechanistic insights into arrhythmia susceptibility. We analyzed a virtual population of 160 bi-atrial models to investigate how structural and electrophysiological markers contribute to AF vulnerability and patterns. Each virtual patient incorporated geometries with varying enlargement, structural (conduction velocity, CV), and electrical (action potential duration, APD) remodeling. Virtual patients were characterized through anatomical markers, defined as inter-landmark distances, and electrophysiological markers, such as total activation time. AF vulnerability was tested by programmed stimulation from multiple atrial sites in 800 simulations. Lower CV and APD increased arrhythmic incidence, consistent with prior work. Larger atrial lateral extent and longer Bachmann's bundle length raised AF initiation likelihood by ∼20% (p < 0.05), while total activation time did not distinguish inducible from non-inducible anatomies (p > 0.05). Anatomical features, including superior-to-inferior vena cava distance, distinguished organized from disorganized patterns, while electrophysiological biomarkers alone did not. Combined high anatomical and electrophysiological marker values were linked to greater inducibility during AF progression (+20%). These findings provide mechanistic evidence for the role of atrial biomarkers in AF initiation and maintenance, highlighting the value of virtual populations in capturing inter-patient variability. By linking structural and electrophysiological characteristics to arrhythmic risk, this approach supports improved patient stratification and the design of individualized therapeutic strategies for AF.
Introduction
The prevalence of atrial fibrillation (AF) has risen by more than 30% over the past two decades and is projected to continue increasing. 1 As the most common sustained cardiac arrhythmia, AF carries a substantial risk of stroke, heart failure, and healthcare burden, 2 underscoring the need for more precise diagnostic and therapeutic strategies. 3 Current treatments have important limitations: antiarrhythmic drugs often show incomplete efficacy and adverse effects, particularly as AF progresses, 4 while catheter ablation frequently fails in persistent AF due to challenges in characterizing the arrhythmogenic substrate. 5 These limitations highlight the need for patient-specific approaches to improve therapeutic outcomes.
Computational approaches, particularly the use of virtual cohorts, have emerged as powerful tools to address this challenge.6,7 By capturing inter-patient variability and representing both anatomical and electrophysiological heterogeneity, these models enable a deeper exploration of AF mechanisms and treatment response. Recent studies have used virtual cohorts to optimize therapeutic strategies,8–10 identify critical modeling parameters,11,12 assess the contribution of atrial structures to arrhythmia inducibility, 13 and generate synthetic datasets for data-driven applications.14–16
This study focuses on developing and analyzing virtual cohorts for in silico trials, with the specific aim of identifying anatomical and electrophysiological biomarkers linked to AF susceptibility. In particular, we evaluate how anatomical biomarkers such as lateral atrial extent (LAE), Bachmann's bundle length (BBL), and vena cava distances, as well as electrophysiological markers such as total activation time (TACT), affect arrhythmic vulnerability and patterns. By establishing these relationships, we aim to provide mechanistic evidence of key AF biomarkers and guide more accurate and computationally efficient modeling strategies to support future personalized treatment planning.
This manuscript is an extended version of our previous contribution. 17 In the present work, we substantially augmented the number of simulations and atrial substrate conditions, we introduced an approach to distinguish between organized arrhythmias (e.g. atrial flutter, AFlut) and disorganized arrhythmias (e.g. AF), we measured patient-specific electrophysiological parameters such as TACT, and we analyzed results in the context of this classification.
Materials and methods
Computational domains
A representative set of 20 atrial anatomies from a virtual dataset generated via Statistical Shape Modeling (SSM), 18 derived from three independent multi-center, multi-vendor imaging databases, including both healthy subjects and patients with AF,19–21 was used in this study. In the original construction of the SSM, only anatomies with four pulmonary veins were included, as this configuration is representative of the majority of the population and enables a continuous PCA-based description of atrial shape variability. 18 The representativeness of the selected anatomies was quantitatively assessed by comparison with the full dataset, as shown in Supplemental Figure 1 and by verifying that atrial volumes fall within ranges reported in clinical imaging studies22,23 (Supplemental Figure 2A).
The selected geometries were remeshed into tetrahedral meshes with a resolution of 0.5 mm, yielding on average 644,240 ± 75,155 vertices and 3,642,000 ± 425,150 tetrahedral elements. Tissue type and fiber orientations (Figure 1(A)) were preserved from the original SSM geometries, while the electrophysiological properties were assigned to each mesh element as described by Barrios-Álvarez de Arcaya et al.. 24 A representative example of the spatial distribution of atrial tissue types, grouped according to their ionic profiles and the corresponding transmembrane potential (TP) traces, is shown in Supplemental Figure 3, while the applied ionic profiles are summarized in Supplemental Table 1.
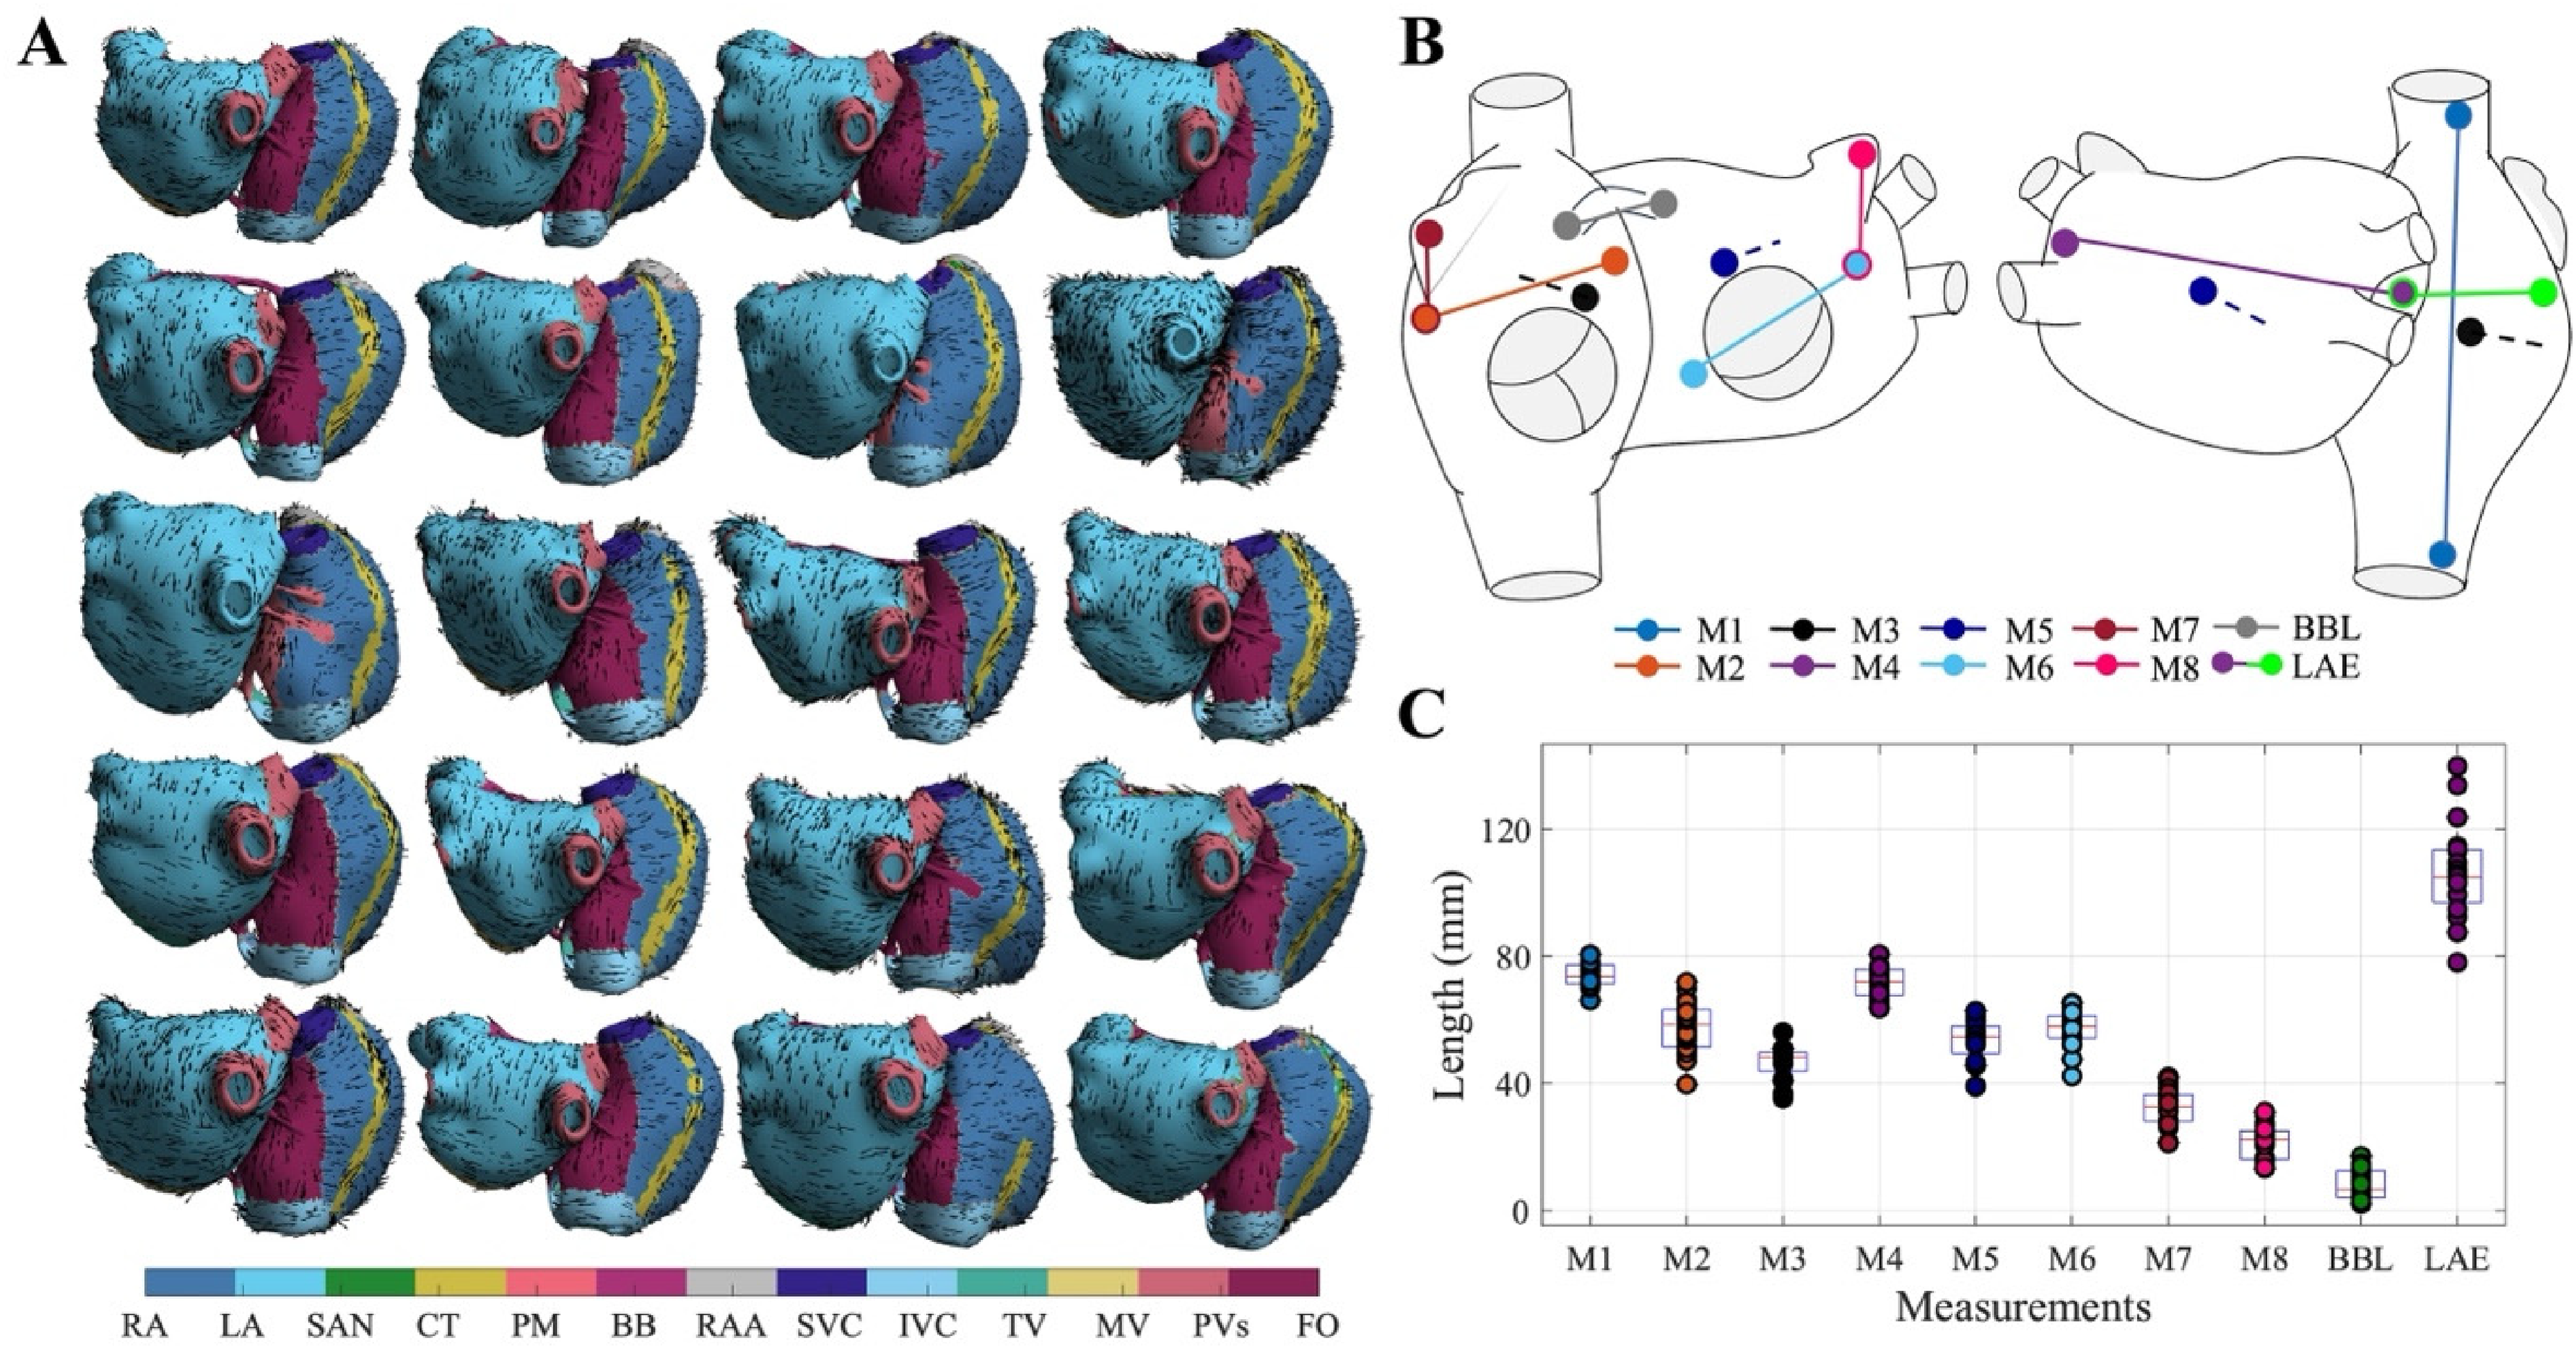
(A) Set of N = 20 bi-atrial geometries used in the study, showing tissue types and fiber orientations. Tissue labels include the right atrium (RA), left atrium (LA), sinoatrial node (SAN), crista terminalis (CT), pectinate muscles (PM), Bachmann bundle (BB), right atrial appendage (RAA), superior vena cava (SVC), inferior vena cava (IVC), tricuspid valve (TV), mitral valve (MV), pulmonary veins (PVs), and fossa ovalis (FO). (B) Anatomical segments used for morphological analysis of the atrial geometries. (C) Distribution of measured values across segments.
For each atrial anatomy, eight anatomical markers (Figure 1(B) and (C)) were obtained as distances between anatomical landmarks in both the left atrium (LA) and right atrium (RA). The selected anatomical markers included M1, the Euclidean distance between the superior and inferior vena cava (SVC–IVC); M2, the distance from the fossa ovalis (FO) to the lateral base of the right atrial appendage (RAA); M3, the distance from the upper part of the tricuspid valve (TV) to the midpoint between the venae cavae; M4, the maximal LA diameter; M5, the distance from the center of the posterior wall to the top of the mitral valve (MV); M6, the distance from FO to the midpoint between the left atrial appendage (LAA) and MV; M7, the distance from the apex of the RAA to its lateral base; and M8, the distance from the apex of the LAA to the midpoint between the LAA and MV.
Additionally, specific anatomical markers were defined as the LAE, defined as the sum of the distances between LAA–FO and FO–RAA; and the BBL, defined as the distance between its RA and LA insertion points. These measurements are illustrated in Figure 1(B) and measured in Figure 1(C).
Simulations framework
Atrial biophysical simulations were conducted using the Koivumäki atrial monodomain model,
25
governed by the following equation:
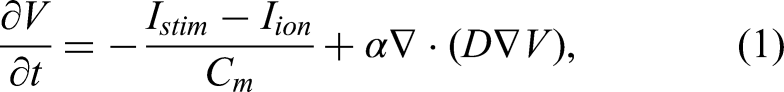
Time integration was performed using an explicit scheme with a time step of 20 μs: transmembrane voltage and ionic concentrations were advanced using a forward Euler method, while gating variables were updated using the Rush–Larsen scheme. Simulations were implemented on a custom-designed GPU solver. 26
To capture different stages of AF progression, the model incorporated both electrical and structural remodeling, representing different AF stages. Electrical remodeling was represented as a progressive shortening of the action potential duration (APD), implemented by uniformly scaling the ionic currents and parameters of the Koivumäki model across the atrial geometry, while acting on region-specific baseline electrophysiological properties, as described in detail by Romitti et al. 27 (Supplemental Figure 3). The reference case of 0% remodeling reflected healthy atrial tissue (APD90 = 195 ms at 2 Hz), while 100% remodeling reproduced persistent AF (APD90 = 105 ms at 2 Hz). In addition, intermediate remodeling levels of 50% (APD90 = 131 ms), 75% (APD90 = 117 ms), and 125% (APD90 = 89 ms) were included through interpolation and extrapolation of ionic profiles (Supplemental Figure 4). Increasing remodeling percentages, therefore, corresponded to progressively more pathological electrophysiological substrates.
Structural remodeling was implemented by adjusting tissue diffusion properties, which represent electrical conductivity between neighboring cells. Diffusion was anisotropic, with maximum conductivity along the fiber direction (Dlong) and minimum perpendicular (Dtrans), and anisotropy ratios (Dlong/Dtrans) assigned per atrial region based on experimental data. 28 Thus, baseline conduction properties remained spatially heterogeneous across atrial regions. To simulate advanced conduction slowing due to fibrosis, diffusion coefficients were globally decreased to 50% or 25% of healthy values, which in the monodomain equation (1) corresponds to scaling the α term and thereby modulating effective tissue conductivity.
Simulated population
Simulations were performed on 20 distinct bi-atrial anatomical geometries. Each anatomical geometry was combined with all combinations of four levels of electrical remodeling and two diffusion conditions ({25, 50}% diffusion × {50, 75, 100, 125}% electrical remodeling). Each unique combination of an anatomical geometry and electrophysiological parameters was considered a virtual patient, resulting in 160 virtual patients (20 anatomies × 8 substrate conditions). Virtual patients sharing the same anatomical geometry were not anatomically independent but differed in their electrophysiological properties, allowing the investigation of functional variability across remodeling and diffusion conditions.
Sinus rhythm was simulated by pacing from the sinoatrial node using a 5 × S1 protocol at 1 Hz. TACT was measured in sinus rhythm simulations as the temporal interval between the first and last activated nodes, for the fifth S1 stimulus (Figure 2(A)).
(A) Anatomical maps of total activation time during sinus rhythm simulation. Left: example of short TACT (geometry g054, 25% diffusion). Right: example of long TACT (geometry g087, 25% diffusion). (B) Anatomical map of TP during an organized arrhythmia (example: g040, 75% remodeling, 25% diffusion). (C) Anatomical map of TP during a disorganized arrhythmia (example: g017, 125% remodeling, 50% diffusion). (D) Frequency of arrhythmic events across all remodeled simulations.
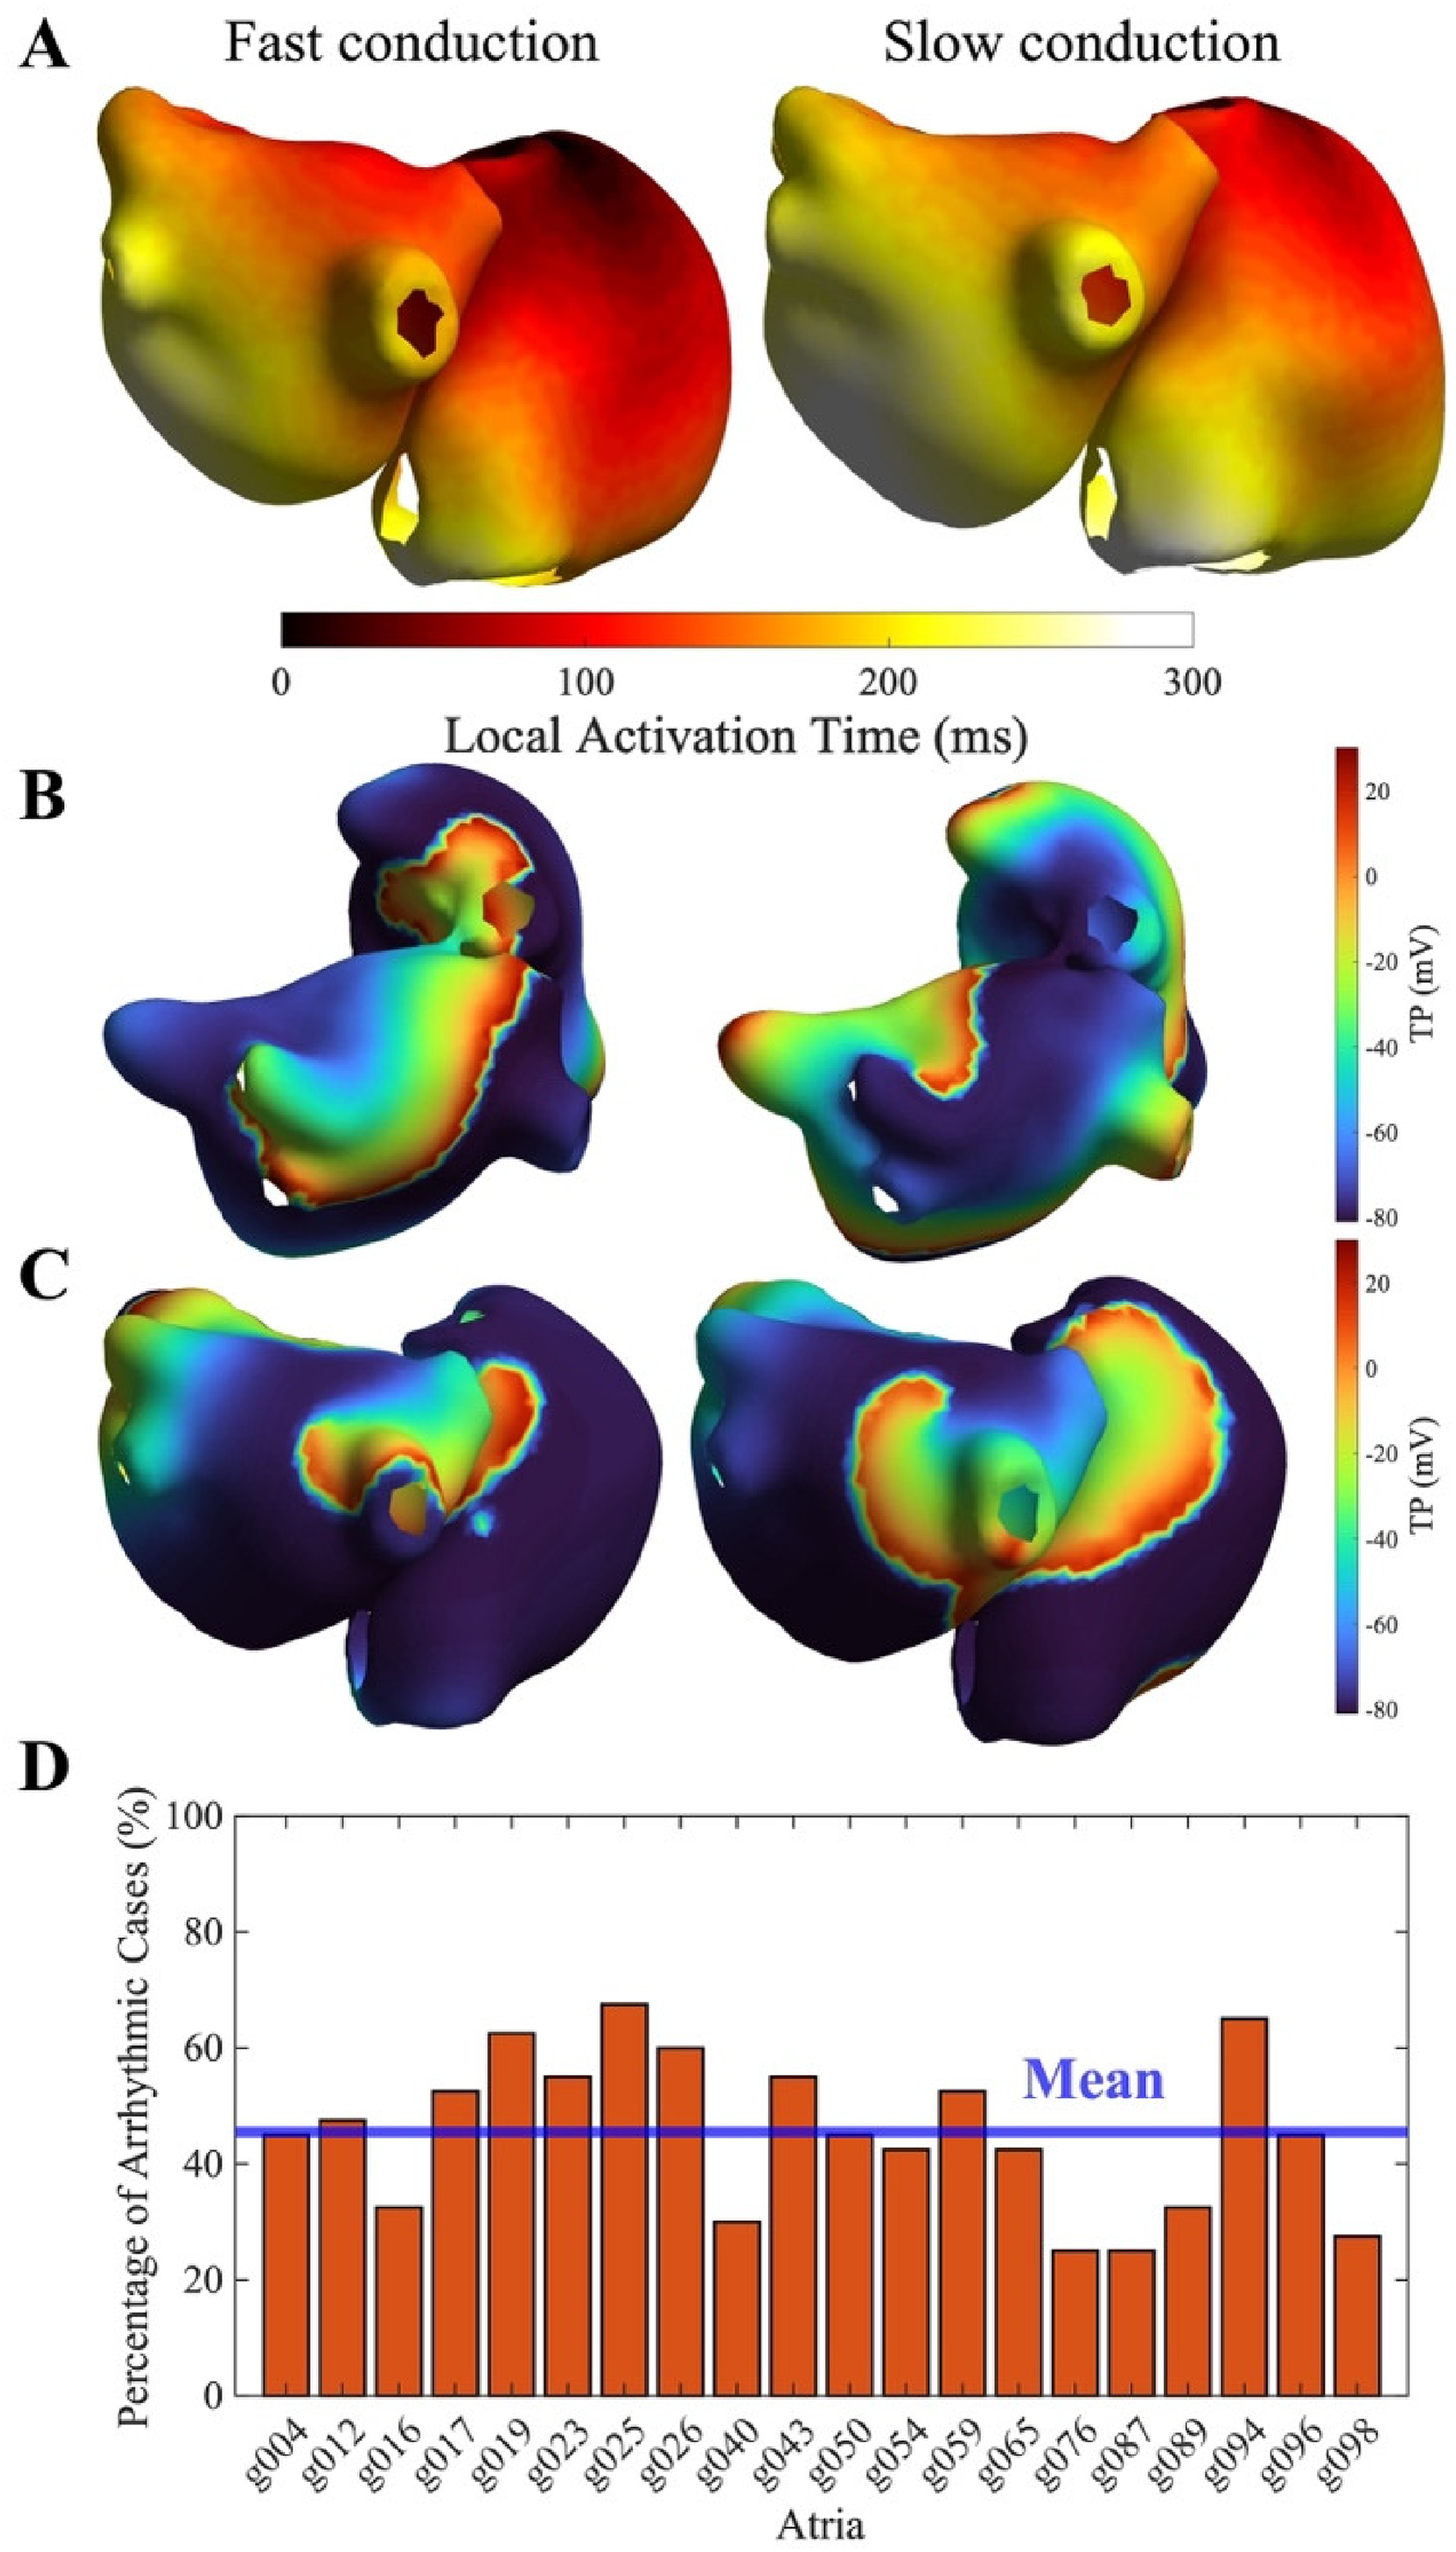
In order to evaluate atrial arrhythmia induction, we employed pacing protocols designed to induce AF. Pacing was applied at 10 atrial sites (six in the left atrium and four in the right atrium, Figure 3(A)) using an increasing-frequency protocol. The protocol started with four equidistant stimuli at a 400 ms coupling interval (CI), followed by progressive reductions of the CI in 10 ms steps until reaching 140 ms ({400, 400, 400, 400, 390, 380, …, 140} ms). This protocol was designed to probe atrial vulnerability and arrhythmia inducibility under controlled conditions and has been widely adopted in previous computational studies investigating atrial arrhythmia mechanisms.9,24,29 To reduce computational load, five stimulation sites were selected per virtual patient: the same five sites were used for 50% and 100% remodeling, and a different five sites for 75% and 125% remodeling, ensuring coverage of different atrial regions and spatial variability in AF inducibility. AF was considered induced if self-sustained activity persisted for at least 5 s after the last pacing stimulus.24,30 Overall, 800 arrhythmia induction simulations were performed (160 virtual patients × 5 stimulation sites).
(A) Anatomical representation of the atria showing the ten stimulation sites considered. (B) Percentage of disorganized (bars with hatch lines) and organized (colored bars) arrhythmias depending on stimulus location. (C) Values of the SVC-to-IVC segments stratified by arrhythmia dynamics. (D) Values of the TACT evaluated at 50% diffusion stratified by arrhythmia dynamics.
Arrhythmia identification
To distinguish disorganized arrhythmias, such as AF, from more organized rhythms, such as AFlut, we employed a cycle length (CL) variability on an endocardial, 1-mm resolution mesh. At each mesh node, the local CL was computed as the time interval between two consecutive activations. The mean CL at each node was then computed by averaging all CL values measured during the final second of the simulation. To capture spatial heterogeneity in CL, found in disorganized rhythms, we calculated CL dispersion as the difference between the 1st and 99th percentiles of each chamber. The atrium with the shorter average CL was then considered for rhythm classification, and the rhythm was labelled as organized if CL dispersion was lower than 10 ms, and disorganized otherwise.
This classification is intended to reflect underlying electrophysiological mechanisms (organized versus disorganized activation patterns), and represents a mechanistic distinction that is related to, but not strictly equivalent to, the clinical differentiation between AFlut and AF.
Statistical analysis
Statistical analyses were performed using the Wilcoxon signed-rank test. Statistical significance was defined as p < 0.05. All analyses were performed in MATLAB. 31 In addition, a high-versus-low stratification analysis was performed for each anatomical biomarker. Biomarkers were dichotomized based on their cohort mean, and logistic regression models were fitted to estimate the association between biomarker level and arrhythmic inducibility outcome, reported as odds ratios (ORs) with 95% confidence intervals. P-values were adjusted for multiple comparisons using the Benjamini–Hochberg false discovery rate procedure, and significance was defined as p< 0.05.
Results
Electrophysiological simulation
Simulations performed under sinus rhythm conditions provided the TACT for all the virtual patients (Figure 2(A)), illustrating the contrast between virtual patients exhibiting slow versus fast conduction. The results across different substrate conditions are summarized in Supplemental Table 2.
Sustained arrhythmias, both organized (Figure 2(B)) and disorganized (Figure 2(C)), were successfully induced in all atrial models, with an inducibility ranging from 20% to 70% across models, and an average value of 45% (Figure 2(D)). While Figure 2(B) and (C) shows representative TP maps of organized and disorganized sustained arrhythmias, additional complementary representations (including CL maps, CL boxplots for LA and RA, and representative TP signals) are reported in Supplemental Figure 5.
Atrial markers versus arrhythmia type
After evaluating inducibility, we investigated the relationship between the type of induced arrhythmia (organized vs disorganized) and both stimulation parameters and patient-specific biomarkers. First, we assessed the influence of the stimulation site. As shown in Figure 3(B), stimulation from the left atrium (sites 1–6) resulted in a slightly higher proportion of disorganized arrhythmias (24 ± 14% disorganized vs 22 ± 8% organized), whereas stimulation from the right atrium produced predominantly organized arrhythmias (27 ± 9% organized vs 16 ± 4% disorganized). These findings indicate that the atrial region of initiation influences arrhythmia dynamics and that LA was more predominant in initiating disorganized arrhythmias, as seen in clinical practice. 32
We next examined how the type of arrhythmia depended on anatomical and electrophysiological biomarkers. Biomarker M1 (the Euclidean distance between the superior and inferior vena cava) was particularly informative (Figure 3(C)); smaller M1 values were significantly associated with a higher prevalence of organized reentries (p = 0.03). This suggests that extended atrial dimensions may promote unstable, disorganized arrhythmic patterns under certain remodeling conditions.
Electrophysiological biomarkers, however, appeared less predictive. As illustrated in Figure 3(D), TACT at 50% diffusion showed similar values between disorganized and organized reentries (203 ± 23 ms vs 198 ± 20 ms), and no significant relationship was observed in the virtual datasets (p = 0.67). This indicates that, unlike anatomical constraints, this electrophysiological measurement does not strongly determine arrhythmia organization.
Atrial markers versus arrhythmicity
Remodeling and diffusion changes had comparable effects on AF inducibility, independent of whether stimuli were applied in the LA or RA, although LA pacing consistently yielded higher overall inducibility (Figure 4(A)). Progression of AF, reflected by increasing levels of electrical remodeling, promoted reentrant activity, while reduced conduction velocity, corresponding to lower diffusion values, similarly increased reentry incidence.
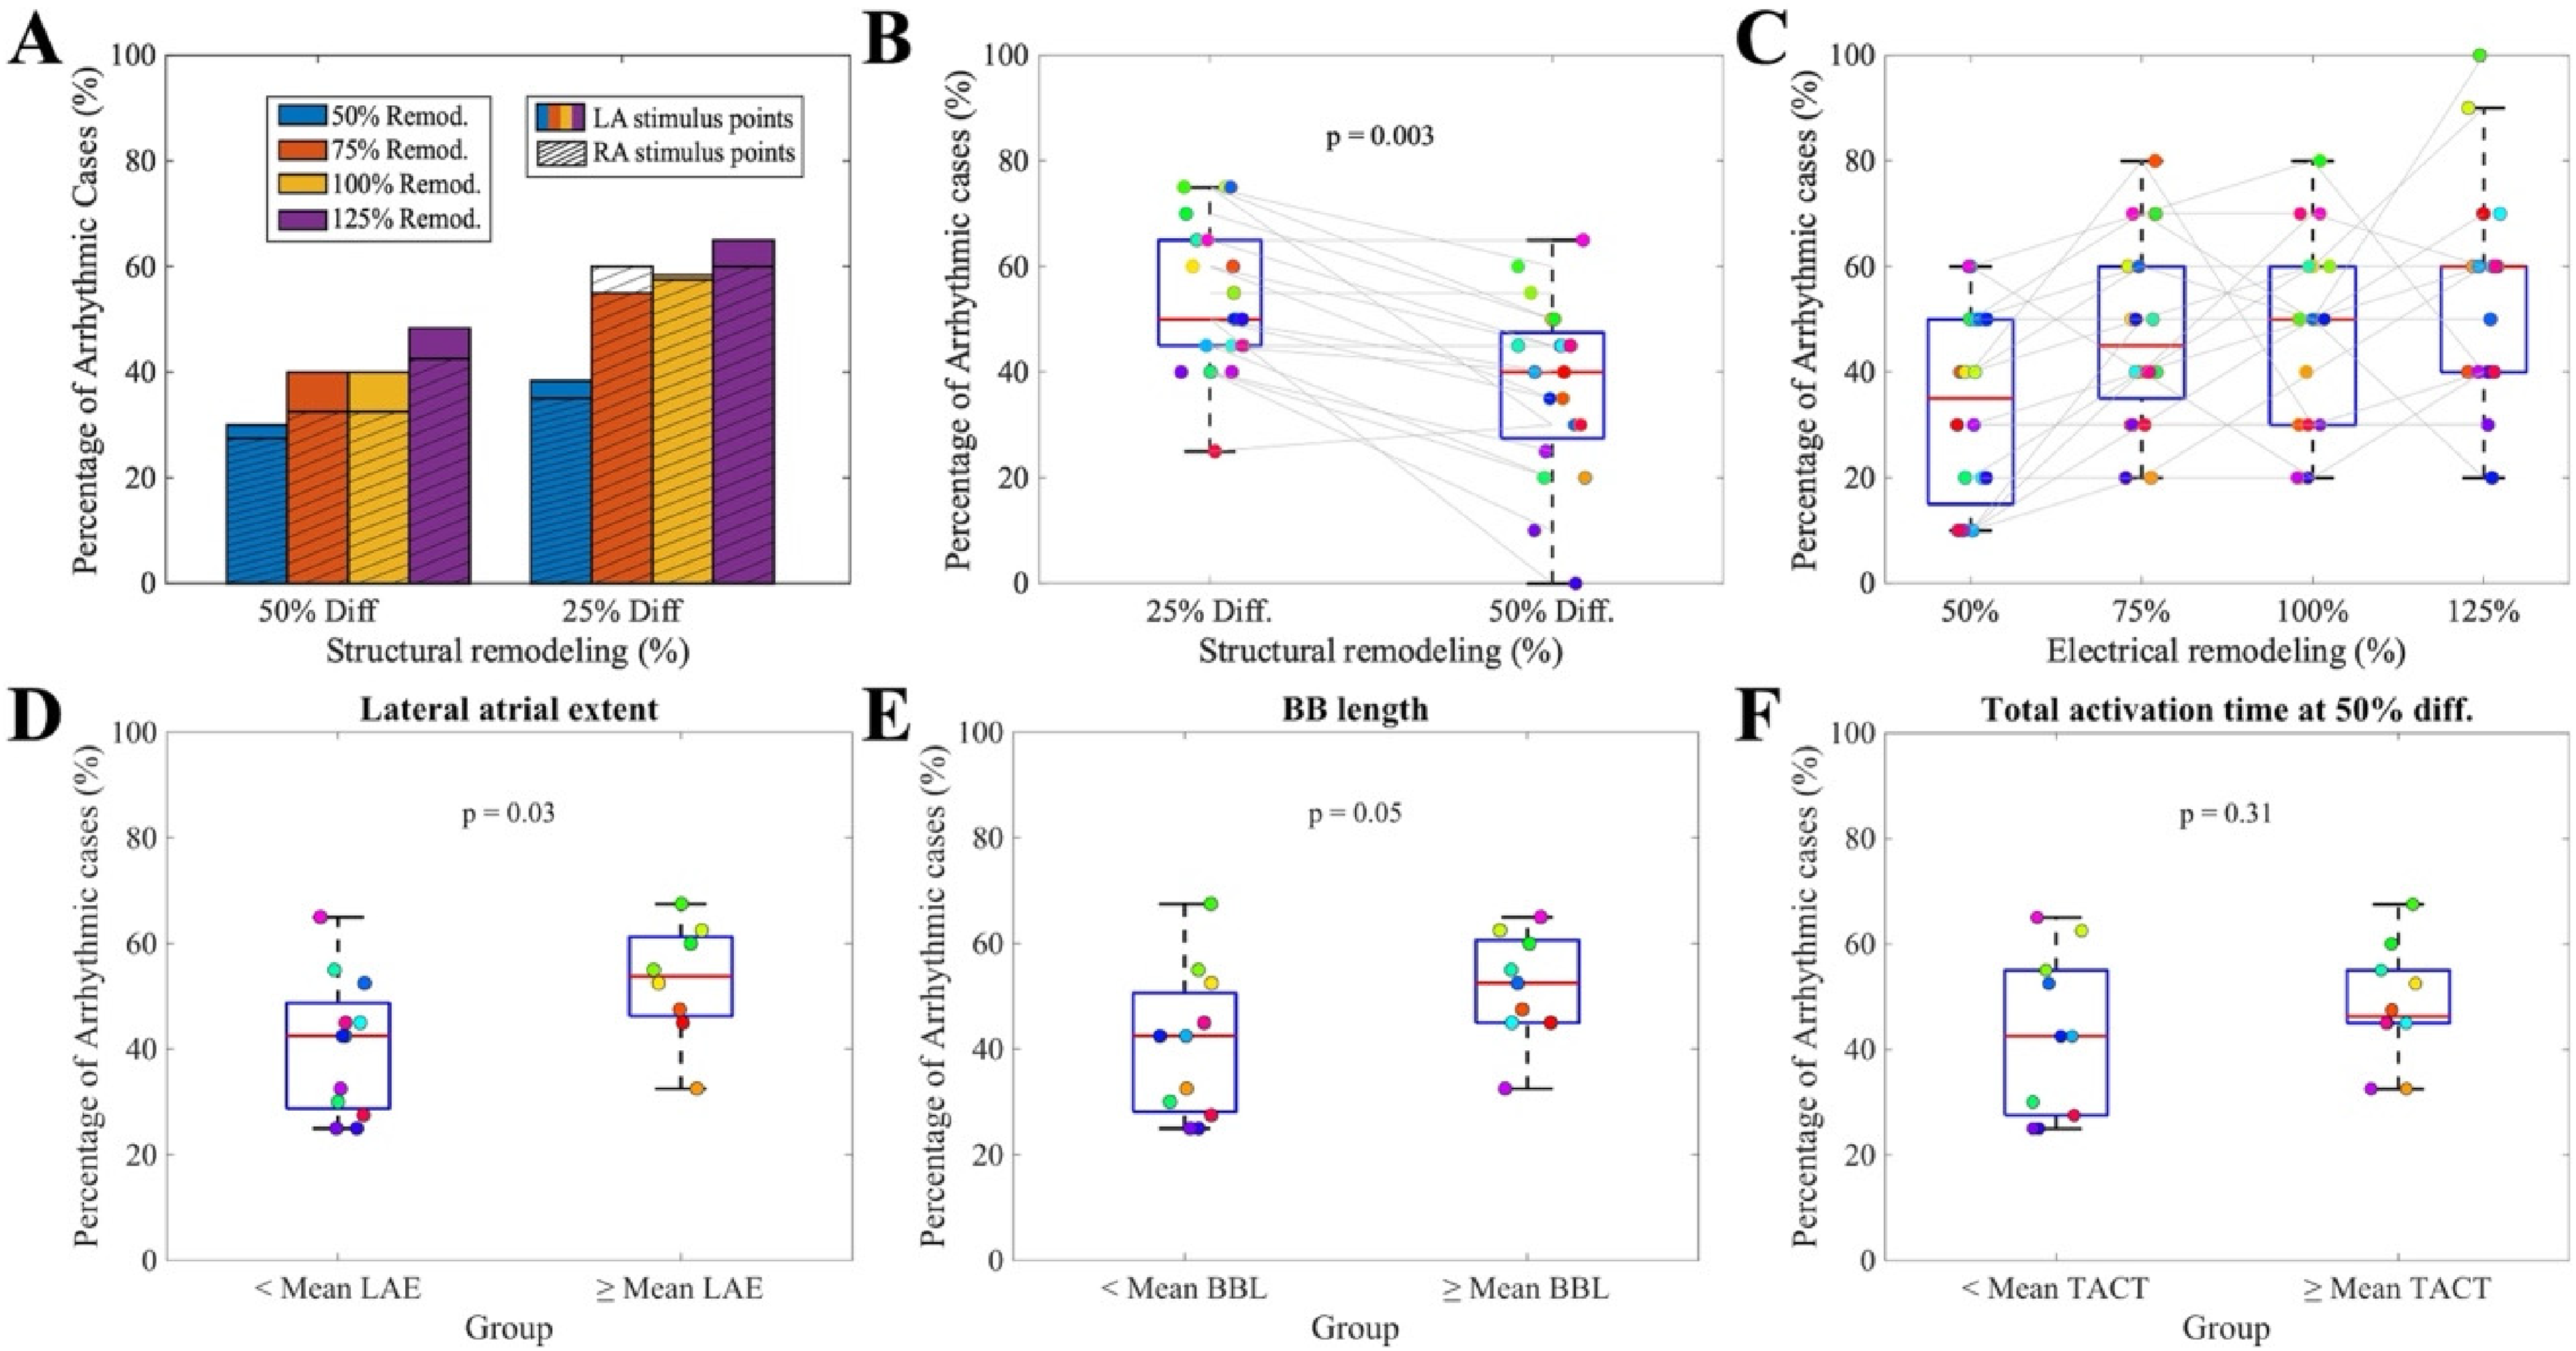
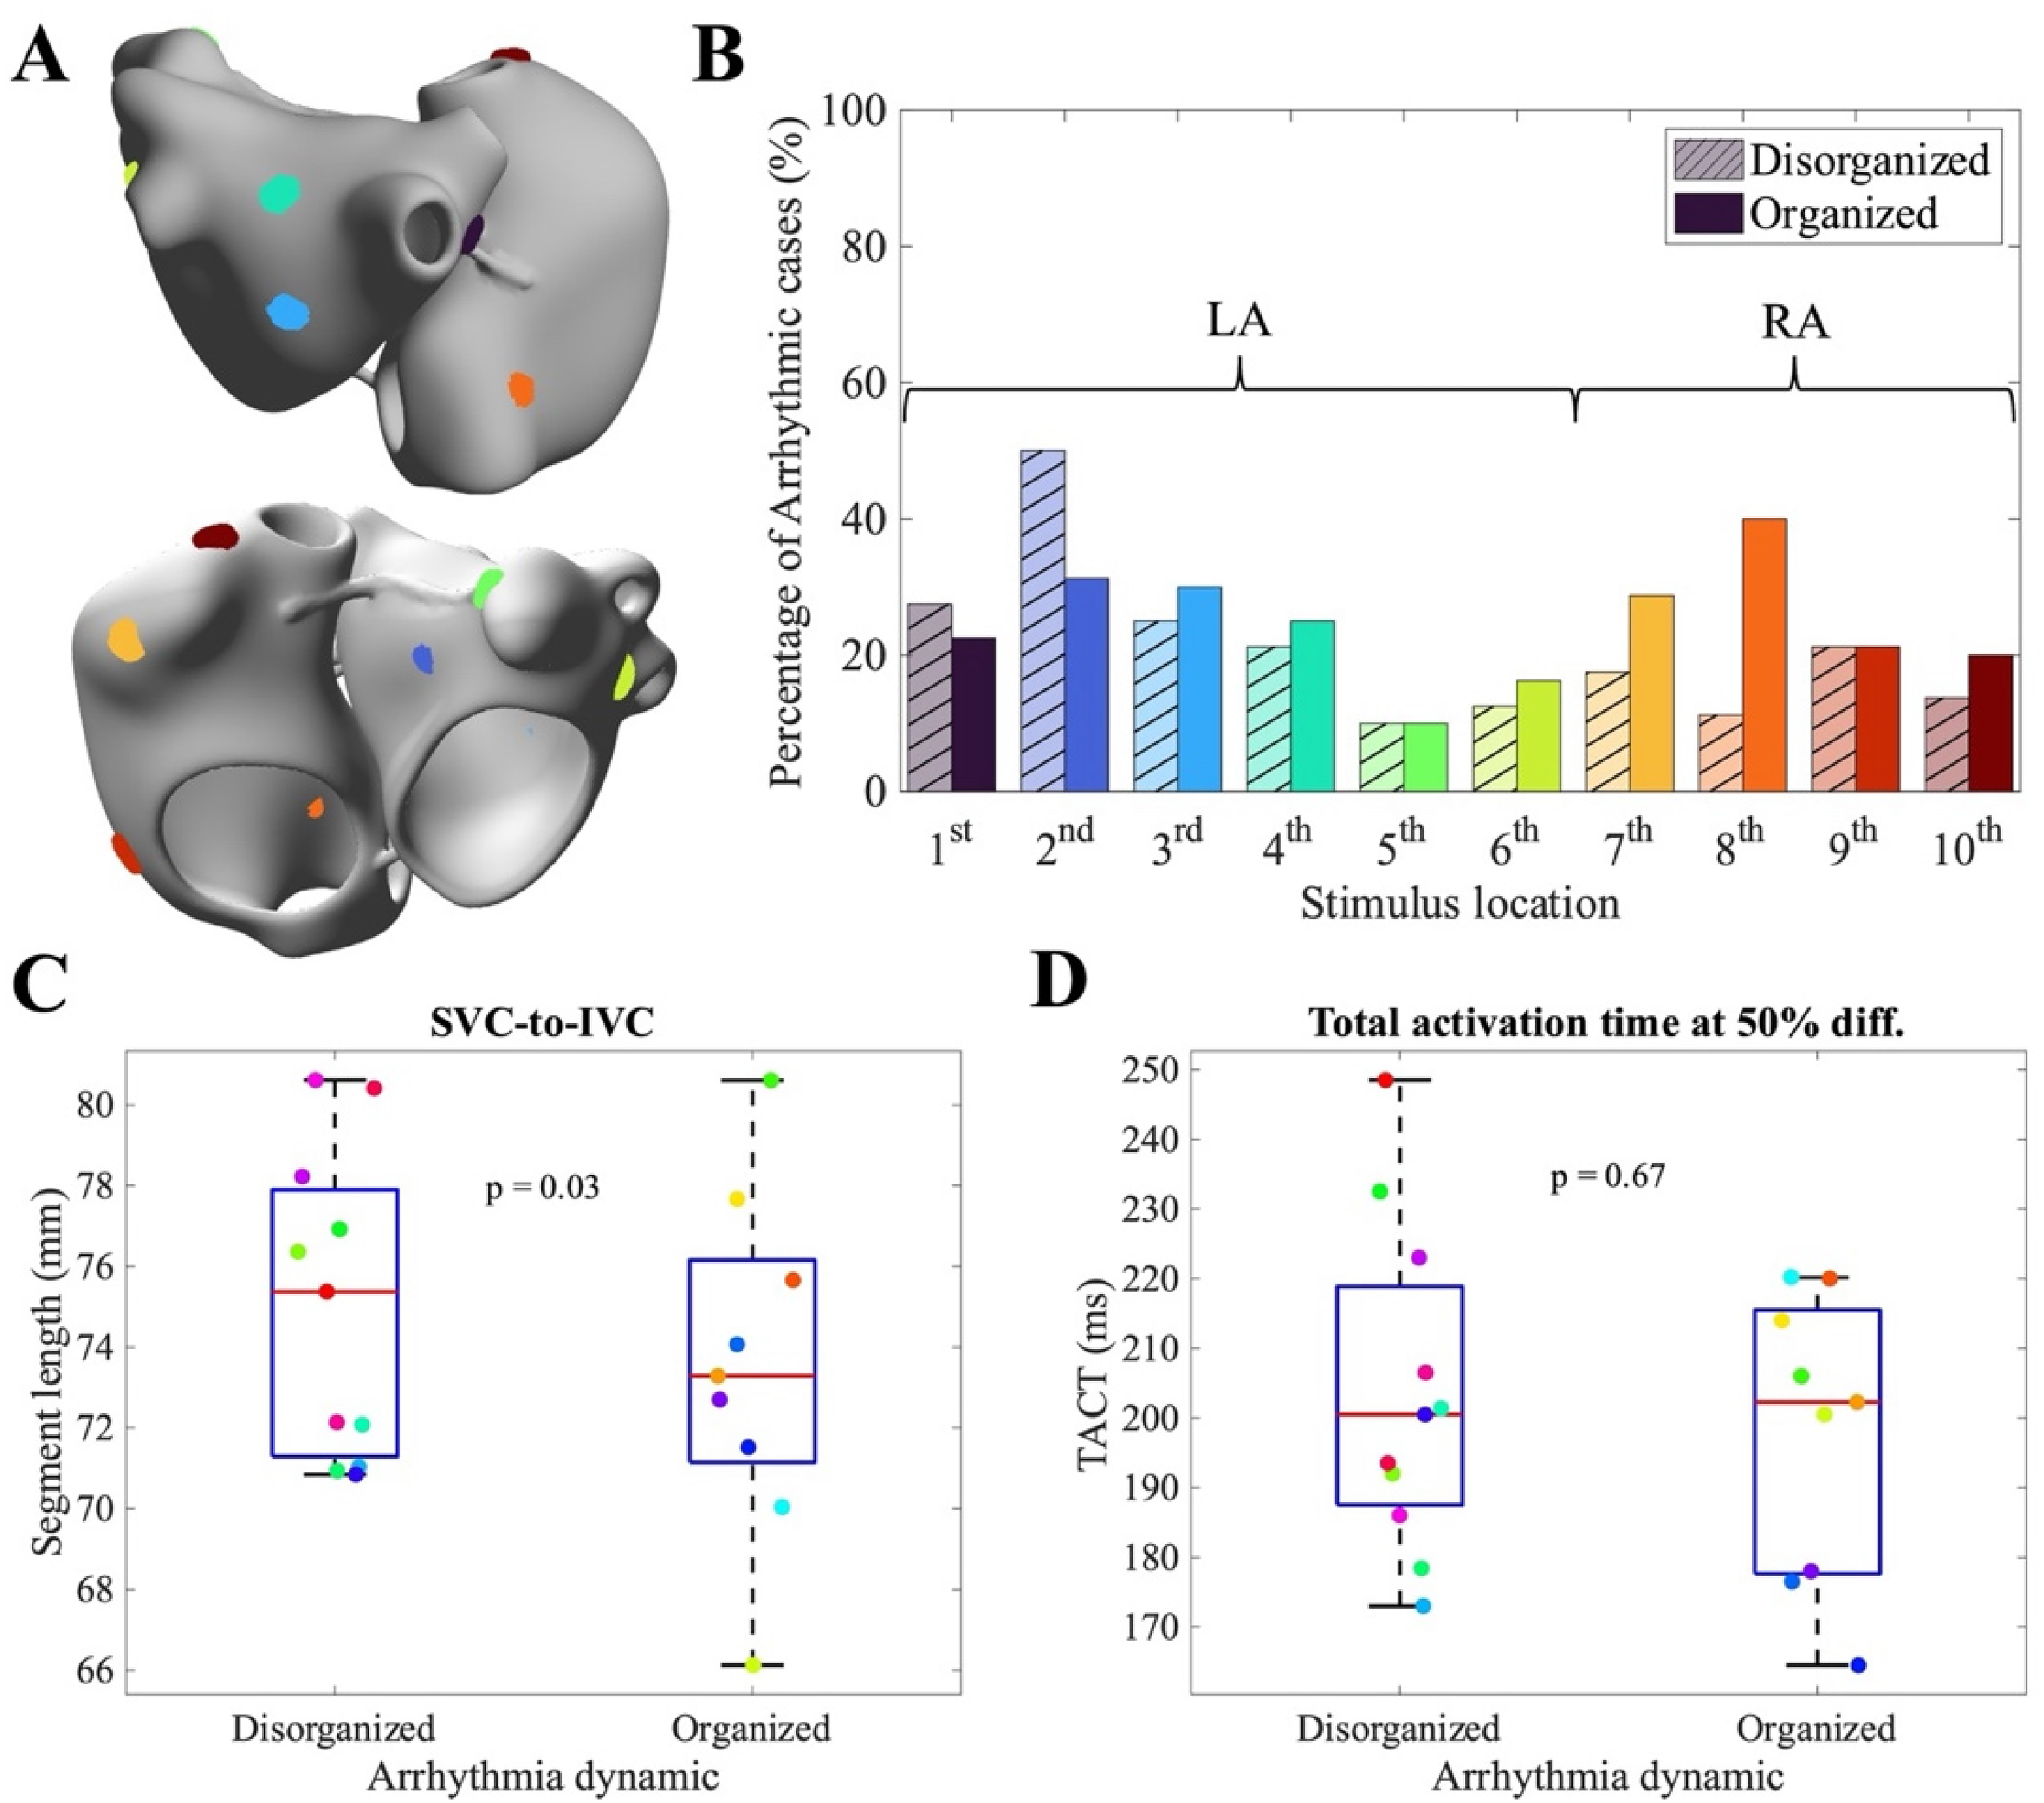
(A) Frequency of arrhythmic events across all combinations of electrical and structural remodeling, comparing stimulus locations in the LA and RA. (B) Inducibility ratio under different diffusion conditions (25% on the left, 50% on the right). Colored dots represent results for each anatomy. (C) Inducibility ratio under different electrical remodeling conditions (50%, 75%, 100%, and 125%, ordered respectively). Colored dots represent results for individual anatomies. (D) Lateral atrial segment values stratified by arrhythmia induction. (E) Bachmann's bundle segment values stratified by arrhythmia induction. (F) Total activation time under 50% diffusion, stratified by arrhythmia induction.
Diffusion had a significant impact on arrhythmia susceptibility, with lower diffusion leading to more frequent arrhythmic events (54 ± 14% vs 37 ± 16%, p < 0.01, Figure 4(B)). These results emphasize that advanced AF progression, whether mediated by electrical remodeling or reduced diffusion, creates more arrhythmogenic substrates, regardless of patient-specific anatomy. The influence of electrical remodeling was particularly evident, with the incidence of arrhythmia rising progressively across remodeling levels (33 ± 18% vs 47 ± 17% vs 47 ± 17% vs 54 ± 19%, Figure 4(C)).
Then, to evaluate the impact of the anatomy on arrhythmia inducibility, we grouped all simulations of the same anatomy under different substrate conditions. Larger LAE (13% increase in arrhythmic cases, p = 0.03; Figure 4(D)) and longer BBL (12% increase in arrhythmic; p = 0.05; Figure 4(E)) were associated with an increased number of arrhythmic inductions, showing nominal statistical significance in uncorrected analyses.
Both LAE and BBL consistently showed higher arrhythmic inducibility across complementary sensitivity analyses. In particular, stratification of the virtual population into high (> mean) and low (≤ mean) anatomical groups revealed increased odds of arrhythmia inducibility for these two markers, whereas all other anatomical and electrophysiological biomarkers showed ORs close to unity with wide confidence intervals (Supplemental Figure 6 and Supplemental Table 3).
In contrast, electrophysiological biomarkers showed no significant association with arrhythmic outcome. Neither the average TACT measured in sinus rhythm simulations at 25% diffusion nor at 50% diffusion (Figure 4(F)) correlated with arrhythmic susceptibility: virtual patients with TACT lower than average TACT showed 43 ± 16% of arrhythmic cases, versus 48 ± 13% for virtual patients with TACT higher than average TACT (p = 0.31). These results indicate that, within the tested parameter range, electrophysiological heterogeneity alone does not explain arrhythmia vulnerability in this cohort.
Effect of anatomical and electrophysiological parameters on AF progression
We next assessed how anatomical and electrophysiological parameters influenced AF progression. To do so, we evaluated the virtual patients under 50% diffusion conditions, and we evaluated their arrhythmia inducibility for different levels of cellular progression (50–125% electrical remodeling). Patients with larger LAE (> 105.8 mm, i.e. the mean value of the set of anatomies considered) were more sensitive to electrical remodeling, with AF induction rates increasing significantly (∼20%) from 50% to 125% remodeling (Figure 5(A)). In contrast, patients with a smaller lateral extent showed a lower increase (∼15%) across the same remodeling levels, suggesting that structural enlargement amplifies the pro-arrhythmic effects of remodeling.
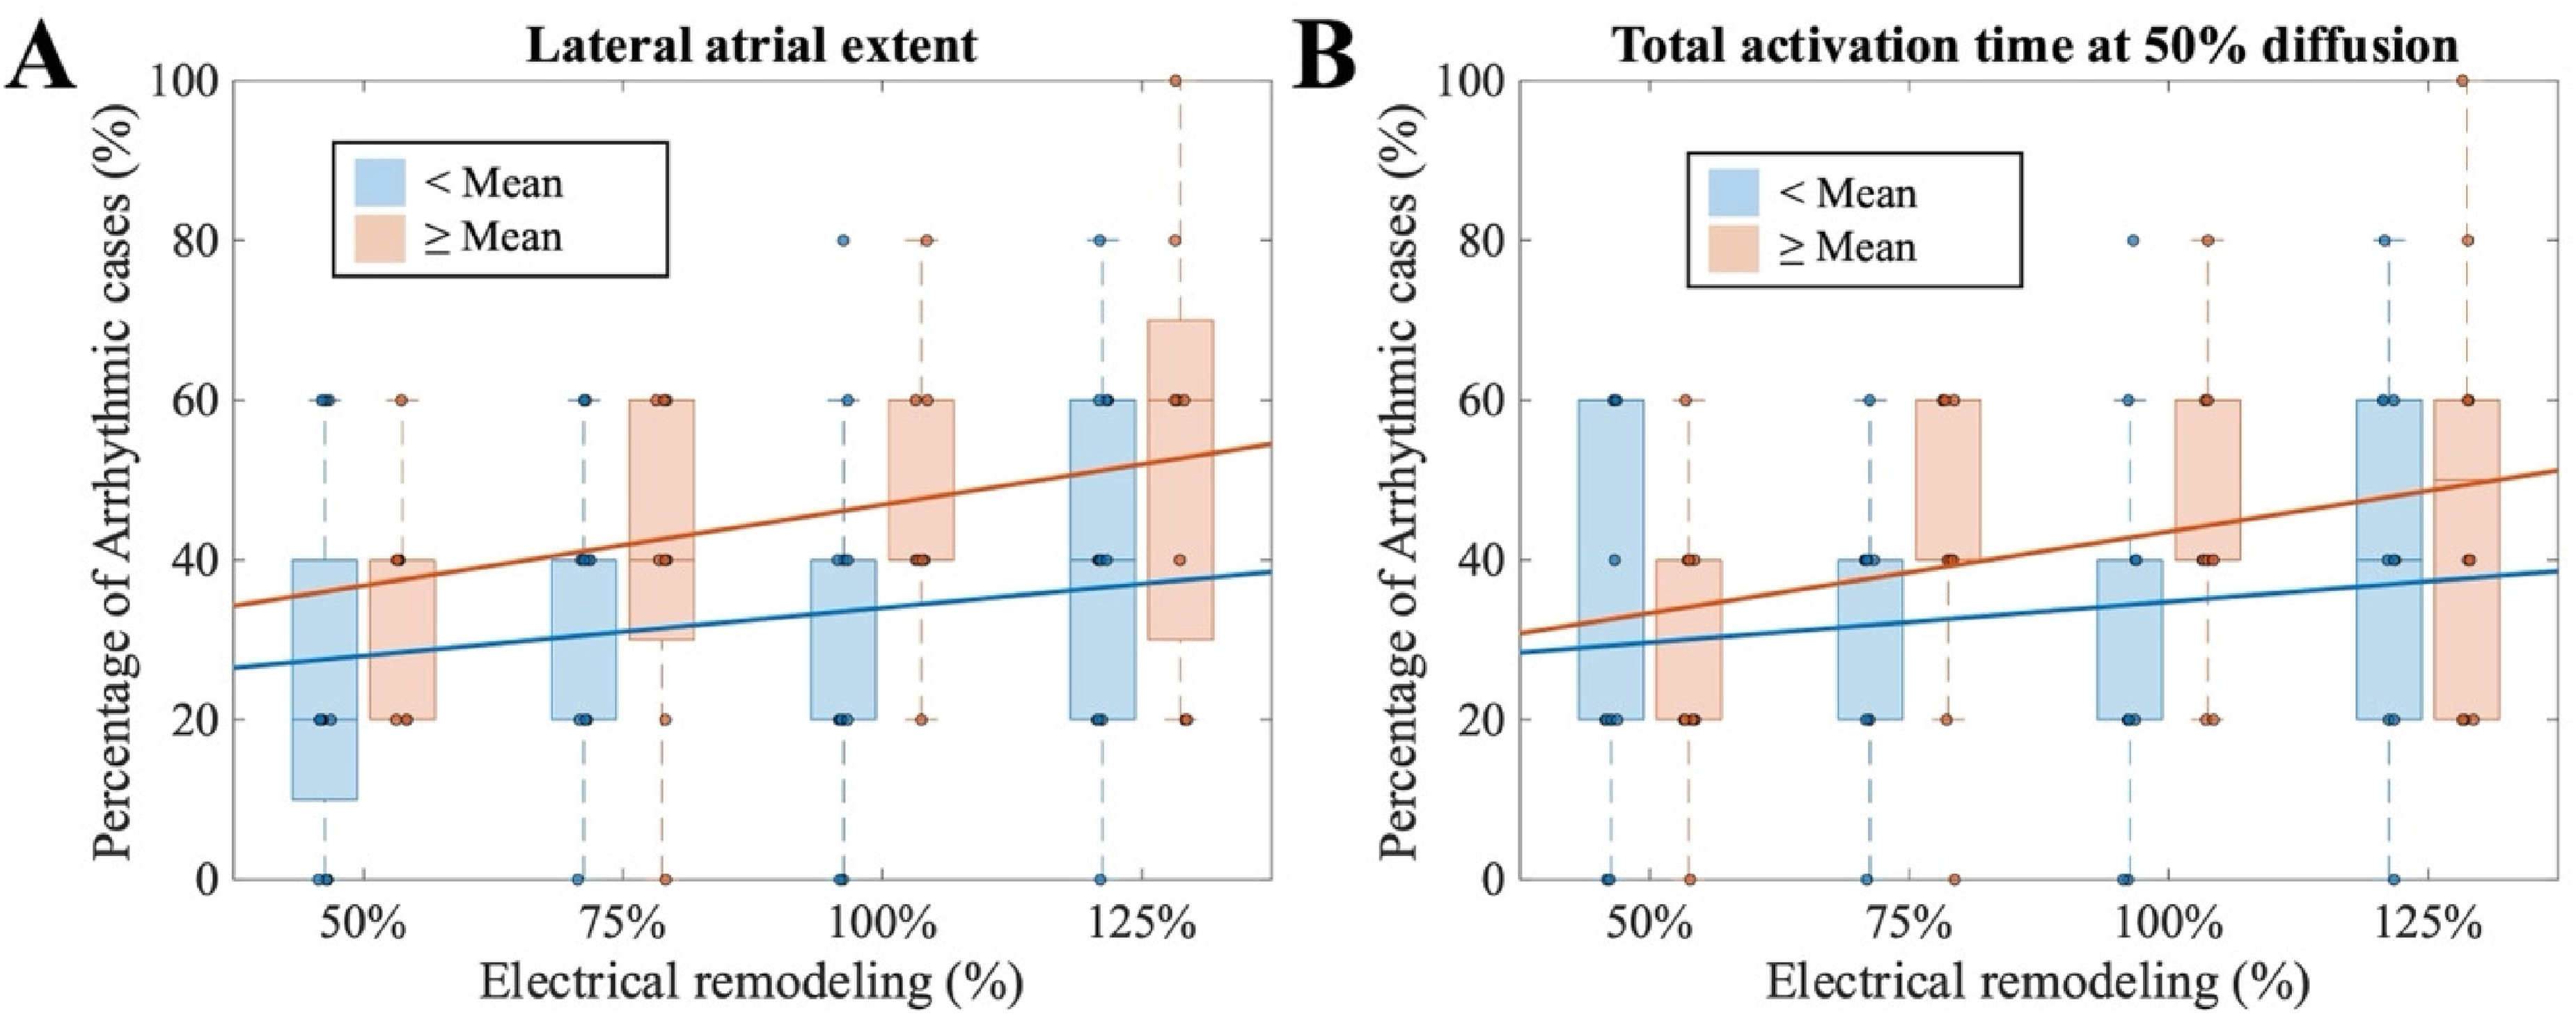
Comparison of arrhythmic case rates under 50% diffusion and {50, 75, 100, 125}% remodeling with: (A) lateral atrial extent; (B) total activation time at 50% diffusion.
A comparable trend was observed for sinus rhythm TACT under 50% diffusion. Patients with shorter TACT (< 201 ms, i.e. the mean value of the set of anatomies considered) exhibited relatively stable AF inducibility (30% vs 42% across remodeling levels), whereas patients with longer TACT demonstrated a marked increase in AF incidence (28–50%, Figure 5(B)). These findings indicate that both LAE and TACT modulate the degree to which electrical remodeling translates into AF progression.
Discussion
In this study, we examined a virtual cohort of 20 bi-atrial geometries and 160 virtual patients across 960 simulations, including variability in electrical remodeling, diffusion properties, and stimulus location, to robustly assess AF inducibility. Unlike approaches relying solely on total atrial volume, 8 we used geometries with a representative range of anatomical and electrophysiological features, which allowed us to study how these biomarkers influence both AF inducibility and the type of arrhythmic patterns observed.
While the dependence of arrhythmia vulnerability on electrophysiological wavelength and available tissue area is well established, the primary contribution of this study lies in quantitatively characterizing how inter-individual anatomical variability modulates these known biophysical relationships. Rather than proposing new arrhythmogenic mechanisms, we systematically evaluate how differences in atrial geometry modulate the relative impact of conduction, refractoriness, and tissue extent on arrhythmia inducibility. By decoupling anatomical variability from electrophysiological remodeling and stimulation conditions, this framework enables the isolated assessment of specific anatomical features, such as inter-atrial connections (e.g. BBL) and atrial size (e.g. LAE), on reentry formation, maintenance, and organization. This allowed us to determine how patient-specific structural traits bias arrhythmia dynamics even under identical electrophysiological conditions.
Simulations under sinus rhythm produced TACTs that were qualitatively consistent with experimental observations and varied across geometries, with TACT maps closely recapitulating physiological activation patterns (Figure 2(A)), thereby supporting the validity of our modeling approach.28,33,34 Arrhythmias could be induced in all geometries, with inducibility rates ranging from 20% to 70%, and both left atrial and right atrial stimulation generated arrhythmias, confirming the necessity of including RA structures in computational geometries (Figure 2(D) and 4(A)). 13 By analyzing CL dispersion, we further categorized arrhythmia type (Figure 2(B) and (C)) and found that LA stimulation induced a higher proportion of disorganized arrhythmias than RA stimulation (Figure 3(B)), as observed in experimental and clinical studies.35,36 It should be noted that this classification reflects differences in activation organization and underlying mechanisms, rather than a direct clinical diagnosis, and is therefore related to (but not strictly equivalent to) the distinction between AF and AFlut. Similarly, the pacing protocol employed in this study was designed to systematically probe atrial vulnerability and inducibility under controlled conditions, rather than to reproduce spontaneous AF initiation driven by isolated ectopic triggers or pulmonary vein-like premature beats, as commonly done in computational investigations of atrial arrhythmia mechanisms.9,24,29
As expected, 24 larger electrical remodeling and reduced diffusion increased arrhythmic vulnerability. However, atrial anatomical measurements modulated arrhythmia dynamics more strongly than classical electrophysiological biomarkers. In particular, SVC-to-IVC distance significantly separated the two main groups (p = 0.03), whereas TACT did not, either at 25% diffusion (p = 0.81) or at 50% diffusion (p = 0.59). Overall, anatomical measurements showed more consistent associations with AF dynamics than electrophysiological biomarkers across the different analyses performed. In particular, atrial size and BBL repeatedly emerged as markers associated with increased arrhythmic inducibility. Their persistence across complementary sensitivity analyses suggests that patient-specific atrial geometry and interatrial conduction pathways may play an important role in modulating arrhythmia susceptibility. In contrast, TACT measured in sinus rhythm simulations did not correlate with arrhythmic susceptibility: virtual patients with TACT lower than the average exhibited 43 ± 16% of arrhythmic cases, compared with 48 ± 13% for virtual patients with TACT higher than average TACT (p = 0.31).
From a clinical perspective, we further evaluated atrial volumes as readily accessible imaging biomarkers derived from cardiac computed tomography (CT) or cardiac magnetic resonance (CMR) imaging. Atrial volumes in the virtual cohort spanned ranges comparable to those reported in clinical imaging studies (Supplemental Figure 2A). While atrial volumes were not significantly associated with overall arrhythmic inducibility after correction for multiple comparisons, right atrial volume was associated with the type of induced arrhythmia, distinguishing organized from disorganized dynamics (Supplemental Figure 2B). These findings suggest that volumetric remodeling may be more informative for characterizing arrhythmia organization rather than overall arrhythmia burden.
Notably, we demonstrated that atrial anatomies could be grouped based on specific parameters to predict both their susceptibility to arrhythmia and their dependence on the extent of AF progression (Figure 5(A) and (B)). In particular, a larger LAE was associated with greater sensitivity to remodeling, reinforcing the notion that structural enlargement amplifies pro-arrhythmic effects. Likewise, differences in sinus rhythm TACT further stratified patients according to their progression of AF, with longer conduction times predisposing to a stronger remodeling-dependent increase in inducibility. Together, these observations highlight that both geometrical and electrophysiological features interact to shape the degree to which electrical remodeling translates into arrhythmia vulnerability, supporting the value of patient-specific anatomical parameters as predictors of AF behavior.
In contrast, several geometric descriptors investigated in this study, such as interatrial distances or the effective length of Bachmann's bundle, are not routinely measured in clinical electrophysiology practice but were introduced as mechanistic biomarkers to elucidate structure–function relationships underlying atrial arrhythmogenesis. In this context, clinically established volumetric measures and more advanced geometric descriptors should be regarded as complementary rather than alternative markers. Both clinically established volumetric measures and more advanced geometric features can be extracted from the same CT or CMR datasets, highlighting the potential of imaging-based workflows to support both clinical assessment and research-oriented substrate characterization.
Within this framework, the use of a virtual cohort allowed systematic exploration of remodeling parameter space, revealing interactions between anatomy and electrophysiology that would be difficult to capture in clinical datasets alone, and providing mechanistic insight into the conditions that promote organized versus disorganized reentry.
Limitations
Several limitations should be acknowledged. First, fibrosis patterns were not incorporated into the simulations, 13 although their effects were indirectly represented through a global reduction in diffusion properties. While central to AF, incorporating spatially resolved fibrosis distributions would require poorly constrained assumptions and could obscure the role of anatomy, which is the focus of the present study.
Similarly, electrical remodeling was implemented as a global modulation of ionic currents acting on region-specific baseline properties, without introducing regional remodeling gradients (e.g. LA vs RA or posterior wall). While such gradients are known to exist, current experimental data are insufficient to robustly parameterize their variability at the population level, and their inclusion would require highly speculative assumptions.
In addition, the spatial discretization of the atrial models represents an additional limitation, as the use of an unstructured mesh with an average inter-nodal spacing of approximately 0.5 mm may influence absolute arrhythmia inducibility, although previous studies 9 suggest that qualitative re-entrant patterns and driver localization are preserved across moderate variations in mesh resolution. Recent convergence analyses indicate that atrial re-entry dynamics obtained at 400 μm are qualitatively comparable to those at finer resolutions (100–200 μm), without numerical conduction block or spurious wave break-ups, despite some dependence of conduction velocity on spatial resolution. 8
With respect to the simulated cohort, although only 20 bi-atrial geometries were included, future studies should expand both geometry number and pacing site coverage, as larger datasets allow more robust assessment of arrhythmia vulnerability across diverse anatomical and remodeling conditions. 10 Notably, despite the limited number of geometries, the selected anatomies span the central region of the original statistical shape model and fall within clinically reported atrial volume ranges (Supplemental Figures 1 and 2A), supporting the generalizability of the main anatomical trends identified in this study.
Finally, incorporating pharmacological interventions and ablation therapies in future simulations could enable correlations between patient-specific anatomical and electrophysiological characteristics and therapeutic response. 8 The approach could also be extended by integrating machine learning models to predict arrhythmia susceptibility and guide patient-specific interventions.
Clinical implications
This work's clinical relevance lies in using virtual cohorts to enhance patient-specific modeling and personalize AF treatment by identifying anatomical biomarkers, such as LAE or BBL, of vulnerability and prognosis. Incorporating real-world measures like anatomical size or P-wave duration can further refine models, supporting efforts to prevent AF progression and improve clinical outcomes.
Conclusions
This study quantifies how patient-specific atrial geometry acts as a primary modulator of AF susceptibility and arrhythmia organization. Rather than introducing new clinical paradigms, our findings confirm that macro-anatomical features are active drivers of the arrhythmic substrate. In particular, we found that RA volume is strongly associated with a higher prevalence of organized rhythms, suggesting that larger atrial chambers provide the necessary space for stable macro-reentrant circuits to establish. This result reinforces the growing consensus on the importance of including the right atrium in computational models, as neglecting the bi-atrial nature of the substrate would fail to capture the full spectrum of arrhythmia organization. Furthermore, our results highlight that anatomical biomarkers such as LAE and BBL, often overlooked in modeling studies, must be carefully accounted for in computational frameworks. Their critical influence on conduction patterns demonstrates that biophysical models cannot neglect these dimensions if they aim to achieve physiological fidelity.
Supplemental Material
sj-docx-1-cvd-10.1177_20480040261455938 - Supplemental material for Virtual population-based analysis of anatomical and electrophysiological risk markers for atrial fibrillation
Supplemental material, sj-docx-1-cvd-10.1177_20480040261455938 for Virtual population-based analysis of anatomical and electrophysiological risk markers for atrial fibrillation by Giada S. Romitti, María Termenón-Rivas, Alejandro Liberos and Miguel Rodrigo in JRSM Cardiovascular Disease
Footnotes
Author contributions
Conceptualization: GSR, MTR, AL, and MR. Investigation: GSR, AL, and MR. Methodology development: GSR, MTR, AL, and MR. Data analysis: GSR. Results visualization: GSR. Validation: GSR, MTR, AL, and MR. Supervision: AL and MR. Funding acquisition: AL and MR. Writing original draft: GSR. Review and editing: GSR, MTR, AL, and MR. All authors read and approved the final manuscript.
Funding
The authors disclosed receipt of the following financial support for the research, authorship, and/or publication of this article: GSR, MTR, AL, MR were funded by Generalitat Valenciana Grant AICO/2021/318 (Consolidables 2021) and CIAICO/2024/247 (Consolidables 2024), Grants PID2020-114291RB-I00, PID2023-148702OB-I00, and EraNet PCI2024-153442 funded by MCIN/10.13039/501100011033 and by “ERDF A way of making Europe”. GSR was also supported by grant PRE2021-100124, and MTR by grant CIACIF/2023/451.
Declaration of conflicting interests
The authors declared no potential conflicts of interest with respect to the research, authorship, and/or publication of this article.
Supplemental material
Supplemental material for this article is available online.
References
Supplementary Material
Please find the following supplemental material available below.
For Open Access articles published under a Creative Commons License, all supplemental material carries the same license as the article it is associated with.
For non-Open Access articles published, all supplemental material carries a non-exclusive license, and permission requests for re-use of supplemental material or any part of supplemental material shall be sent directly to the copyright owner as specified in the copyright notice associated with the article.