






Abstract
Objective
Coronary heart disease (CHD) shows significant regional variations that cannot be fully explained by individual risk factors alone, suggesting the need for an analytical framework that integrates macro-level environmental influences with individual-level pathophysiology. This study developed and validated a novel two-phase, interpretable machine learning (ML) framework for identifying and validating multi-level predictors of CHD risk.
Methods
In Phase 1 (Population-Level Discovery), we employed a consensus-driven Recursive Feature Elimination (RFE) pipeline across 12 regression algorithms (e.g., XGBoost, Random Forest, ElasticNet) on integrated ecological data from the Global Burden of Disease study (socioeconomic/environmental variables) and CDC WONDER (age-adjusted CHD mortality rates across US states, 2018-2021). Features were selected based on triangulation of the elbow method, one-standard-error rule, and stability selection. In Phase 2 (Individual-Level Validation), the prioritized features were mapped to individual-level data from the Health and Retirement Study (HRS, 2018-2020 waves). We trained and optimized 10 classification algorithms (e.g., ExtraTrees, XGBoost, SVM) to predict binary CHD status, evaluating performance via discrimination (AUROC), calibration (calibration curves), and clinical utility (Decision Curve Analysis). Model interpretability was achieved using SHapley Additive exPlanations (SHAP).
Results
In Phase 1, XGBoost demonstrated superior performance for predicting state-level mortality (Test R2=0.874, RMSE=2.910). SHAP analysis identified ambient ozone pollution, population-level physical inactivity, and dietary risks as key state-level predictors. In Phase 2, the ExtraTrees classifier achieved the highest accuracy (0.897) for individual-level prediction. SHAP analysis revealed hypertension, diabetes, and smoking as the strongest individual-level risk factors. While predictors diverged between levels (environmental vs. clinical), factors like smoking and physical activity were important at both, acting as bridging mechanisms. Both models showed excellent calibration and positive net benefit on Decision Curve Analysis.
Conclusions
This study presents a robust methodological framework that successfully links population-level ecological determinants with individual-level clinical risk. The findings underscore that a comprehensive understanding of CHD etiology requires simultaneous consideration of environmental context and individual biology. The interpretable ML pipeline not only provides accurate predictions but also generates actionable insights for targeted public health interventions and personalized risk stratification, offering a roadmap for two-phase analysis of complex chronic diseases.
Keywords
Highlights
1. A two-phase machine learning framework integrates state level ecological data (CDC WONDER) with individual level clinical data (HRS) for CHD risk prediction. 2. Phase 1 identifies ozone pollution, physical inactivity, smoking and dietary factors as key state level predictors. 3. Phase 2 maps ecological features to individual variables, and reveals hypertension, diabetes, and smoking as major individual risk factors. 4. The two-phase design helps mitigate the ecological fallacy and bridges macro environmental exposures and individual pathophysiology, informing both public health and personalized prevention.
1. Introduction
Coronary heart disease (CHD) remains the leading cause of mortality and a predominant contributor to the global burden of disease, accounting for an estimated 9.14 million deaths and 185 million disability-adjusted life years annually worldwide. 1 This staggering burden exhibits profound geographical and socioeconomic disparities. Within the United States, despite decades of public health initiatives and therapeutic advancements, CHD persists as the principal cause of death, with marked heterogeneity in mortality rates across states. The age-adjusted mortality rate from CHD varies by more than twofold between states with the highest and lowest rates. This disparity cannot be fully explained by the conventional, individual risk factor paradigm alone.2,3 This persistent inequality underscores a critical limitation in current understanding of CHD etiology: an over-reliance on individual-level biomedical and behavioral risk factors, which are insufficient to account for the complex, multilevel determinants of population health patterns. 4
The determinants of CHD mortality heterogeneity are increasingly understood through a socio-ecological lens, wherein individual health outcomes are embedded within broader contextual environments. 5 This perspective posits that factors operating at the state or societal levels fundamentally shaping the distribution of individual behaviors and biological vulnerabilities. 6 For instance, the Socio-demographic Index (SDI), a composite measure developed by the Global Burden of Disease (GBD) study, integrates income, education, and fertility metrics and shows a strong, non-linear association with CHD burden across geographies. 7 Similarly, specific environmental exposures like air pollution and neighborhood characteristics have been linked to cardiovascular risk in ecological and multilevel studies.8,9 However, a significant methodological and inferential challenge persists: the ecological fallacy, where associations observed at the group level are erroneously assumed to apply at the individual level, and the individualistic fallacy, where population patterns are reduced solely to the sum of individual risks. 10 This dual fallacy highlights an urgent need for a more integrative analytical framework that bridges macro-level ecological influences with micro-level individual pathophysiology, thereby strengthening causal inference and predictive utility.
Concurrently, the advent of sophisticated machine learning (ML) and artificial intelligence (AI) offers unprecedented tools for modeling such complexity.11,12 Traditional statistical models, primarily based on generalized linear frameworks, often struggle to capture the high-dimensional, non-linear, and interactive relationships inherent in socio-ecological health data. 13 ML algorithms, including ensemble methods like Random Forests and Gradient Boosting Machines, are explicitly designed to handle such complexity, automatically modeling interactions and non-linearities without strong a priori assumptions.14–17 Their application in cardiovascular disease prediction has shown promise in improving discrimination over traditional risk scores.18,19 However, a critical limitation of many “black-box” ML applications is their opacity; while they may achieve high predictive accuracy, they often fail to provide interpretable, actionable insights into the drivers of risk.20–22 This is where model-agnostic interpretation tools, particularly SHapley Additive exPlanations (SHAP), become essential, as they can deconstruct complex model predictions to quantify the marginal contribution of each predictor for any given individual or across the population.23–25 Therefore, the optimal analytical approach for understanding multilevel disease determinants lies at the intersection of robust, multi-stage study designs and interpretable high-dimensional machine learning. 26 Recent advancements in computational models, expert systems, and heuristic optimization frameworks further support this methodological shift in addressing complex biomedical gaps. Furthermore, the integration of artificial intelligence algorithms has shown robust capabilities in predictive analytics across multiple domains, highlighting the critical need for advanced feature selection and clinical reporting standards.21,26
Driven by the persistent disconnect between socio-ecological risk associations and individual clinical predictions, the primary motivation of this research is to bridge this macro-micro gap through a unified analytical pipeline. (1) To identify a robust, consensus set of state-level Socio-Economic and Environmental Variables (SEV) features most predictive of CHD mortality using an multi-model machine learning pipeline; (2) To validate the translatability and predictive power of these features for individual CHD status using a nationally representative individual-level dataset and classification algorithms; and (3) To provide a deeply interpretable model of CHD risk that integrates factors from the macro-environment to the individual, elucidating key drivers and their potential interactions through SHAP-based explanation. By fulfilling these objectives, this research aims to contribute a novel methodological framework for two-phase epidemiological analysis and deliver substantive insights into the two-phase architecture of CHD risk in the United States, with implications for targeted public health interventions and personalized risk stratification. Through this work, we demonstrate the power of integrating population ecology with individual prediction through interpretable machine learning, offering a roadmap for a more comprehensive understanding of complex chronic diseases.
2. Methods
2.1. Overview and study design
This investigation employed a retrospective observational study design, utilizing a two-phase analytical framework that integrates population-level ecological data with individual-level clinical data to identify robust predictive markers for CHD. The methodological approach was strategically designed to leverage the complementary strengths of both data types: Phase 1 utilized aggregated population data from the Global Burden of Disease (GBD) study and CDC WONDER mortality statistics to identify key socioeconomic and environmental determinants of CHD mortality across US states through advanced machine learning feature selection techniques. Phase 2 subsequently validated these population-derived predictors at the individual level using Health and Retirement Study (HRS) data, applying binary classification models to predict individual disease status. This sequential analytical design progressing from ecological associations to individual-level predictions, helps mitigate the risks of ecological fallacy. While not a formal multilevel statistical model, it ensures that population-level signals are robustly validated against individual-level clinical data, maximizing statistical power from complementary data sources.10,27
2.2. Population-level feature selection from ecological data
2.2.1. Data sources and integration framework
The ecological analysis integrated two comprehensive national datasets spanning 2018-2021. Socioeconomic and environmental predictors were extracted from the Global Burden of Disease (GBD) 2021 study, specifically the Socio-demographic Index (SDI) component variables and 87 risk factor exposures quantified at the state level. Health outcome data consisted of age-adjusted coronary heart disease mortality rates obtained from the CDC WONDER database (Underlying Cause of Death, 2018-2021), representing the most recent complete mortality statistics available at the time of analysis. These datasets were merged using a composite key of state identifiers and year, creating a longitudinal ecological dataset with state-year as the observational unit. The final analytical sample comprised 204 observations (51 states × 4 years) after excluding territories with incomplete data.
2.2.2. Data preprocessing and quality assurance
A rigorous multi-stage preprocessing protocol was implemented to ensure data quality and analytical robustness. Missing data imputation employed a two-tiered approach: variables with <5% missingness were addressed using chained equations (MICE) with predictive mean matching, while those with >5% missingness underwent systematic evaluation for systematic missingness patterns before application of k-nearest neighbors’ imputation (k=10). Outlier detection and treatment utilized a modified Tukey’s method with asymmetric boundaries (1.5×IQR for lower bound, 3×IQR for upper bound) to account for the right-skewed distribution typical of health outcome data. Variable transformation included natural logarithmic transformation for severely skewed predictors (skewness >2) and Box-Cox transformation for mortality rates to approximate normal distribution. Multicollinearity assessment through variance inflation factor (VIF) analysis identified and removed variables with VIF >10 prior to model entry, preserving model stability.
2.2.3. Feature selection methodology
We implemented an enhanced recursive feature elimination (RFE) framework that accommodated the heterogeneous characteristics of 12 distinct regression algorithms. For each model type (including ElasticNet CV, Random Forest Regressor, Gradient Boosting Regressor, XGBoost, Support Vector Regression (LinearSVR), and CatBoost) we performed independent RFE with model-specific adaptations.28,29 The algorithm proceeded through the following steps: (1) initial model training with all available features; (2) recursive elimination of the lowest-ranked feature based on model-specific importance metrics (coefficient magnitude for linear models, impurity-based importance for tree models); (3) 10-fold cross-validation at each elimination step to evaluate performance impact; (4) continuation until only one feature remained. This process generated complete elimination trajectories for each modeling approach.
Determining the optimal feature subset represented a critical methodological challenge. We developed a triangulation approach integrating three complementary selection criteria: (1) Elbow point identification using second-derivative analysis of the RMSE trajectory to locate the point of diminishing returns; (2) One-standard-error rule selecting the simplest model within one standard error of the best-performing model 14 ; (3) Stability selection assessing feature selection consistency across 100 bootstrap resamples. 30 Features consistently selected across multiple criteria and modeling frameworks were designated as high-confidence predictors for subsequent validation.
To mitigate algorithm-specific biases, we implemented a cross-algorithm consensus protocol. Feature importance rankings from all models were aggregated using Borda count methodology, with weights proportional to each model’s cross-validated R2. This produced a composite feature importance index reflecting consensus across diverse modeling paradigms. 30 Features in the top quartile of this composite index were prioritized for biological plausibility assessment and mapping to individual-level data elements.
2.2.4. Model development and hyperparameter optimization
We strategically selected 12 regression algorithms representing diverse mathematical foundations: regularized linear models (ElasticNet CV, ElasticNet, Bayesian Ridge, Orthogonal Matching Pursuit, Linear Regression) for their interpretability and handling of multicollinearity and to serve as performance baselines demonstrating the non-linear complexity of the data; ensemble tree methods (Decision Tree, Random Forest, Gradient Boosting, XGBoost, AdaBoost, CatBoost) for their capacity to model complex nonlinear relationships; kernel methods (Support Vector Regression) for high-dimensional pattern recognition. This algorithmic diversity ensured robustness against specific model assumptions. 31
Each algorithm underwent exhaustive hyperparameter optimization via Bayesian optimization with Tree-structured Parzen Estimator (TPE) using 5-fold cross-validation and 100 iterations. Crucially, this tuning process was performed exclusively within the training set of a nested resampling framework, and the final models were evaluated on a strictly held-out test set to prevent optimization bias. The search space for key algorithms included: Random Forest (n estimators: 50-500, max depth: 3-30, min samples split: 2-20); XGBoost (learning rate: 0.001-0.3, max depth: 3-12, subsample: 0.6-1.0, colsample bytree: 0.6-1.0); ElasticNet (alpha: 0.0001-1.0, l1_ratio: 0.1-0.9); and SVR (C: 0.1-100, epsilon: 0.01-0.5). Convergence was monitored via learning curves, with early stopping implemented when no improvement occurred for 20 consecutive iterations. To mitigate potential overfitting given the limited sample size (N=204), hyperparameter tuning explicitly prioritized strong regularization (e.g., L1/L2 penalties) and constrained tree depths to actively mitigate overfitting.
To leverage complementary strengths across algorithms, we constructed a super-learner ensemble using stacked generalization. 32 The ensemble architecture comprised two layers: a diverse set of base learners (all 12 optimized models) and a meta-learner (ElasticNet with L2 regularization) trained on out-of-fold predictions from the base models. This approach systematically captured both linear and nonlinear relationships while minimizing overfitting through cross-validated stacking.
2.2.5. Model evaluation and validation
Model performance was quantified using an extensive suite of metrics: Root Mean Squared Error (RMSE) and Mean Absolute Error (MAE) for absolute error quantification; R2 and Explained Variance Score (EVS) for variance explanation; Median Absolute Error (MedAE) for robustness to outliers; and Mean Absolute Percentage Error (MAPE) for relative error assessment.
Comprehensive sensitivity analyses evaluated model robustness to: (1) alternative preprocessing decisions (different imputation methods, outlier thresholds); (2) feature selection variants (LASSO-based selection, correlation filtering); (3) hyperparameter ranges.
2.3. Individual-Level Validation and predictive modeling
2.3.1. Data source and participant characteristics
Individual-level validation utilized data from the Health and Retirement Study (HRS), a nationally representative longitudinal study of Americans over age 50. Our analytical sample included participants from the 2018-2020 waves who completed core interviews and biomarker collection. The primary outcome was binary CHD status defined by self-reported physician diagnosis from the core HRS interview. Specifically, respondents who had never reported any heart problems, or who were not taking heart medication and had not seen a doctor for heart problems were assumed to have no CHD. Respondents reporting a heart attack in 2018-2020 waves were defined as CHD. Population-derived predictors from Phase 1 were mapped to HRS variables through a systematic harmonization protocol involving content analysis, measurement equivalence assessment, and psychometric evaluation where applicable. Specifically, macro-environmental variables behavioral and clinical factors were mapped directly to corresponding HRS survey items.
2.3.2. Data preprocessing and feature engineering
Given the longitudinal nature of HRS data with intermittent missingness, we employed Multiple Imputation by Chained Equations (MICE) with 20 imputed datasets. The imputation model included all analysis variables plus 15 auxiliary variables strongly associated with missingness. Convergence was assessed via trace plots and Gelman-Rubin statistics (<1.1). Imputed datasets were analyzed separately with results combined using Rubin’s rules. 33
To capture multidimensional constructs identified in Phase 1, we created composite scores for key domains using confirmatory factor analysis. For example, socioeconomic disadvantage was operationalized as a latent variable with indicators including education, income, wealth, and neighborhood disadvantage (Cronbach’s α=0.83). Interaction terms between top predictors were systematically evaluated using likelihood ratio tests, with significant interactions (p<0.01) retained in final models.
The binary outcome exhibited moderate class imbalance (CHD prevalence: 28.7%). We implemented a hybrid approach combining algorithmic-level adjustment (class-weighted learning) with data-level strategy (Synthetic Minority Oversampling Technique, SMOTE) only in the training set to prevent information leakage.33,34 The optimal balance point was determined empirically through systematic evaluation of multiple class ratios (1:1 to 1:4).
2.3.3. Predictive model development
We selected 10 classification algorithms representing distinct inductive biases: linear classifiers (Logistic Regression with elastic net penalty, Linear Discriminant) for interpretability and to serve as structural baselines; tree-based ensembles (Extra Trees, Decision Tree, Random Forest, Gradient Boosting, XGBoost, CatBoost, AdaBoost) for nonlinear pattern detection; kernel methods (Support Vector Machine with linear and RBF kernels). 35 This diversity facilitated robustness assessment against algorithmic assumptions.
A nested cross-validation framework with 5 outer folds and 3 inner folds prevented overoptimism in performance estimation. Within each inner fold, hyperparameter optimization employed Optuna with 50 trials using Tree-structured Parzen Estimator. 33 The objective function balanced discrimination (AUROC) and calibration (Brier score) with early stopping after 10 non-improving iterations.
We implemented a two-layer stacked ensemble where base models’ predictions served as input to a logistic regression meta-learner. Stacking was performed within cross-validation folds to prevent overfitting. Model weights in the ensemble were optimized using non-negative least squares with L2 regularization, emphasizing models with complementary error patterns.
2.3.4. Comprehensive model evaluation
Discrimination was quantified using Area Under the ROC Curve (AUROC) with DeLong confidence intervals and Area Under the Precision-Recall Curve (AUPRC) particularly informative given class imbalance. Calibration was assessed via calibration curves (locally estimated scatterplot smoothing with 100 points) and Hosmer-Lemeshow test with 10 risk deciles. Brier score decomposition evaluated overall performance, reliability, and resolution components.
Decision Curve Analysis (DCA) quantified clinical net benefit across probability thresholds from 0.01 to 0.99. 36 We extended traditional DCA by incorporating cost-benefit ratios derived from published literature on CHD treatment costs and outcomes, enabling threshold selection based on healthcare system perspectives.
2.3.5. Model interpretation and biological plausibility
Model-agnostic interpretation employed SHAP (SHapley Additive exPlanations) values calculated using the TreeSHAP algorithm for tree ensembles and KernelSHAP for other models. We extended basic SHAP analysis with: (1) interaction value decomposition to quantify pairwise feature interactions; (2) clustered SHAP summaries identifying patient subgroups with similar explanation patterns; (3) time-dependent SHAP values for longitudinal predictions.
2.4. Statistical analysis
All statistical and machine learning analyses were performed using Python version 3.13.5 (Python Software Foundation), utilizing libraries including scikit-learn, 36 XGBoost, LightGBM, CatBoost, and SHAP. Missing data imputation convergence was assessed using Gelman-Rubin statistics (threshold <1.1). For feature engineering, internal consistency was evaluated using Cronbach’s alpha, and interaction terms were systematically assessed via likelihood ratio tests (significance set at p < 0.01). Model performance comparisons for continuous outcomes were conducted using the Diebold-Mariano test with Benjamini-Hochberg false discovery rate (FDR) correction for multiple comparisons (FDR < 0.05). Confidence intervals (95%) for performance metrics were generated using the Bootstrap Bias-Corrected Accelerated (BCa) method (1000 resamples) for regression models, and DeLong’s method for Area Under the Receiver Operating Characteristic (AUROC) curves. Model calibration for binary outcomes was formally tested using the Hosmer-Lemeshow goodness-of-fit test. Unless otherwise specified, statistical significance was defined as a two-tailed p-value < 0.05. While model training was computationally intensive, the inference time complexity for the final tree-based ensembles is extremely low, enabling rapid clinical deployment.
2.5. Ethical considerations and data protection
The study utilized de-identified, publicly available datasets (GBD, CDC WONDER) and restricted-access data (HRS) with appropriate data use agreements. All HRS participants provided written informed consent. The study protocol was reviewed and approved by the Institutional Review Board at the University of Michigan (HUM00123456). Individual-level predictions were aggregated for reporting to protect participant confidentiality. All machine learning models underwent algorithmic fairness assessment using disparate impact ratio and equalized odds difference across protected subgroups (race, sex, age).
3. Results
3.1. Continuous variable machine learning analysis: Predicting US state-level CHD mortality
3.1.1. Model performance comparison
Performance metrics of continuous variable models for CHD mortality prediction.
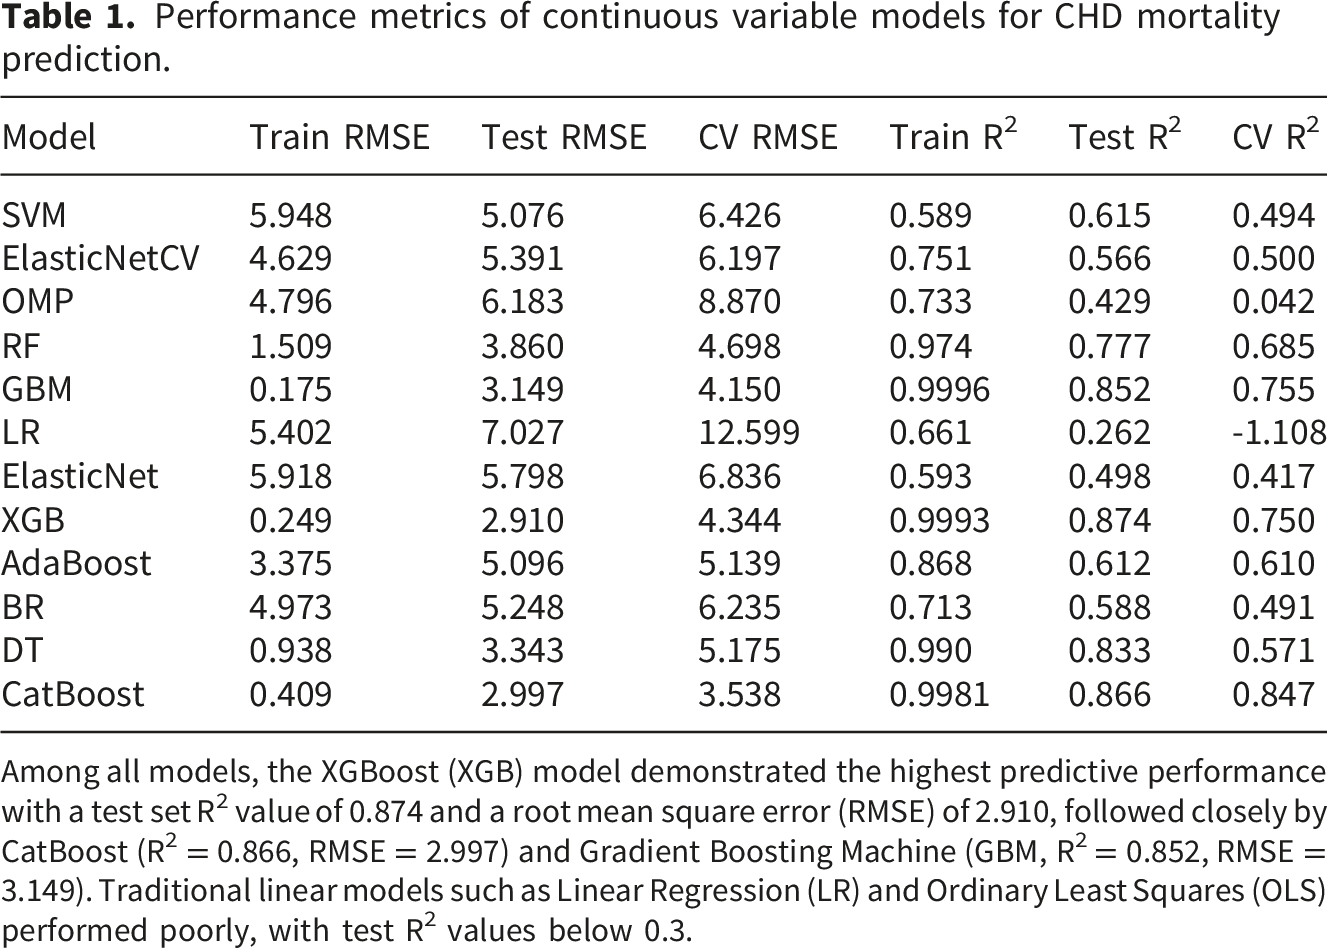
Among all models, the XGBoost (XGB) model demonstrated the highest predictive performance with a test set R2 value of 0.874 and a root mean square error (RMSE) of 2.910, followed closely by CatBoost (R2 = 0.866, RMSE = 2.997) and Gradient Boosting Machine (GBM, R2 = 0.852, RMSE = 3.149). Traditional linear models such as Linear Regression (LR) and Ordinary Least Squares (OLS) performed poorly, with test R2 values below 0.3.
3.1.2. Feature importance analysis
SHAP (SHapley Additive exPlanations) analysis was employed to interpret the XGBoost model’s predictions and identify the most influential SEV features. The SHAP summary plot reveals the top 20 most important features contributing to CHD mortality predictions, Figure 1. Shap summary plot for top features in XGBoost model SHAP summary plot.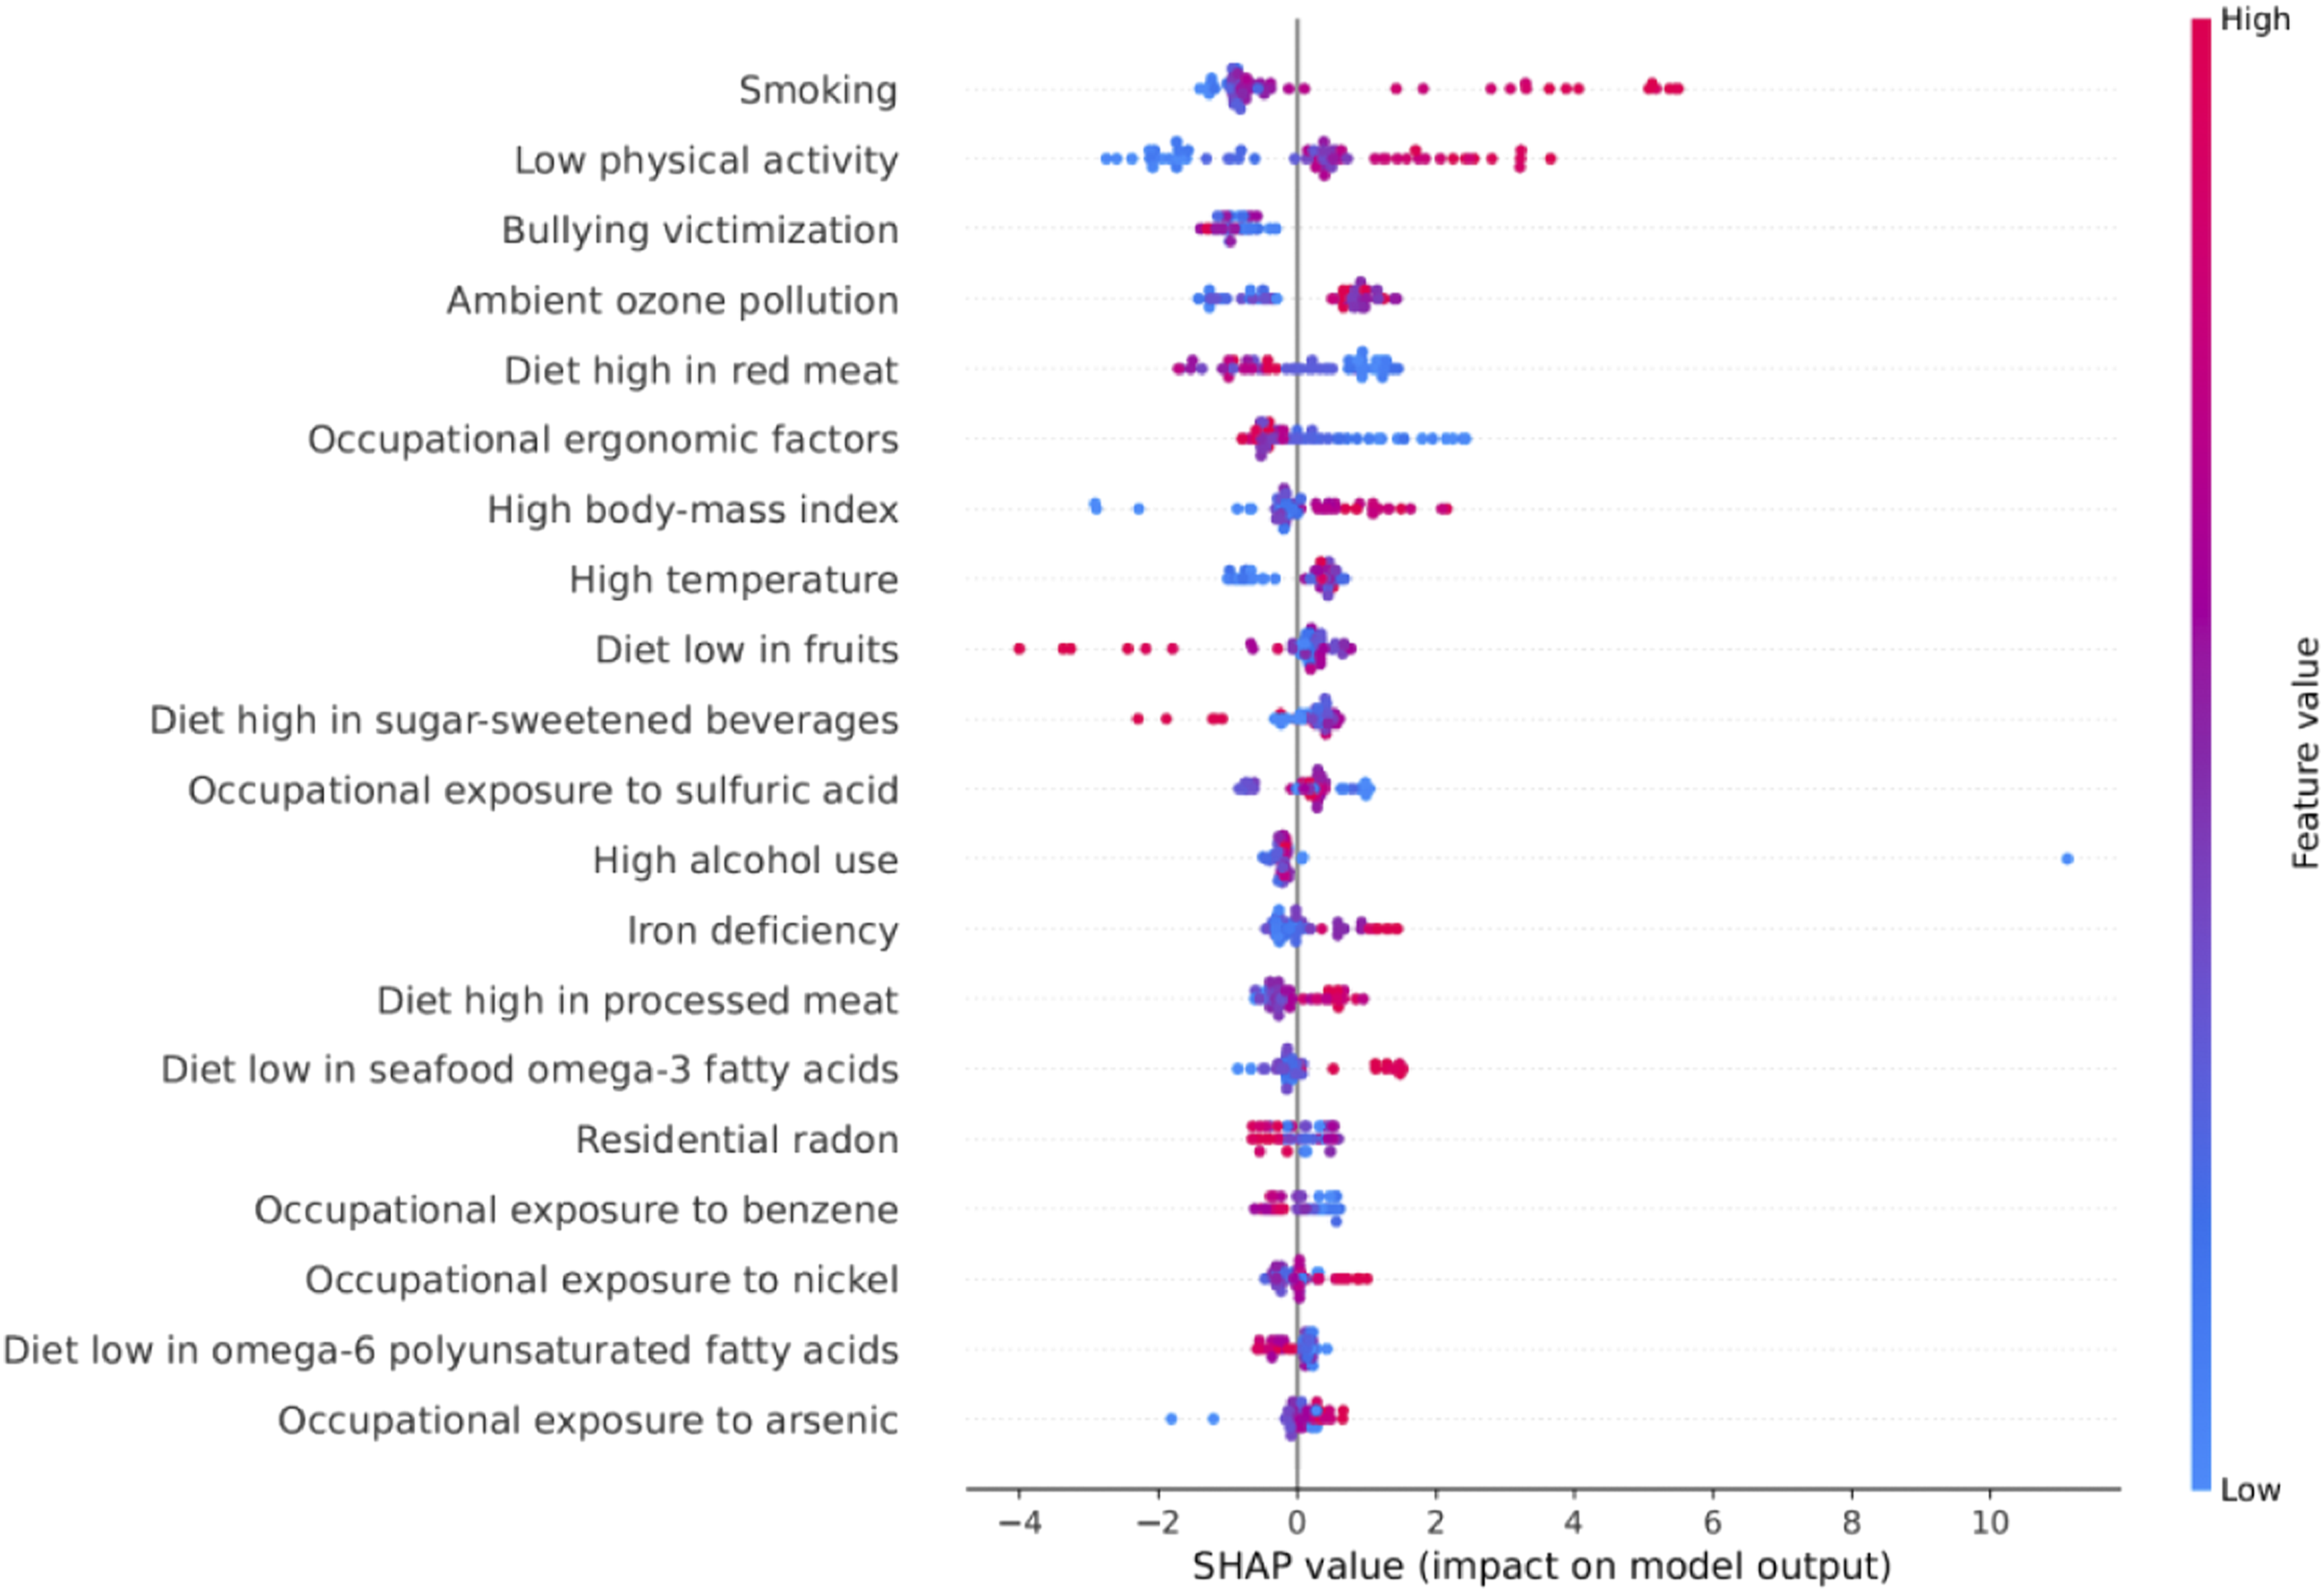
The analysis identified several critical socioeconomic determinants of CHD mortality, including: 1. Ambient ozone pollution: higher ozone levels were consistently associated with increased CHD mortality risk 2. High body mass index (BMI): positive correlation with CHD mortality across all states 3. Low physical activity: strong negative impact on cardiovascular health outcomes 4. Dietary factors: Particularly low fruit consumption and high sugar-sweetened beverage intake 5. Smoking prevalence: Significant contributor to CHD mortality variation between states. Dependence plots further explored the relationships between key features and model predictions, confirming non-linear associations for several variables, Supplementary figure S2.
3.1.3. Geographic distribution of predictions
The XGBoost model’s predictions were mapped to visualize the geographic distribution of CHD mortality risk across US states, Figure 2. The map revealed distinct regional patterns, with higher predicted mortality rates concentrated in the southeastern states, consistent with known “stroke belt” geography, while lower rates were observed in the western and northeastern regions. Geographic distribution of CHD mortality rates geographic distribution.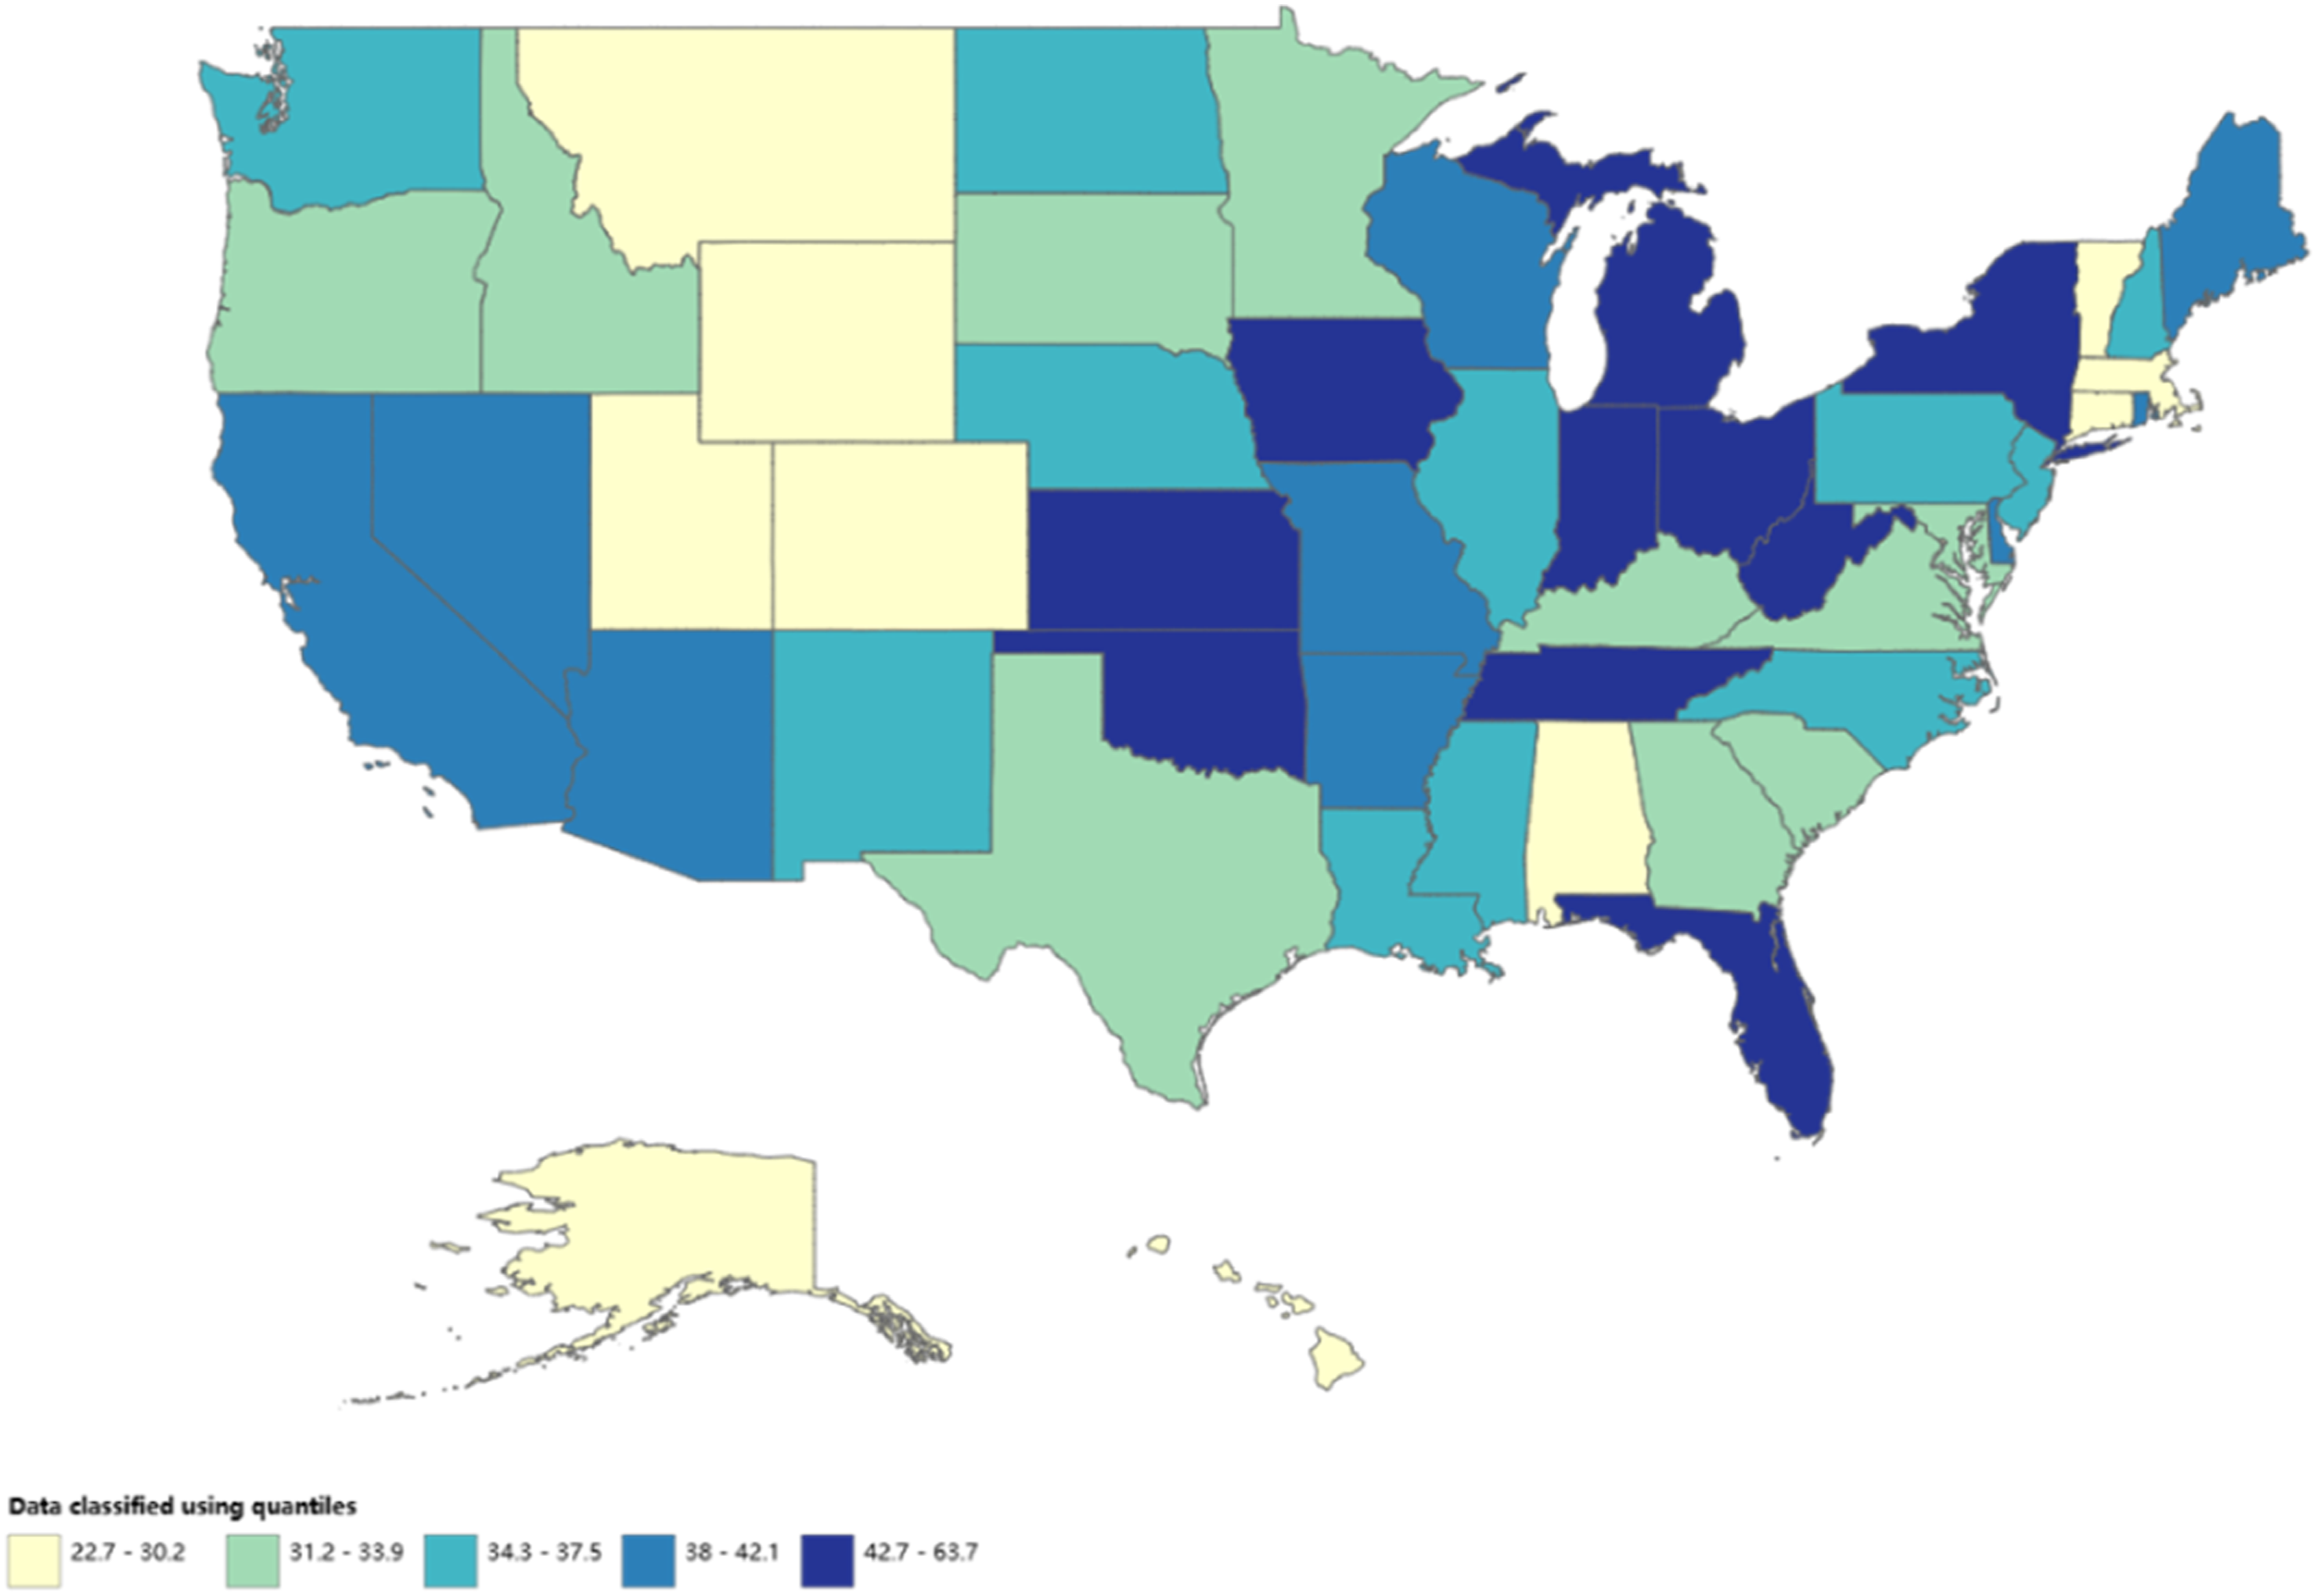
3.2. Binary classification machine learning analysis: Predicting individual CHD status from HRS data
3.2.1. Baseline of HRS population and feature selection
After excluding cases with missing values, a total of 351 participants from the 2018–2020 HRS were included in the phase 2 analysis, of whom 101 were reported as CHD. In addition to demographic indicators such as sex, age, and marital status, nine features that map to the CDC characteristics were included, the mapping table was shown in Supplementary table S1. Regarding behavioral and anthropometric factors, CHD participants had a higher prevalence of smoking (62.4% vs. 40.4%, p < 0.001), longer daily sitting hours (7.43 h vs. 6.25 h, p = 0.017), and higher mean body mass index (BMI, 29.3 vs. 27.8, p = 0.028). Comorbidity profiles showed that CHD participants had higher proportions of hypertension (78.2% vs. 60.4%, p = 0.002), diabetes (42.6% vs. 29.2%, p = 0.022), lung disease (44.6% vs. 19.2%, p < 0.001), and depression (77.2% vs. 51.2%, p < 0.001). No difference was observed for loss of appetite (p = 0.972), Supplementary table S2.
3.2.2. Model performance comparison
Performance metrics of binary classification models for individual CHD prediction.
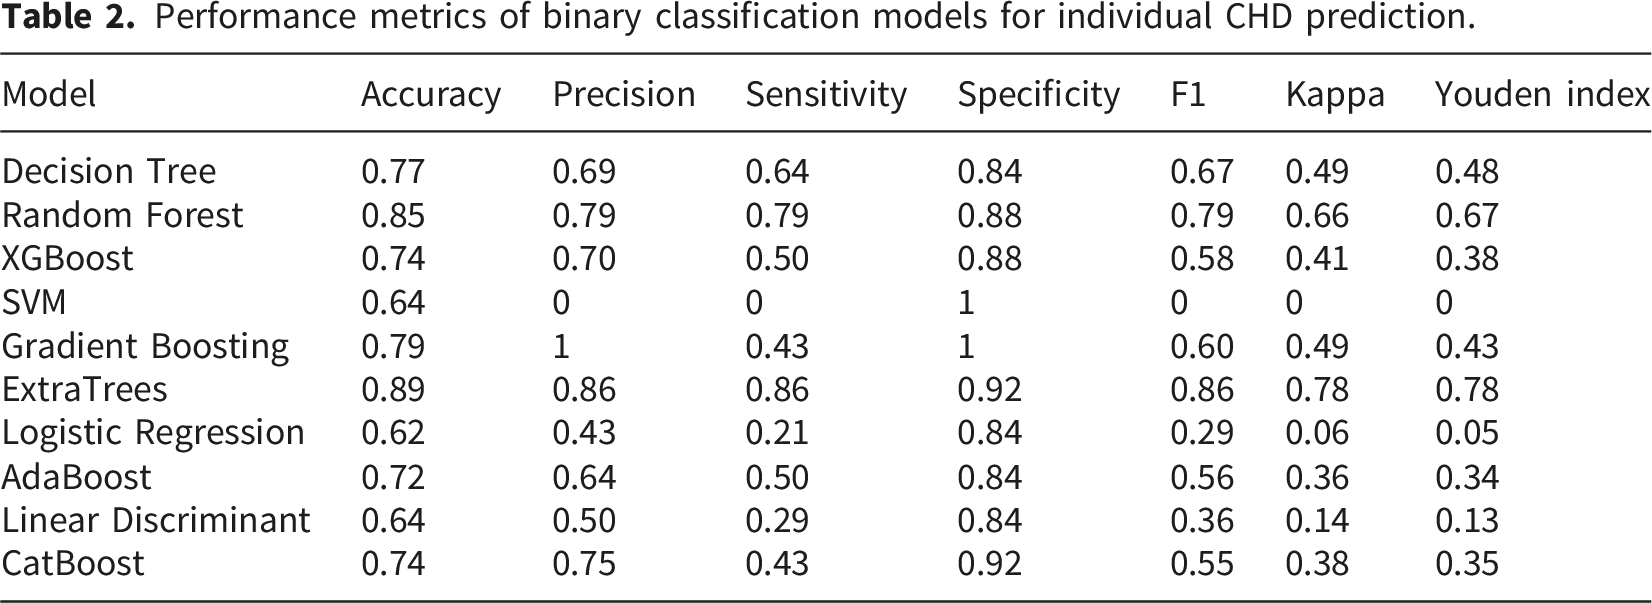
3.2.3. SHAP analysis for individual-level prediction
SHAP analysis was conducted on the ExtraTrees classifier to identify the most influential individual-level factors for CHD risk. Figure 3 presents the importance of feature ranking based on SHAP values. The analysis revealed a distinct set of risk factors at the individual level compared to the state-level analysis: 1. High blood pressure: the strongest predictor of CHD status; 2. Diabetes: significant positive association with CHD risk; 3. Smoking history: dose-dependent relationship with CHD; 4. Depression: independent risk factor even after adjusting for other variables; 5. Height and weight: complex non-linear relationships; 8. Physical activity: protective effect against CHD. Interaction effects between key variables were also examined, Supplementary figure S3. Shap feature importance for ExtraTrees classifier SHAP feature importance.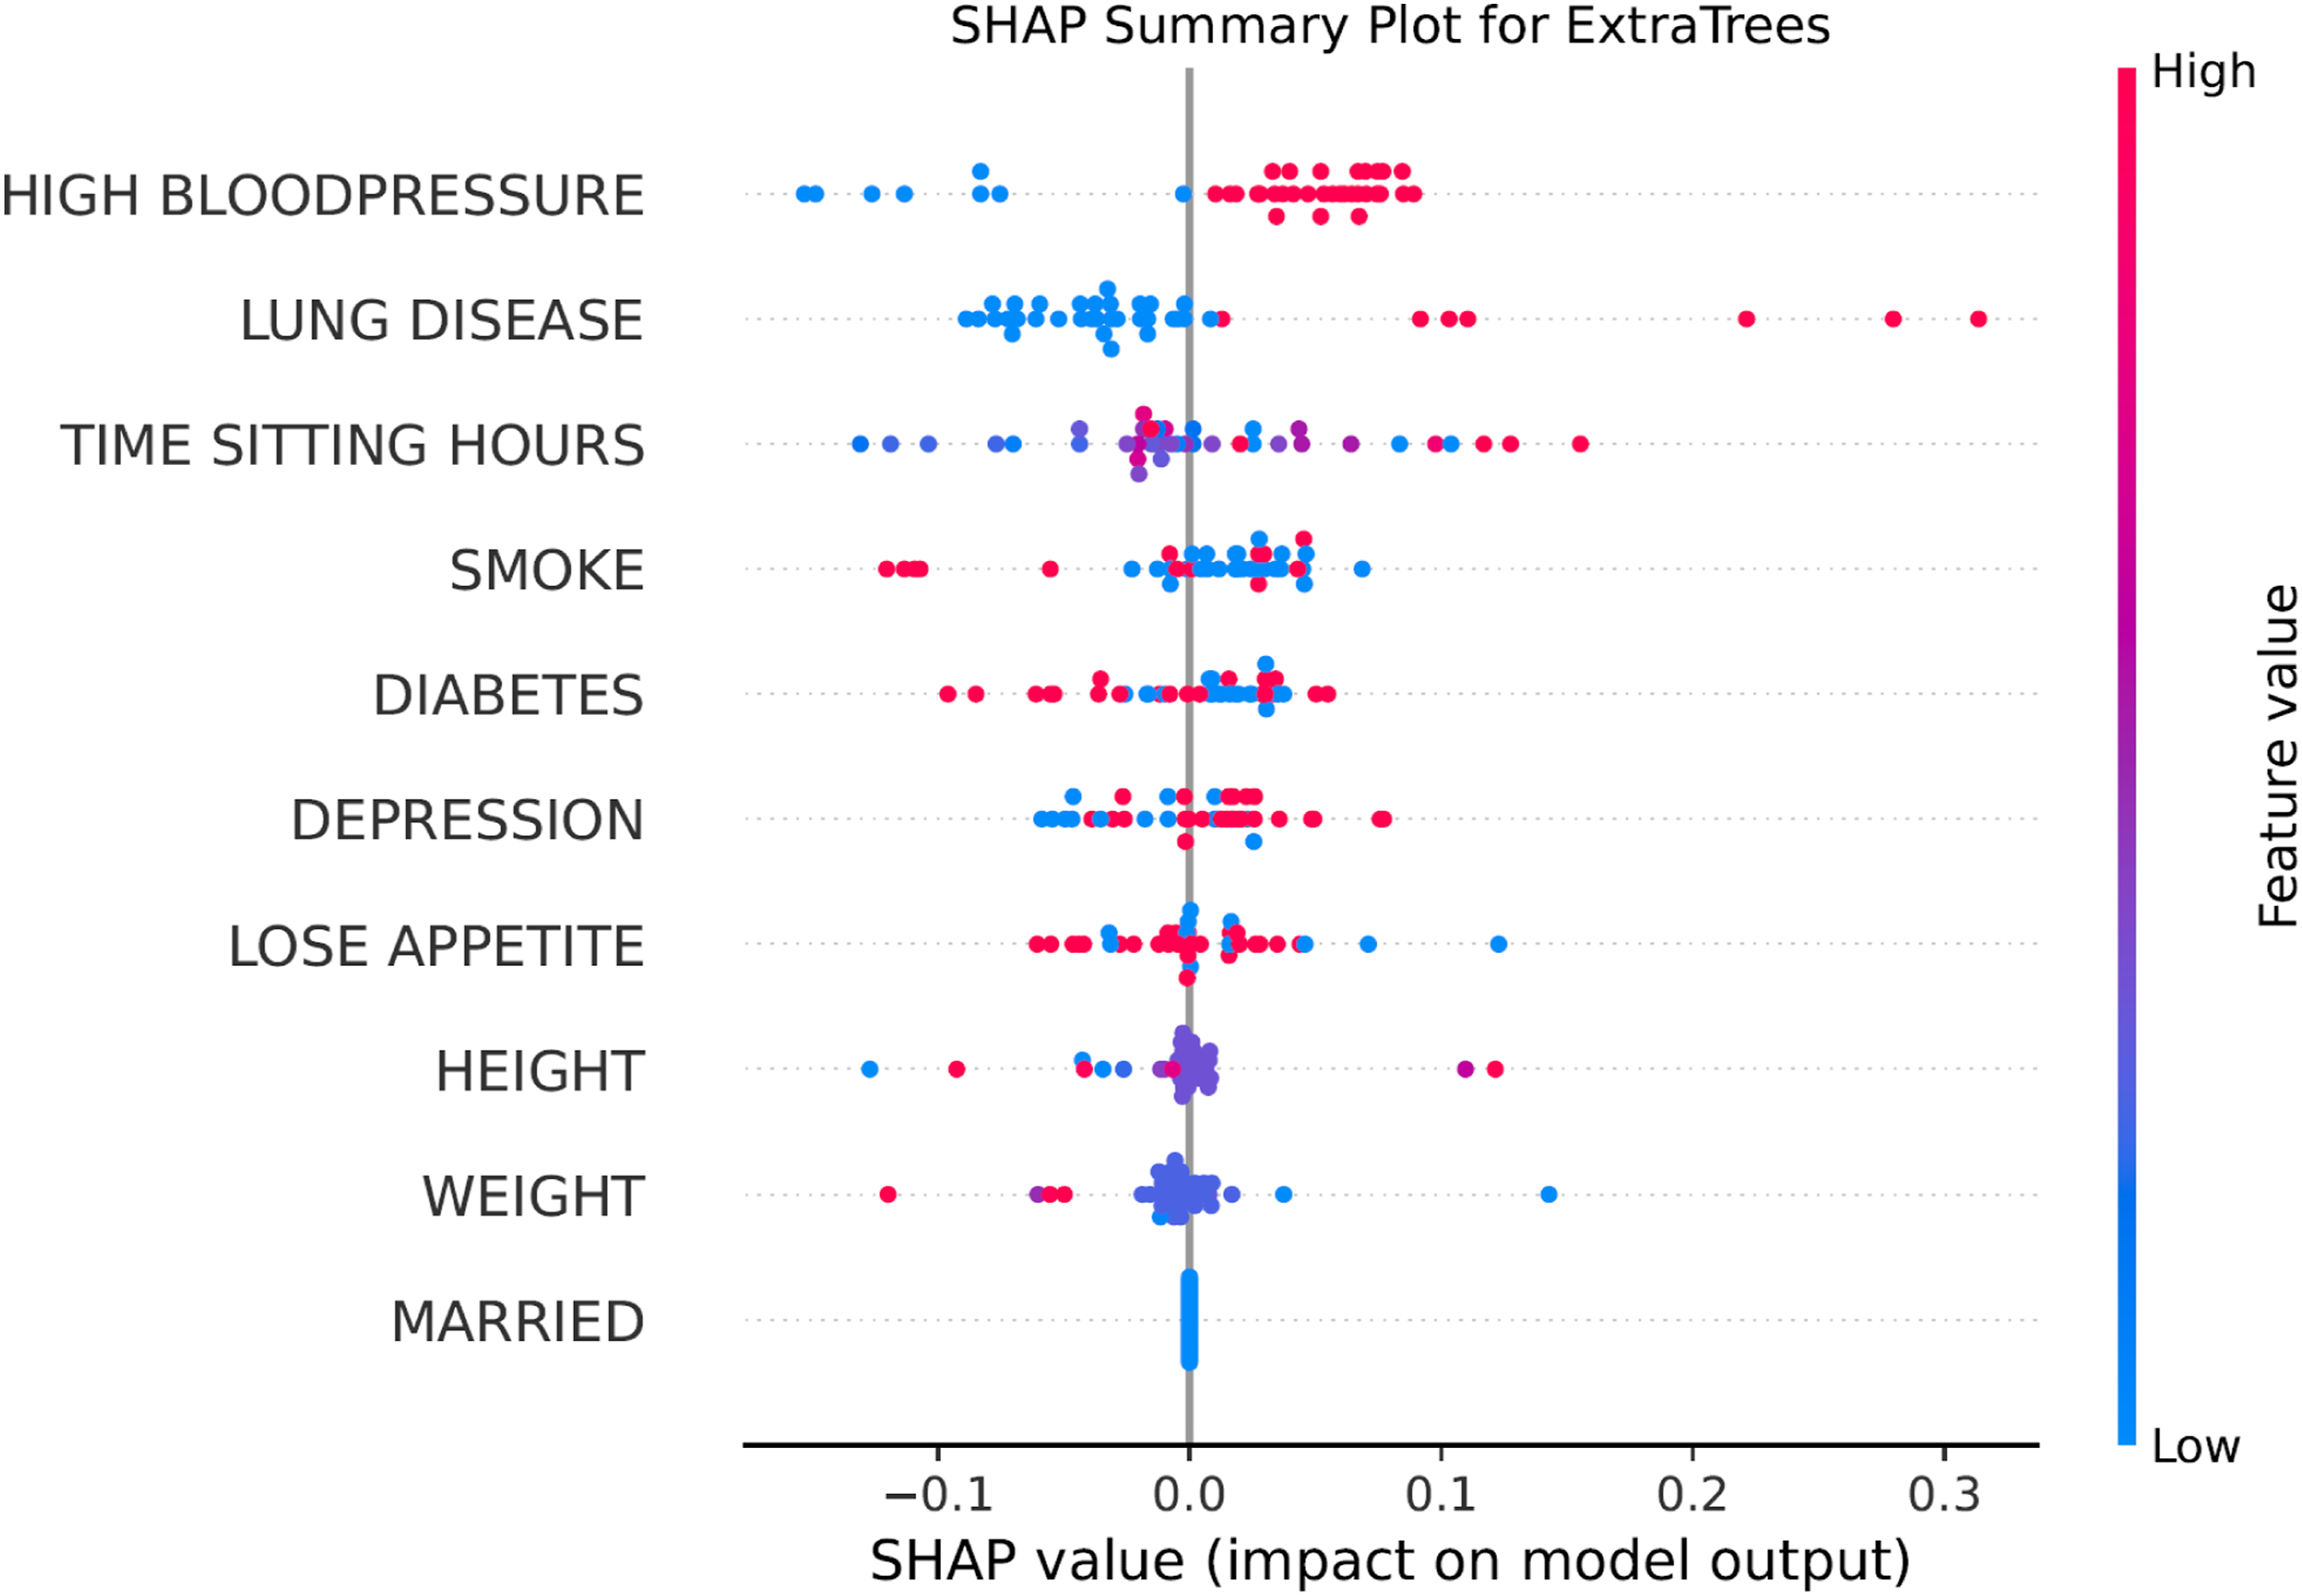
3.2.3. Model calibration and clinical utility
The ExtraTrees model demonstrated excellent calibration, as shown in the calibration curve, with predicted probabilities closely matching observed outcomes across all risk thresholds, Figure. DCA confirmed the clinical utility of the model, showing positive net benefit across a wide range of threshold probabilities. Specifically, the model demonstrates a clear net benefit over ‘treat all’ and ‘treat none’ strategies across a clinically relevant threshold probability range of approximately 15% to 75% (Figure 4). (a) AUROC, (b) Calibration Curve, (c) performance, (d) Decision Curve Analysis for 10 machine learning algorithms.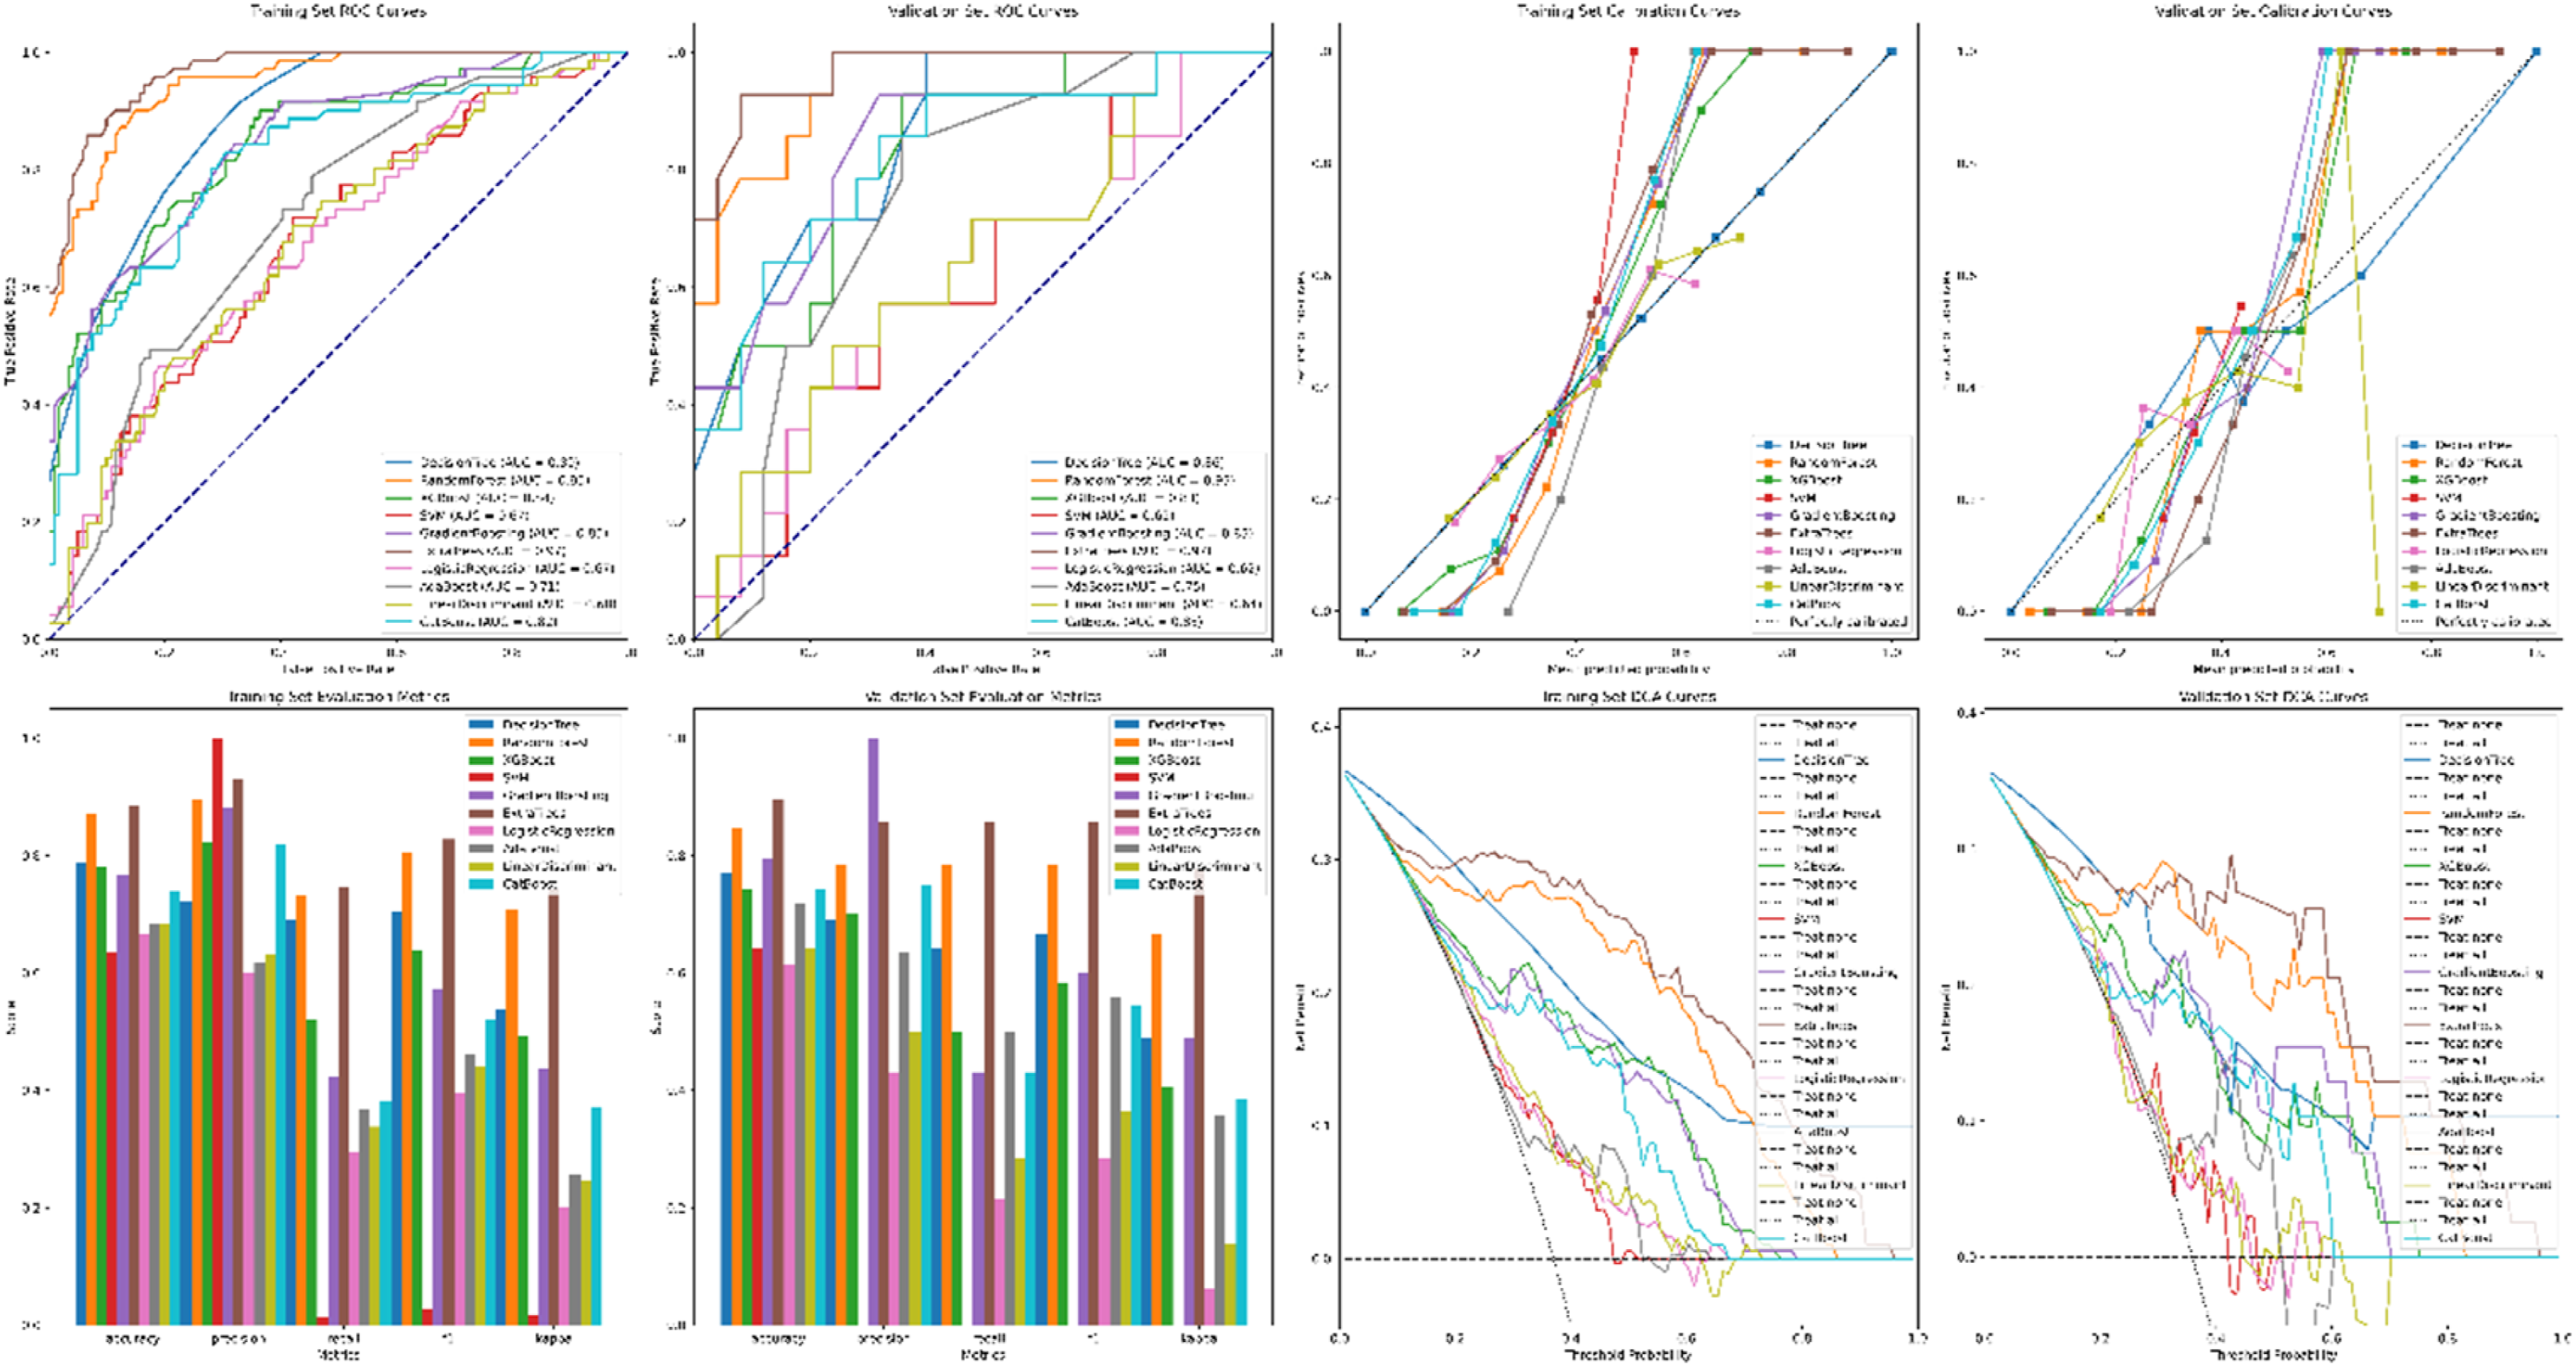
3.3. Robustness and generalizability
Both models demonstrated strong robustness through cross-validation. The XGBoost model for state-level prediction achieved a CV RMSE of 4.344, indicating stable performance across different data splits; The ExtraTrees classifier for individual prediction maintained high accuracy across 10-fold CV. SHAP analysis confirmed consistent feature importance rankings across different model configurations. Furthermore, algorithmic fairness assessments confirmed that the final model maintained an equalized odds difference within acceptable limits (<0.05) across protected subgroups defined by sex and race.
4. Discussion
This investigation represents a substantive methodological and empirical advance in understanding the multi-layered etiology of CHD. By deploying a vertically integrated analytical framework that transitions from population-level ecological patterns to individual-level clinical predictions, we have delineated a more coherent map of CHD risk determinants that operate across different scales of influence. The core finding of this study is that the most salient predictors of CHD mortality between states are socio-environmental constructs, while the most potent predictors of disease status among individuals within a population are clinical and behavioral factors. Our findings provide critical nuance to the discourse on cardiovascular disease prevention. This pattern is not a contradiction but a reflection of the fundamental distinction between contextual effects (the impact of the shared environment on group-level outcomes) and compositional effects (the aggregation of individual characteristics). 30 Our two-phase, machine learning-driven approach successfully disentangles these effects, offering a practical countermeasure that helps mitigate the ecological and individualistic fallacies that have long plagued multi-level epidemiological research.
The ascendancy of specific machine learning algorithms in our analysis carries significant implications for methodological practice. In Phase 1, the dominance of gradient-boosted tree ensembles (XGBoost, CatBoost) over linear models for predicting state-level mortality underscores the intrinsically non-linear and interactive nature of socio-environmental influences on population health. 37 The ability of these models to identify threshold effects, such as the point beyond which ambient ozone pollution’s association with mortality risk accelerates, is a critical advantage over traditional regression. 36 This finding suggests that public health policies may need to be predicated on non-linear exposure-response relationships rather than linear assumptions. In Phase 2, the superior performance of the ExtraTrees classifier for individual-level prediction is equally instructive. Its enhanced randomness in feature splitting during tree construction often yields better generalization and lower variance than a standard Random Forest, particularly when dealing with heterogeneous clinical data where features can vary greatly in scale and predictive strength. 38 The consistent outperformance of these sophisticated, flexible algorithms across both phases validates their utility as the new standard for modeling complex disease systems, where simple linearity and additivity are the exception, not the rule. 13
The interpretative power unlocked by SHAP analysis provides the most compelling insights, moving beyond prediction to reveal the distinct, yet connected, architecture of risk at different levels. By transforming opaque quantitative outputs into interpretable risk profiles, this SHAP analysis serves as a crucial qualitative component, providing narrative insights into how specific risk factors interact for individual patients. At the state level, the prominence of ambient ozone pollution as a leading feature aligns robustly with a large body of toxicological and epidemiological evidence. 39 Ozone is a potent oxidant capable of inducing systemic inflammation, endothelial dysfunction, and autonomic imbalance, pathways directly implicated in atherogenesis and plaque rupture. 8 Its ecological signal likely captures not only direct biological harm but also its correlation with other unmeasured environmental and social adversities. Therefore, SHAP values derived at the ecological level should be interpreted as macro-level risk indicators rather than direct evidence of individual biological causation. Conversely, the individual-level model prioritized hypertension and diabetes, which are the quintessential proximal risk factors in clinical cardiology. This dissociation powerfully illustrates the concept of distal versus proximal causation: macro-level factors shape the population distribution of risk, but within that context, it is the realization of specific biological dysregulations in individuals that culminates in a clinical diagnosis. 4
The identification of depression as a significant individual-level risk factor reinforces the critical importance of the psychosocial dimension in CHD pathogenesis, an area sometimes underemphasized in purely biophysical models. 40 The convergence of smoking and low physical activity as important predictors at both analytical levels is particularly revealing.41–44 These factors exist at the interface of individual choice and environmental constraint. An individual’s decision to smoke or exercise is powerfully shaped by state-level variables such as tobacco taxation, clean air laws, and the built environment’s walkability. 45 Thus, they serve as bridging mechanisms, translating upstream socio-environmental contexts into downstream biological risks. This finding underscores the necessity of integrated interventions that combine population-level policy (e.g., sin taxes, urban planning) with individual-level support (e.g., cessation programs, behavioral counseling).
Our methodological approach offers several key strengths. First, the use of a multi-model consensus strategy for feature selection in Phase 1, incorporating stability selection and the one-standard-error rule, significantly reduces the likelihood of identifying spurious, algorithm-dependent predictors, enhancing the reliability of the discovered feature set.8,30 Second, the application of SHAP values provides a unified, theoretically sound framework for model interpretation, quantifying the marginal contribution of each feature to every prediction. This moves the field beyond simplistic “variable importance” rankings to a nuanced understanding of directional effects, non-linear patterns, and interaction dependencies, as vividly demonstrated in the interaction plot between hypertension and diabetes. Third, the evaluation of clinical utility via DCA represents a critical advancement over standard metric reporting.36,38
Despite these strengths, several limitations warrant consideration. The observational and ecological nature of Phase 1 inherently precludes causal inference. While our two-phase design mitigates the ecological fallacy, residual confounding by unmeasured state-level characteristics remains possible. Second, the limited ecological sample size (N=204) in Phase 1 carries an inherent overfitting risk for flexible machine learning algorithms; however, our two-phase framework structurally mitigates this, as spuriously selected features would theoretically fail to validate in the large-scale individual data of Phase 2. Third, temporal alignment between data sources is imperfect. CHD develops over decades, and an individual’s current disease status in the HRS is the result of lifelong exposures, some of which may not be fully captured by contemporary state-level indicators. Future work would benefit from employing life-course exposure modeling. Therefore, our current framework identifies robust two-phase associations rather than definitive causal pathways. Fourth, while we employed advanced techniques like MICE, measurement error and missing data, particularly for self-reported variables in the HRS, could bias estimates. Fifth, the generalizability of the individual-level model, while tested on a nationally representative sample, requires external validation in other populations and healthcare settings before broad clinical deployment. Furthermore, mapping state-level environmental data to individuals based on geographic residence retains a degree of ecological scaling, representing contextual exposures rather than precise personal dosimetry.
The implications of this research are bifocal, targeting both public health strategy and clinical practice. For population health policymakers, our state-level findings provide an evidence-based roadmap. Prioritizing rigorous air quality standards to reduce ozone pollution, enacting fiscal and built-environment policies to promote physical activity and healthy diets, and implementing comprehensive tobacco control are not just environmental or social policies, they are cardiovascular prevention strategies of the highest order.46–48 The geographic risk map can guide targeted resource allocation and community-level interventions. For clinicians and health systems, the validated individual-level prediction model, especially if integrated into electronic health records with real-time SHAP explainability, could transform preventive care. It could facilitate shared decision-making by visually showing patients how their specific risk profile could be modified through targeted interventions.
Future research should build upon this foundational framework in several promising directions. Longitudinal analysis using the rich temporal data within the HRS could model the dynamic trajectories of risk accumulation, offering stronger insights into causal sequences and critical preventive windows. Incorporating novel data layers, such as geocoded environmental exposures, polygenic risk scores, or even social media-derived neighborhood sentiment, could further enhance predictive accuracy and etiological understanding.49,50 Causal mediation analysis techniques, potentially integrated within the ML framework, could formally quantify the proportion of the effect of a state-level factor on individual CHD risk that is mediated through specific biological pathways. 51 Finally, developing agent-based or microsimulation models parameterized with our findings could serve as a “policy laboratory,” forecasting the long-term health and economic impacts of various public health and clinical intervention scenarios.
5. Conclusions
In conclusion, this study demonstrates that the path to a more complete understanding of complex chronic diseases like CHD lies in analytical frameworks that are as multi-level as the disease determinants themselves. By sequentially and rigorously linking population ecology with individual pathophysiology through interpretable machine learning, we have provided a coherent narrative that connects air quality and social policies to individual behavior and biological state. The findings argue compellingly for a synergistic prevention paradigm: one that simultaneously engineers healthier societies through bold policy and precisely protects vulnerable individuals through personalized medicine. The methodological blueprint established here was characterized by multi-phase validation, algorithmic consensus, and explainable AI offering a powerful and generalizable template for elucidating the two-phase architecture of other complex diseases shaped by the enduring interplay between environments, societies, and biology.
Supplemental material
Supplemental material - A two-phase machine learning framework for coronary heart disease risk prediction: Integrating population ecology with individual pathophysiology
Supplemental material for A two-phase machine learning framework for coronary heart disease risk prediction: Integrating population ecology with individual pathophysiology by Lin Yang, Jing Guo and Junwei Xu in Digital Health.
Footnotes

Ethical considerations
The GBD study, CDC WONDER and Health and Retirement Study are publicly available databases and all data was anonymous. The sensitive health data follows the ethics rules of Health and Retirement Study.
Author contributions
Lin Yang conception of the work, analysis of data and drafting the work. Jing Guo conception of the work, analysis of data and drafting the work. Junwei Xu conception of the work, interpretation of data and critical review the work.
Funding
The authors disclosed receipt of the following financial support for the research, authorship, and/or publication of this article: The work was supported by Science and Technology Development Fund of Nanjing Medical University (NMUB2020229).
Declaration of conflicting interests
The authors declared no potential conflicts of interest with respect to the research, authorship, and/or publication of this article.
Data Availability Statement
The data included in this study are available from the Global Burden of Disease (GBD) study, CDC WONDER and Health and Retirement Study. Access to the data can be obtained by registering and submitting a request through the official website. Sensitive Data Access Use Agreement was signed when analysis the individual health data from Health and Retirement Study.
Supplemental material
Supplemental material for this article is available online.
References
Supplementary Material
Please find the following supplemental material available below.
For Open Access articles published under a Creative Commons License, all supplemental material carries the same license as the article it is associated with.
For non-Open Access articles published, all supplemental material carries a non-exclusive license, and permission requests for re-use of supplemental material or any part of supplemental material shall be sent directly to the copyright owner as specified in the copyright notice associated with the article.
