
Abstract
Delirium is a prevalent neuropsychiatric syndrome affecting up to 50% of hospitalized elderly patients, associated with increased mortality, cognitive decline, and health care costs exceeding $164 billion annually. Despite its clinical burden, the genetic architecture underlying susceptibility to delirium remains poorly characterized. We developed an agentic artificial intelligence pipeline integrating genome-wide association study (GWAS) data from FinnGen Release 12 (6854 cases; 384,461 controls) with causal transcriptome-wide association study (cTWAS) using brain-specific eQTL data from Genotype-Tissue Expression. Spatial transcriptomics analysis (gsMap) was performed on the human dorsolateral prefrontal cortex to characterize layer-specific expression patterns. Deep learning models (Enformer, SpliceTransformer) were applied to predict functional consequences of identified variants. GWAS identified a strongly associated locus on chromosome 19q13.32, with lead variant rs429358 (P = 2.79 × 10−70) defining the apolipoprotein E (APOE) ε4 allele. cTWAS analysis identified two causal genes: APOE (posterior inclusion probabilities [PIP] = 0.871, Z = −8.44) and ZNF226 (PIP = 0.604, Z = 5.63), exhibiting opposite directional effects. APOE downregulation increased susceptibility to delirium, while ZNF226 upregulation conferred an elevated risk. Spatial transcriptomics revealed significant GWAS enrichment in Layer 5 (P < 0.001), with distinct layer-specific expression patterns for both genes. Enformer predicted that rs429358 substantially altered chromatin accessibility at promoter regions (H3K4me3 SNP Activity Difference = 0.30). SpliceTransformer identified significant splice site perturbations (maximum Δ = 0.45). This study provides a comprehensive genetic dissection of delirium through agentic artificial intelligence-driven multiomics integration. We identify APOE and ZNF226 as causal genes with distinct mechanisms and spatial expression patterns. These findings establish a molecular framework for understanding delirium pathophysiology and identify potential therapeutic targets.
Keywords
Introduction
Delirium represents one of the most prevalent, consequential, and yet incompletely understood neuropsychiatric syndromes encountered in contemporary clinical medicine. Characterized by acute disturbances in attention, awareness, and cognition that develop over hours to days and fluctuate in severity, delirium affects a substantial proportion of hospitalized patients across diverse clinical settings. Epidemiological studies consistently report delirium prevalence rates of 15%–25% among general medical inpatients, 30%–40% following major surgical procedures, and 60%–80% in intensive care unit settings, with particularly high rates among mechanically ventilated patients. Among elderly hospitalized patients, cumulative evidence suggests that up to 50% will experience at least one episode of delirium during their hospitalization.1–3
The clinical consequences of delirium extend far beyond the acute episode itself. Short-term outcomes include prolonged hospitalization, with delirious patients experiencing hospital stays 5–10 days longer than non-delirious counterparts, increased rates of nosocomial complications, higher rates of intensive care unit admission, and substantially elevated in-hospital mortality. Perhaps most concerning are the long-term cognitive sequelae of delirium. Multiple prospective cohort studies have demonstrated that delirium is independently associated with accelerated cognitive decline, increased risk of incident dementia, and reduced functional independence in activities of daily living, persisting months to years after the acute episode resolves.4,5 The economic burden of delirium is correspondingly enormous, with estimates suggesting annual health care costs attributable to delirium exceed $164 billion in the United States alone. 2
Despite decades of clinical and basic science research, the pathophysiological mechanisms underlying delirium remain incompletely characterized. The neuroinflammation hypothesis posits that systemic inflammatory insults trigger peripheral immune activation, with subsequent disruption of blood–brain barrier integrity. This allows entry of inflammatory mediators and immune cells into the central nervous system. This neuroinflammatory cascade is proposed to disrupt neurotransmitter signaling, impair synaptic function, and ultimately produce the clinical syndrome of delirium. The neurotransmitter imbalance hypothesis emphasizes relative cholinergic deficiency and dopaminergic excess as central to delirium pathophysiology. This is supported by the observation that anticholinergic medications are among the most consistent pharmacological precipitants of delirium. Additional hypothesized mechanisms include oxidative stress, mitochondrial dysfunction, disrupted circadian regulation, and aberrant neural network connectivity. 6
The marked interindividual variability in delirium susceptibility strongly suggests contributions from genetic factors. Twin and family studies have estimated the heritability of delirium at approximately 30%–40%, indicating a substantial genetic component comparable to other complex neuropsychiatric traits. Candidate gene studies have consistently implicated the apolipoprotein E (APOE) ε4 allele as a genetic risk factor for delirium.7,8 The APOE gene, located on chromosome 19q13.32, encodes APOE, the primary lipid transport protein in the central nervous system. The ε4 allele, defined by the rs429358 variant encoding arginine at codon 112, has been associated with increased delirium risk in multiple independent cohorts.
Recent methodological advances have substantially enhanced our ability to move from GWAS-identified variants to causal genes and biological mechanisms. The causal transcriptome-wide association study (cTWAS) framework addresses the limitation of linkage disequilibrium confounding through fine-mapping methodology that explicitly models LD structure among both SNPs and genes. Spatial transcriptomics technologies enable unprecedented resolution of gene expression patterns within complex tissue architectures. Deep learning approaches have revolutionized variant effect prediction in regulatory genomics. Enformer, a transformer-based neural network, predicts chromatin accessibility and histone modifications from DNA sequence with unprecedented accuracy. Similarly, SpliceTransformer predicts splice site alterations from sequence context.
In this study, we present a comprehensive genetic investigation of delirium integrating large-scale GWAS data with state-of-the-art multi-omics approaches. Our objectives were to identify genome-wide significant loci for delirium susceptibility, prioritize causal genes through cTWAS fine-mapping with brain-specific expression models, characterize layer-specific enrichment patterns through spatial transcriptomics integration, and predict functional consequences of identified variants using deep learning-based chromatin and splicing models.
Methods
Study population and GWAS data
We utilized genome-wide association study summary statistics from the FinnGen research project Release 12 (R12), a large-scale genomics initiative combining genome information with longitudinal health registry data from Finnish biobanks. The delirium phenotype (FinnGen endpoint F5_DELIRIUM) was defined using International Classification of Diseases (ICD) diagnostic codes, including ICD-10 code F05. The R12 analysis included 6854 delirium cases and 384,461 controls of Finnish ancestry. Genotyping was performed using customized Illumina and Affymetrix genotyping arrays optimized for Finnish population genetics. Following quality control, genotype imputation was performed using the population-specific SISu v4.0 reference panel. Association testing was conducted using REGENIE v2.2.4, a computationally efficient whole-genome regression method that accounts for sample relatedness and population stratification. 9 Genome-wide significance was defined as P < 5 × 10⁻⁸. Covariates adjusted for in the association analysis included age, sex, the first 10 genetic principal components, and genotyping batch. This ICD-10 F05-based definition does not differentiate delirium subtypes and may capture individuals with concurrent undiagnosed dementia, a point addressed further in the “Discussion” section.
Causal transcriptome-wide association study
We implemented cTWAS analysis to identify putative causal genes for delirium while accounting for LD-induced confounding. Gene expression prediction models were obtained from the PredictDB repository for brain tissues profiled by the Genotype-Tissue Expression (GTEx) project version 8. 10 Primary analyses focused on the brain frontal cortex (Brodmann area 9) and the brain cortex models. The cTWAS analysis estimates posterior inclusion probabilities (PIP) for each gene, representing the probability that the gene is causally associated with the trait given the observed data. Genes with PIP >0.5 were considered high-confidence causal genes. Brain tissue expression models were selected because delirium is a cerebral disorder for which tissue-matched eQTL data provide the most biologically relevant predictions; peripheral tissue eQTL effects were not evaluated in this study.
Spatial transcriptomics analysis
Spatial transcriptomics analysis was performed using the Gene-Set Mapping (gsMap) framework to integrate GWAS enrichment signals with spatially resolved gene expression data. 11 Spatial transcriptomics data were obtained from human dorsolateral prefrontal cortex (DLPFC) tissue profiled using the 10× Genomics Visium platform. 12 We analyzed sample 151673, which comprises 3639 spatial spots with manually curated layer annotations across six cortical layers (Layer 1 through Layer 6) and white matter (WM). The gsMap analysis proceeded through spatial-LDSC to estimate GWAS enrichment at each spatial spot, latent-to-gene analysis to compute gene spatial scores (GSSs), and Cauchy combination testing to aggregate spot-level P-values within each cortical layer. GSSs were aggregated within each cortical layer by summing spot-level values and normalizing by the number of spots per layer to account for varying spot densities across anatomical regions. Default gsMap parameters were used, with a spatial-LDSC window of 1 cM and Cauchy combination testing at FDR <0.05.
Deep learning-based variant effect prediction
We applied Enformer, a transformer-based deep learning model, to predict the functional impact of identified variants on chromatin accessibility, histone modifications, and transcription factor binding. 13 For each variant, we extracted 196,608 base pair (bp) sequences centered on the variant position and computed predictions for both reference and alternative alleles. The SNP Activity Difference (SAD) was calculated as the difference between alternative and reference allele predictions. Splice site alterations were predicted using SpliceTransformer, which predicts splice acceptor and donor site probabilities at each nucleotide position within a sequence context. 14 The delta score (Δ) was calculated as the change in predicted splice site strength attributable to the variant. Predictions were generated using a 5000 bp input window centered on each variant, with canonical transcripts ENST00000252486.9 (APOE) and ENST00000396027.5 (ZNF226) as reference sequences, and single-nucleotide resolution predictions across the full window. Reference sequences of 196,608 bp (GRCh38) centered on each variant were extracted, and single-nucleotide substitutions were introduced to generate alternative-allele inputs. The default pretrained Enformer model was used without fine-tuning.
Results
GWAS identifies chromosome 19q13.32 locus
Analysis of the FinnGen R12 delirium GWAS revealed a single genome-wide significant locus on chromosome 19q13.32 spanning the APOE gene cluster (Fig. 1). The lead variant rs429358 achieved a highly significant association with P = 2.79 × 10−70 and β = 0.477, representing one of the strongest genetic associations reported for any neuropsychiatric trait. This variant is the defining polymorphism for the APOE ε4 allele, with the risk-increasing C allele encoding arginine at amino acid position 112 of the APOE protein. Secondary lead variants included rs10414043 (P = 1.26 × 10−62) and rs7256200 (P = 3.98 × 10−59), both located within the APOE gene region and in high linkage disequilibrium with rs429358. Several additional loci reached suggestive significance (P < 1 × 10⁻⁵); details of these regions including genomic positions, lead variants, nearest genes, and association P-values for both individual cohort and meta-analyses are provided in Supplementary Table S1.
Manhattan plot of genome-wide association study for delirium. Results from FinnGen R12 (6854 cases; 384,461 controls). The y-axis shows −log10(P) values. The red solid line indicates genome-wide significance threshold (P = 5 × 10⁻⁸); the dashed line indicates suggestive significance (P = 1 × 10⁻⁵). A single genome-wide significant locus on chromosome 19 is highlighted, with lead variants rs429358 (P = 2.79 × 10−70), rs10414043, and rs7256200 labeled.
cTWAS fine-mapping identifies APOE and ZNF226 as causal genes
Application of cTWAS analysis using brain tissue expression prediction models identified two genes exceeding the PIP >0.5 threshold for high-confidence causal genes (Fig. 2). APOE (ENSG00000130203) exhibited the highest posterior inclusion probability of 0.871 in the brain frontal cortex (BA9), indicating 87.1% probability that this gene is causally associated with delirium given the observed GWAS data and gene expression predictions. The cTWAS Z-score of −8.44 indicates that genetically predicted lower APOE expression is associated with increased delirium risk.
Causal transcriptome-wide association study (cTWAS) fine-mapping results at the APOE and ZNF226 loci. Upper panels: APOE locus showing −log10(P) value for eQTL associations (top) and posterior inclusion probability (PIP) for genes (bottom). APOE (ENSG00000130203) in the brain frontal cortex BA9 shows PIP = 0.871. Lower panels: ZNF226 locus showing −log10(P) value (top) and PIP (bottom). ZNF226 (ENSG00000167380) in the brain cortex shows PIP = 0.604. Red dashed lines indicate the PIP threshold of 0.5. Gene annotations are shown at the bottom of each locus. APOE, apolipoprotein E; CS, credible set; L1/L2, credible set levels.
ZNF226 (ENSG00000167380), encoding zinc finger protein 226, was identified as a second causal gene with PIP = 0.604 in the brain cortex and PIP = 0.388 in the brain frontal cortex (BA9). The Z-score of 5.63 indicates that genetically predicted higher ZNF226 expression is associated with increased delirium risk. ZNF226 was prioritized through cTWAS integration of sub-genome-wide-significant GWAS signals with brain cortex eQTL data, illustrating the capacity of this framework to identify causal genes beyond conventional significance thresholds.
Spatial transcriptomics reveals layer-specific expression patterns
Spatial transcriptomics analysis of human DLPFC tissue (sample 151673, 3639 spots) revealed distinct spatial patterns of GWAS enrichment and causal gene expression (Fig. 3). Layer-specific GWAS enrichment analysis using gsMap spatial-LDSC identified significant enrichment exclusively in Layer 5 (P < 0.001 by Cauchy combination test, −log10P = 12.09), while other cortical layers showed no significant enrichment (e.g., Layer 4: P = 0.772).
Spatial transcriptomics mapping of delirium causal genes in human dorsolateral prefrontal cortex (DLPFC).
The spatial expression pattern of APOE showed notable variation across cortical layers. GSSs were highest in Layer 3 (GSS = 102,56) and Layer 2 (GSS = 10,147), with moderate expression in WM (GSS = 9310) and Layer 5 (GSS = 9788). This distribution aligns with the known localization of APOE-expressing astrocytes across cortical gray matter.
In contrast, ZNF226 exhibited a distinct spatial expression pattern, with marked enrichment in WM (GSS = 14,355) exceeding all cortical layers. Among cortical layers, Layer 2 showed the highest expression (GSS = 10,475), followed by Layer 3 (GSS = 7965), suggesting potential involvement of glial populations and WM pathways.
Deep learning predicts regulatory and splicing consequences
Enformer deep learning analysis revealed substantial predicted regulatory consequences for lead variants at the APOE locus (Fig. 4). The lead variant rs429358 demonstrated the strongest effects on chromatin state, with H3K4me3 (active promoter mark) SAD of 0.30, indicating that the risk C allele substantially increases predicted H3K4me3 signal at the promoter region. DNase I hypersensitivity showed SAD of 0.025, reflecting increased chromatin accessibility with the risk allele. In contrast, H3K27ac (active enhancer mark) showed SAD of −0.08, suggesting decreased enhancer activity at nearby regulatory elements.
Deep learning predictions of regulatory and splicing consequences at the APOE locus (chr19: 44,880,000–44,930,000, GRCh38). Top panel: Gene structure with ENCODE candidate cis-regulatory elements (cCREs) including promoter-like signatures (PLS), proximal enhancer-like signatures (pELS), distal enhancer-like signatures (dELS), and CTCF-only elements. Lead variants rs429358, rs10414043, and rs7256200 are indicated by red dashed lines. Signal tracks show Enformer-predicted SNP Activity Difference (SAD) scores for H3K27ac (active enhancer), H3K4me3 (active promoter), and DNase (open chromatin), along with SpliceTransformer-predicted delta scores for splice acceptor and splice donor sites. The rs429358 variant shows H3K4me3 SAD = 0.30 and maximum splice acceptor Δ = 0.45.
At the ZNF226 locus, lead variants exhibited more modest Enformer predictions compared to the APOE locus, consistent with the weaker GWAS signal (Fig. 5). The lead variant rs4803693 showed H3K27ac SAD of −0.06, indicating modest predicted decrease in enhancer activity, H3K4me3 SAD of −0.04, indicating slight predicted decrease in promoter activity, and DNase SAD of −0.001, indicating minimal predicted effect on chromatin accessibility.
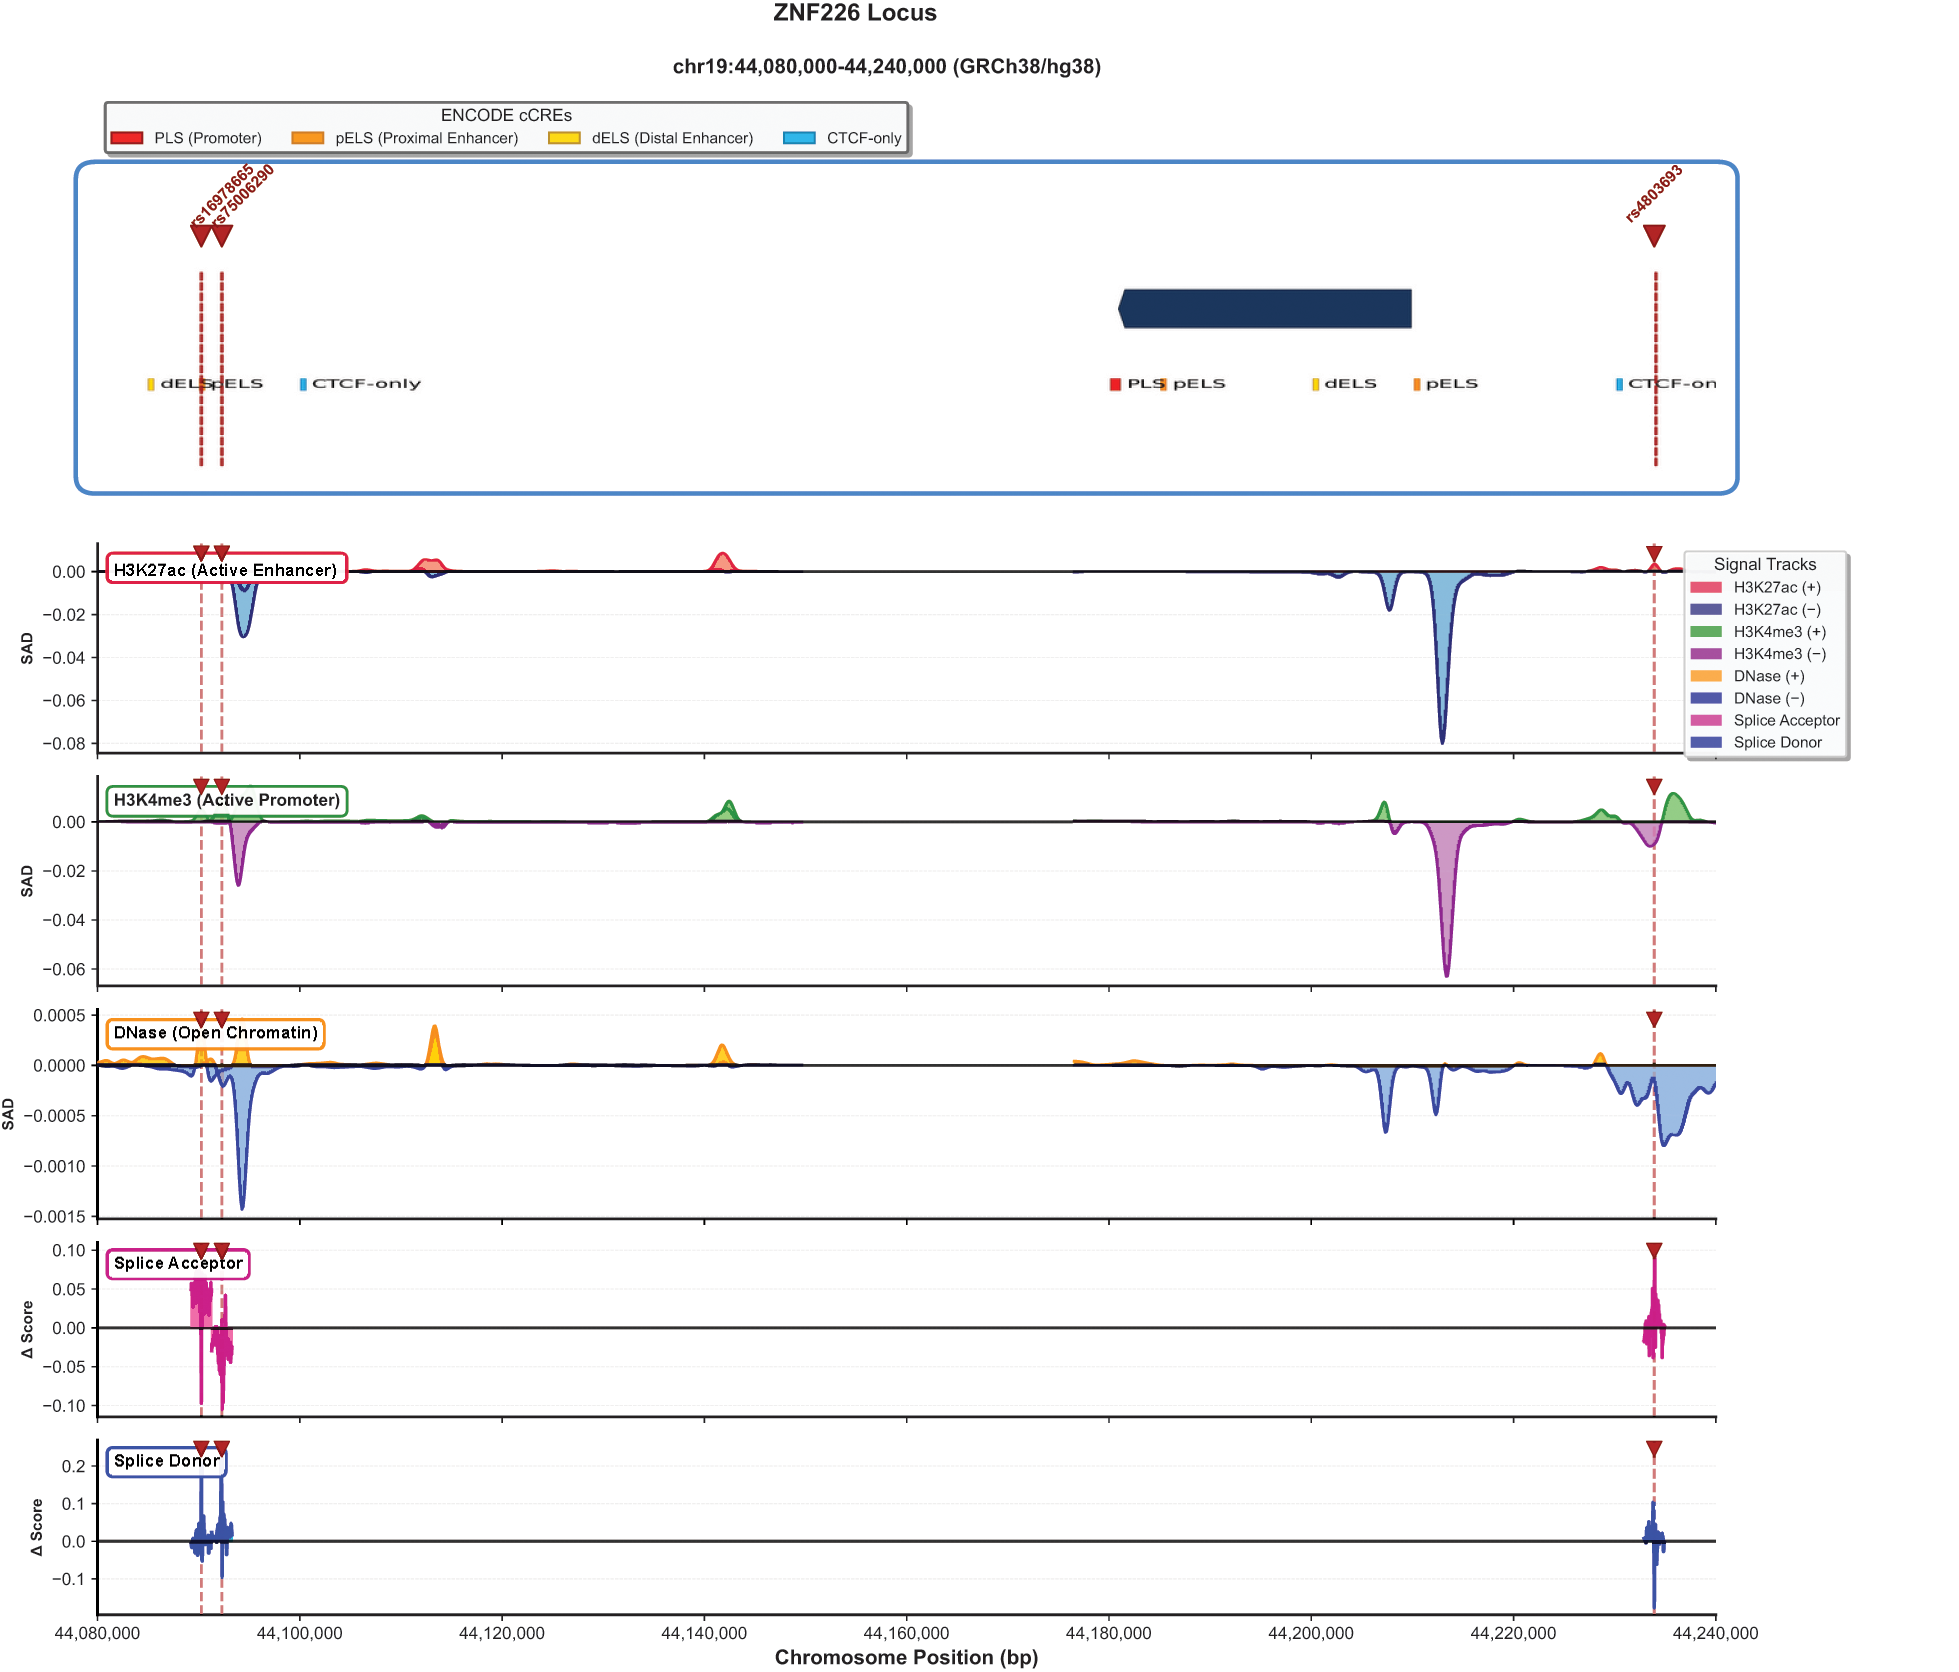
Deep learning predictions of regulatory and splicing consequences at the ZNF226 locus (chr19: 44,080,000–44,240,000, GRCh38). Top panel: Gene structure with ENCODE cCREs. Lead variants rs16978655, rs76062530, and rs4803693 are indicated by red dashed lines. Signal tracks show Enformer-predicted SNP Activity Difference (SAD) scores for H3K27ac (active enhancer), H3K4me3 (active promoter), and DNase (open chromatin), along with SpliceTransformer-predicted delta scores for splice acceptor and splice donor sites. Compared to the APOE locus, ZNF226 shows more modest regulatory predictions (H3K27ac SAD = −0.06, H3K4me3 SAD = −0.04) with splice site alterations concentrated at the 5′ and 3′ ends of the gene.
SpliceTransformer analysis identified potential splice-altering effects at both loci. At the APOE locus, the maximum acceptor site delta score reached 0.45, localized to the region encompassing rs429358 and rs7256200. The maximum donor site delta score was 0.22. These splice-altering predictions suggest that delirium-associated variants may influence alternative splicing of APOE transcripts. At the ZNF226 locus, splice site predictions were concentrated at the gene’s 5′ and 3′ ends, with maximum acceptor site delta of 0.12 and maximum donor site delta of 0.22. The maximum acceptor delta of 0.45 maps near the exon 3–exon 4 junction of the canonical APOE transcript (ENST00000252486.9), suggesting potential disruption of this splice acceptor site.
Discussion
This study presents a comprehensive genetic and functional genomic investigation of delirium, integrating large-scale GWAS data from FinnGen with cTWAS fine-mapping, spatial transcriptomics, and deep learning-based variant effect prediction. We identified APOE and ZNF226 as high-confidence causal genes with distinct molecular mechanisms, directional effects, and spatial expression patterns in the human cerebral cortex. The identification of APOE with a posterior inclusion probability of 0.871 provides statistically rigorous confirmation of candidate gene studies spanning two decades,15,16 while extending these observations by demonstrating that the association is mediated through effects on gene expression. The novel identification of ZNF226 as a risk gene represents an unexpected finding that expands our understanding of delirium genetic architecture beyond the APOE locus. Notably, rs429358 is also a missense variant (Arg112Cys) that defines the APOE ε4 allele; our findings thus reveal an additional regulatory dimension whereby the same variant simultaneously alters both protein function and gene expression regulation through chromatin remodeling. 17 Furthermore, APOE and ZNF226 reside in separate cTWAS credible sets separated by approximately 800 kb with minimal linkage disequilibrium, supporting their statistical independence as distinct causal signals. As rs429358 is pleiotropic for Alzheimer’s disease (AD), isolating the delirium-specific component of this association will require conditional analyses that account for dementia comorbidity.
The spatial enrichment in Layer 5 provides an additional mechanistic clue. Layer 5 pyramidal neurons are major long-range projection neurons that integrate cortical and subcortical signals and are central to large-scale network communication. Acute dysfunction in these circuits could plausibly manifest as deficits in attention and executive control that are characteristic of delirium. These neurons serve as the principal cortical output through corticofugal projections to the thalamus, basal ganglia, and brainstem and are particularly metabolically vulnerable owing to their extensive dendritic arbors and dependence on cholinergic modulation. 18 The prominent WM enrichment of ZNF226 expression (GSS = 14,355) further implicates oligodendrocyte-mediated pathways, consistent with the established association between WM hyperintensities and delirium susceptibility. 19 As a member of the Krüppel-associated box zinc finger (KRAB-ZNF) protein family, 20 ZNF226 functions as a transcriptional repressor that recruits KAP1/TRIM28 co-repressor complexes; aberrant overexpression in WM could disrupt oligodendrocyte transcriptional programs and myelin homeostasis. The convergence of cTWAS causal evidence with pronounced WM spatial enrichment nominates ZNF226 as a candidate mediator of oligodendrocyte-related pathways in delirium. However, this model is derived from general KRAB-ZNF biology rather than gene-specific functional data, and functional characterization of ZNF226 in brain tissue represents a key objective of our follow-up studies.
Several limitations warrant consideration. First, the FinnGen cohort comprises individuals of Finnish ancestry, a founder isolate with distinct allele frequencies and LD patterns. Replication in independent multiethnic cohorts such as the UK Biobank is essential before these findings can be considered broadly generalizable. Second, the ICD-10 F05 phenotype definition may underascertain hypoactive delirium and does not exclude concurrent dementia diagnoses. Because rs429358 is the primary genetic risk factor for AD, we cannot fully rule out the possibility that the observed GWAS signal partly reflects AD predisposition. Sensitivity analyses excluding ICD-10 F00–F03 and G30 diagnoses, or conditional analyses using Genomic SEM, 21 are needed but were not feasible with summary-level data alone. Third, cTWAS provides probabilistic causal evidence, and the ZNF226 PIP of 0.604 implies appreciable residual uncertainty. Fourth, all spatial transcriptomics results derive from a single DLPFC specimen (sample 151673), limiting the reliability of layer-specific claims. Validation across additional samples and integration with single-cell RNA-sequencing data would strengthen cell-type attribution. Fifth, Enformer and SpliceTransformer predictions lack calibrated empirical thresholds, and the high-LD context of the APOE cluster complicates isolation of the functional driver variant in silico. Last, summary-level data preclude evaluation of APOE ε4 dosage effects or ε2 interactions.
Conclusions
This study provides a comprehensive genetic characterization of delirium susceptibility through integration of large-scale GWAS data with causal transcriptome-wide association analysis, spatial transcriptomics, and deep learning-based variant effect prediction.
Authors’ Contributions
J.Y. and Y.X. conceived and designed the study. J.Y. performed the bioinformatics analyses including GWAS analysis, cTWAS, spatial transcriptomics integration, and deep learning predictions. X.W., L.P., and J.T. contributed to data interpretation. S.C. and Y.X. supervised the project. J.Y. wrote the initial draft. All authors reviewed, edited, and approved the final article.
Data Availability Statement
FinnGen summary statistics are publicly available at finngen.fi/en/access_results. GTEx expression data and prediction models are available at gtexportal.org and predictdb.org. Spatial transcriptomics data are available through the spatialLIBD R package. Analysis code is available upon request.
Ethics Statement
This study used publicly available summary statistics and published datasets; no new human participant recruitment was performed.
Footnotes
Author Disclosure Statement
The authors declare no competing interests.
Funding Information
This research received funding from Luzhou Maternal & Child Health Hospital (2024-YYXM-098).
Supplemental Material
Abbreviations Used
References
Supplementary Material
Please find the following supplemental material available below.
For Open Access articles published under a Creative Commons License, all supplemental material carries the same license as the article it is associated with.
For non-Open Access articles published, all supplemental material carries a non-exclusive license, and permission requests for re-use of supplemental material or any part of supplemental material shall be sent directly to the copyright owner as specified in the copyright notice associated with the article.