





Abstract
This article examines one of the major systemic issues in the process of negotiation under the Doha Round of the World Trade Organization (WTO): the tariff lines with non-ad-valorem (NAV) duties in agricultural and allied products (A&AP) and further the process of ad-valorem equivalent (AVEs) calculations. By analyzing the trade policy instruments of the QUAD countries (the United States, the EU, Canada and Japan), plus Switzerland, and comparing them with those of eight developing countries, it clearly reveals how the QUAD Plus countries have added to the overall imbalances in both tariff and non-tariff measures, thereby further constraining market access for developing countries’ exports in agriculture and allied sectors.
Keywords
Introduction
The Doha Round of the World Trade Organization (WTO) has produced an outcome that is unbalanced against developing countries. This article sets out to document this imbalance and analyze how it came about. The Multilateral Trade Organisations (MTOs) led to the creation of an institutionalized framework with binding commitments in goods for the smooth conduct of trade. 1 Progress can be seen in terms of the reduction in ad-valorem (AV) tariff terms undertaken under the negotiations of the various rounds of MTOs. In case of the agricultural sector, this process has been carried out under Agreement on Agriculture (AoA). 2 The current Doha Round commenced in November 2001, with the objective to reduce trade barriers (tariff and non-tariff measures) and facilitate the increasing of global trade. However, from 2008 onwards the talks have stalled over major issues, such as agriculture and industrial tariffs, non-tariff barriers, services and trade remedies (Fergusson 2008). The major differences are between the developed countries led by the European Union (EU), the United States (USA), Japan and the emerging developing countries.
Tariff reduction has guided all Rounds of MTOs. The GATT negotiations dealt specifically with the concerns of developed countries, with very rare involvement by developing countries, which was mainly limited to manufacturing (non-agricultural sectors). A brief history on the non-agricultural tariff reductions, during the eight rounds of GATT tariff negotiations, held between 1947 and 1994, is shown in Table 1.
Round of Negotiations under the GATT and WTO, 1946 to 2013
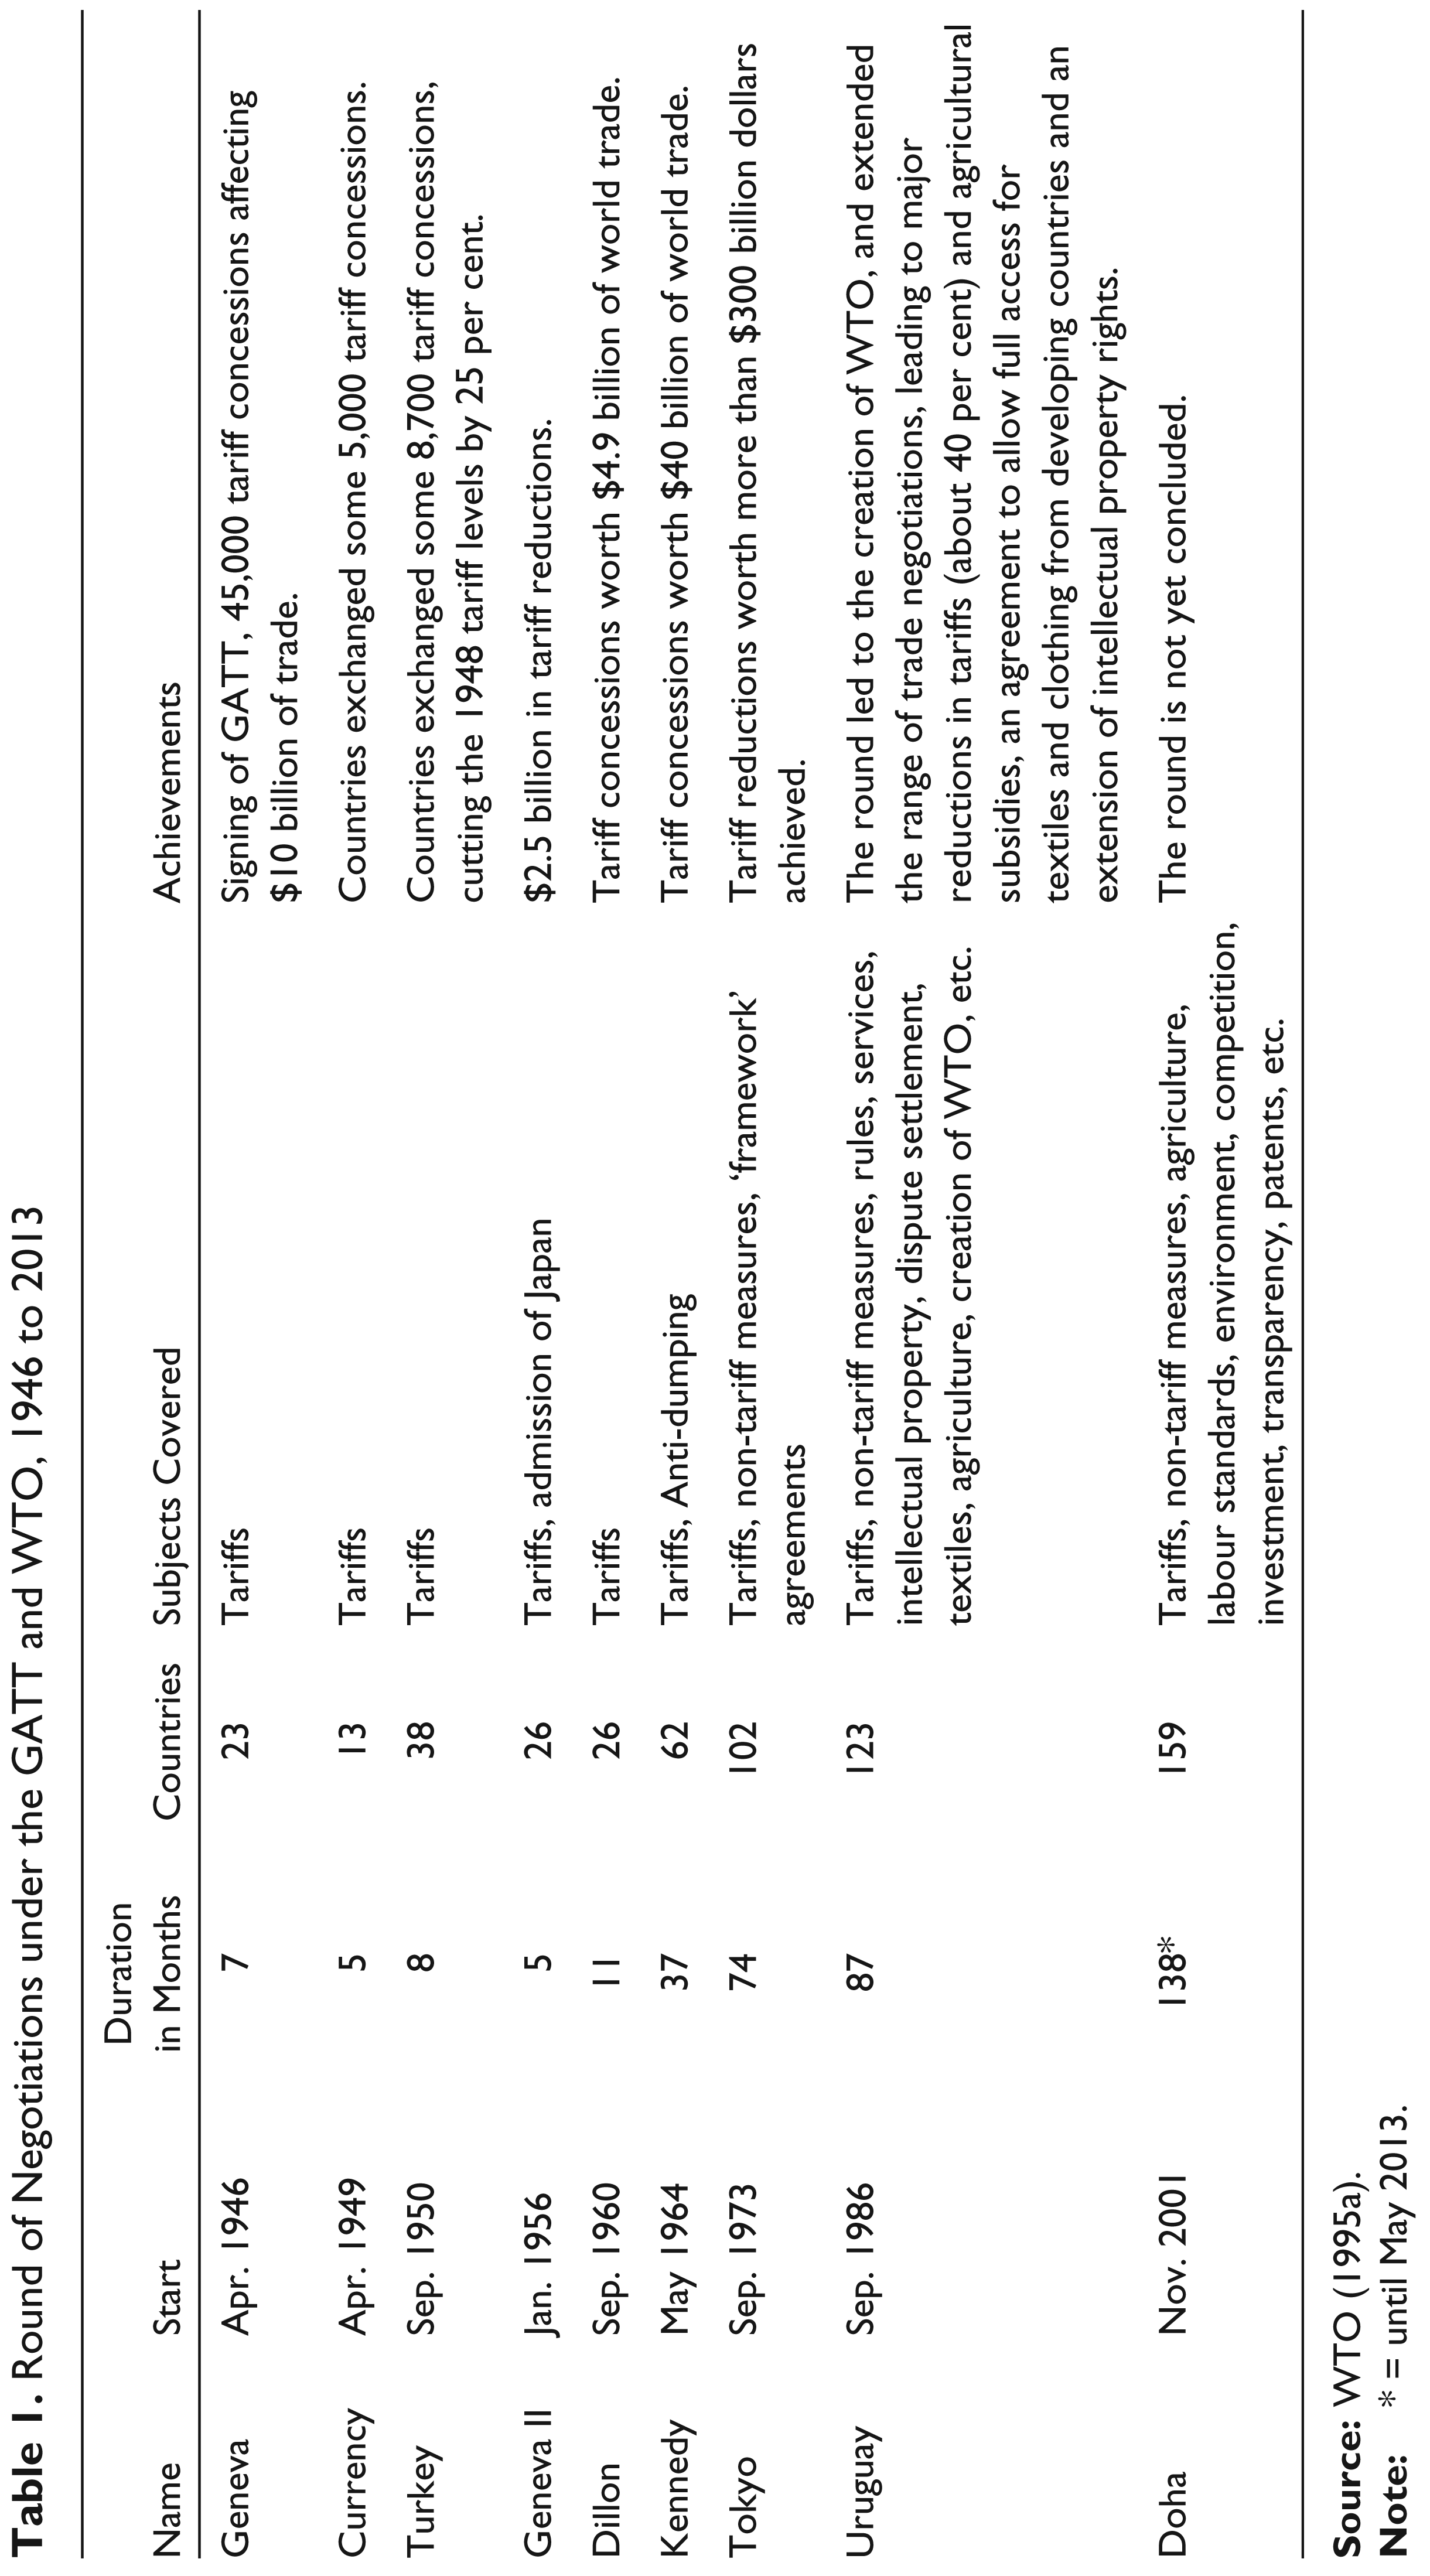
In the first four rounds, negotiations were conducted on a product-by-product basis, known as the ‘request/offer’ approach, whereby GATT members exchanged lists of requests and offers on products of interest to them, in order to reach an agreement on tariff concessions. The first five rounds reduced average trade weighted tariffs from 50 to 12 per cent. The Uruguay Round led to an average tariff reduction of 36 per cent (minimum 15 per cent) over six years by the developed countries and an average tariff reduction of 24 per cent (minimum 10 per cent) over 10 years by the developing countries, with an exception made for Least Developed Countries (LDCs). Most of the tariff reductions were based on the Most Favoured Nation (MFN) principle and on the basis of AVaverage tariff. Under the WTO, in the context of the ‘Single Undertaking’ principle, the simple AV averages are not suitable to a balanced outcome in the negotiations, especially when the developed countries have a considerable number of total tariff lines in non-ad-valorem (NAV) or ‘Specific’ tariffs.
3
To quote (WTO 1995b: para 5):
[t]ariffs on all agricultural products are now bound. Almost all import restrictions that did not take the form of tariffs, such as quotas, have been converted to tariffs—a process known as ‘tariffication’. This has made markets substantially more predictable for agriculture. Previously more than 30% of agricultural produce had faced quotas or import restrictions. The first step in ‘tariffication’ was to replace these restrictions with tariffs that represented about the same level of protection. Then, over six years from 1995–2000, these tariffs were gradually reduced (the reduction period for developing countries ends in 2005).
Although tariffication led to some level of easing, the situation is alarming in the case of agricultural products which the developed countries kept out of the multilateral trade negotiation (MTN) until 1995. However, since the formation of the WTO in January 1995, the serial ministerial meetings that have occurred have stopped short of any conclusive agreement on NAV tariffs. 4 The only consensus obtained on the issue of tariff reductions has been largely based on simple averages of ad-valorem tariffs. This process has excluded a large number of tariff lines in the agricultural sector with NAV duties, which were not taken into account in the Uruguay Round and during a substantial period of the Doha Round. Many studies have suggested that an increasing proliferation of the WTO compatible barriers, like the non-tariff measures, may have offset the gains in liberalization made during the successive round of GATT and WTO. However, one important aspect which needs to be fully understood is the role NAV tariffs in agricultural products. 5
Tariff Simplification under the Agriculture Negotiations
It has been recognized since the Havana Charter that there are inherent inequalities between the ‘players’ in the MTOs, thus justifying special attention to the needs and concerns of developing countries (Toye 2003). The preamble of the Marrakesh Agreement establishing the WTO clearly recognizes the same need and suggests positive efforts to ensure that developing countries and the LDCs play a much greater role and secure a share of the growth in international trade commensurate with the needs of their economic development (WTO 2001). However, virtually the opposite of these suggestions has occurred since the Havana Charter. The Uruguay Round, the eighth round, brought agriculture into the ambit of negotiations under the Single Undertaking of the WTO, while ‘tariff simplification’ for agriculture was officially introduced in 2006, consisting in a process of converting NAV tariffs to AV terms, popularly known as ad-valorem equivalents (AVEs). The large majority of agricultural tariff lines are under these complex NAV duties, which provide sufficient protection. Some of the examples of NAV duties can be represented in four major forms:
Quantitative (Specific) duty is expressed in the form of 35 euro/dollar per one kilogram and euro/dollar 1.34 per 1,000 onions. Mixed duty would read as: (a) 35 euro/dollar per one kilogram, or 125 per cent of the value (whichever is the higher); (b) 280 euro/dollar per one bottle, or 55 per cent (the lesser); (c) 360 euro/dollar per one ton, but not less than 125 per cent of the value of imports; and (d) 1.92 special unit for tariff lines per one kilogram, or 204 per cent of the value (the higher). Compound duty would read as: (a) 12.8 per cent + 17 euro/dollar per one ton; (b) 10 per cent + 125 euro/dollar per one kilogram; (c) 5per cent + 661.4 euro/dollar per one ton; (d) 29.8 per cent + 400 euro/dollar per one kilogram. Other duty types read as: (a) 35 euro/dollar per one kilogram, −0.0207 euro/dollar for each lost bond of sweetness, but not more than 3.14 euro/dollar per kilogram; (b) 13 per cent + Maximum of 7.2 per cent + bound tariff for agricultural products (c) 48 euro/dollar per bottle + 1.3 per cent per bottle; and (d) 10.4 per cent + 71 euro/dollar + specific fee that can be zeroed if entry price is not less than 373 euro/dollar.
The earlier are a few examples of the various forms of NAV tariffs that exist in the real world. Most of these have been applied by the developed countries and need to be converted into AV duties through tariff simplification. 6 This process is important in partial fulfilment of the WTO’s ‘line-by-line’ binding commitments under AoA—which is primarily based on MFN Simple averages in AV terms. The Doha Round Mandate did not specify any course of action with regard to the conversion of NAV duties, and the use of NAV duties continued as a major trade policy even after 2001. It can be argued that this has been a clear violation of the spirit of ‘free trade’ ever since the binding commitments agreed upon across all goods sectors at the end of the Uruguay Round.
However, there are differences in the proportion of usage of the NAV duties across the agricultural and non-agricultural sectors. The proportion of usage of NAV duties by the developed countries in Agricultural and Allied Products (A&AP) has been greater in comparison to their usage in the non-agricultural sector. The usage of NAV duties has undermined market access by developing countries in A&AP, and this has been one of the fundamental causes of imbalance in the Doha Round.
Only in 2006, under the Doha Round negotiations, was the NAV duty issue raised, through two separate processes of tariff simplification. However, with respect to the agricultural sector, the overall guide has been the Draft Text Mandate (6 December 2008). In the words of the Agricultural Chair concluding the overall negotiation process (WTO 2008: 1, Para 4):
[b]y and large that has been the case, and some other issues have come somewhat closer also since even in July. But, clearly, there is still not formal agreement on any or all of this. Indeed, there is still certain divergence where even the device of square brackets has been dropped, and I have felt it was both instructive and fair to highlight within the text itself a few points where there is still very real divergence (sensitive products being a principal example) or where there is, to say the least, somewhat more heat detectable than on some others (tariff simplification being an example).
It is clear that among the few contentious issues in the negotiations, agricultural tariff simplification is one of the prominent ones. As negotiations progressed, Das and Sharma (2011) concluded that simplification of compound tariffs and mixed tariffs appeared to have receded into the background. In the February 2008 text, there was a specific obligation to convert these tariffs into simple AV tariffs or specific tariffs at the end of the first year of implementation. In the December 2008 text, there was no specific requirement to convert these NAV tariffs into more simplified forms, if the option of mandatory simplification of all NAV tariffs were not agreed. They also suggested that the trend in negotiations to provide greater comfort to developed countries relates to the timeframe in which obligations relating to tariff simplification will be implemented (Das and Sharma 2011).
Agriculture was traditionally protected across the developed and some of the developing countries on the basis of concerns for food security and protection of livelihoods. Therefore, A&AP have always been subject to measures like subsidies, tariff rate quotas (TRQs) and NAV tariffs. One fundamental requirement has been that imported agricultural products must be safe for human consumption and not pose risks to human, animal, or plant health. Countries have always imposed regulations/standards in order to ensure food safety, as well as to avoid the introduction of diseases and pests through trade. Trade in agricultural commodities and related standards/regulations have coexisted since the beginning of international trade under GATT. 7
To analyze the impact on market access negotiations of the NAV duties in the A&AP and its significance for global trade, we have selected 14 countries, namely, Switzerland, Australia, New Zealand, EU-27, Japan, the USA, Canada, Brazil, India, China, South Korea, Singapore, Mexico and Argentina. WTO members among developed and developing countries, using the integrated database (IDB) of the WTO, which provides detailed and disaggregated tariff information, such as base nomenclature, reporter, year, AV duty rate, NAV/specific duty rate, duty nature, binding code and description.
Use of NAV Tariffs by Developed Countries
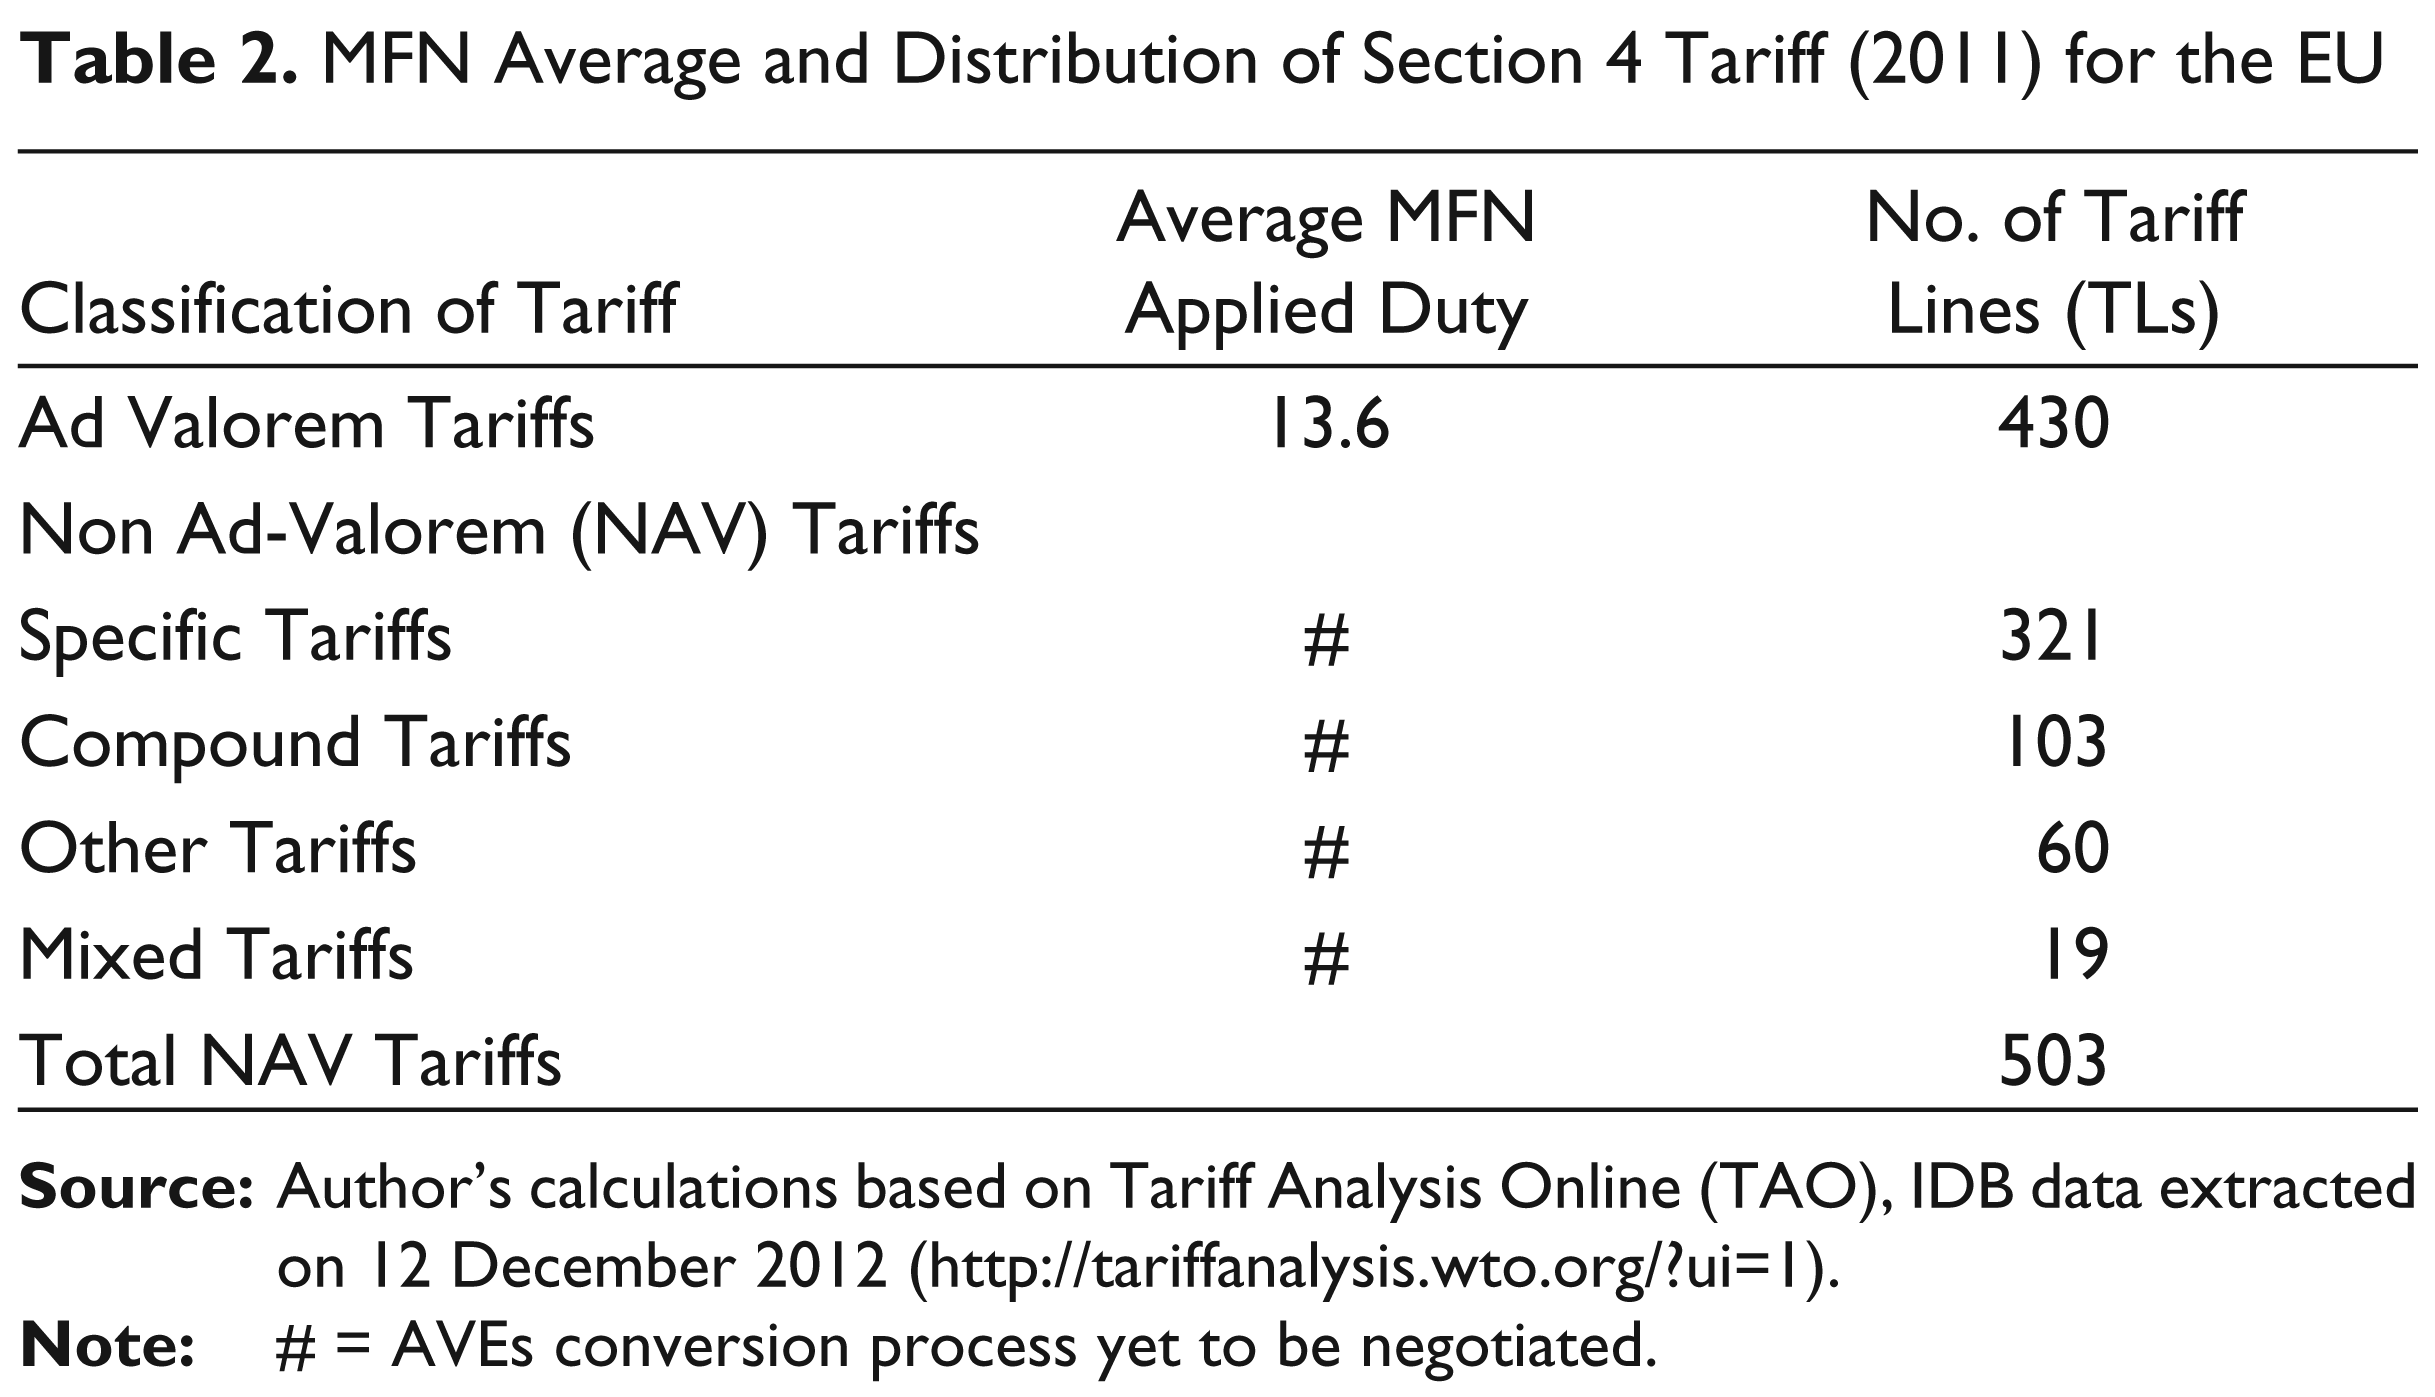
Tariff simplification was initiated in the agriculture and allied sectors in order to address the large-scale presence of NAV tariff lines under the AoA negotiations and bring the average MFN applied tariff rates within the ambit of binding commitments, 8 as well as various other disciplines of market access. This sub-section will specifically address the issue of presence of NAV duties, by examining the QUAD countries (the United States, the EU, Canada and Japan, plus Switzerland, which are the main users of NAV duties (Table 2).
MFN Average and Distribution of Section 4 Tariff (2011) for the EU
The European Union
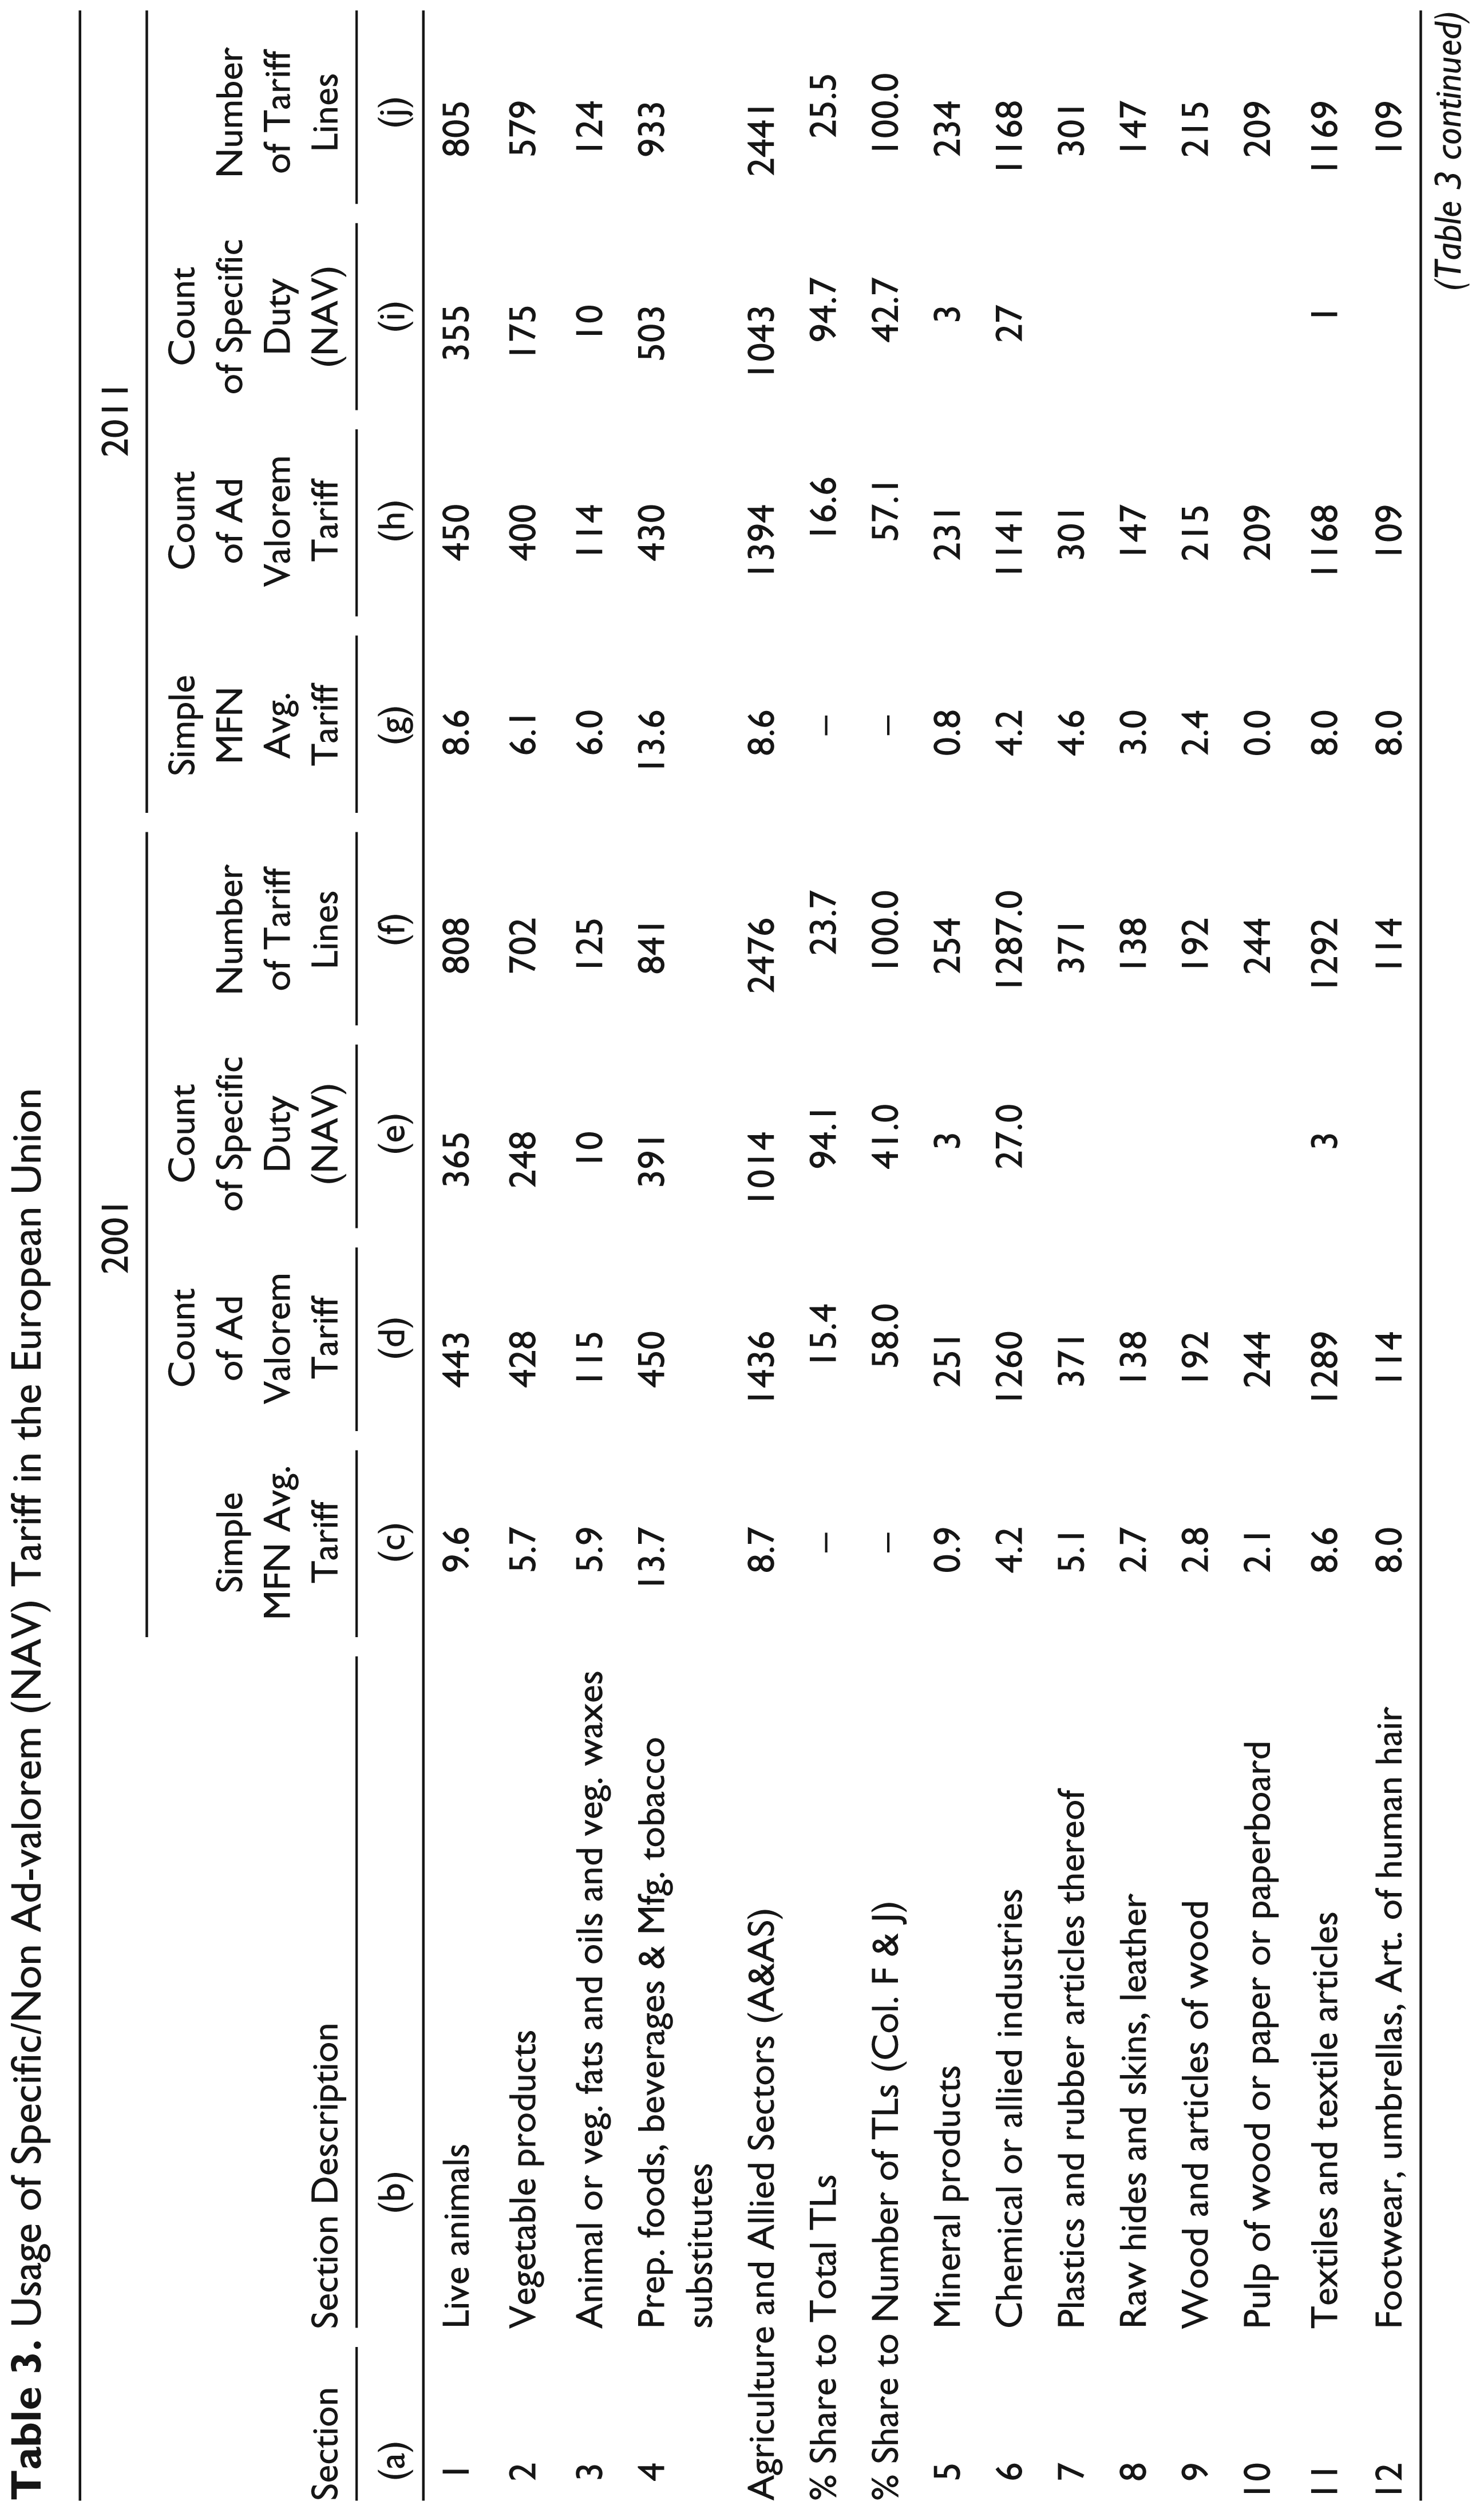
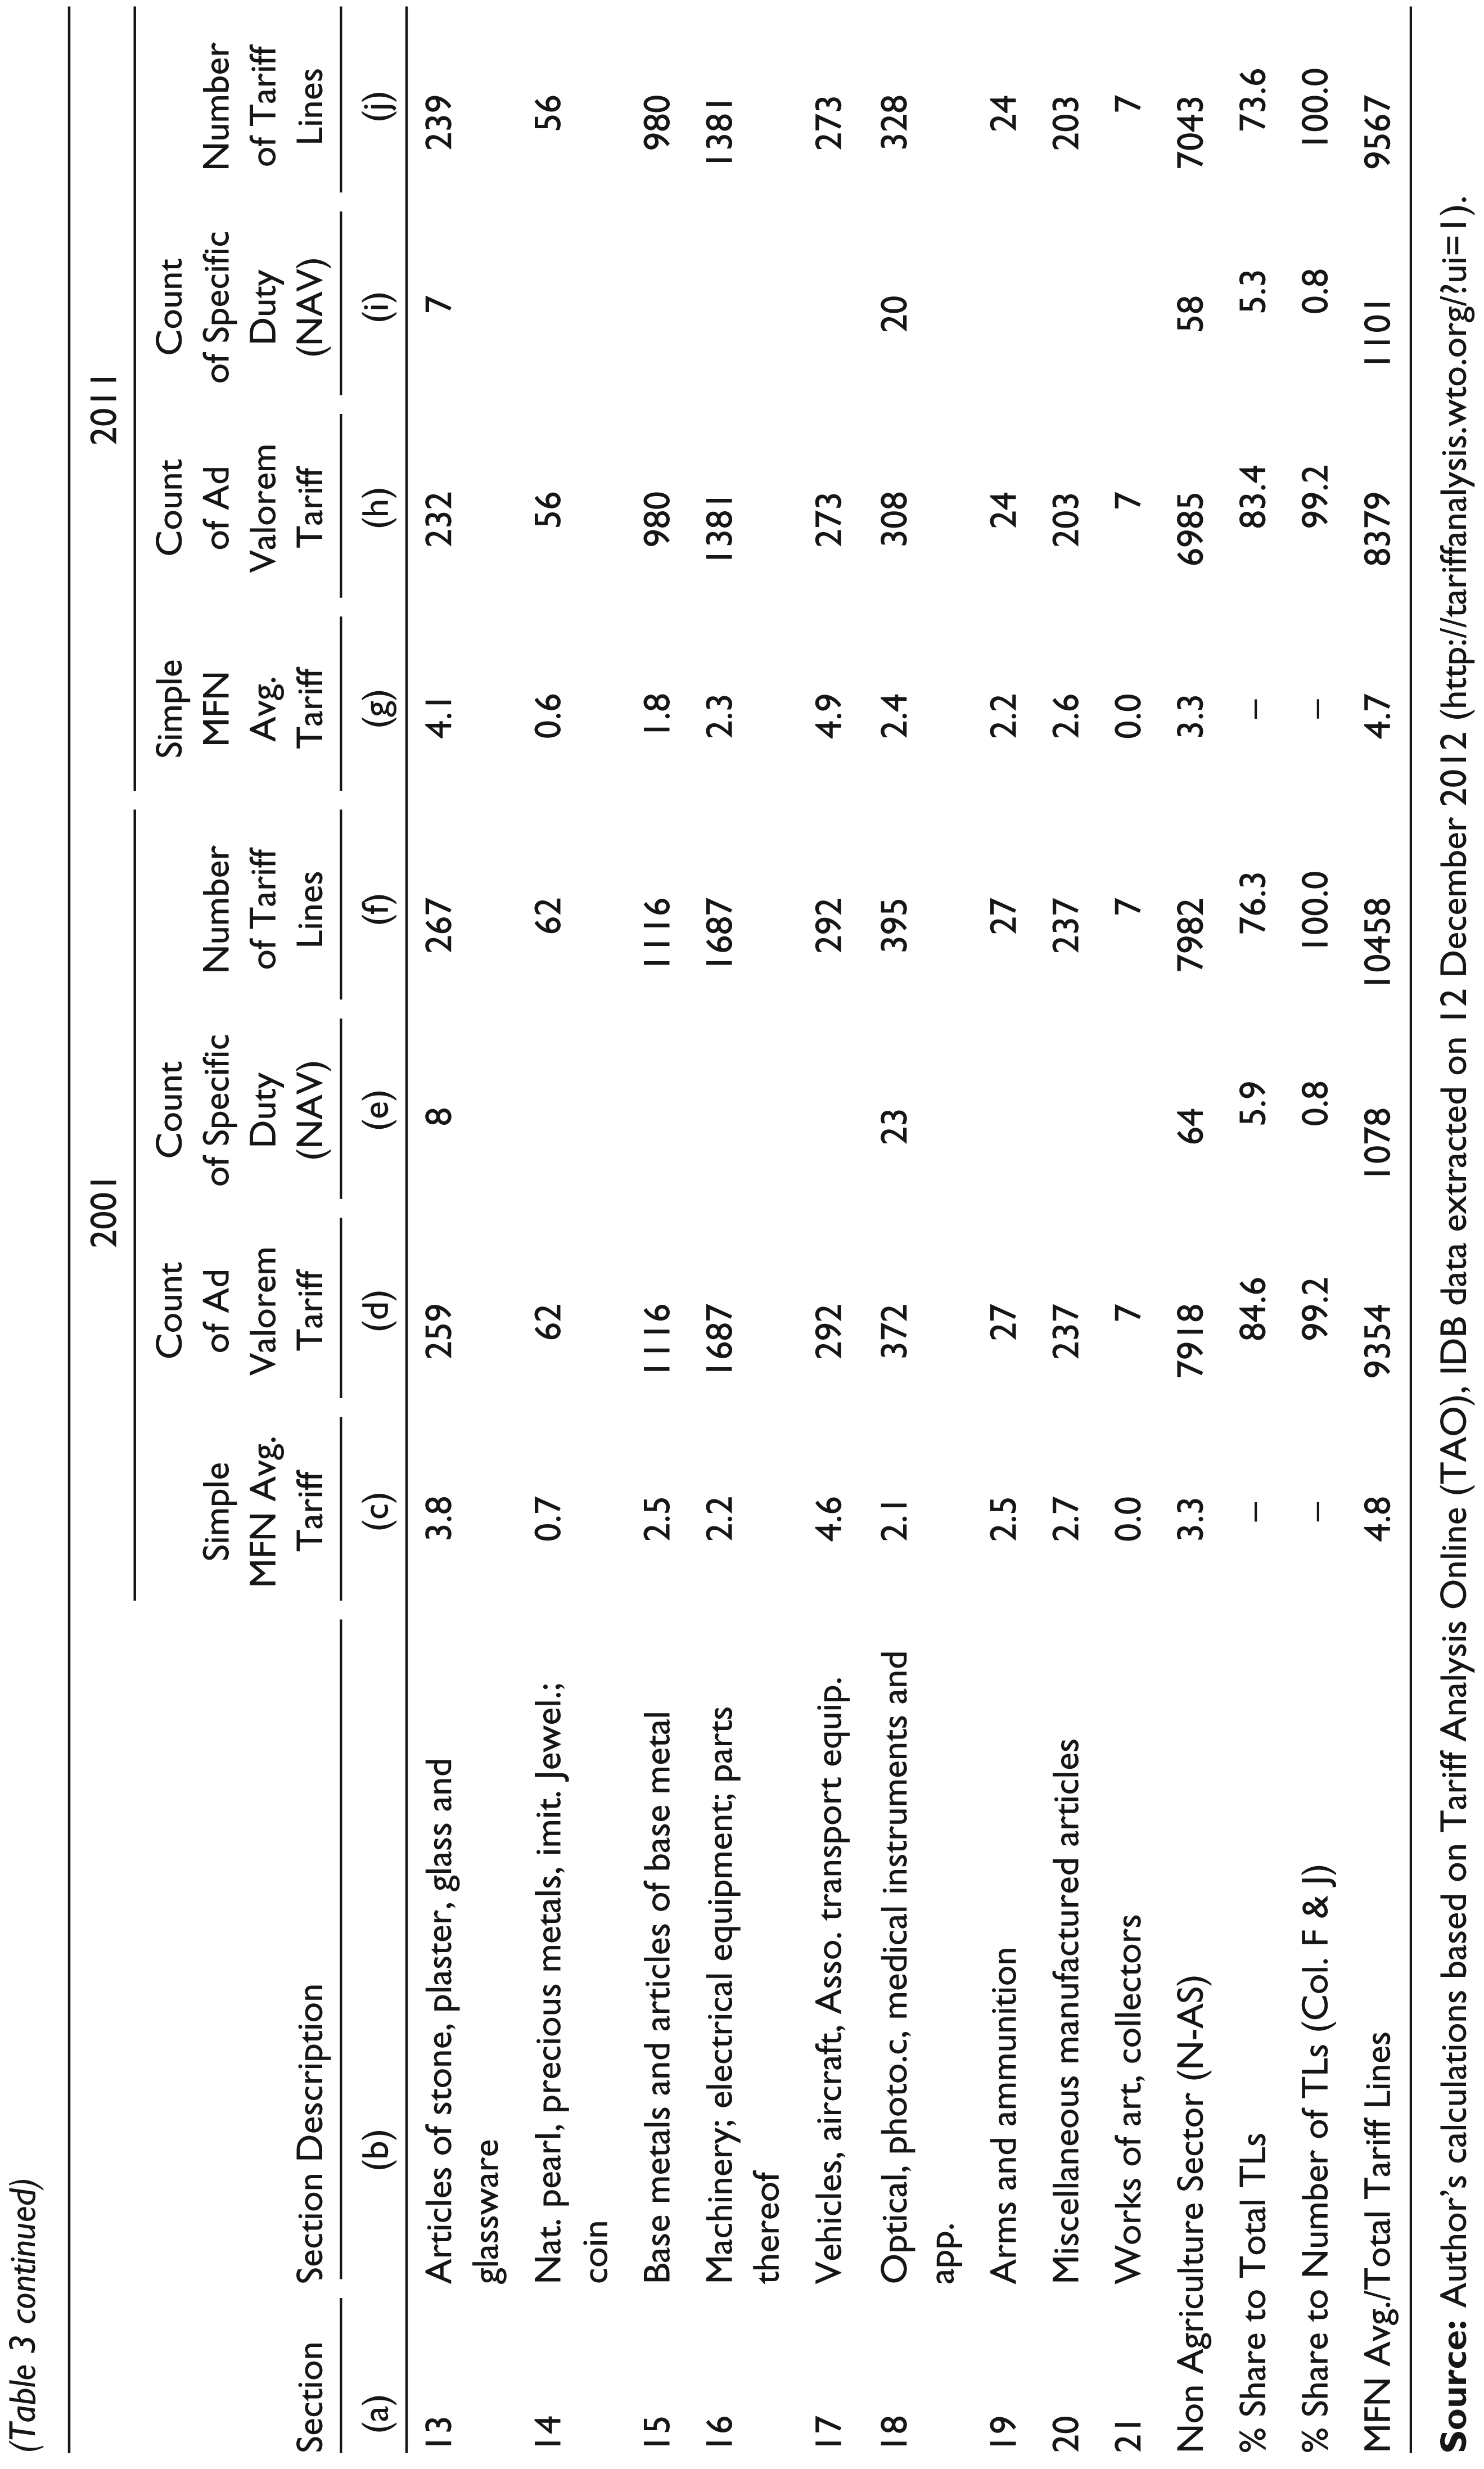
The European Union (EU) has been an active member of the WTO negotiations processes in nearly all the committees, demanding tariff liberalization of the partners. Yet, Table 3 shows the prevalence of NAV duties that go unaccounted in the process of simple MFN average tariff calculations. It also suggests the futility of the Doha Round in comparing countries on the basis of simple average AV MFN duties. The EU’s usage of specific duties is unparalleled, and it does not in any manner justify the ‘free trade’ spirit of the WTO.
In the context of market access negotiations for A&AP, the role of specific duties and their impact will clearly be far greater, while their usage has been observed to be highly skewed in favour of Sections 1 to 4 (A&AP). The results clearly suggest that simple average of AV tariffs have shown a reduction of only 0.1 per cent in a span of nearly a decade (Table 3). Interestingly, the Doha Round also began around that time, in 2001. Based on the results of simple averages of largely AV tariffs, we can establish that the EU has not made any tariff liberalization–the average MFN tariff hovering around 4.8 per cent (2001) and 4.7 per cent (2011) (Table 3). However, total tariff lines (TLs) have decreased by approximately 1,000 from 10,458 in 2001 to 9,567 in 2011 (see Table 3, last row). A substantial share of the reduction occurred in the non-agricultural sector, with total tariff lines decreasing by 938, while the Sections 1 to 4 (A&AP) accounted for only marginal reductions in TLs. Based on information on the A&AP of TLs and average MFN, it could be argued that with a marginal reduction in TLs and only negligible reductions in terms of MFN tariffs across the decade, the prospects for market access are bleak for developing countries.
The NAV duties showed an increasing share during the period of study, from 10.3 per cent in 2001 to 11.5 per cent by 2011. The absolute number of NAV duties in A&AP in the EU has shown a marginal increase from 1,014 TLs in 2001 to 1,043 in 2011. However, A&AP, which account for the raw agricultural goods and processed food products, amounted to a substantial portion of these NAV, nearly 95 per cent in the two years studied. The AVEs of these TLs would suggest the extent of duties levied by the EU countries. Clearly, the adverse impact would be borne by exporters to the EU in the agricultural and allied products.
Therefore, in the EU there was a negative impact on A&AP trade. This negative impact can be seen in the Section 4 (prepared foodstuffs, beverages, spirits and vinegar, tobacco and manufactured tobacco substitutes) which showed an increase from 841 to 933 TLs. During the same period, the number of AV TLs has shown a decreasing trend. The section-wise trend suggests that Section 4 (a section is an aggregation of few chapters) was one of the most ‘protected’ (given the lack of clarity of the WTO mandate) in the EU, through the use of specific duties.
Usage of Specific/Non Ad-valorem (NAV) Tariff in the European Union
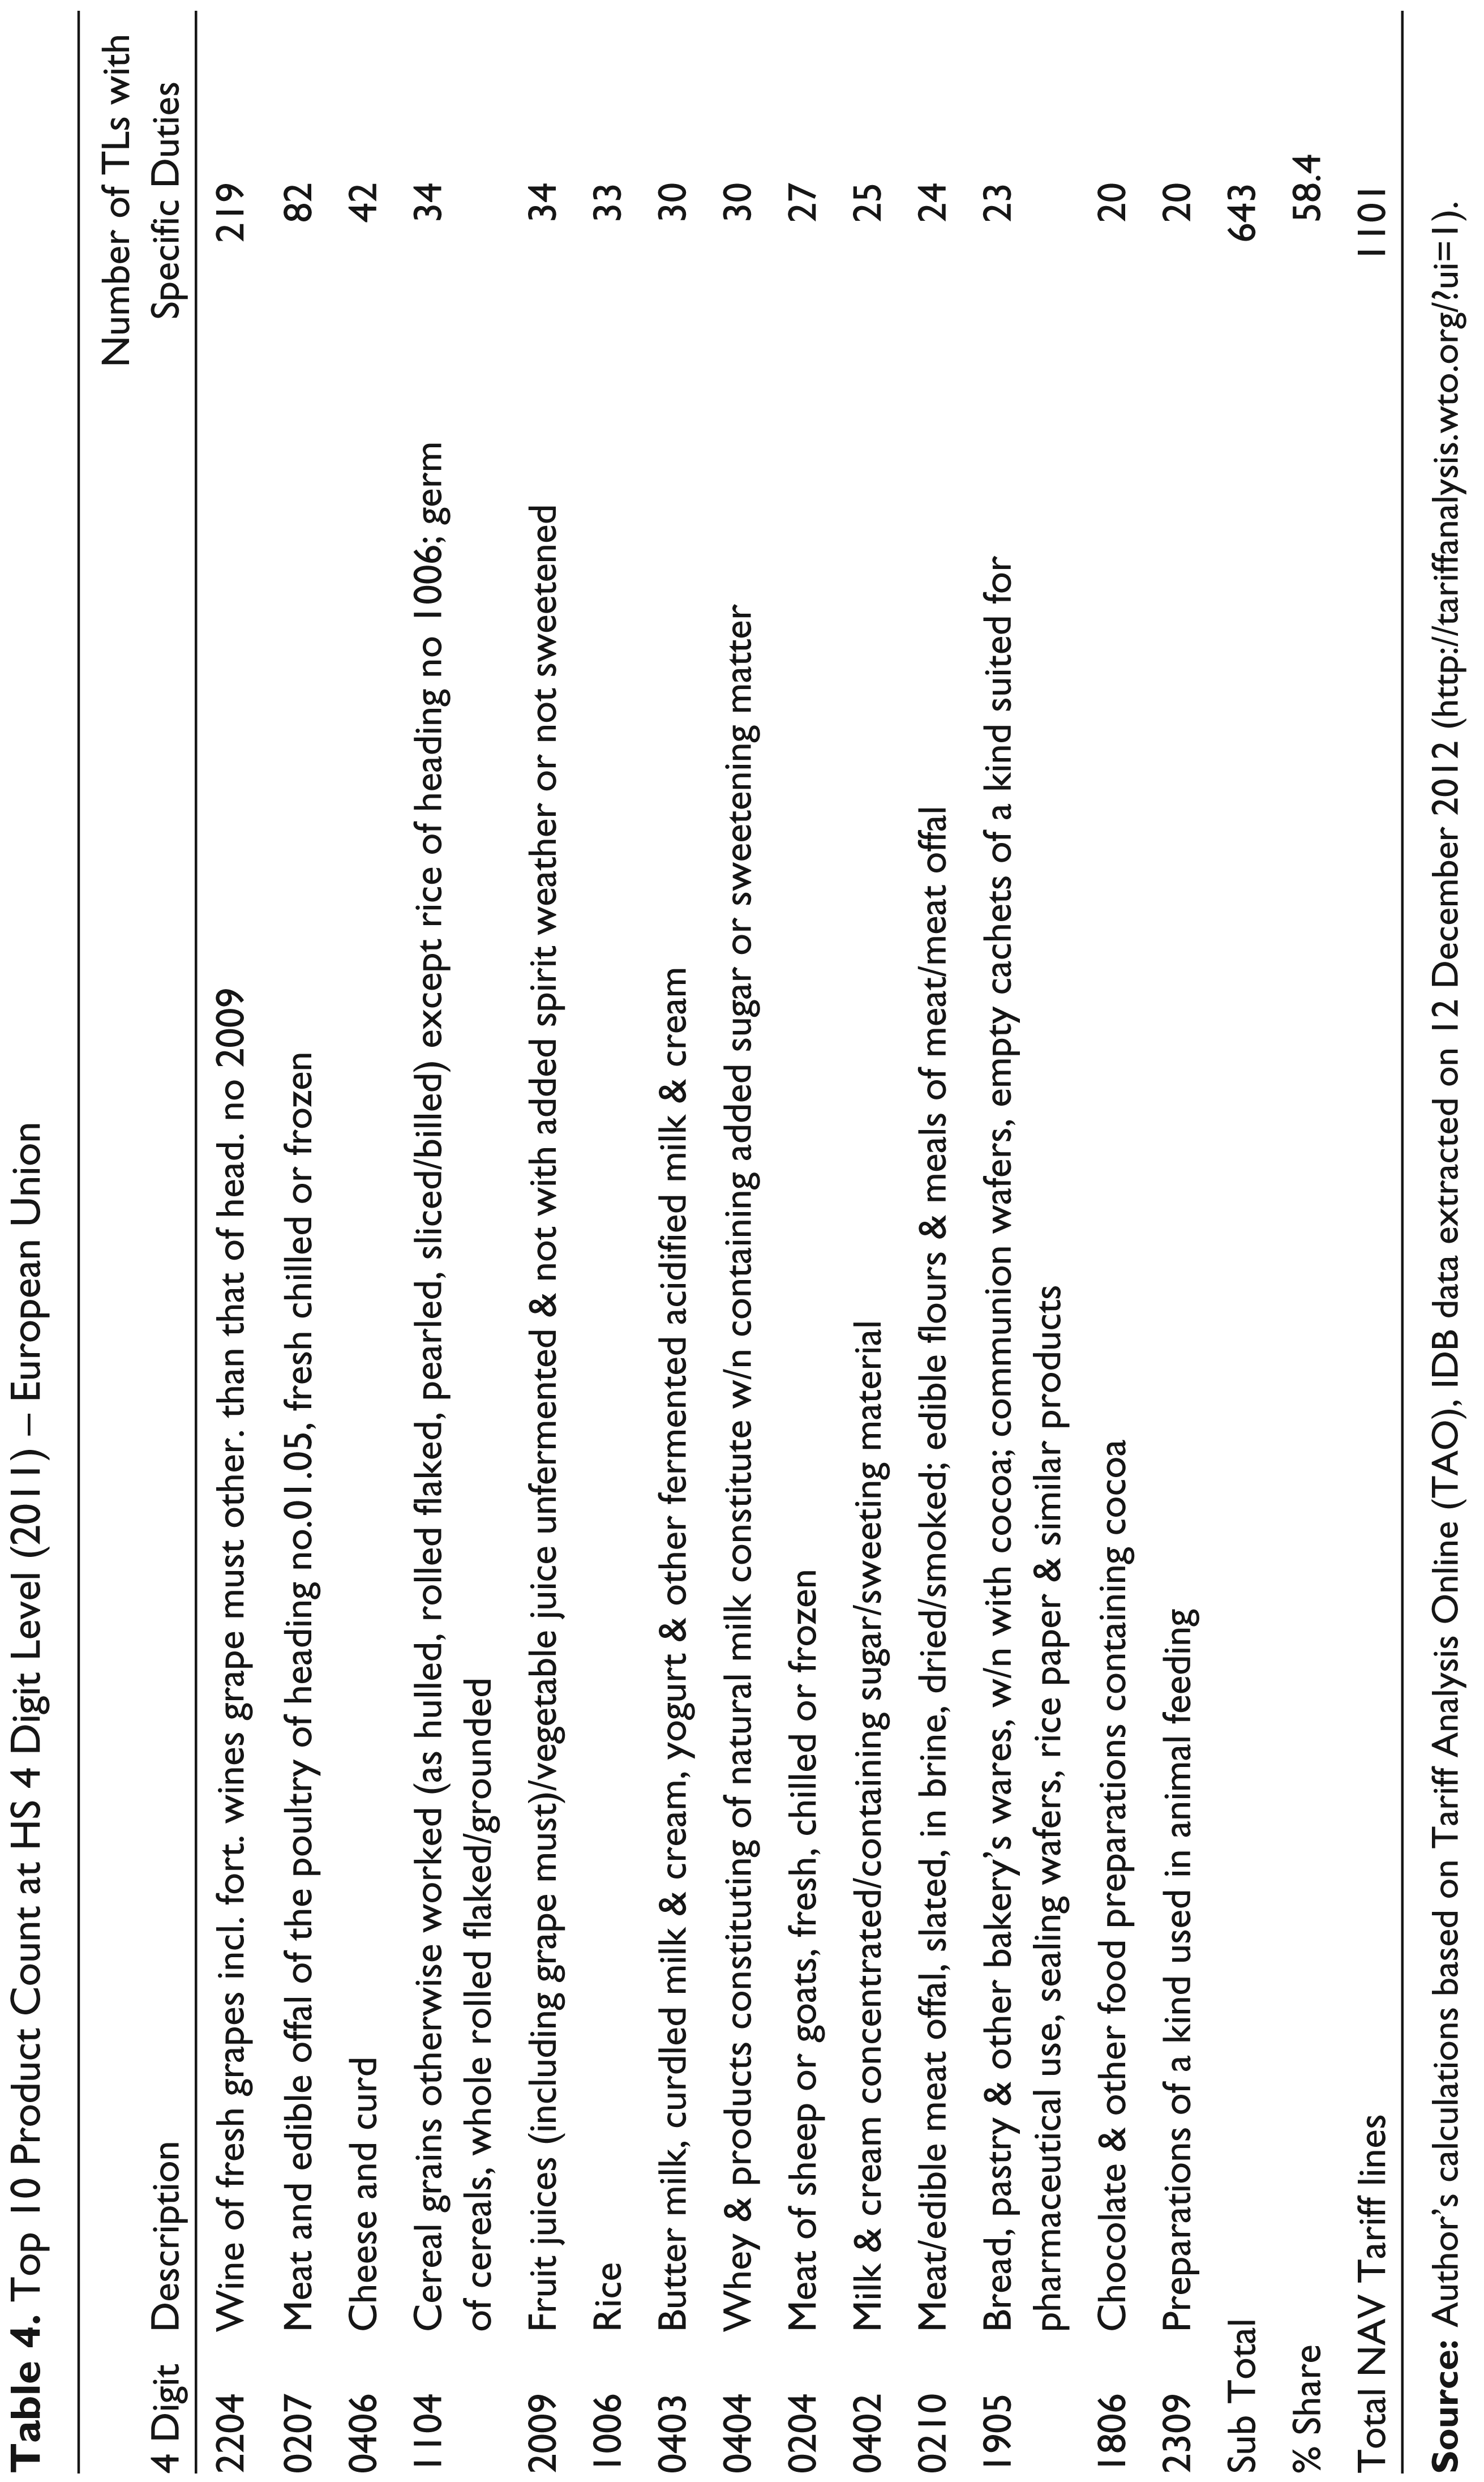
Section 4 has been analyzed in detail in Table 4. For at least 503 TLs it may be difficult to compute the average duties due to the presence of specific duties. Section 4 covers about nine processed food chapters; however the highest number of 245 specific duties is seen in only one chapter, beverages, spirits and vinegar. The other dominant chapters were Chapter 2 (vegetable products) with 169 TLs, followed by Chapter 4 (dairy produce and birds’ eggs, and natural honey edible and products of animal origin) with 157 TLs. Clearly one can find that the EU protected these three sectors in response to domestic pressure. It consists in a violation of the basic spirit of free trade in especially higher value-added products. Over all, the EU has paid its farmers direct payments (de-coupled income support) of close to €31,482 million in 2009/10, under its Domestic Subsidies Programme as notified under the AoA (WTO 2012), besides using tariff protection by means NAV duties and non-tariff measures in the form of SPS and TBT measures which deviate from international standards.
Table 4 indicates that at the four digit level the products which faced the stiffest possible entry barriers all belonged to the agricultural and allied sectors. The most protected products are the HS 2204 (wine of fresh grapes), with nearly 20 per cent of the total specific duties used in 2011. Some of the less protected agricultural products were meat (0207); curd and cheese (0406); cereal grains otherwise worked (1104); fruit juices (2009) and rice (1006). Again, this clearly indicates that the EU violates the ‘free trade’ spirit, as well as the special needs and development concerns of the developing countries. Therefore, the process of negotiation by the EU of the AVEs would provide developing countries with more import access and have substantial trade benefits in A&AP.
Top 10 Product Count at HS 4 Digit Level (2011) – European Union
Canada
Canada has been relatively non-partisan member in terms of the WTO’s negotiations in the AoA. However, Table 5 clearly highlights that, like the EU, Canada also has maintained NAV duties from the beginning of the Doha Round—385 TLs, or 3.5 per cent of total TLs, then reduced by 43 TLs to 342 TLs by 2011.
Canada’s MFN Average Tariff Rates and the Distribution of Specific Duties
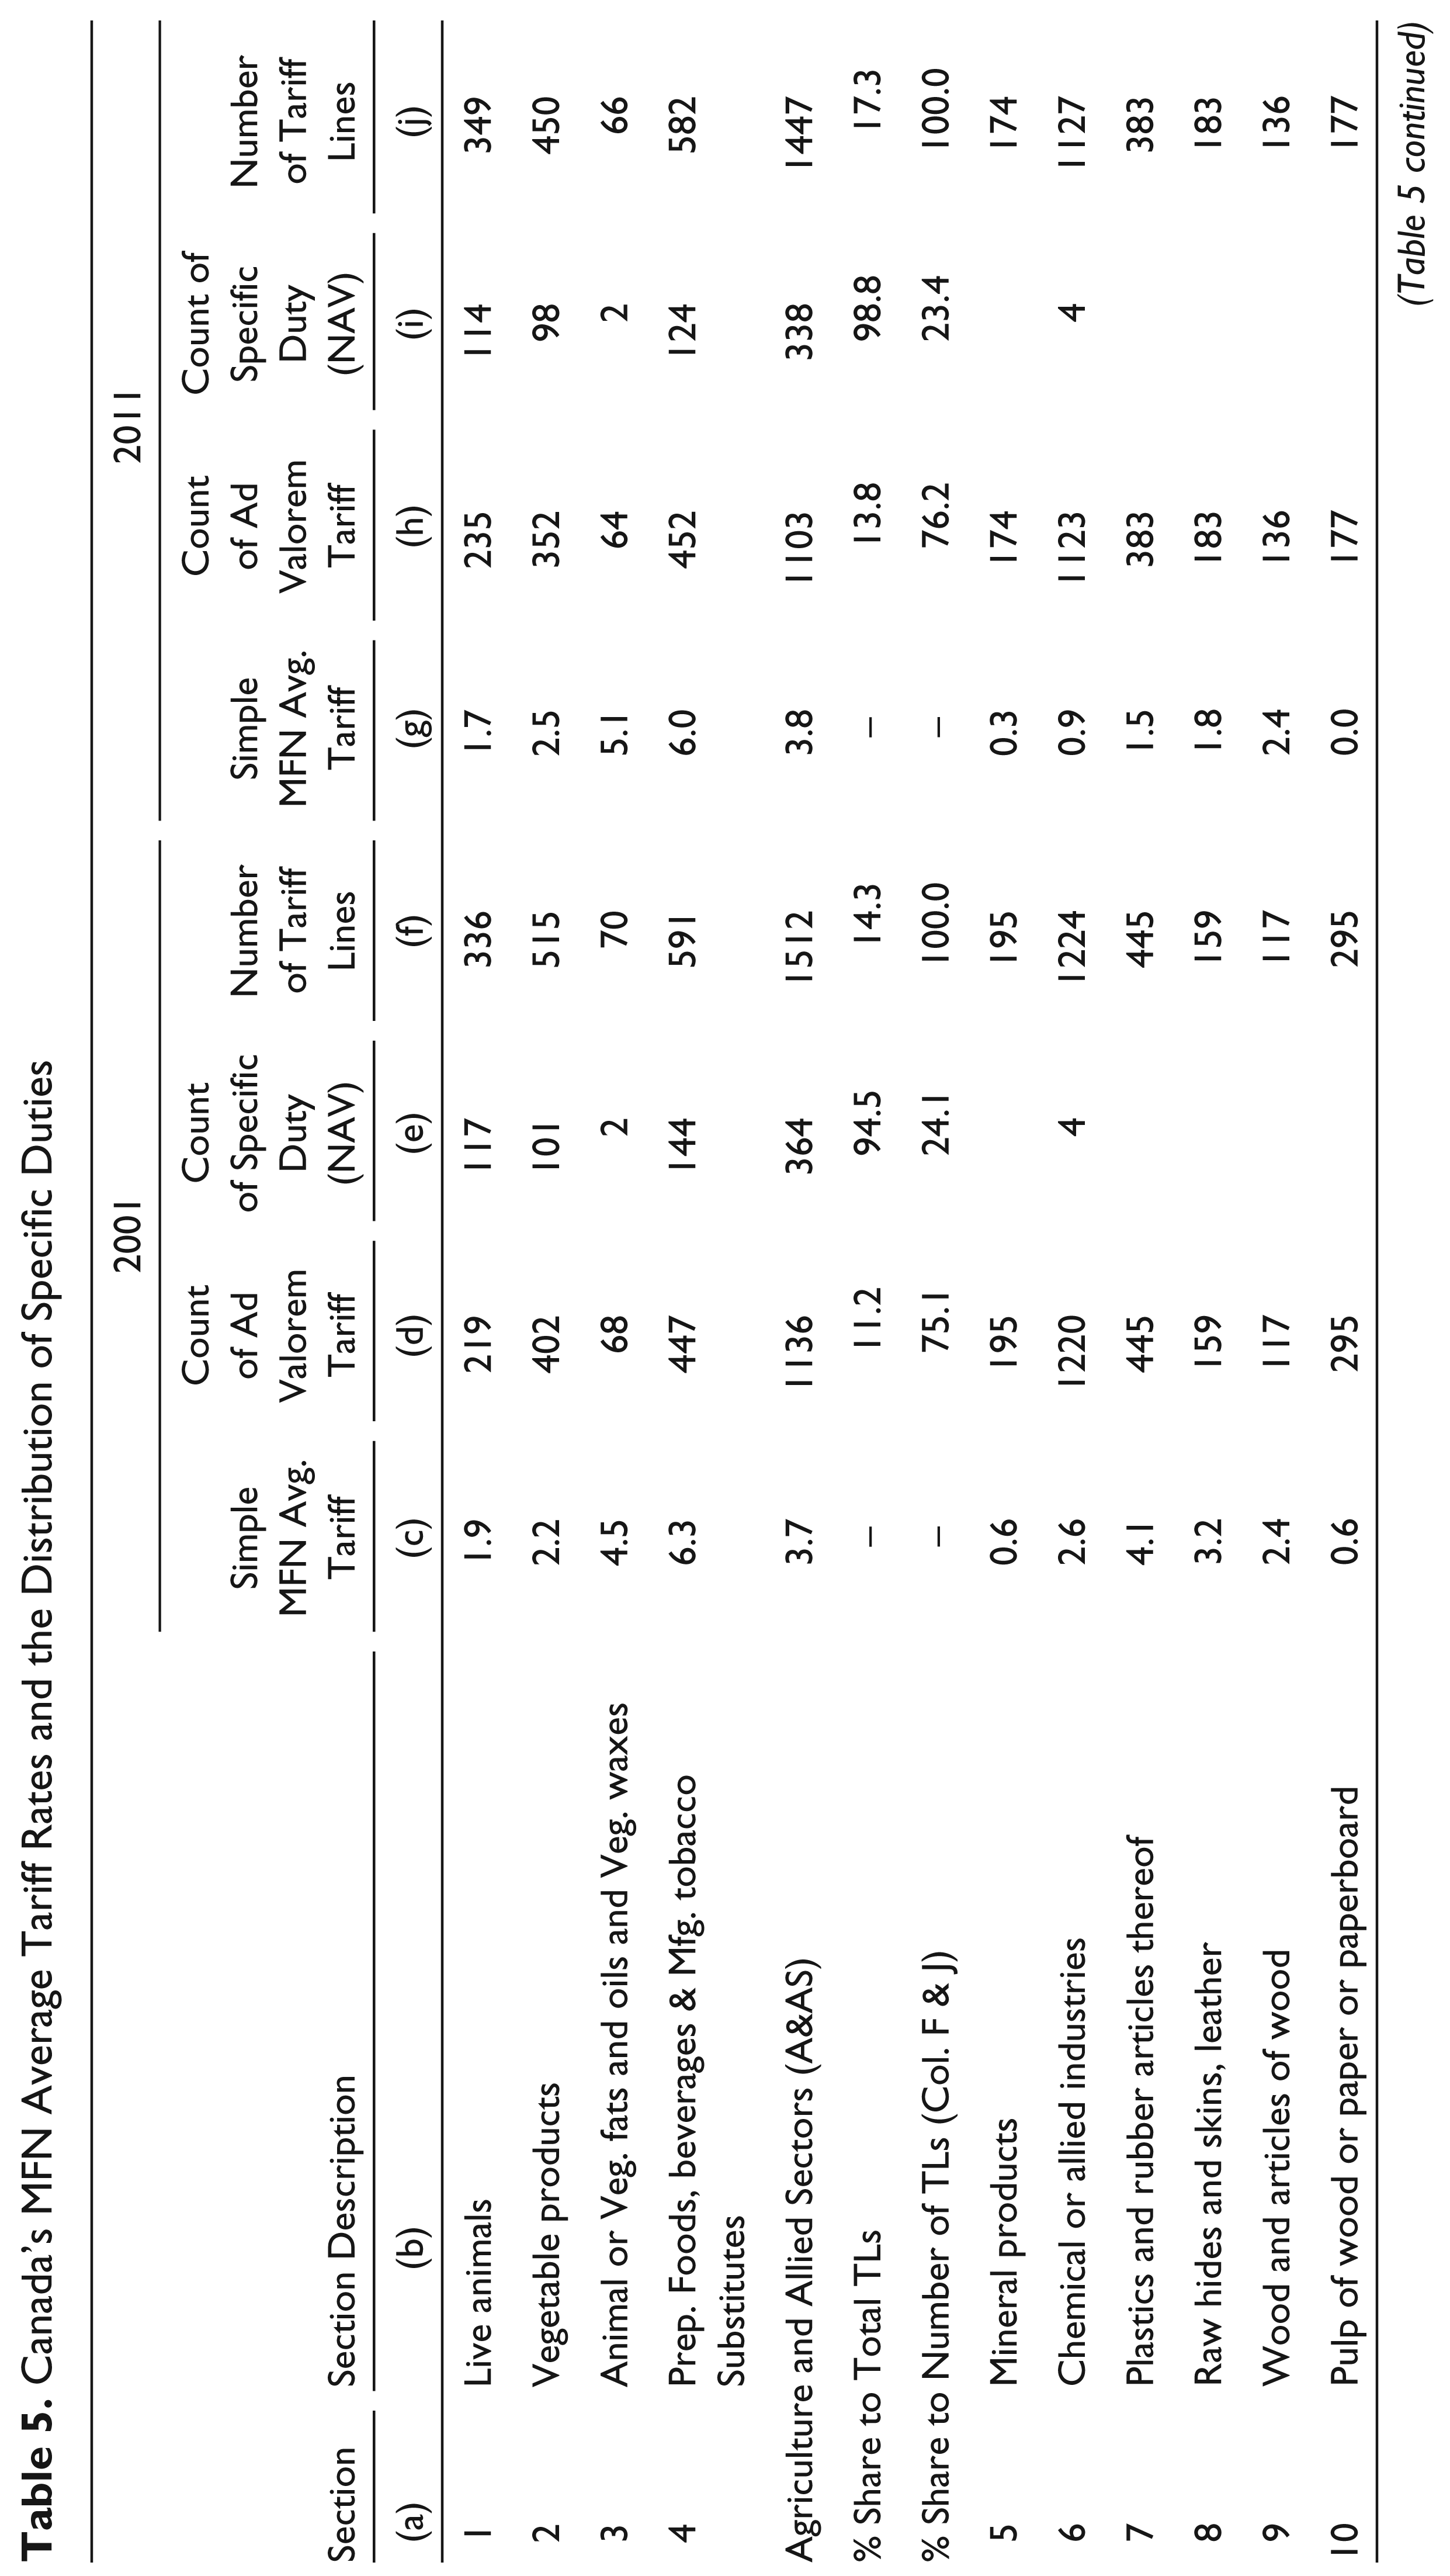
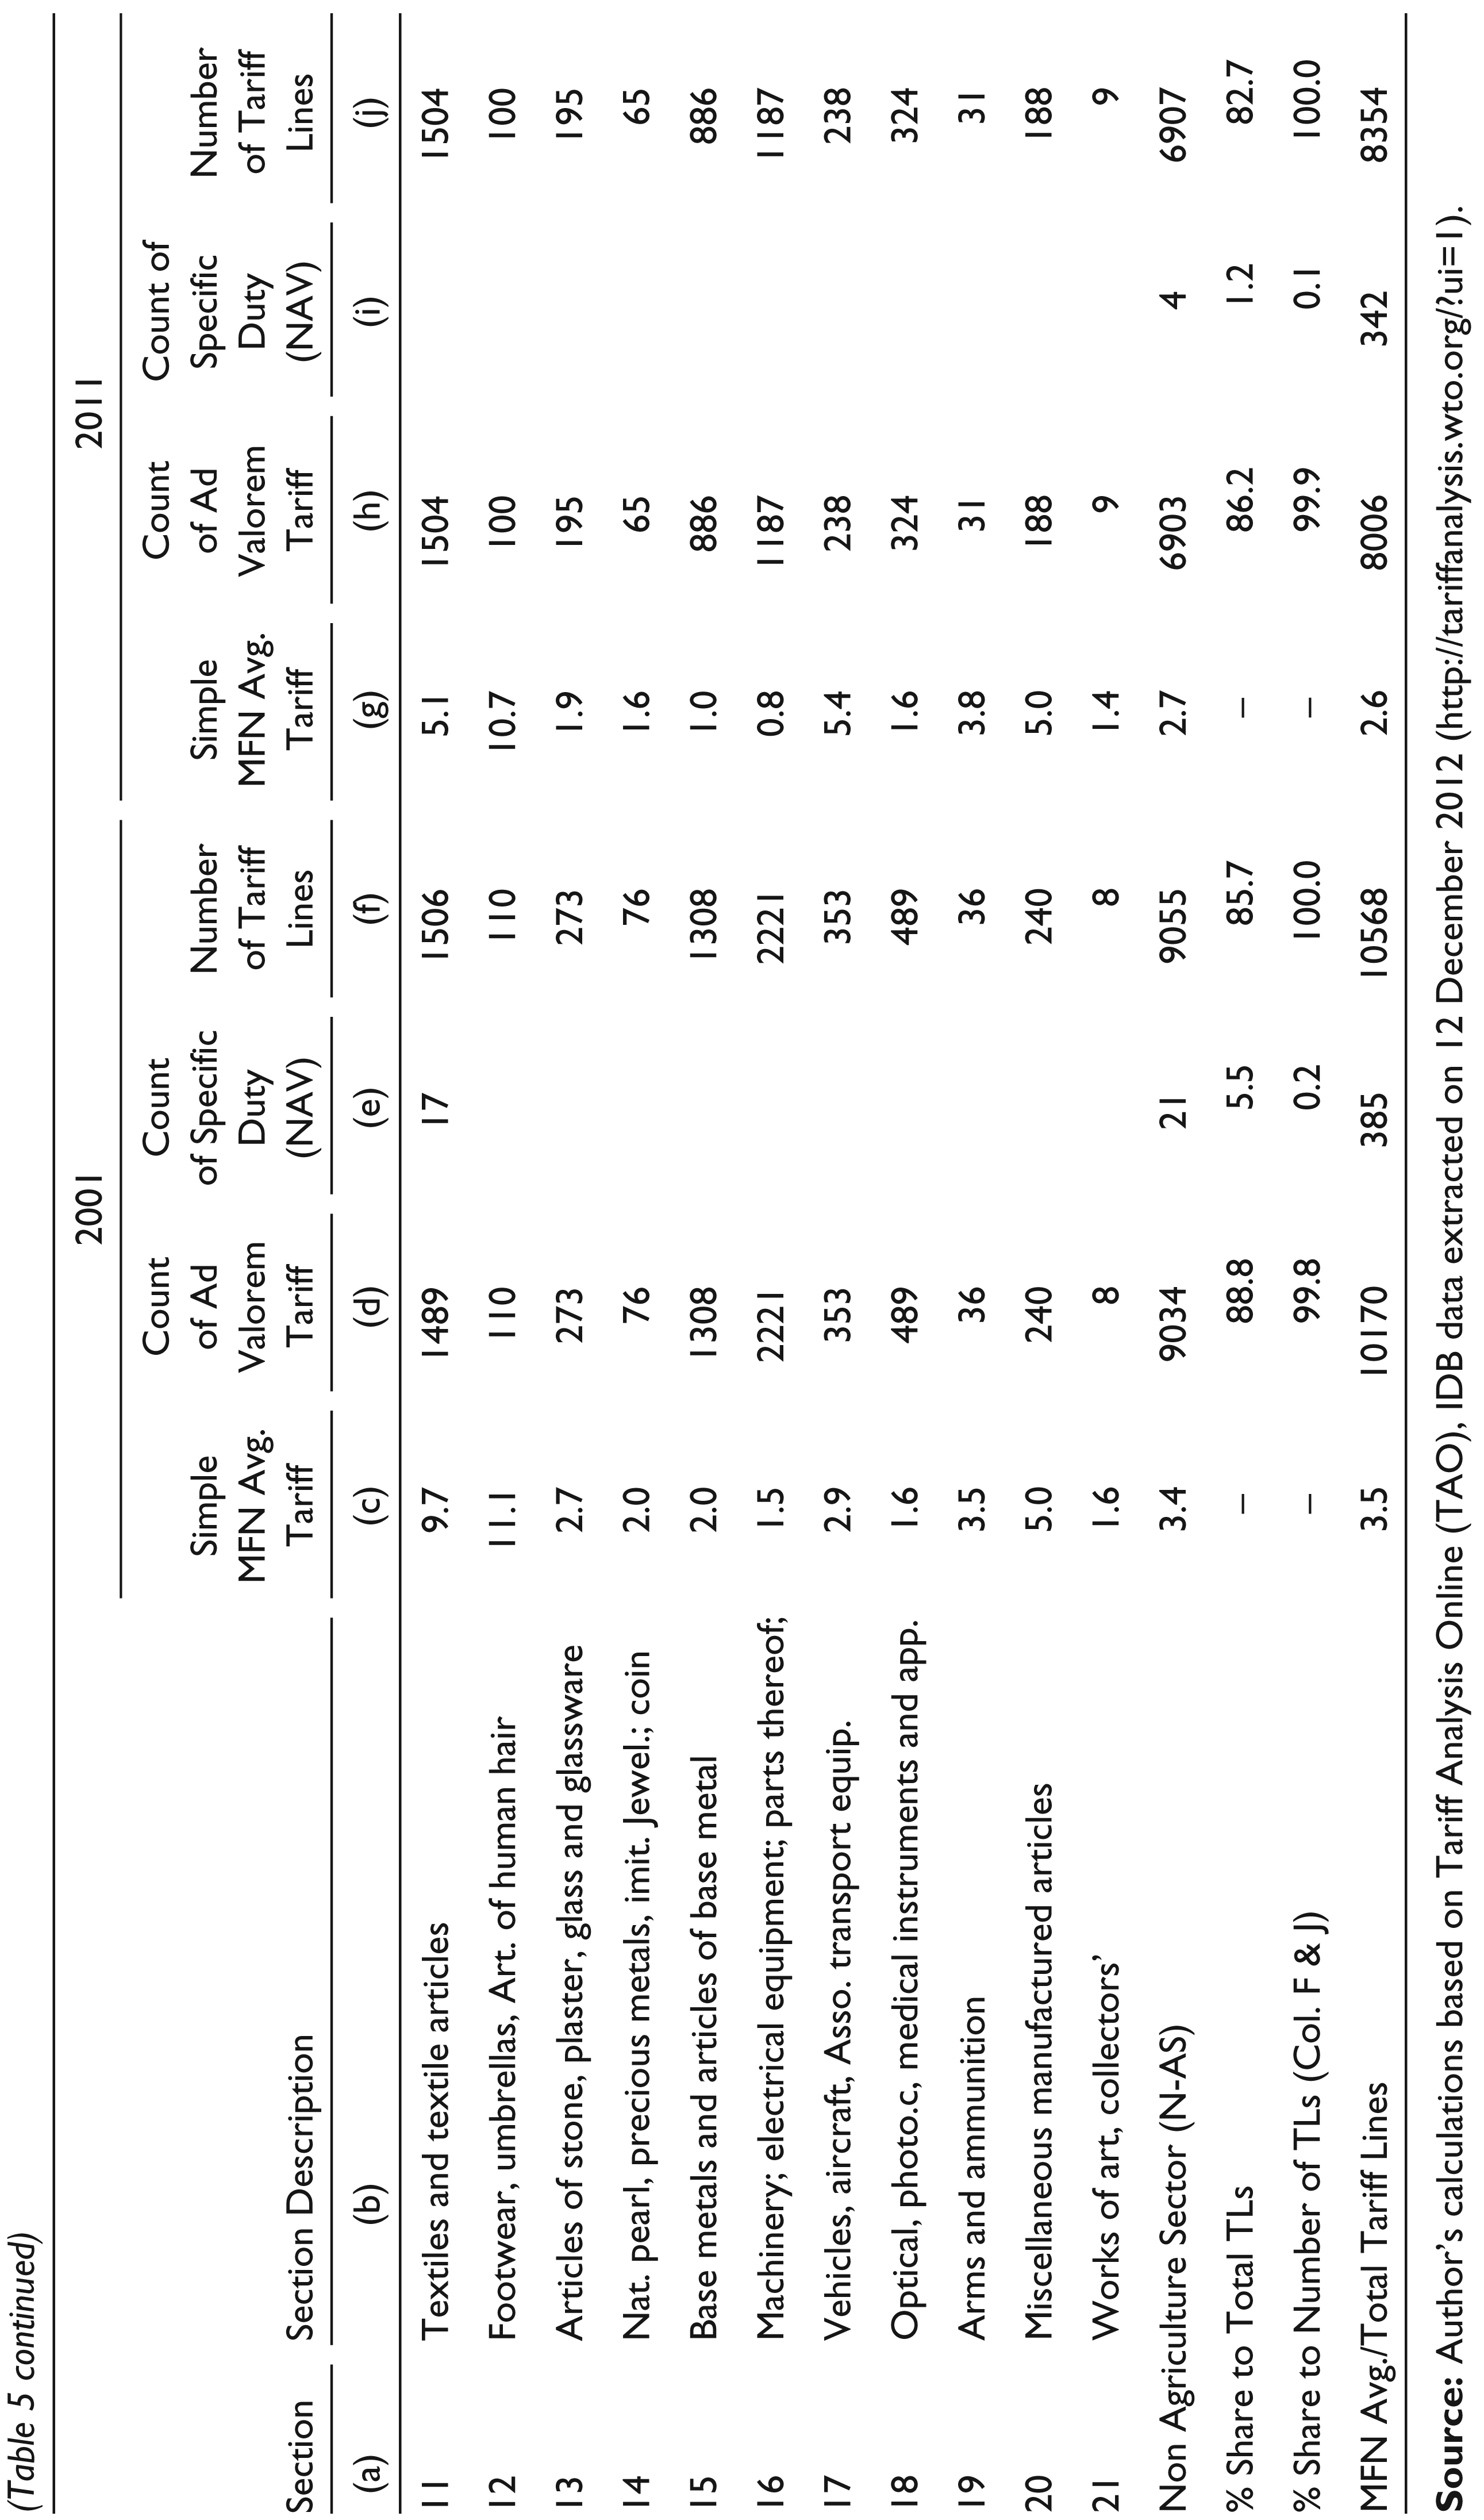
However, the total number of tariff lines for Canada has seen a substantial drop by 10,568 in 2001 to 8,354. 9 Decrease in TLs occurred mostly in AV lines, where reductions of 2,214 lines were seen during the decade. This immediately indicates Canada’s strategy of retaining the TLs with NAV duties intact. There has been a substantially higher proportion of specific duty usage in the A&AS (Section 1 to 4). Shares of A&AS products to the total NAV lines across all the sections increased from 94.5 per cent in 2001 to 98.8 per cent in 2011. Canada had virtually 99 per cent of specific (NAV) duties in the A&AS; with only 1 per cent share in the non-agricultural sectors. Animal or vegetable fats and oils and their cleavage products had the lowest number of NAV duties.
In Table 5 we can observe that in both years, the largest number of specific duties were in the prepared foodstuffs, beverages, spirits and vinegar and tobacco and manufactured tobacco substitutes (Section 4), followed by live animals and animal products (Section 1) and vegetable products (Section 2).
However, in 2011, the top 15 four digit products with highest usage of specific duty accounted for nearly 61 per cent share of total specific duties (342). In Table 6, further analysis of the negative impacts, in terms of products identified at four digit level, shows the top 10 products as having the highest count of TLs with specific duties (NAV). Like the EU, Canada has also had very stringent market access for products like: (0406) cheese and curd; (0207) meat and edible; (2206) fermented beverages; (0402) milk and cream; (0709) other vegetables fresh or chilled and foods prepared (1904). Canada was also violating the true spirit of free and fair trade by having the TLs in NAV, which were largely concentrated in the A&AS with impunity and maintaining these as late as 2011.
Top 15 Product with Usage of Non-Ad-valorem (NAV) Tariffs by Canada (2011)
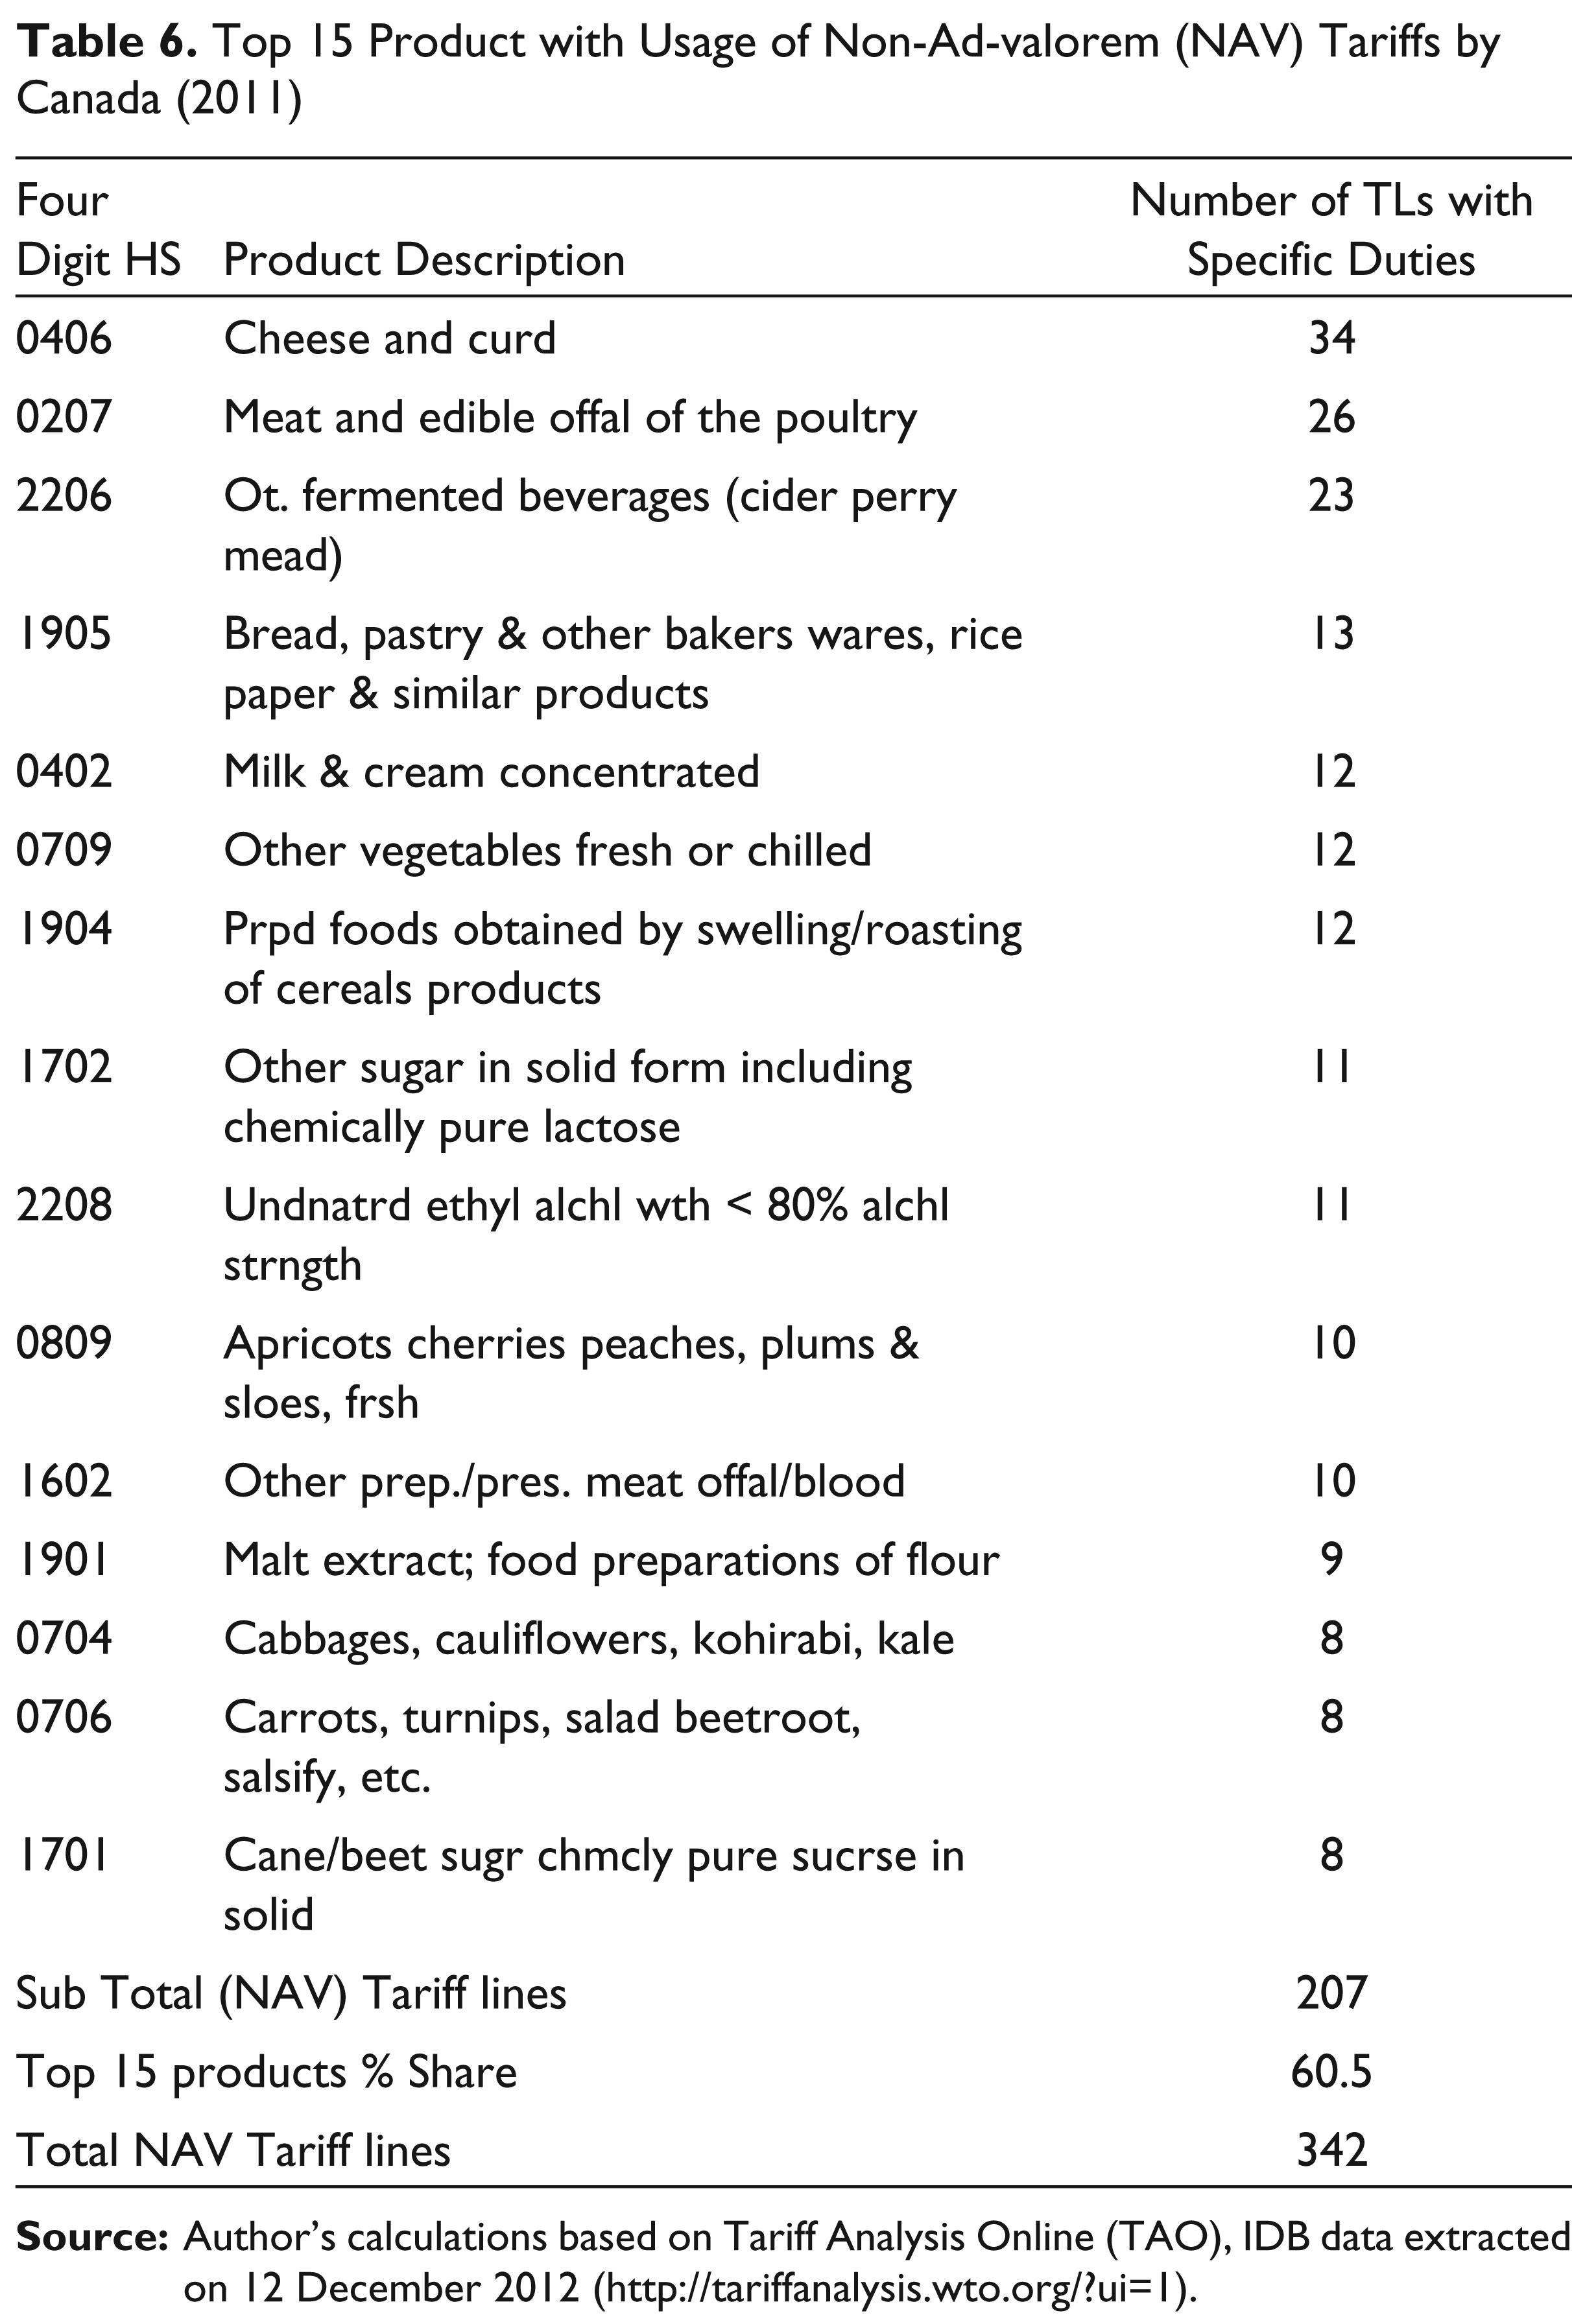
Canada was certainly better placed in terms of market access for the developing countries than the EU. In the case of Canada, by 2011, there was increased usage of NAV, by 4.3 percentage points in the A&AS products, from 94.5 to 98.8 per cent.
The United States
The United States experienced an increasing trend in the NAV tariff line counts. Table 7 shows that here was an increase in terms of its relative shares, from 61.6 to 63.5 per cent in 2001–11. In terms of absolute numbers, there was an increase from 702 in 2001 to 730 in 2011. The A&AS had experienced a pattern similar to that of tariff escalation, with value-added sections/products being relatively more protected in comparison to less value-added sections/products. This is evident from the increase by 22 counts of specific duty in Section 4, from 264 to 286 in 2001–11.
US NAV Tariff Counts and MFN Avg. Tariff Rates
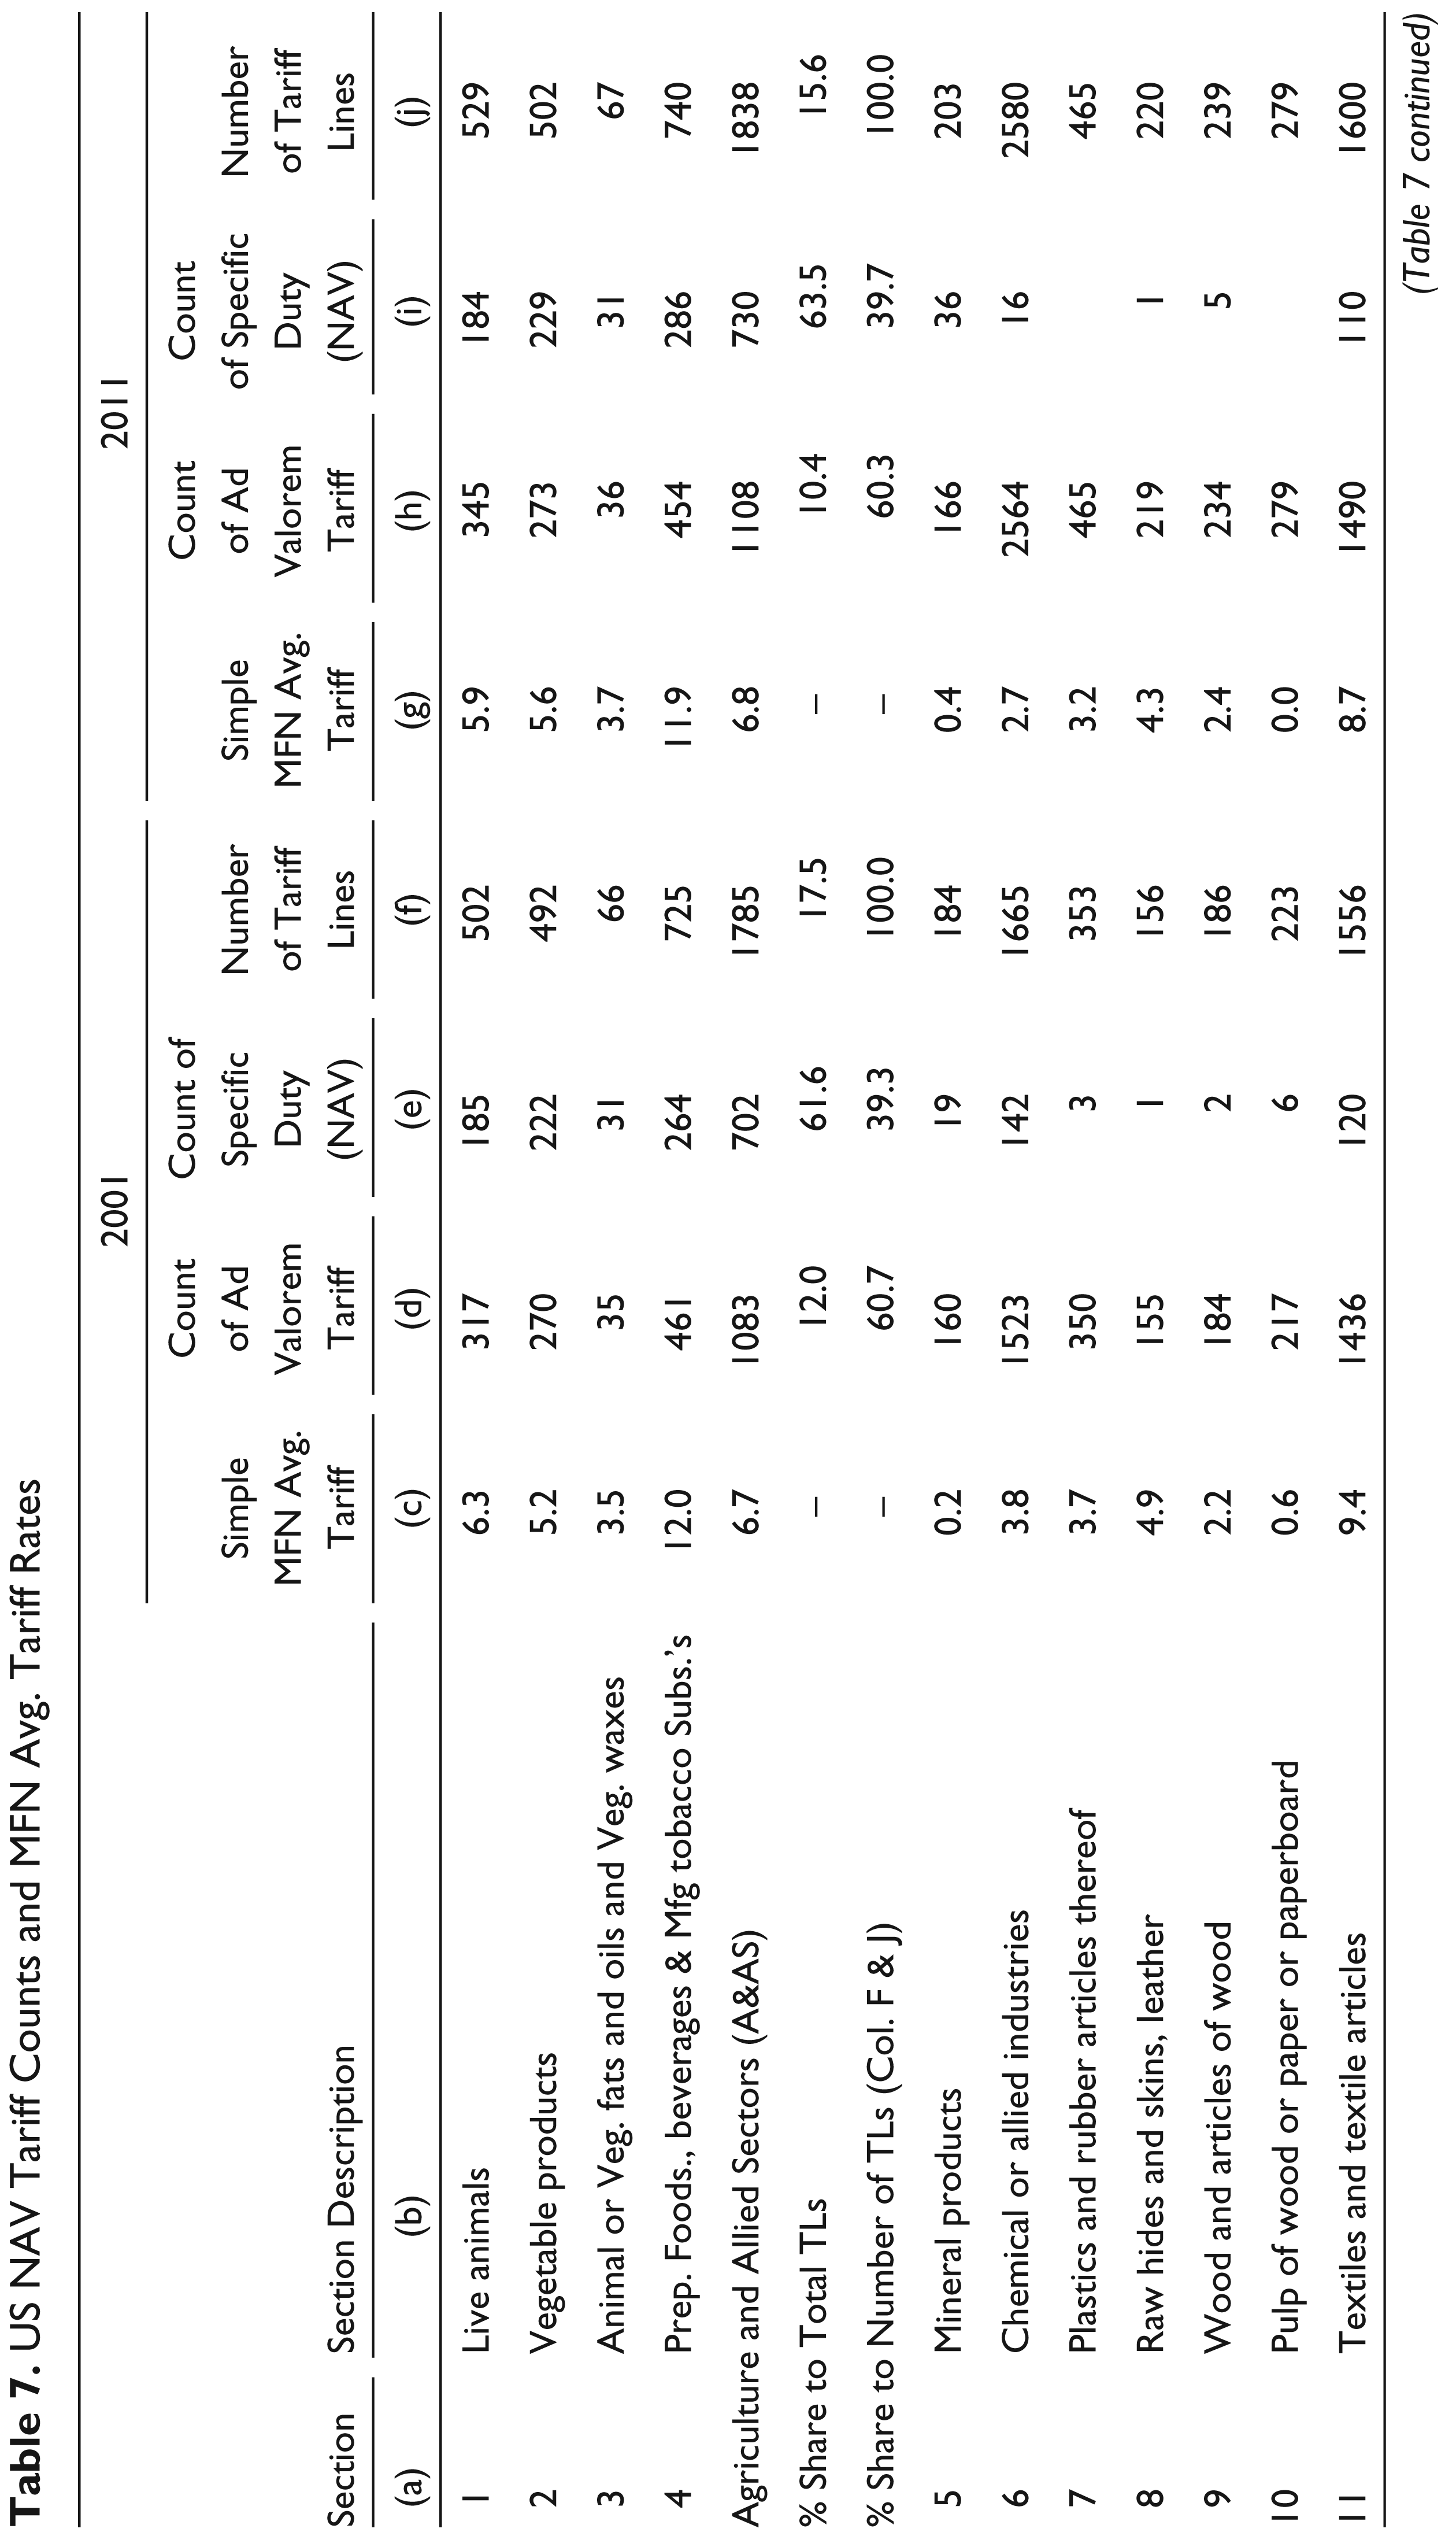
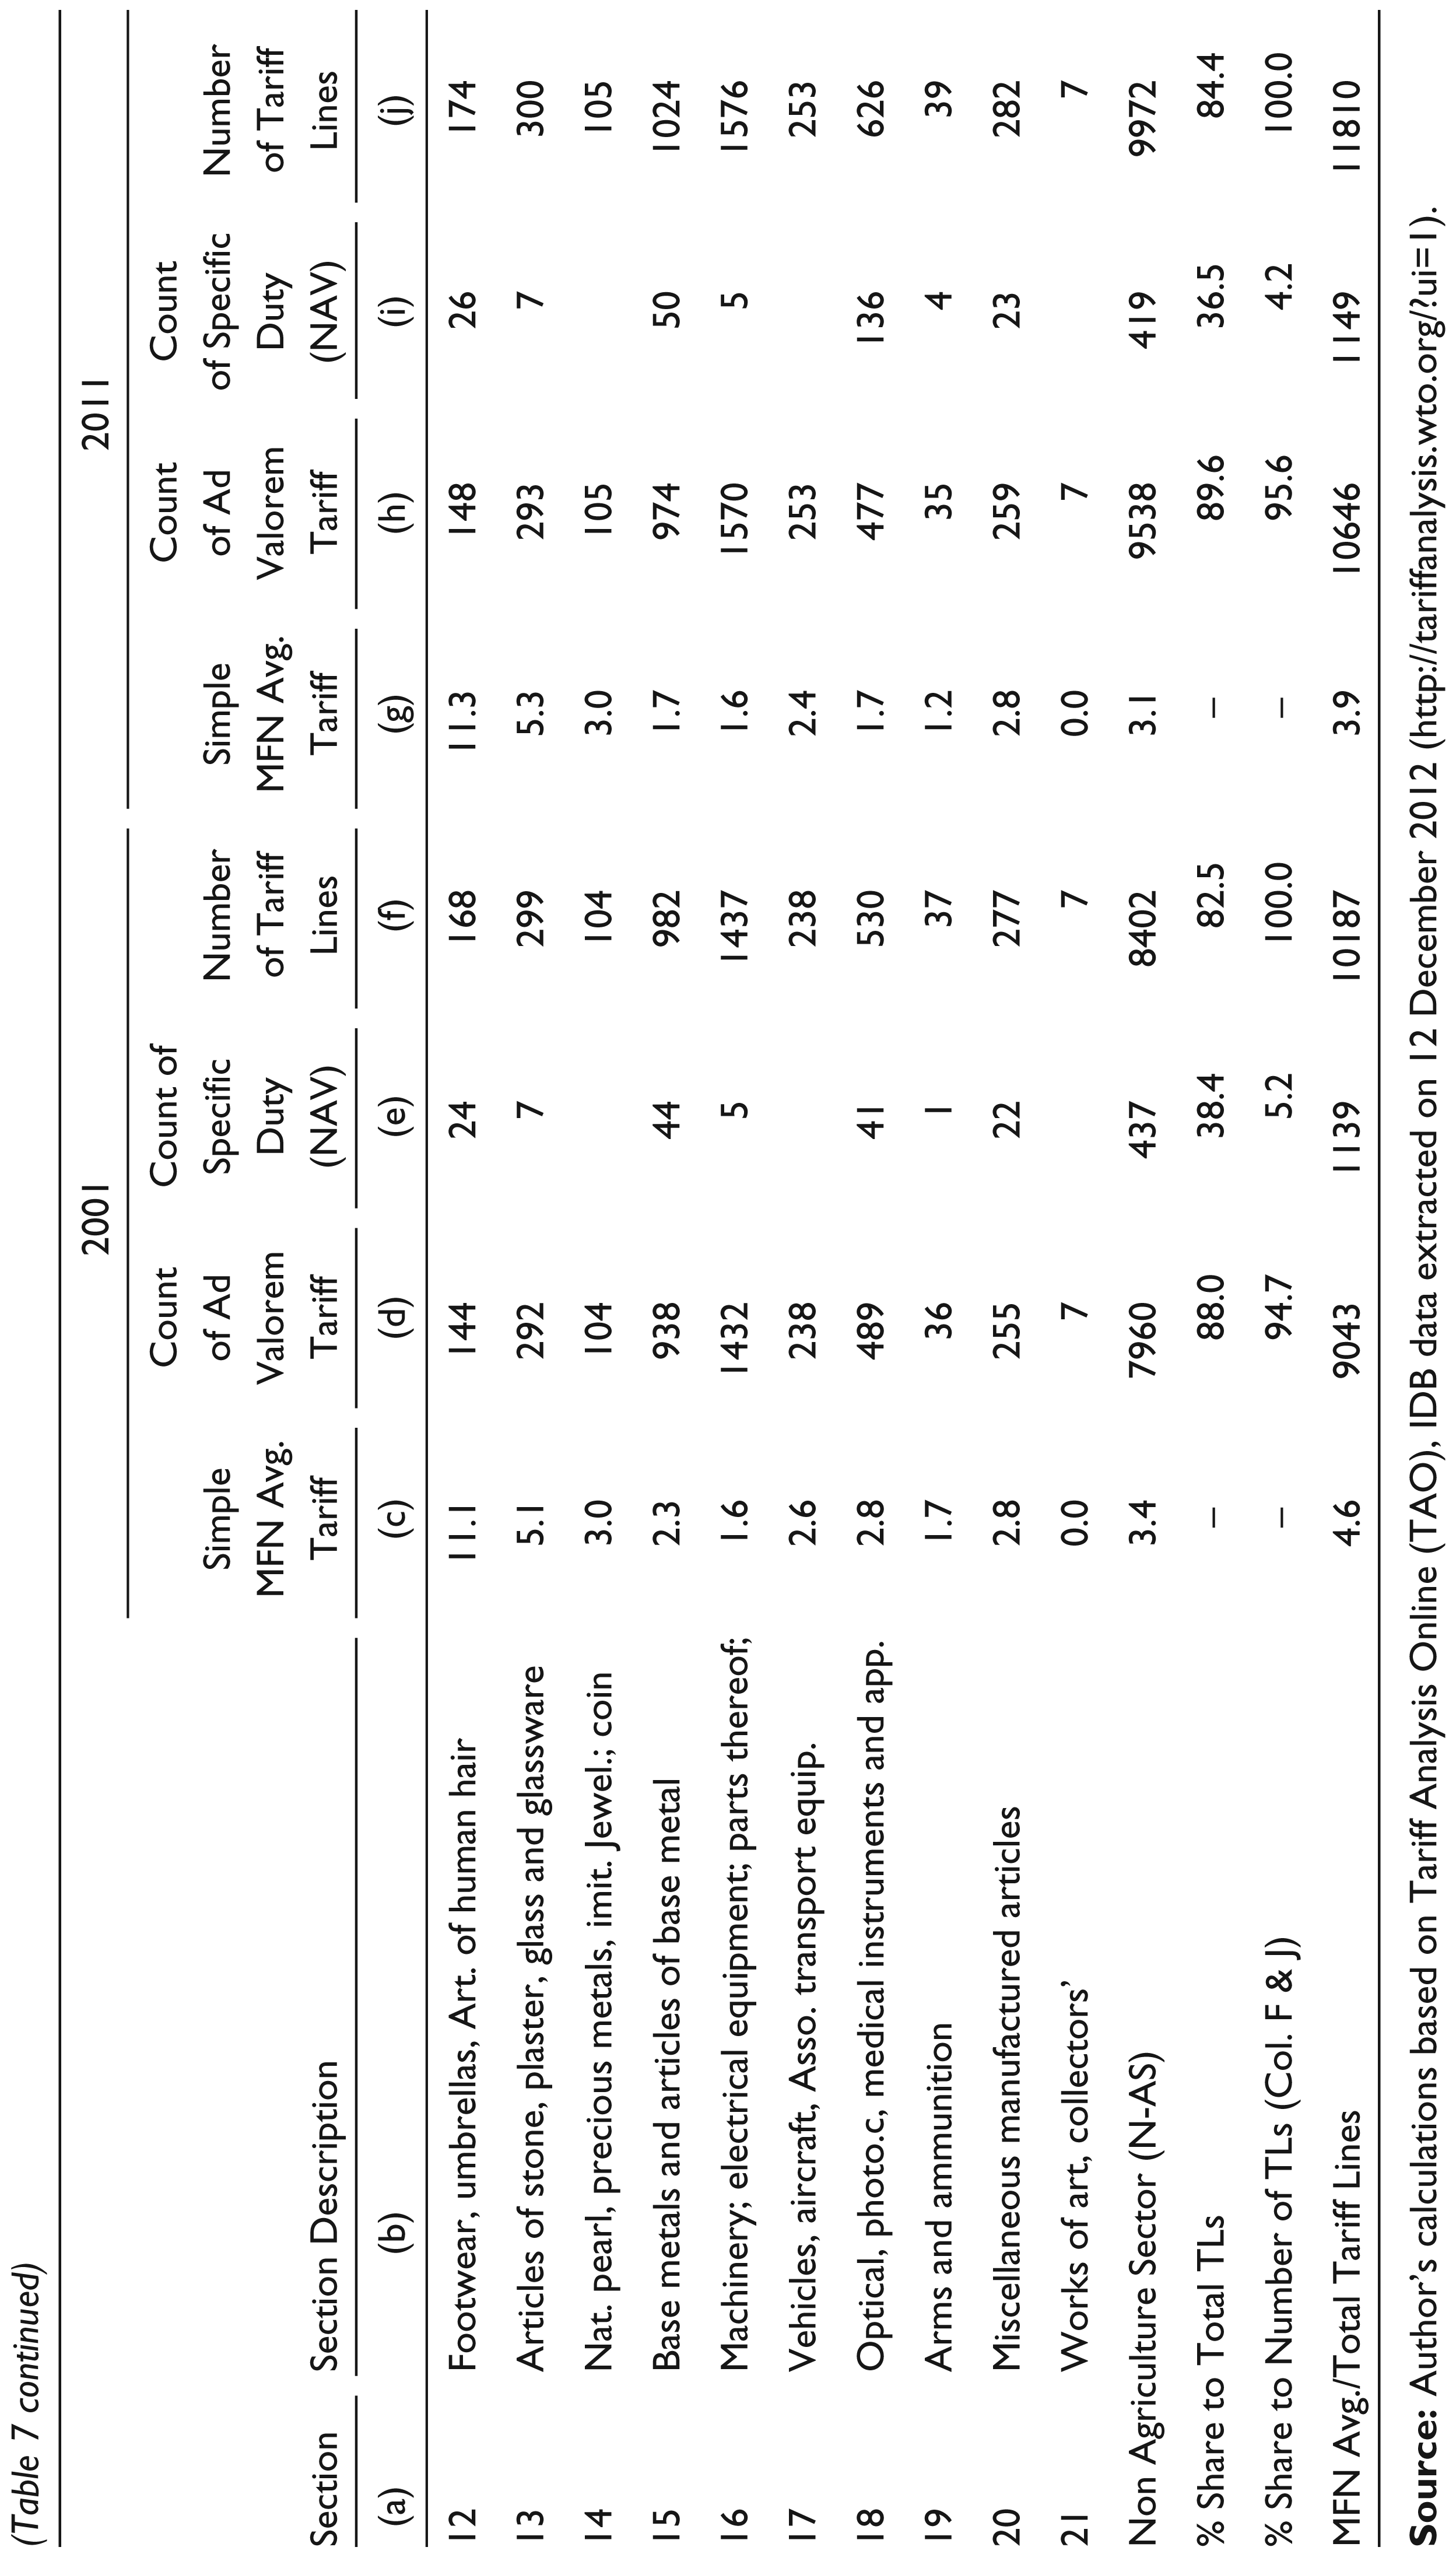
This suggests that the United States also maintained constrained market access for imported goods in the products under the A&AS. Table 7 shows that the United States has approximately a ratio of 5:95 of NAV usage in the non-agricultural sector, while the ration for the A&AS is as high as 40:60. However, in terms of the usage of these NAV in the N-AS, a clear shift in strategies can be noted. While in 2001 the protected sections with use of NAV were products of chemical or allied industries (Section 6) and textiles and textiles articles (Section 11), by 2011 the textiles and textile articles continued to be the dominant section which was protected by the use of NAV. In addition, Section 18 (optical, photographic, cinematographic, measuring, checking, precision, medical or surgical instruments and apparatuses, clocks and watches, musical instruments, and parts and accessories) showed an increase in the count of NAV from 41 to 136 in 2001–11. It is clear that for the United States, besides textiles and textiles articles, the priority in the last decade has shifted from chemicals (Section 6) to optical instruments (Section 18).
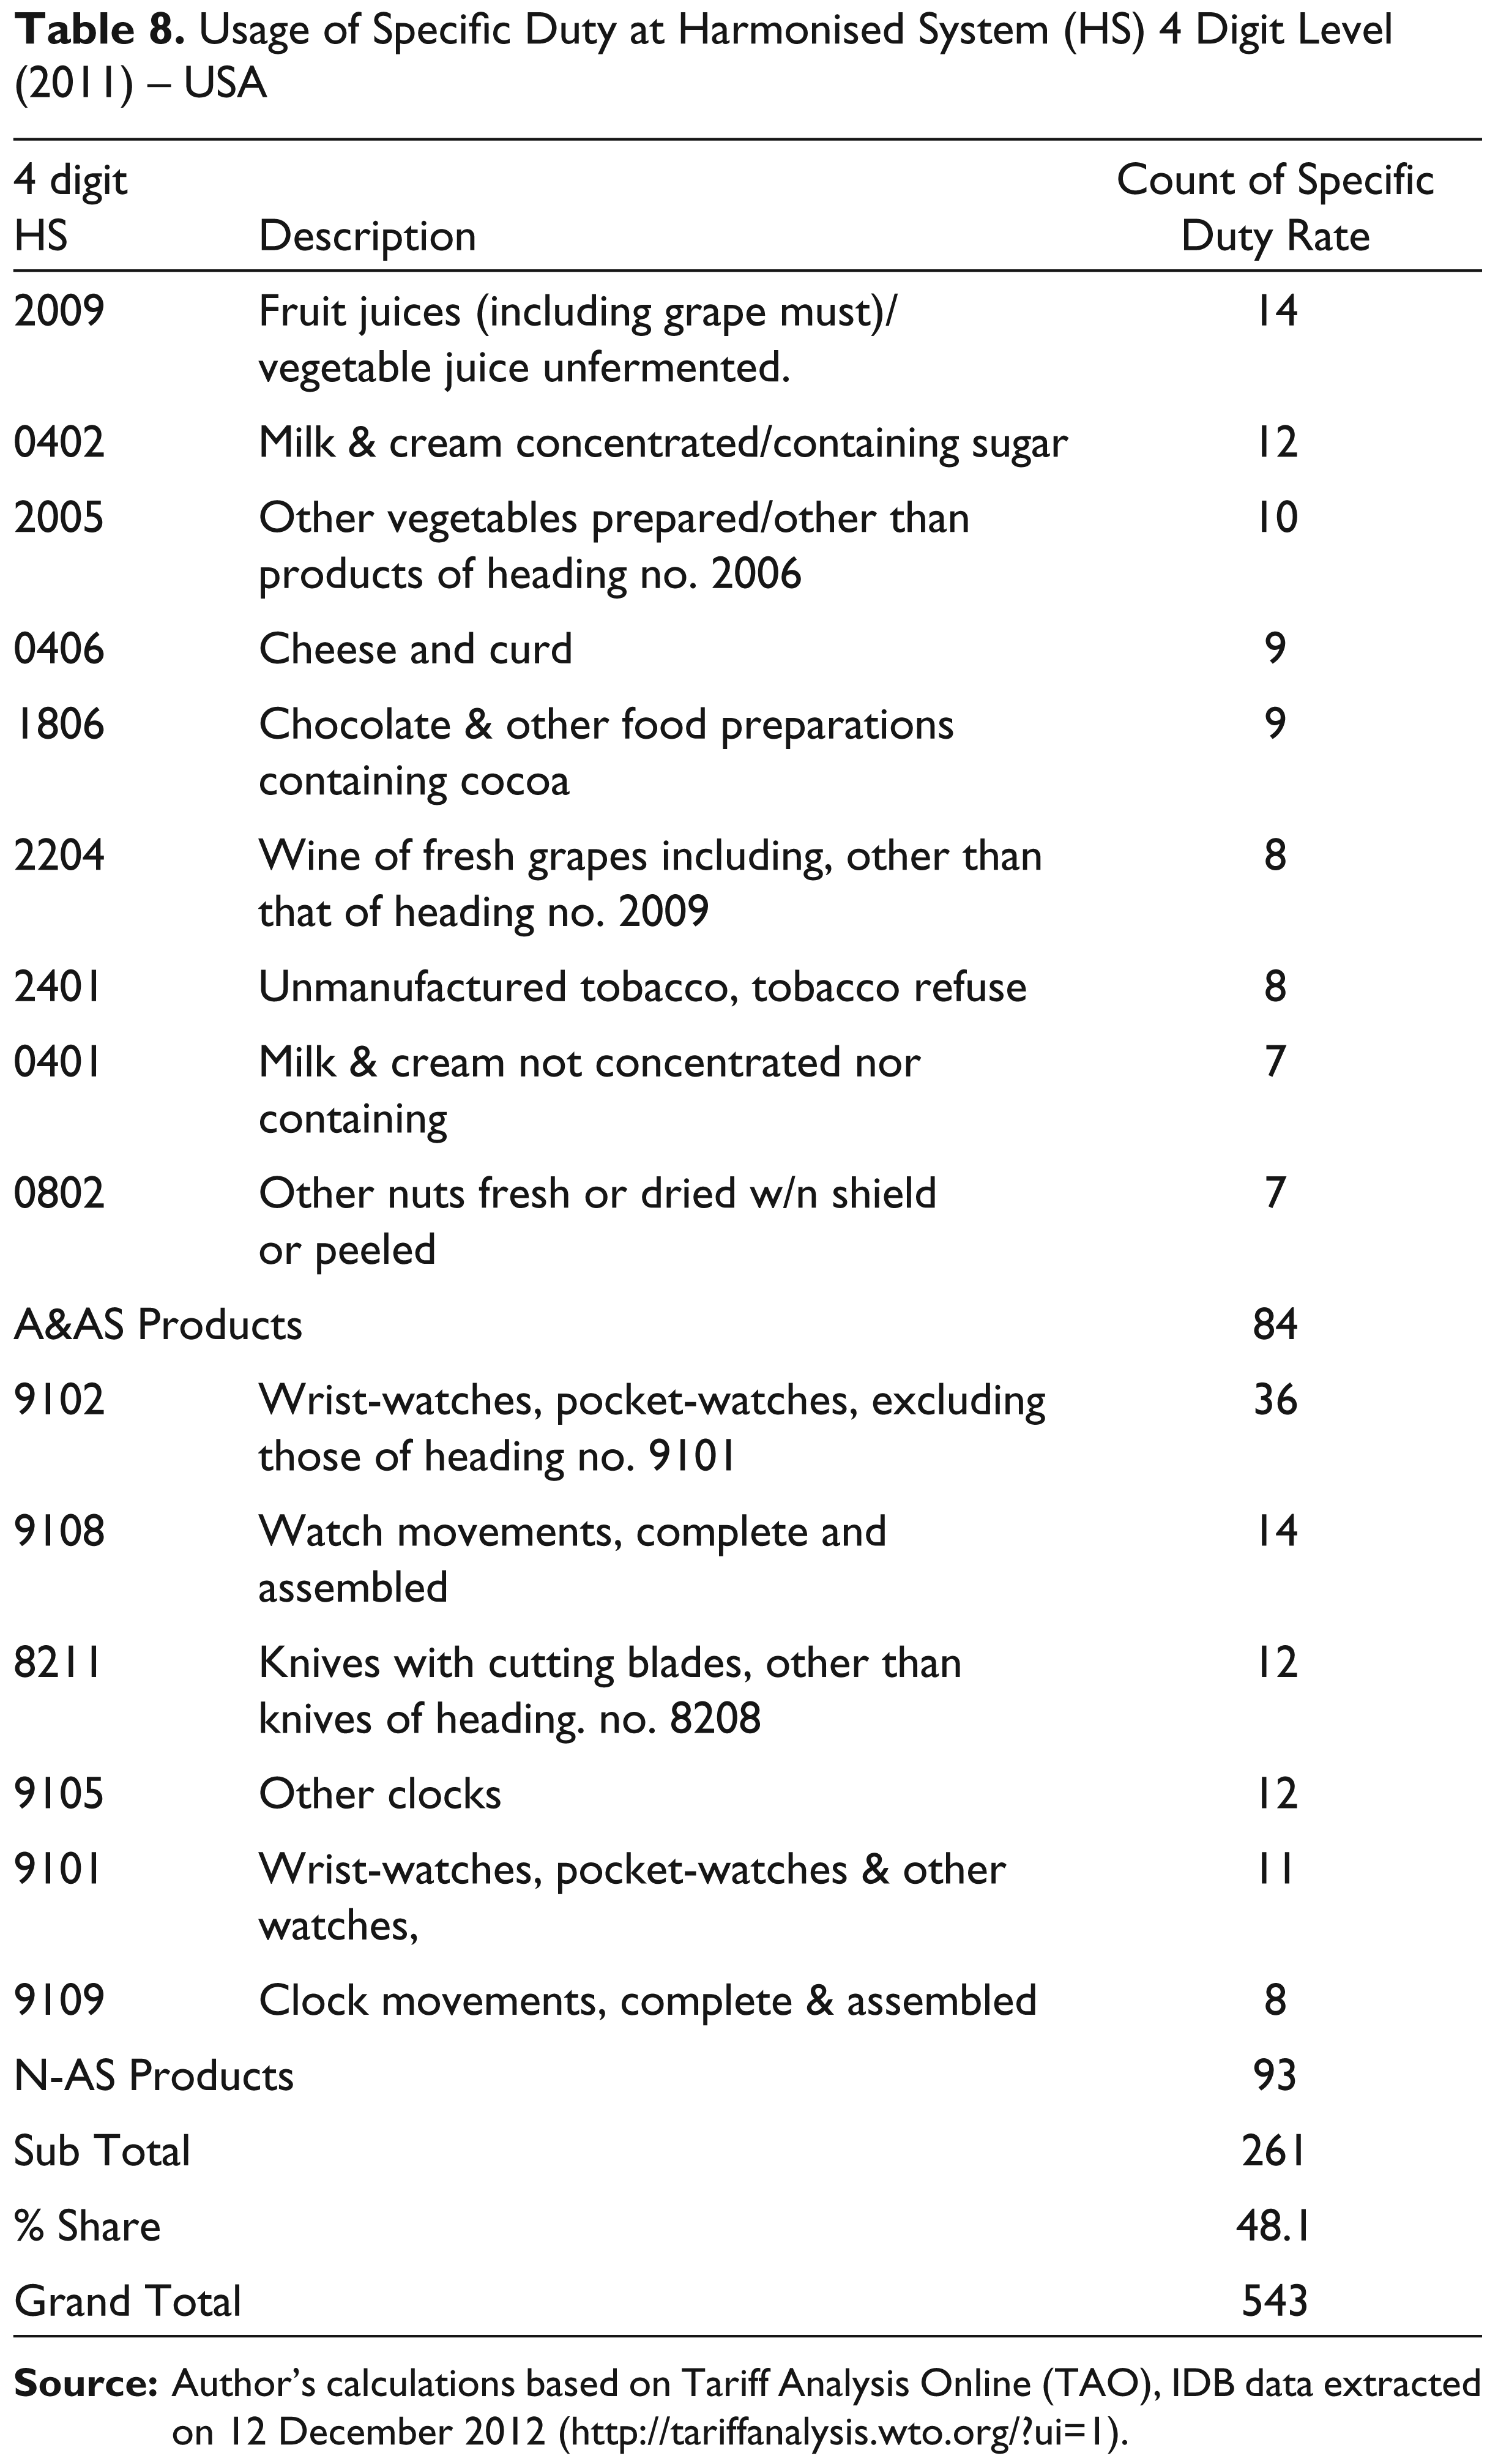
It is evident from an analysis of the top 15 products with specific duties that the highest concentration occurs in Section 18. Specific duties under this section with four digit products (such as 9102, 9108, 9105, 9101, 9109) account for nearly 50 per cent of the top 15 products, out of the total 177 counts, see Table 8. Unlike the EU and Canada, where the A&AS products dominated this list, in the United States both A&AS and N-AS products were equal in number of NAV tariffs.
The United States is a classic case of lack of domestic competiveness in certain agricultural and industrial goods sectors, which are being protected through a number of trade policy instruments like Domestic support, NTMs (SPS and TBT measures) and NAV tariffs. Over 2001–11, the US notified a number of SPS and TBT measures, making it the single largest with more than 2000 notifications among the WTO membership of 159 countries. The majority of these measures have been notified by the Federal Environmental Protection Agency (EPA) which relates to regulating the contents of chemicals and pesticides and food and feed products. The Unites States further used NAV tariffs as an effective trade policy instrument to evade the true implication of the binding commitments of the WTO.
Usage of Specific Duty at Harmonised System (HS) 4 Digit Level (2011) – USA
Japan
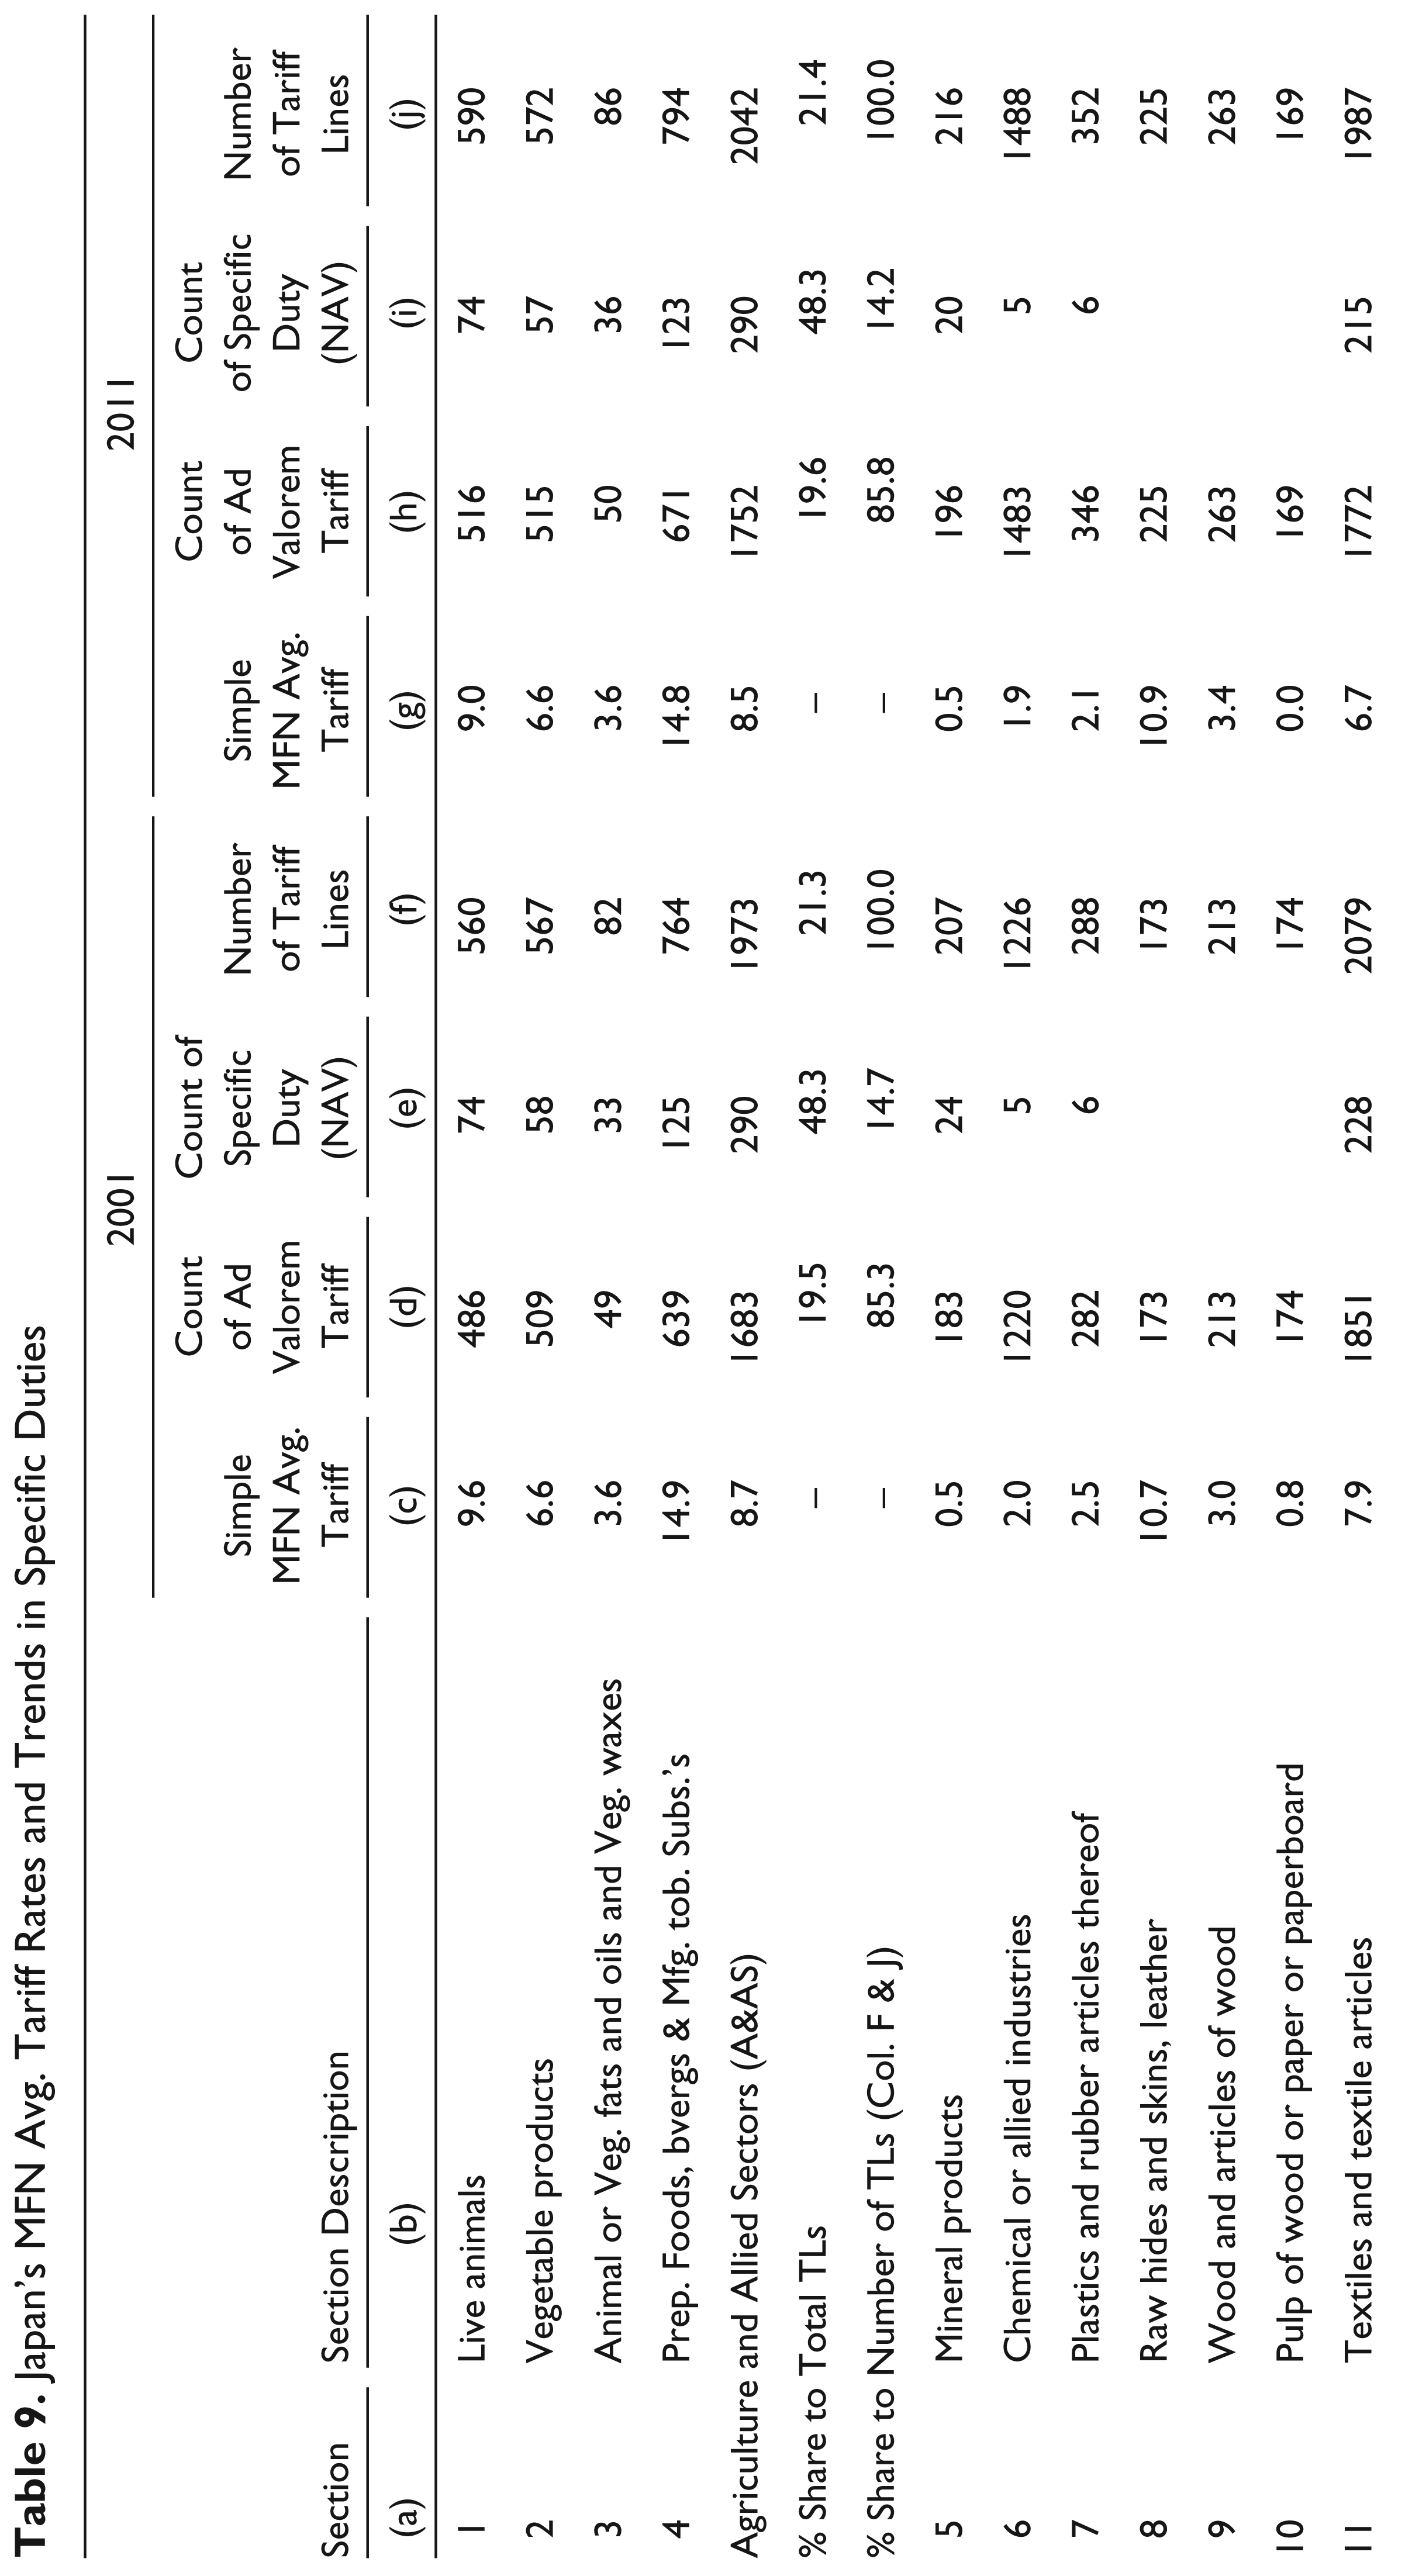
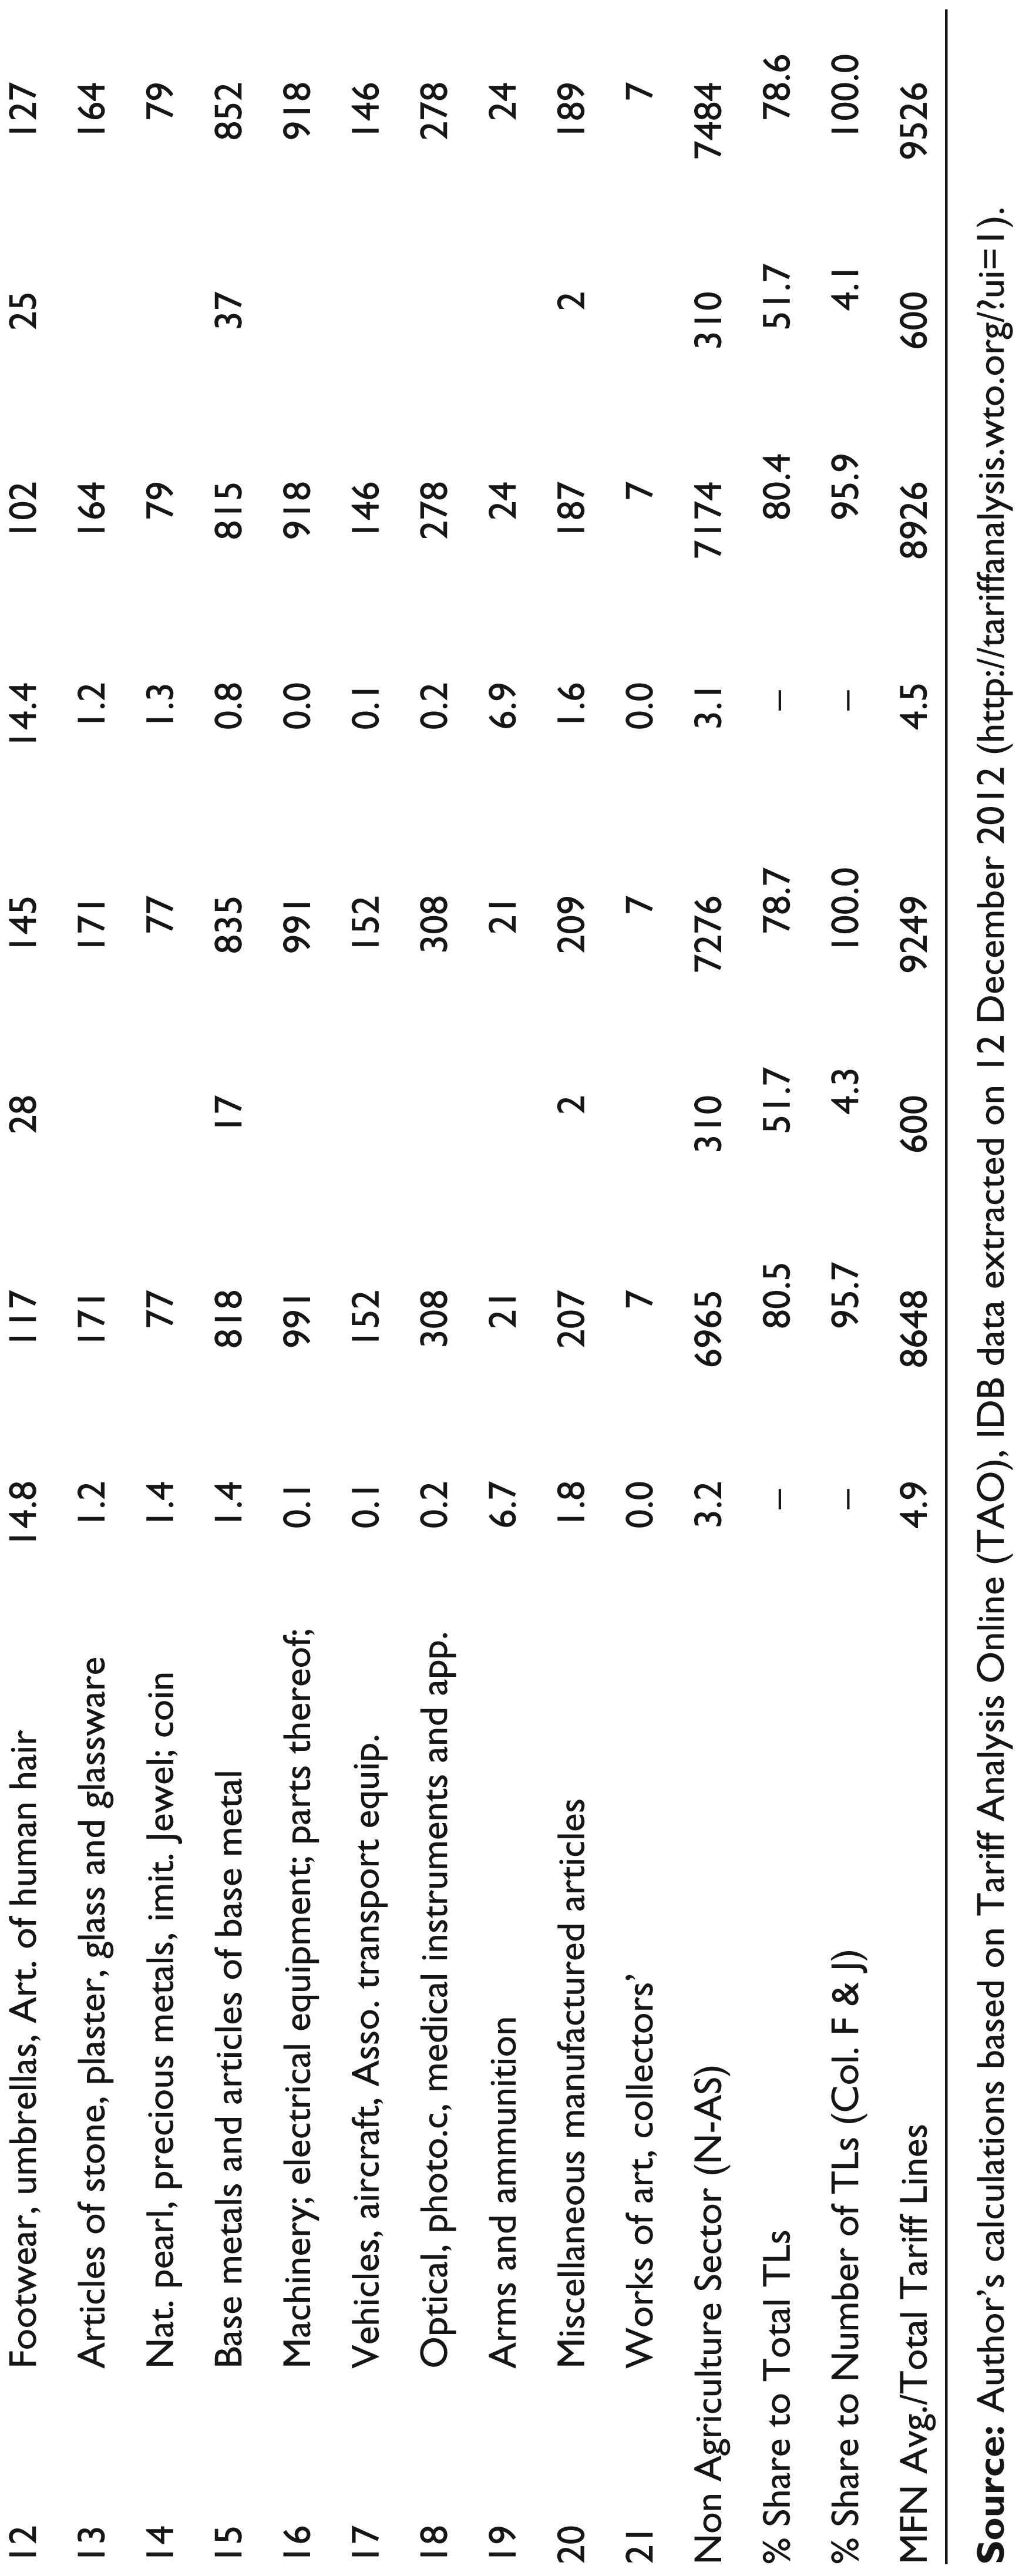
Japan’s usage of NAV tariffs have been more scattered across the A&AS (Sections 1–4) and the N-AS products (Sections 5–21), with the latter having an edge over the A&AS products. In Table 9, of the total 1973 tariff lines in 2001 and 2042 in 2011, approximately 290 were specific duties in both years. The shares of the counts of specific duties were the same during 2001 and 2011—48.3 per cent for the A&AS products and 51.7 for the N-AS products. The proportion of NAV to AV usage was 15:85 for the A&AS products, while in the case of N-AS it was 4:96 for both the years analyzed.
There is a pattern of tariff escalation observed in the case of Japan, with Section 4 (prepared foodstuffs, beverages, spirits and vinegar, tobacco and mfg. tobacco substitutes) having higher absolute counts of NAV duties of 125 and 123 TLs in 2001 and 2011, respectively. It could be argued that having a larger number of TLs under the NAV could act as tariff escalation phenomenon and lead to higher applied tariffs in some of the lines, effectively keeping it outside the methodology of calculation of simple average MFN duty.
This suggests that, for Japan, it was the N-AG sector that was strategically important. This was observed in Section 11 (textile and textile articles), which had a dominant share of TLs of 73.5 per cent in 2001, gradually being reduced to 69.4 per cent. However, in the total NAV TLs, the shares of the N-AG sector have remained at 51.7 per cent for both years, with Section 15 (base metal and articles of base metal) having recorded an increase in the count of NAV duties by 20 TLs in 2001–11.
Therefore, it could be argued that Japan’s negotiating position was in denial of free trade principles when it came to its own market. This was evident from the prevalence of NAV duties even in sectors of comparative advantage and export interest for developing countries, particularly textile and textile articles (Section 11). It is observed that both the United States and Japan had effectively denied market access in Section 11, as they continued to retain relatively very high counts of NAVTLs, even in 2011.
Japan’s MFN Avg. Tariff Rates and Trends in Specific Duties
Top 15 Products Usage of Non Ad-valorem (NAV) Tariff in Japan (2011)
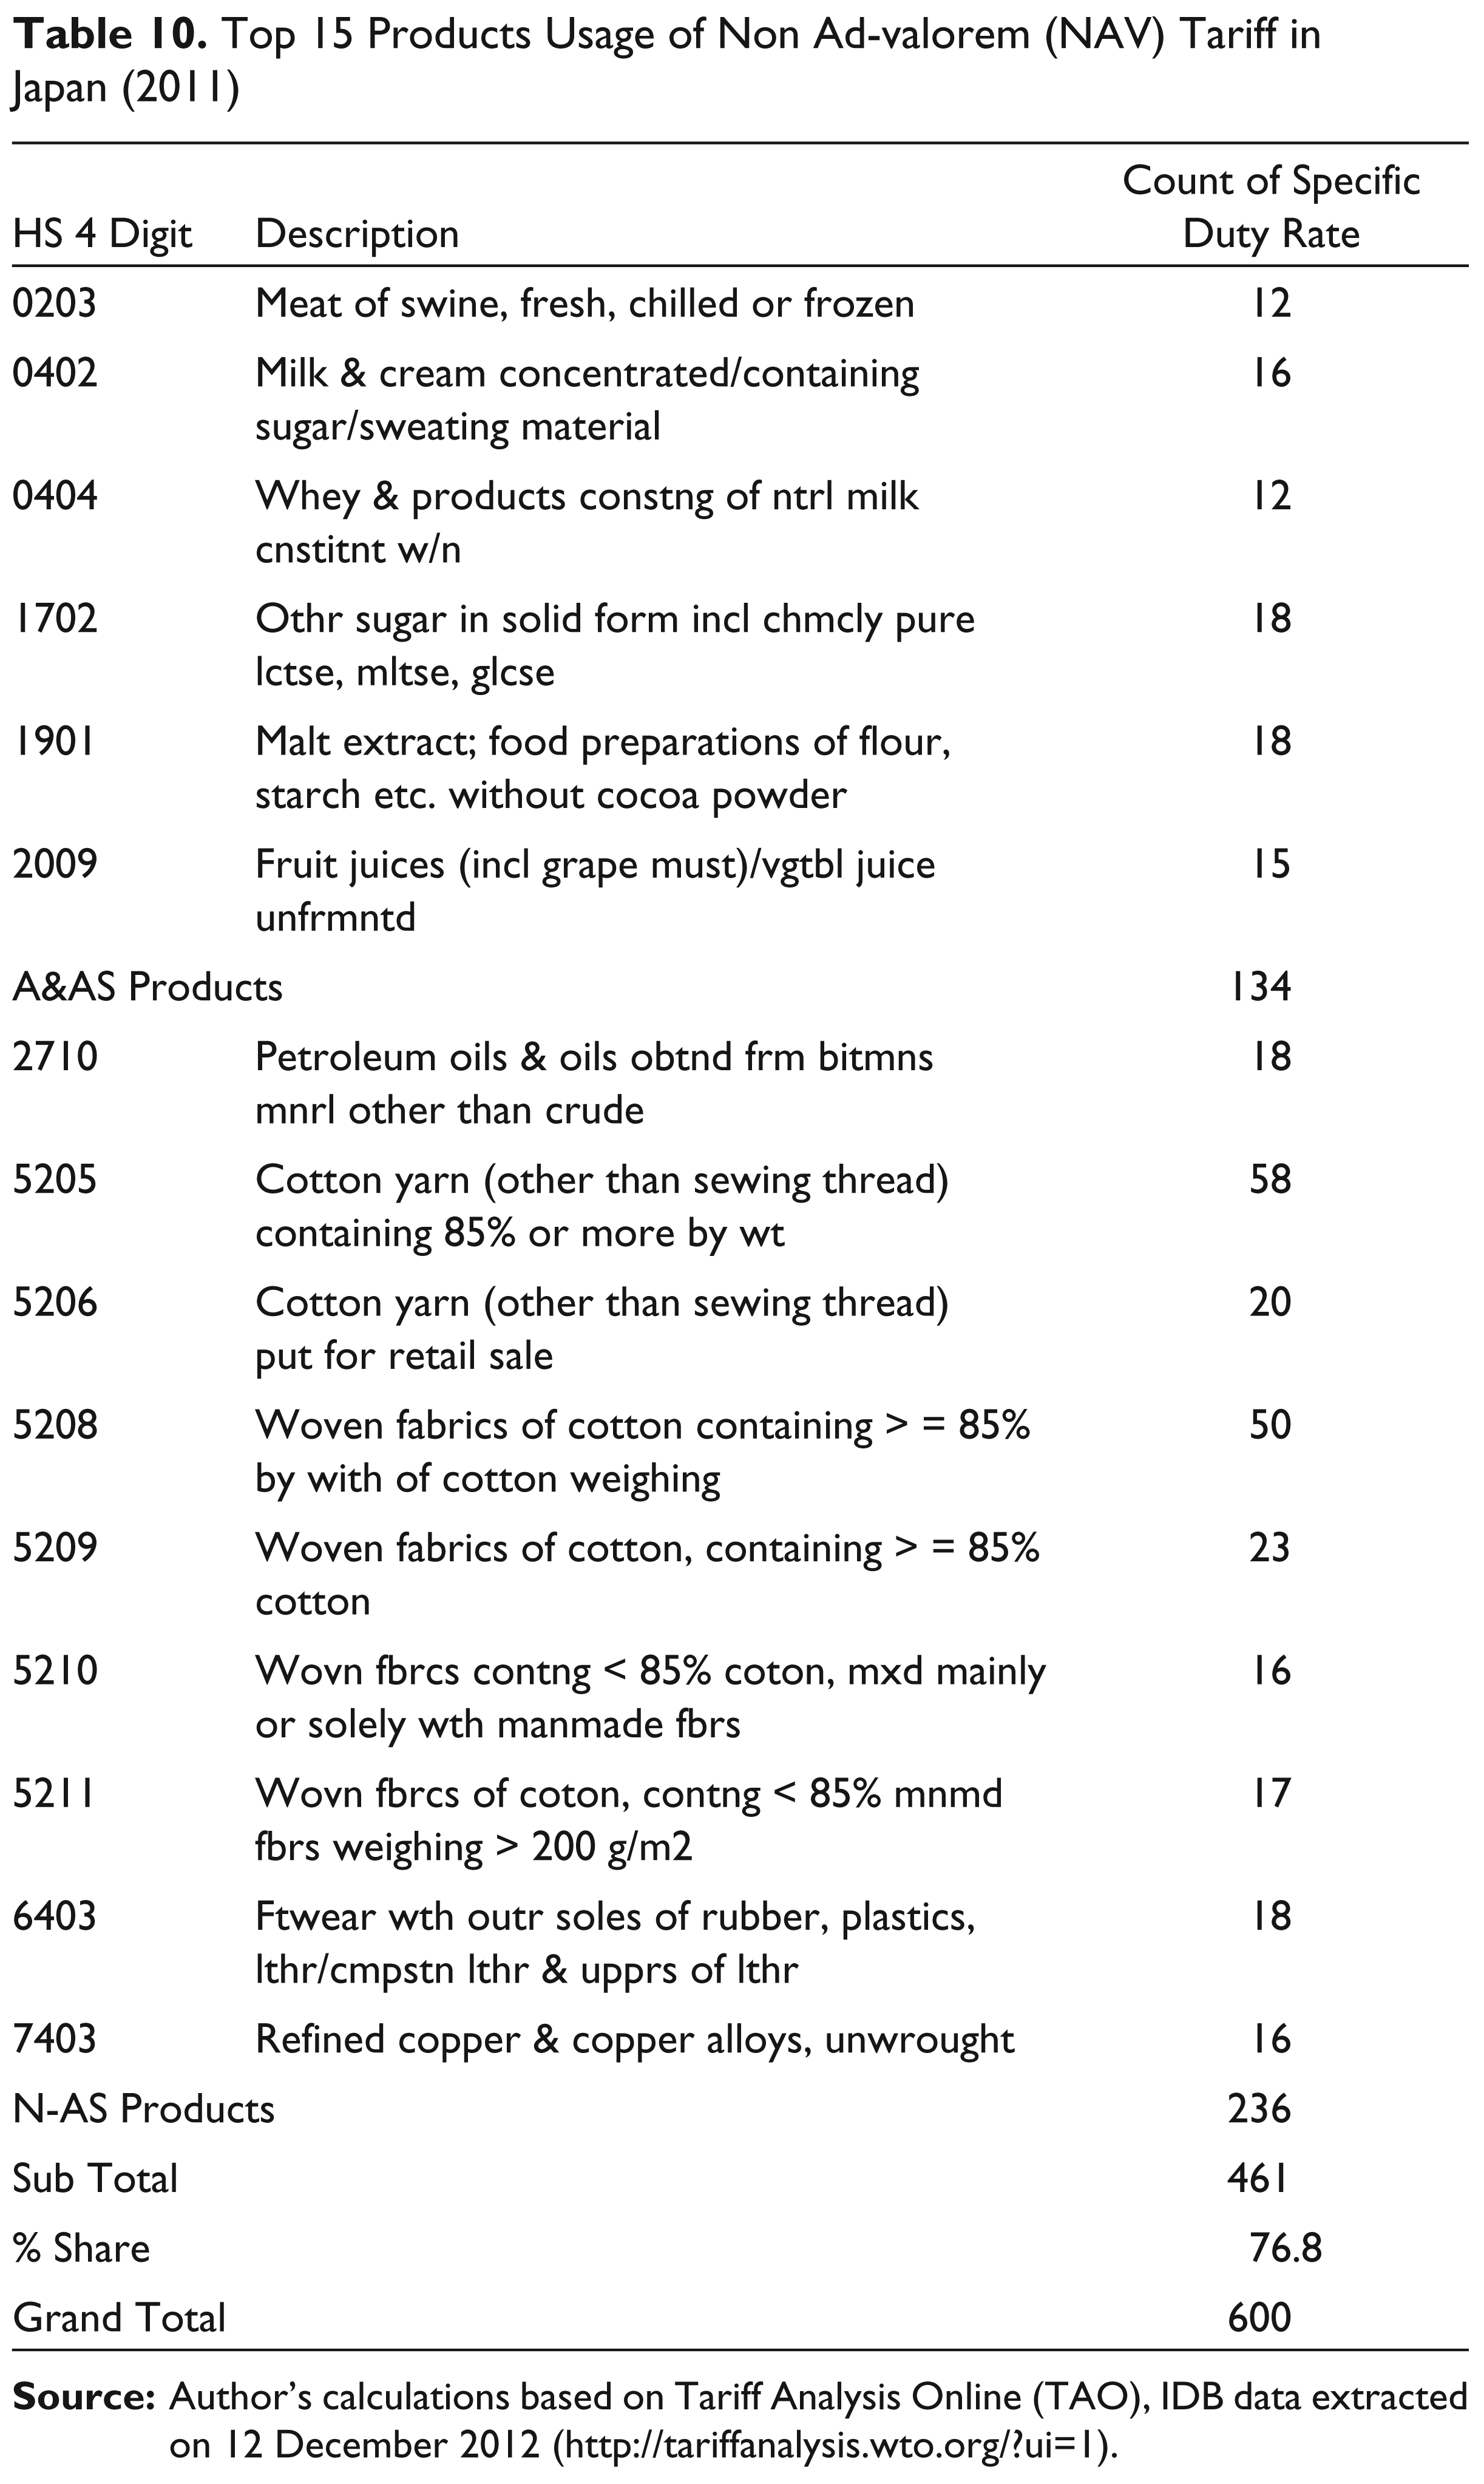
This is also evident from Table 10, which lists the top 15 products with NAV duties at HS 4-digit level. It may be noted, furthermore, that these 15 heading lines accounted for a share of 77 per cent of total lines with NAV TLs. The distribution of A&AS to N-AG was a ratio of 6:9, suggesting lesser protection of A&AS products. Many of the intermediary products (5205, 5208, 5209, 5206, 5211, 5210) belonging to N-AG products (Section 11, textile and textile articles) have been found to be under NAV tariffs. These six products in total accounted for 56.3 per cent of the sub-total of 327 NAV duties. Clearly, therefore, Japan, along with other developed countries, has not been helping the developing countries and the least developed countries to achieve the market access provision of the Doha Round Mandate of 2001. Having an average of 6.5 per cent of the total tariff lines under the NAV duty (and specifically in A&AS, with a nearly 15 per cent share) does not improve market access, especially when it is used as a strategic trade policy instrument.
This does not help in the process of negotiations, as the final outcome will be unbalanced. Furthermore, it is not at all supportive of elementary discipline of binding tariffs under the Doha Round.
Japan being an island nation does not have much at stake in protecting agriculture. This is evident from the usage of NAV TLs. Out of a total 15 heading lines, nine belonged to N-AS products, and out of these N-AG products a majority of seven heading lines belonged to the textiles and footwear sector—a sector in which developing countries are competitive and in which Japan’s trade policy effectively blocked market access.
Switzerland
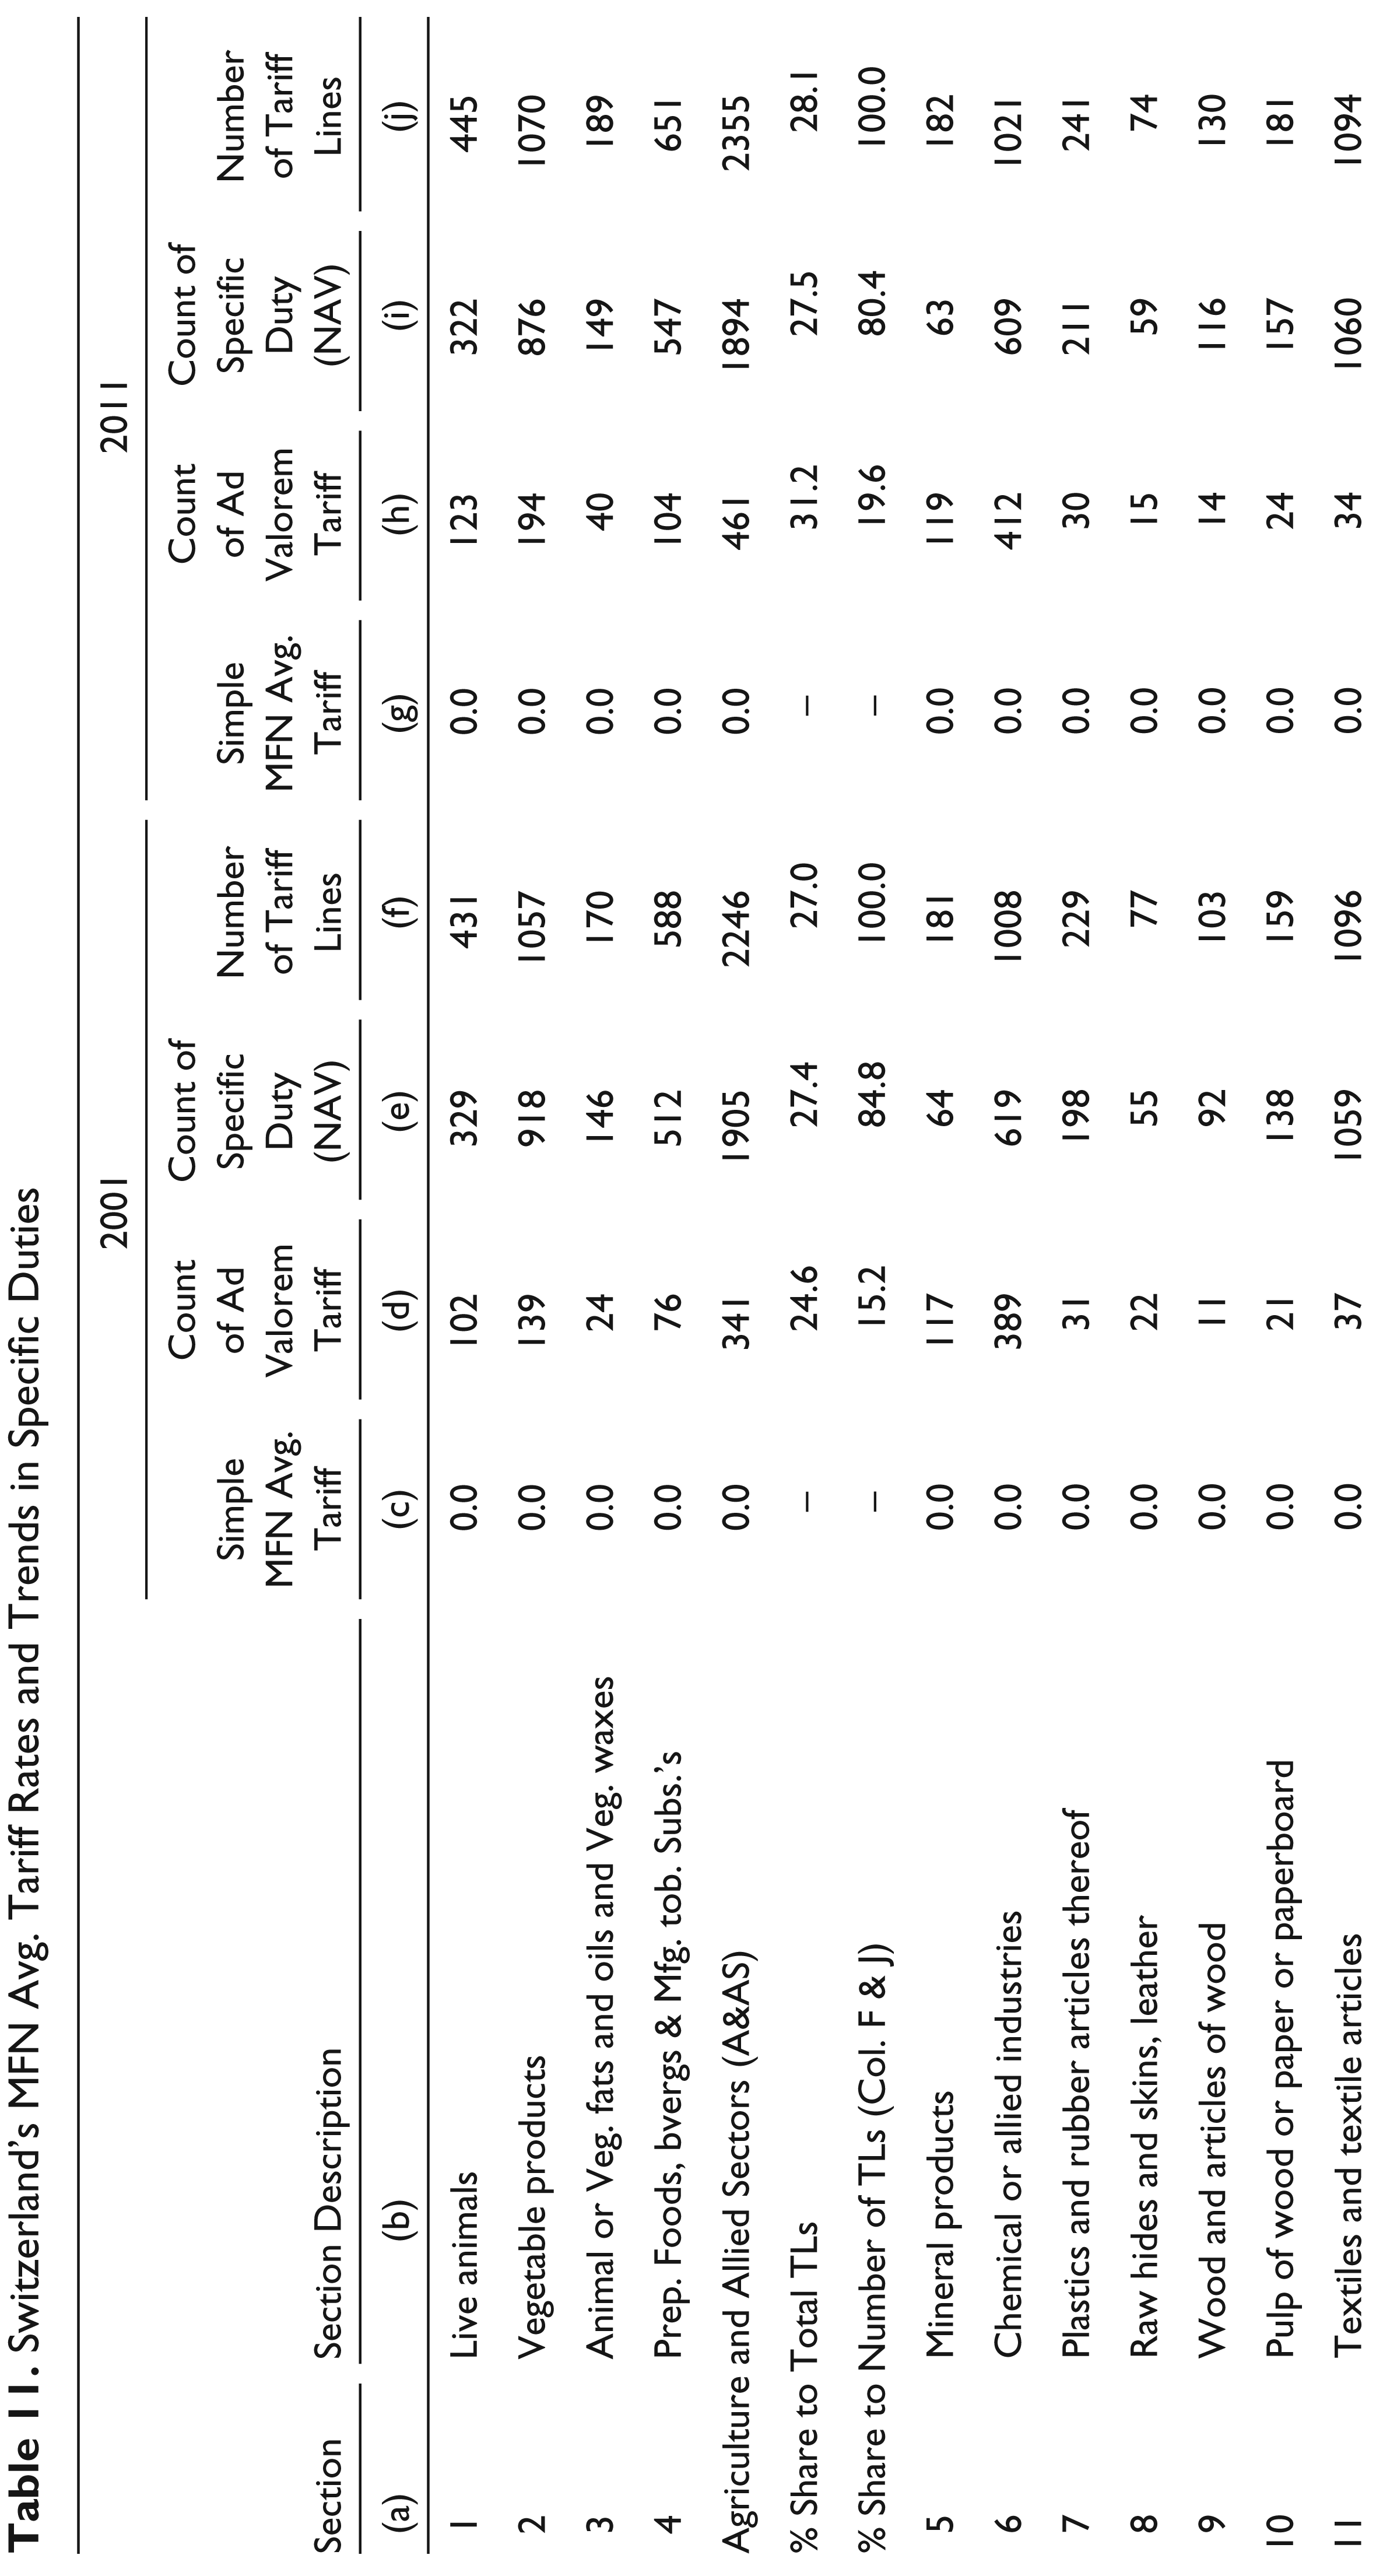
The specific duties in Switzerland have spread across A&AS and N-AG products. In over a decade, the total tariff lines with specific duties showed a marginal decrease of 48 TLs, from 6946 in 2001 to 6898 tariff lines by 2011. It is interesting to note that Switzerland had a lesser number of TLs with AV tariffs when compared to NAV TLs. The overall pattern of usage of ad-valorem and specific duty suggest that it is skewed in favour of the latter.
Table 11 clearly indicates this in both the years analyzed. In 2001, of the total 8333 TLs, those with specific duties accounted for a majority share of 83.4 per cent (6946 lines). By 2011, there was a marginal decrease by one percentage point, at 82.4 per cent with 6898 tariff lines.
The use of NAV duties in Switzerland was not limited to the A&AS products alone, but extended to N-AG products too.
Switzerland’s MFN Avg. Tariff Rates and Trends in Specific Duties
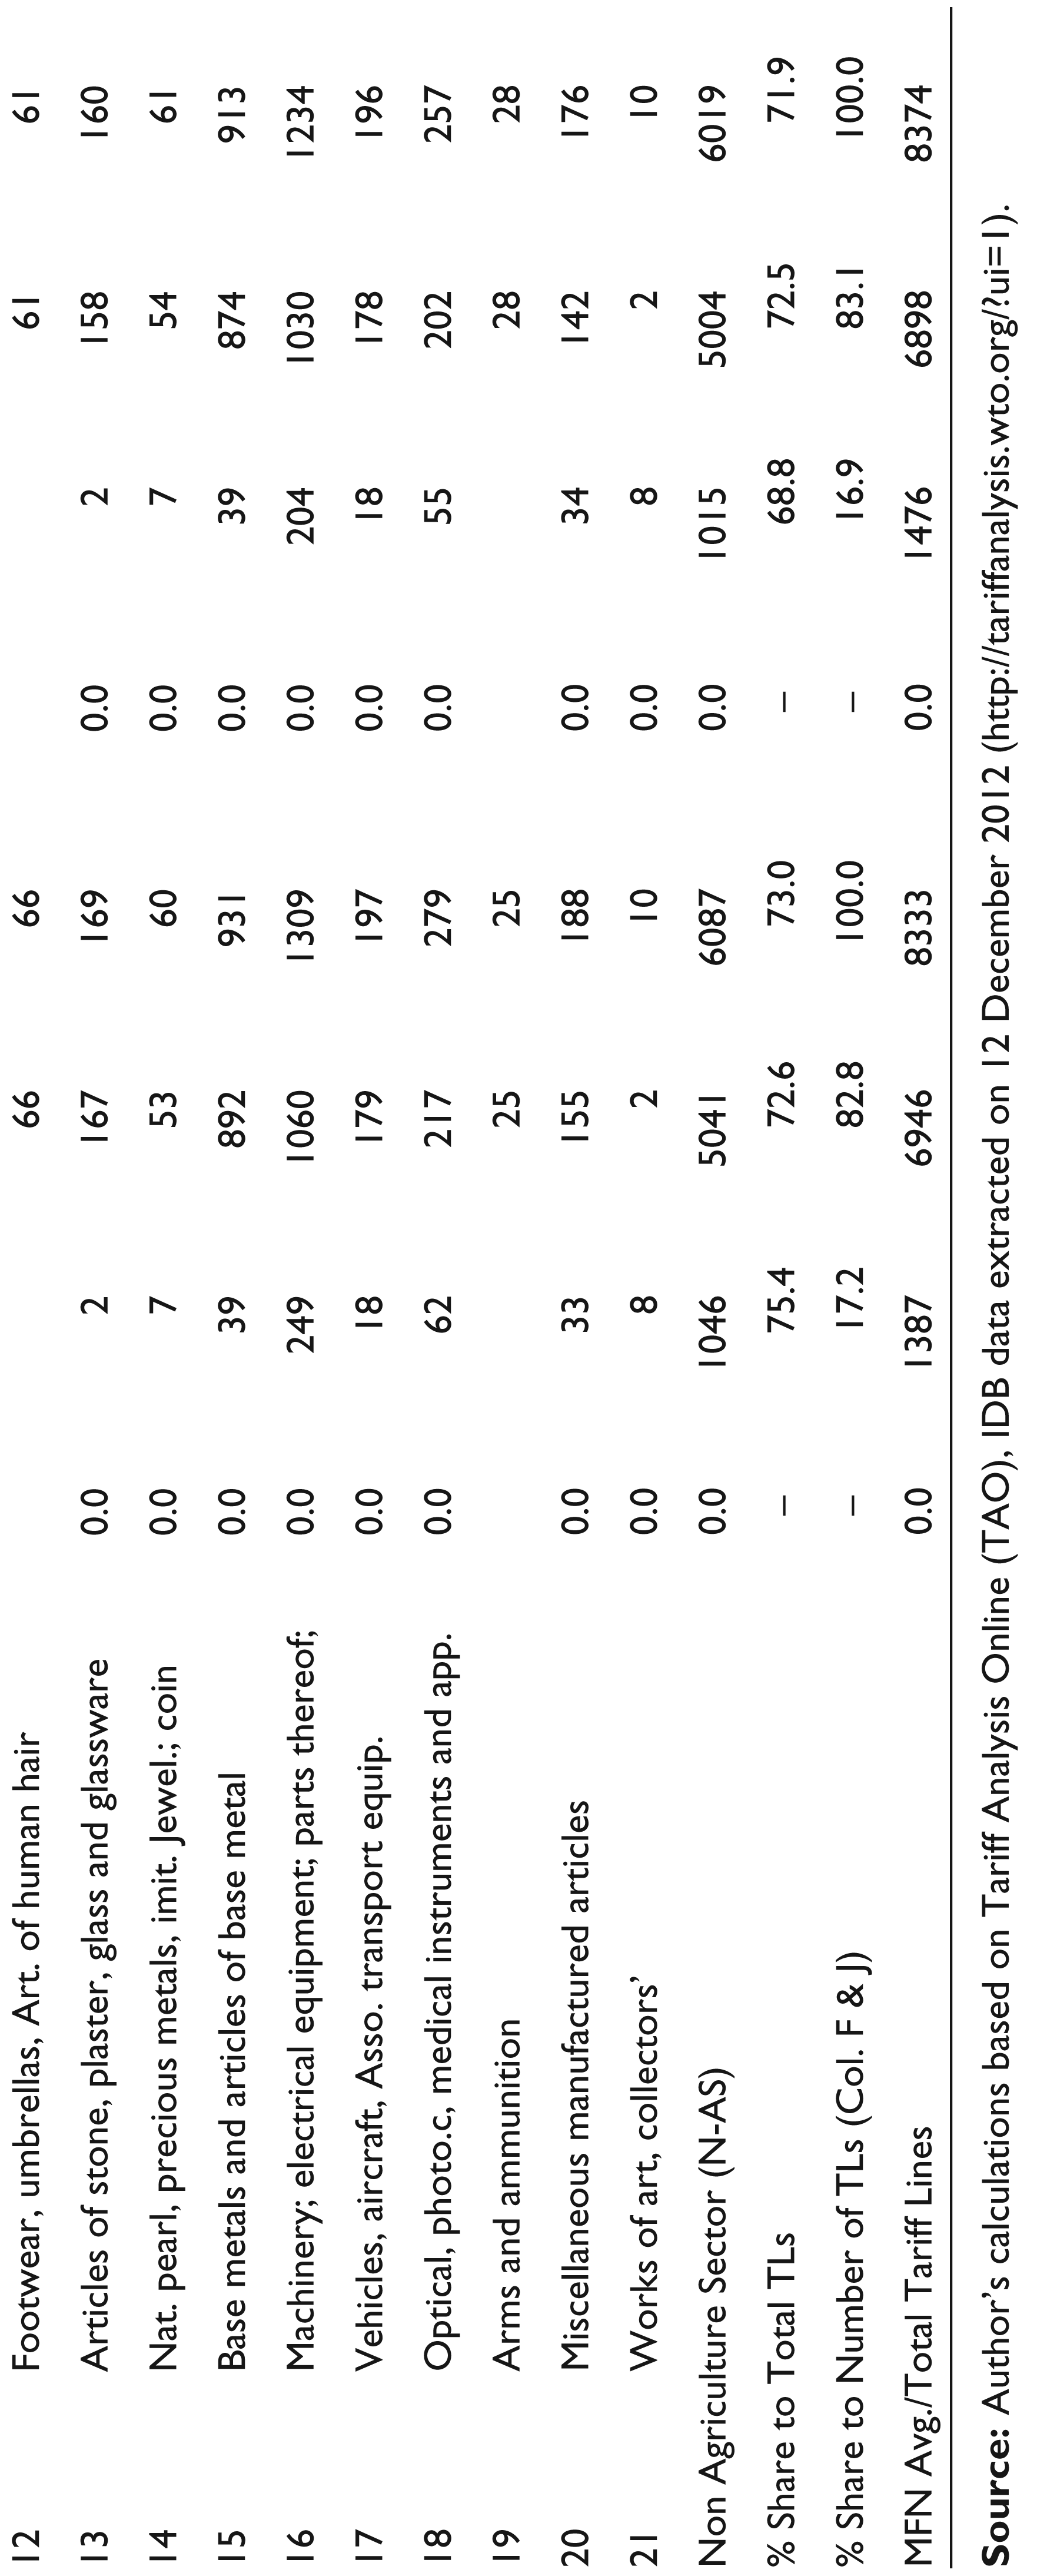
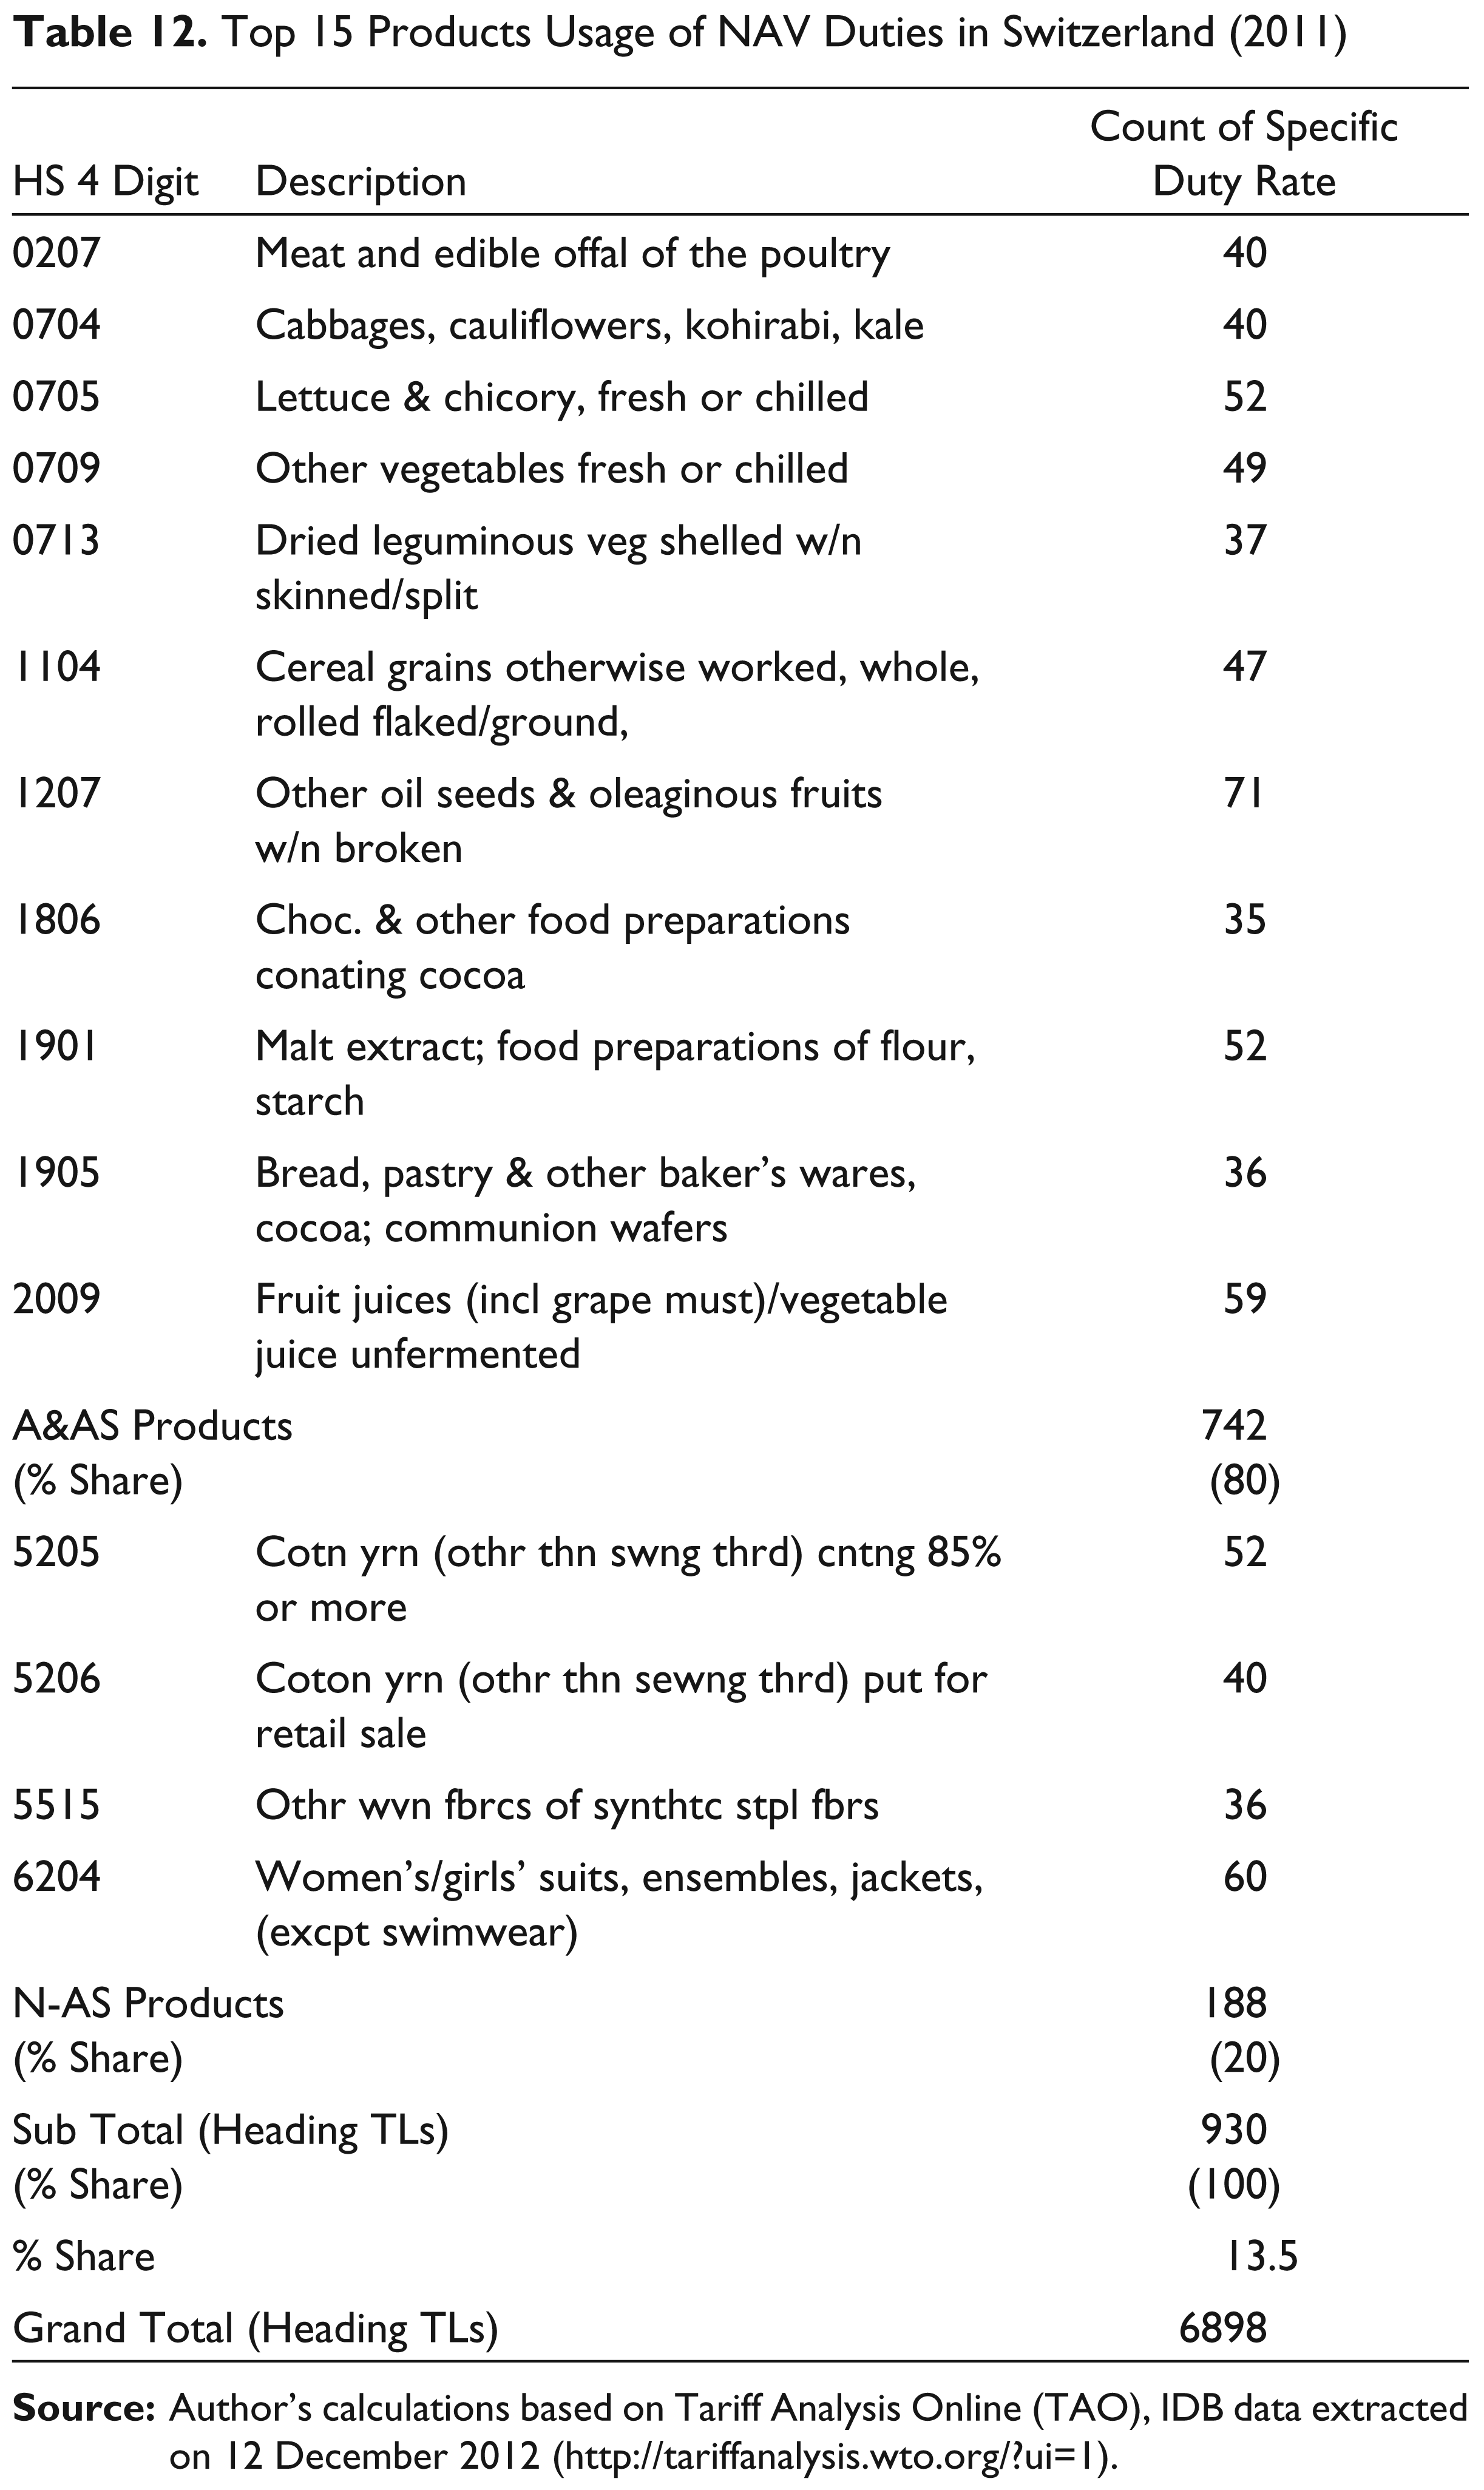
Therefore, the problem of distortion of market access to developing country exporters can be serious, as it is prevalent across all the 21 sections generally, with the exception to two specific sectors, that is, Sections 12 and 19, in which 100 per cent was with NAV duties. Section 12 (Footwear) is an export interest product for developing countries. However, the usage of NAV duties in the A&AS saw a relatively better result in comparison to the totals, dropping by 4.4 per cent. The market access scenario in Switzerland in 2011 suggested a marginal improvement for developing country exporters in A&AS products compared to the scenario in 2001.
Table 12 reveals that close to 80 per cent of the top 15 products with NAV duties belonged to the A&AG section, while only 20 per cent belonged to N-AG. This is in contrast with the overall assessment made that Switzerland had been protecting N-AG products, with nearly 73 per cent having NAV duties.
Such rampaged usage of NAV duties by Switzerland (nearly 85 per cent of TLs even in 2011) cannot be ignored, as these tariffs have a trade distortive effect with currency fluctuations, which occur on a daily basis. It is also evident that even Switzerland, like the other QUAD countries, is not serious on the issue of market access and it is making unnecessary and unrealistic demands for tariff reductions in the negotiations.
Table 13 provides a summary of NAV duty usage across seven developed countries. In terms of import market, these countries account for nearly 69 per cent (average of 2002 to 2011) of the total global A&AS products. 10 As such, these countries are important in the context of market access. In terms of relative shares of A&AS products, the United States and the EU-27 were leading in terms of denial of market access to the developing countries, while the least market access denials were caused by Australia and New Zealand. Switzerland was an exception to the lot, with denial of market access seen across both sectors, agricultural and allied and non-agricultural sectors.
The Case of Developing Countries
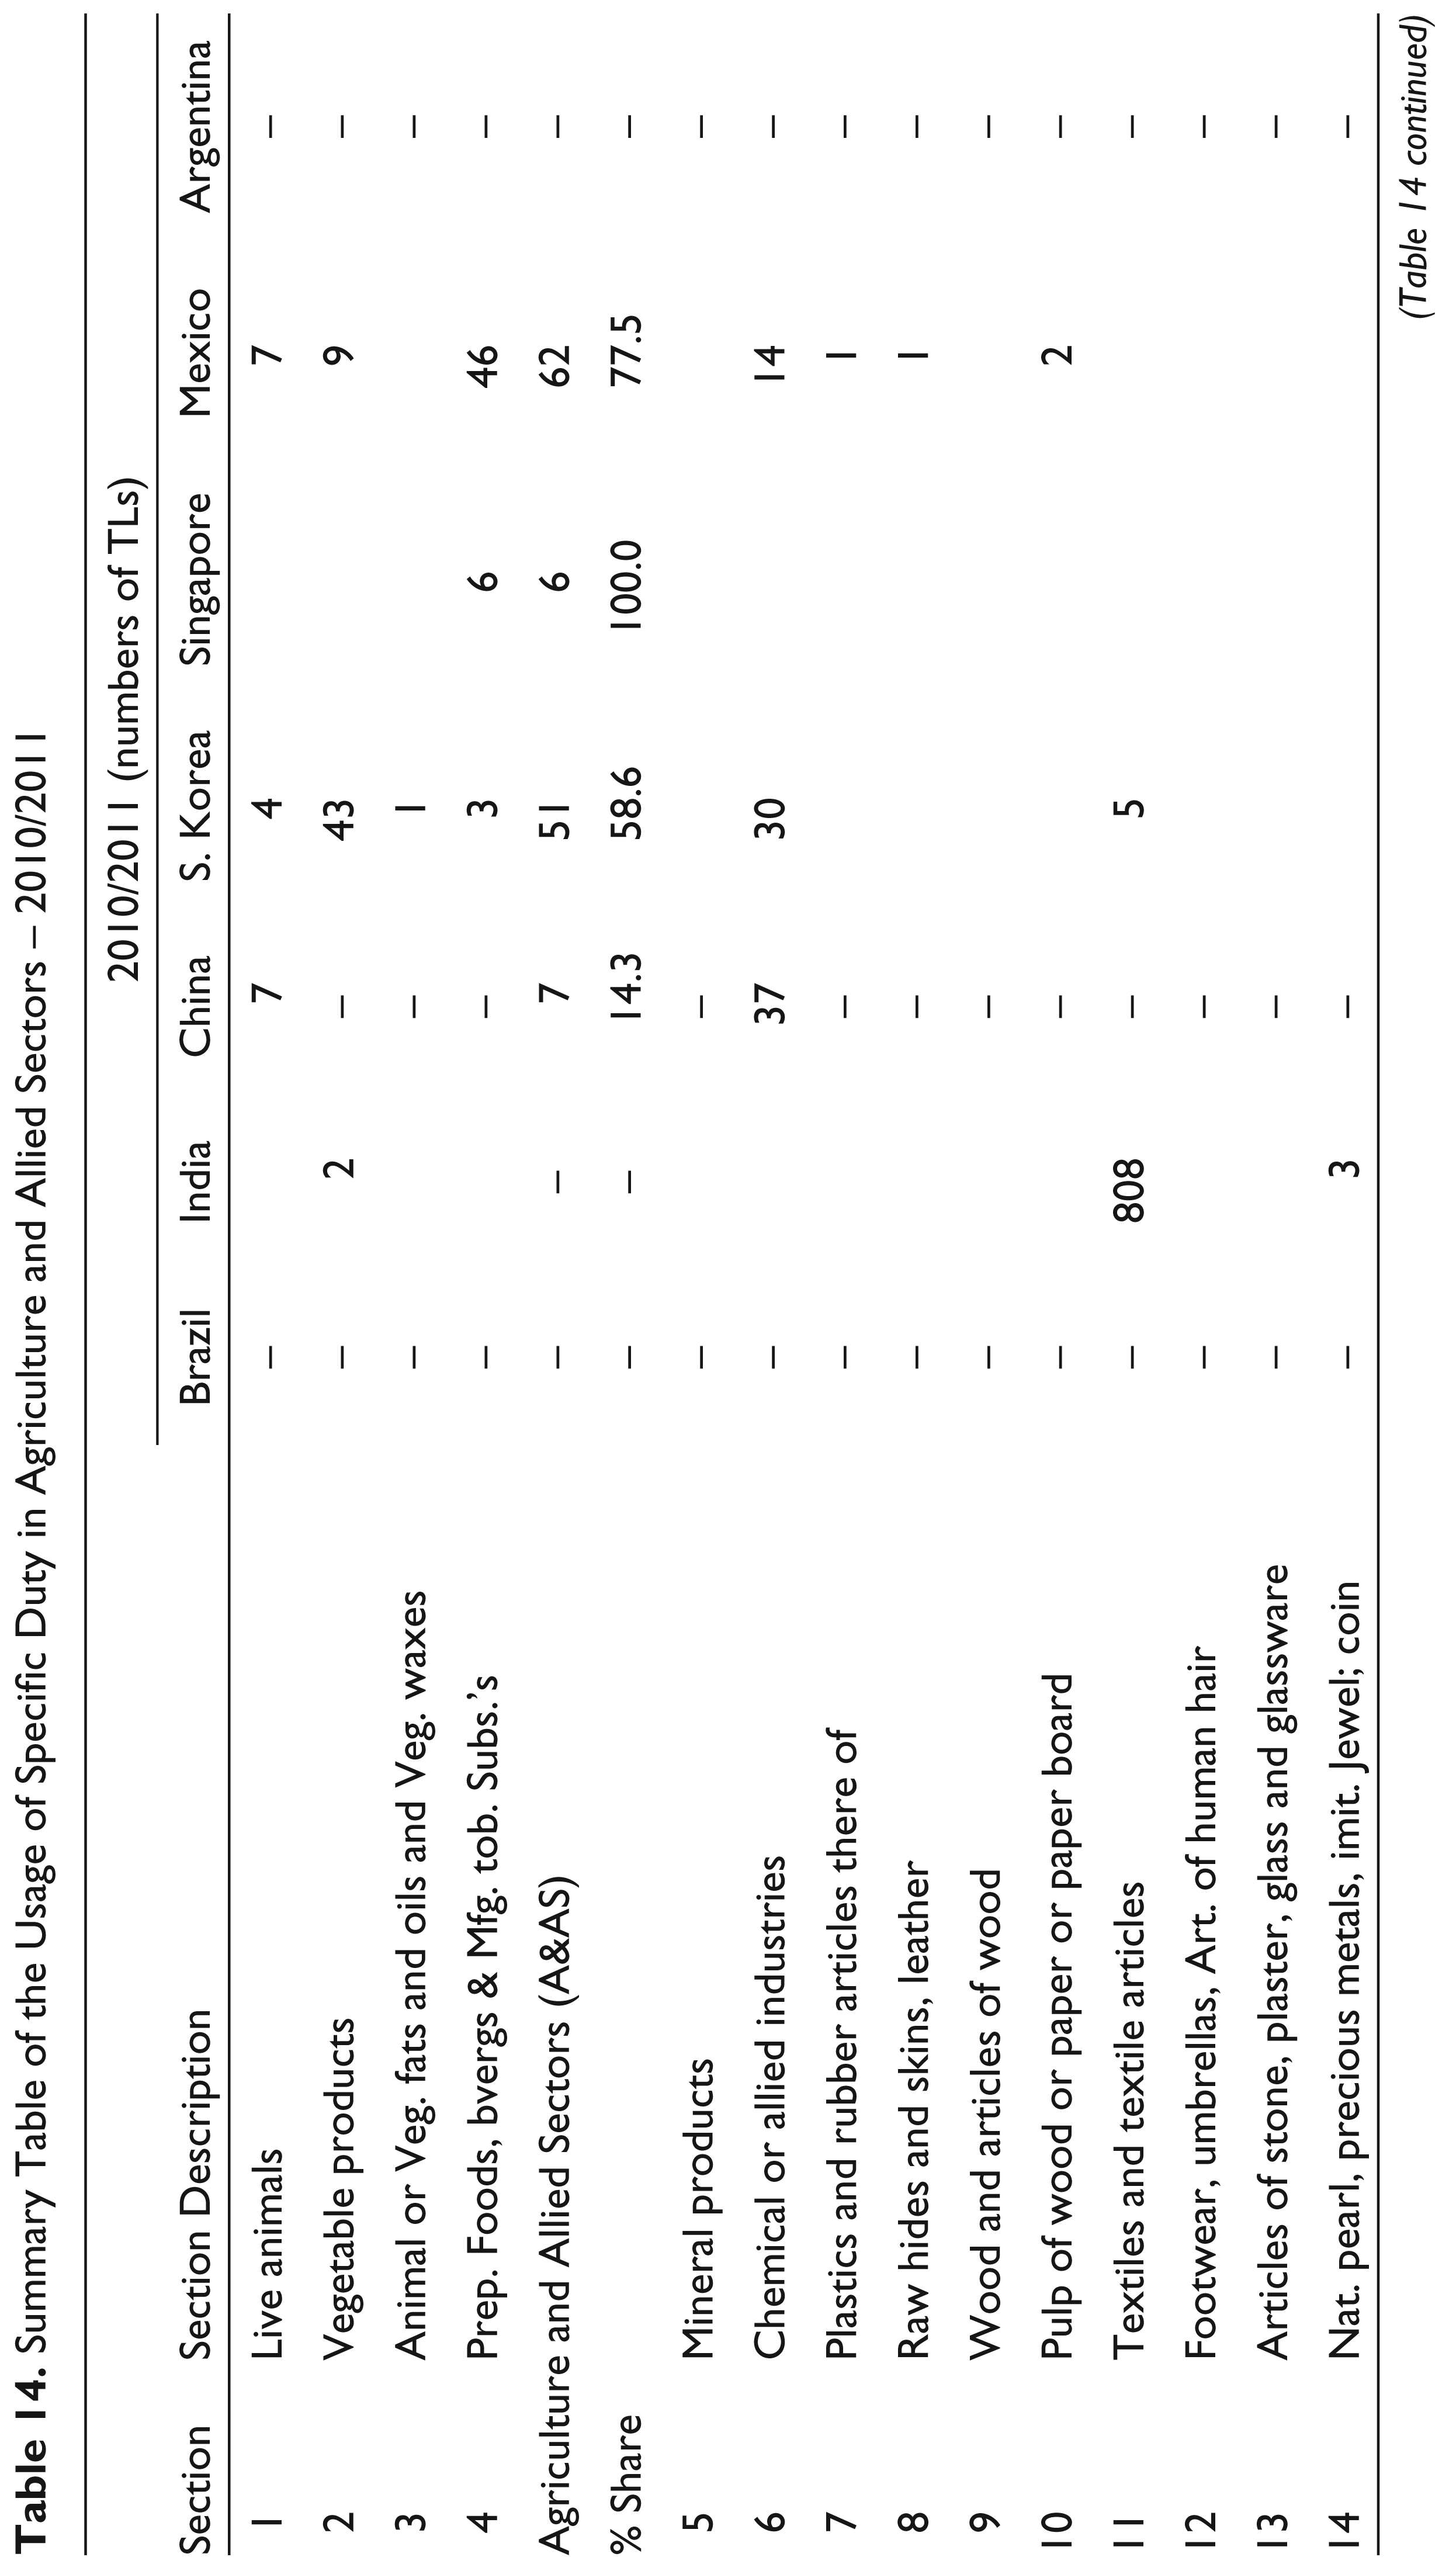
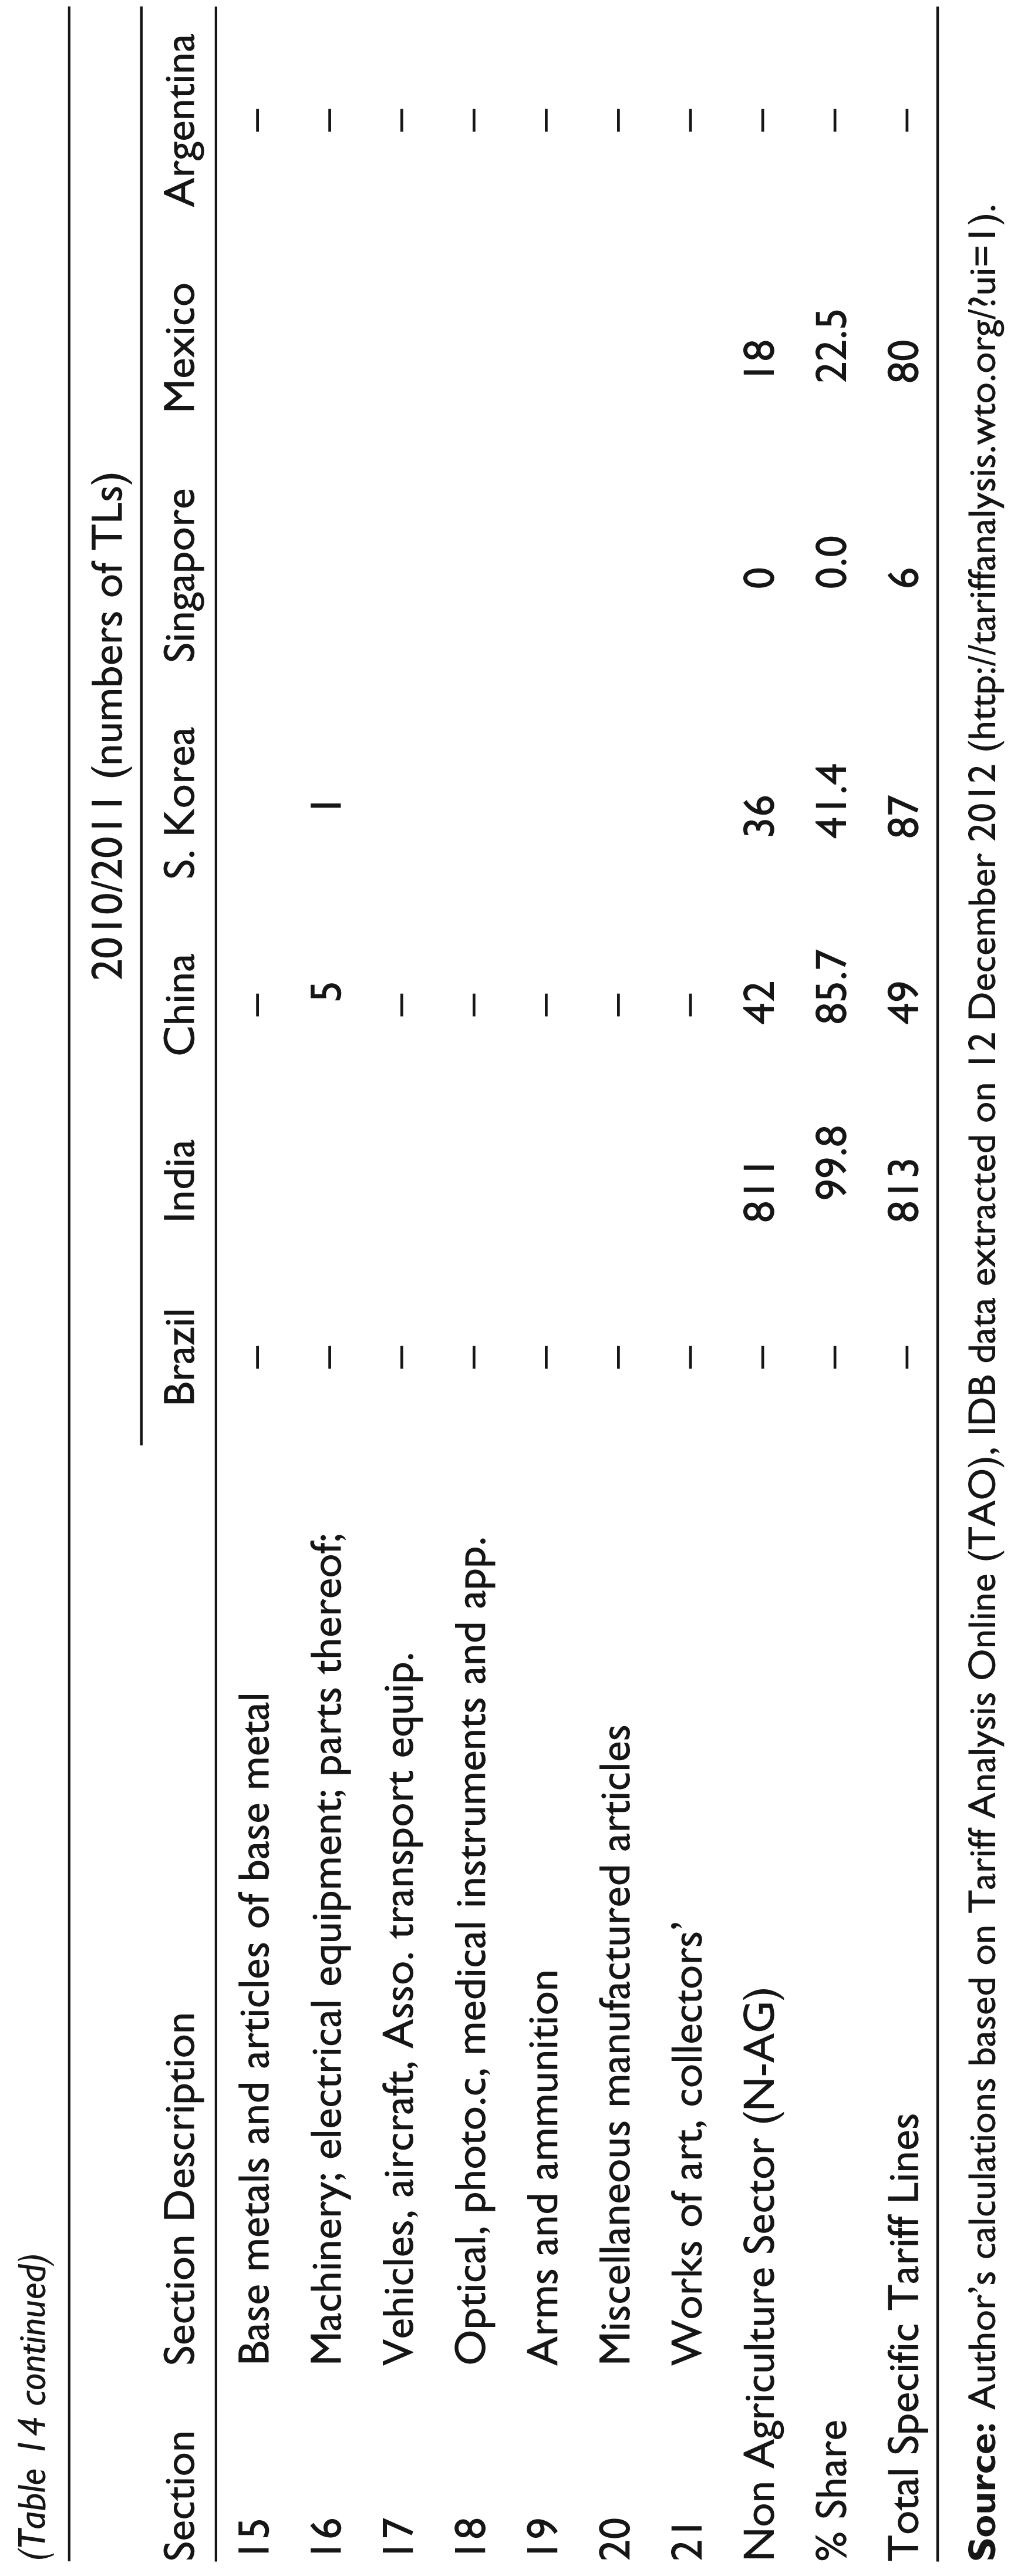
The NAV duties of the developing countries are analyzed in one summary table, as these countries do not have many tariff lines under the products belonging to agriculture and allied sectors. The analysis is undertaken for eight developing countries. Some of the prominent economies are analyzed here to understand their pattern of usage of NAV duties. The countries studied are the Russian Federation, the Republic of Korea, Singapore, Brazil, Argentina, China, Mexico and India. The application of NAV duties across 21 sections are analyzed on the basis of the two categories A&AS (Sections 1 to 4) and N-AG (sections 5 to 21) products.
The patterns of NAV usage of these eight developing countries clearly reveal the extent of a fault line in the negotiation process in goods market access in general and A&AS in particular. The eight developing countries can be categorized into three groups: (a) those which do not use specific duty and, therefore, can be seen to have simple average MFN Applied rates which are truly representative of reality; (b) those with mild usage in the agricultural sector and (c) those with low usage in A&AS tariff lines, but highly concentrated usage in the N-AG sector. The last category contains two of the Asian giants, China and India, with both countries accounting for above 90 per cent of the total specific duties. In the first category are two South American countries (Brazil and Argentina) and one Asian (Singapore). In the second category are countries like South Korea and Mexico.
Top 15 Products Usage of NAV Duties in Switzerland (2011)
Summary of the Usage of NAV Tariff in Agriculture and Allied Sectors (A&AS)—2011
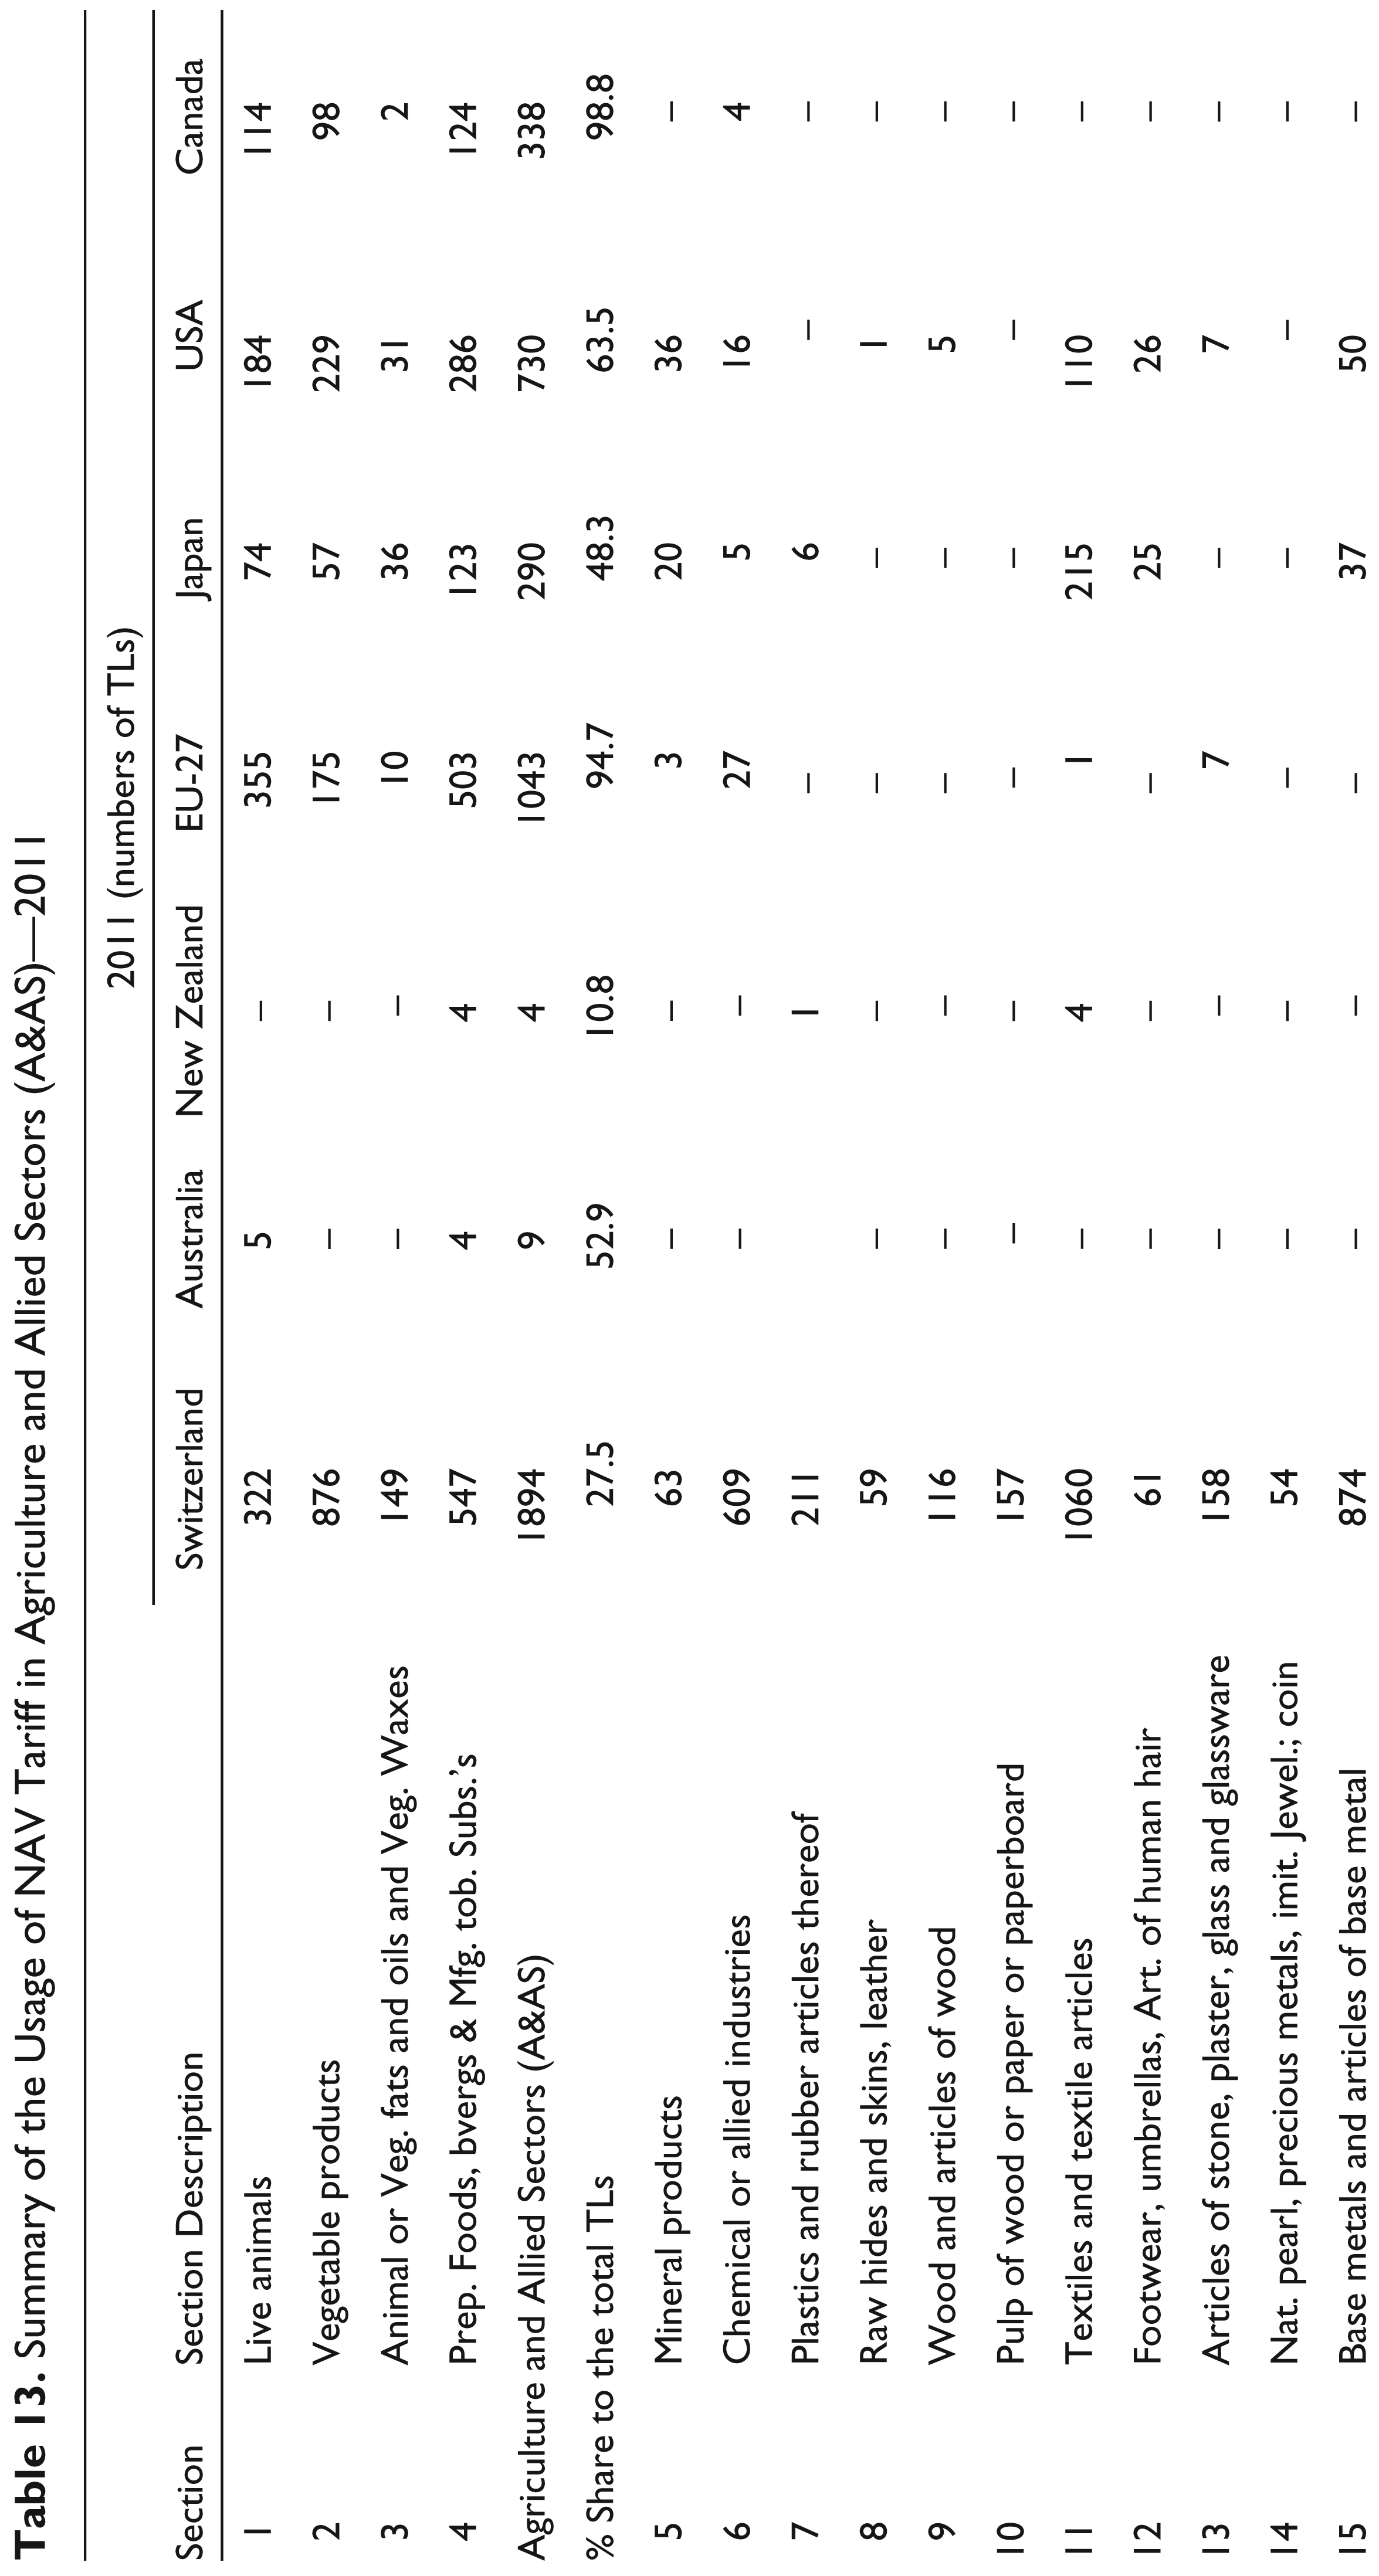
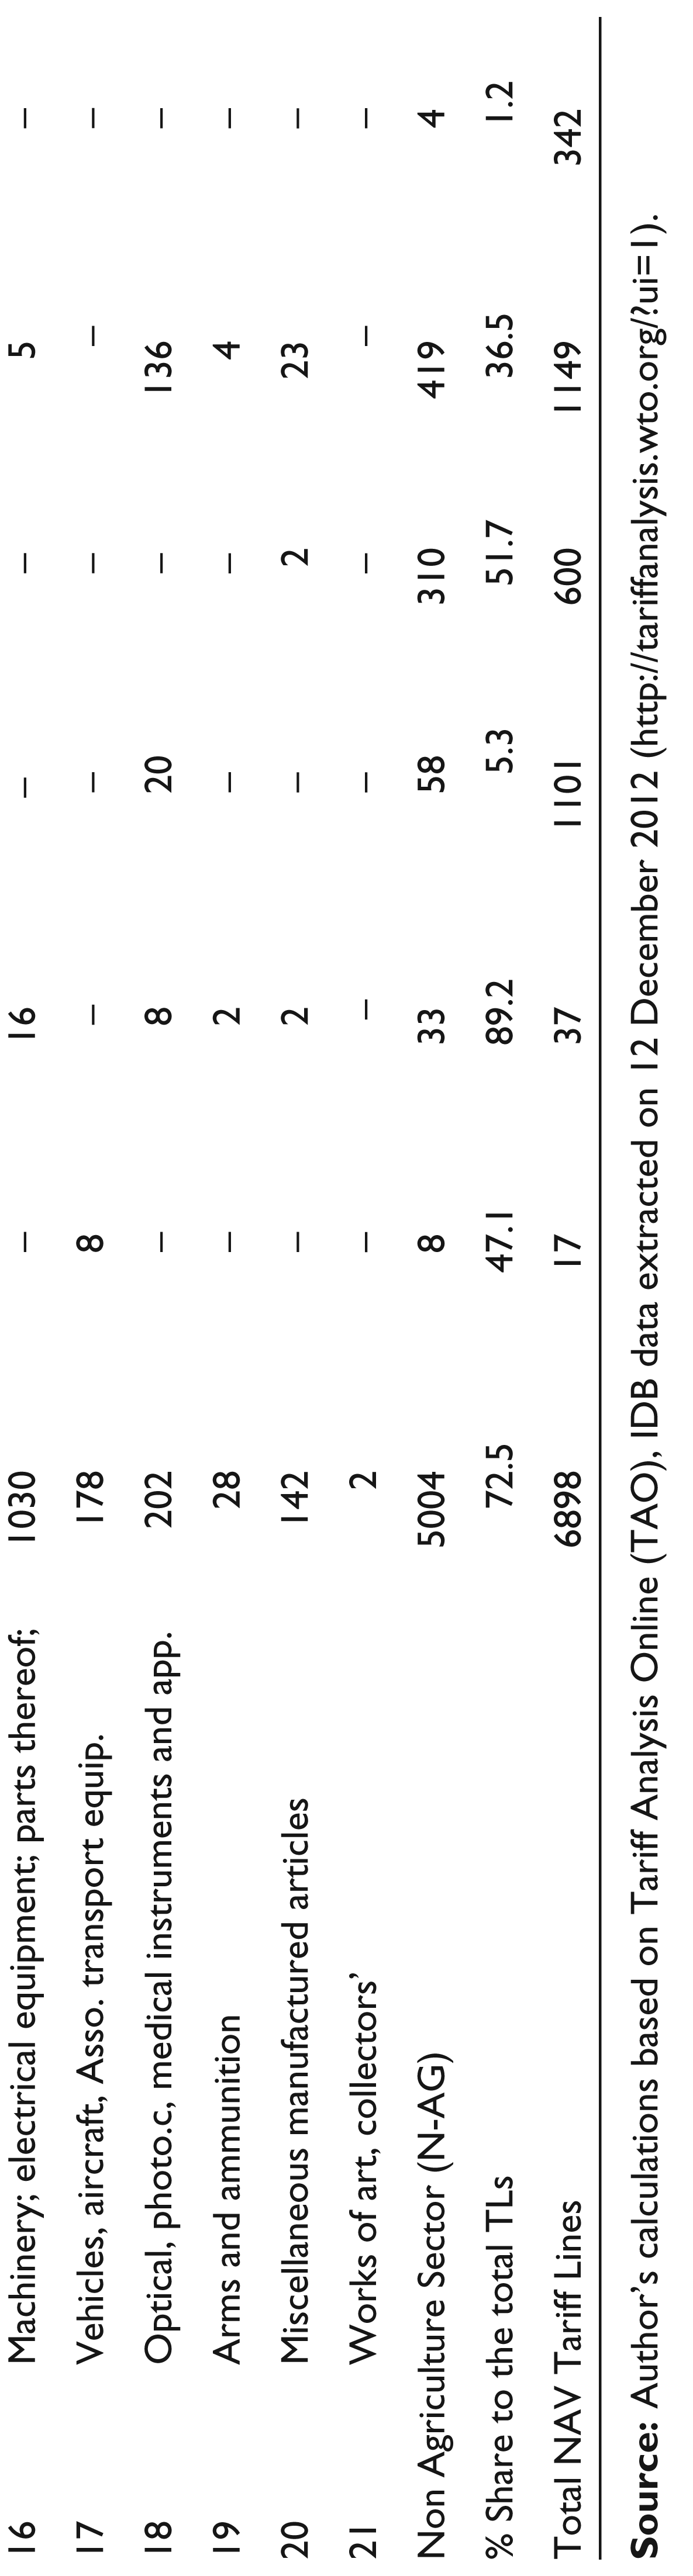
Clearly, in the case of tariffs the simple ad-valorem averages is not truly representative of the actual market access scenario in A&AS products for the developed countries; it hides more than it reveals, in the case of nearly all the countries analyzed here. In the case of developing countries, the tariff simplification will not make much of difference, as the simple ad-valorem tariffs in agricultural and allied sectors are fairly representative. It will only be a problem in the case of non-agriculture market access (NAMA); here, two countries, China and India, would have to reduce NAV duties through the process of AVEs (Table 14).
In the Doha round, what is important is that the trends based on the NAV usage of the selected 15 (developed and developing) countries in the A&AS clearly indicates that usages are skewed in favour of the developed countries. The 9th Ministerial Conference at Bali failed to come to a consensus on this important issue of AVEs, which if addressed would have gone a long way to correcting tariff imbalances.
Conclusion
It is clearly evident that the overall imbalances in both tariff and non-tariff measures (SPS and TBT) have constrained market access for developing countries’ exports of agriculture and allied sector products. 11 In the case of the A&AS sector, Switzerland has the highest share of 80.4 per cent under NAVTLs under the total tariff lines of the A&AS sector, followed by the EU with nearly 43 per cent, the United States with nearly 40 per cent, Canada with 23 per cent and Japan, the lowest among the QUAD countries, with 14 per cent. The QUAD can be seen to be protecting the agricultural sector, while many CGE studies argued that the Uruguay Round liberalization process would bring substantial gains to the developing countries by way of market access provided by the developed countries, especially in exports of agricultural and allied sector products. 12 On the other hand, the developing countries have continued to use mostly ad-valorem tariffs in this sector, meaning that the simple MFN average was truly reflective of market access scenarios. The same cannot be said for the developed countries, which have an average of 40 per cent of tariff lines (products) unaccounted for in the calculation of simple MFN average (NAV duties).
Summary Table of the Usage of Specific Duty in Agriculture and Allied Sectors – 2010/2011
As the Doha negotiations have progressed, tariff simplification of compound tariffs and mixed tariffs appear to have receded into the background. There is no clear mandate in the revised draft modalities for agriculture (TN/AG/W/4/Rev.4, dated 6 December 2008), as there is no specific requirement to convert these tariff lines into a simpler form which would be quantifiable. The protection of the agricultural sector has been the reason for having very high usage of NAV tariff in nearly all the developed countries.
As simple ad-valorem tariff barriers are being reduced under successive rounds of international trade negotiations, concerns have been expressed that a similar effort has been lacking to replace the NAV tariff protection and tighter regulation of agricultural and other food imports through WTO-compatible measures (Kallummal 2013). This article has established that both NAVs and standards have indeed become increasingly important as trade policy instruments in the hand of developed countries for protection or regulatory purposes in A&AS sectors. Furthermore, the evidence based on the manner of usage of NTM versus NAV tariffs suggests that if the European Union were to bring down the intensity of NAV incidence in the A&AS, it may then be replaced with SPS measures, as there seems to be high negative correlation between the two. The developed countries seem to be using these two main channels in order to protect their domestic sectors, which incidentally happens to be the lowest contributor to their GDP.
The discretion provided in the Agreement for basing standards on scientific evidence and the use of local health requirements have led to disguised protection of domestic agricultural sectors, especially among developed countries. Developing country exporters are unable to realize their market access potential in the QUAD Plus countries because of these trade-restrictive measures. Exports of food products from developing countries encounter a formidable hurdle in the form of SPS measures imposed for health and safety reasons in developed countries. The cost of complying with these are often stringent, as the SPS standards are highly burdensome (for example, sub-atomic standards, commonly known as ‘nano standards’),
13
particularly for low-income countries, and non-compliance would entail damaging loss of export earnings. Utsa Patnaik (1999: 20) has argued along similar lines with respect to the increase in non-tariff barriers by the developed countries and the reduction in time frames:
The time phase of QR removal and tariff reduction has been shortened for developing countries whereas important barriers to their exports to advanced countries like the Multi-fibre Agreement which is a system of quotas, have been given a much longer lease of life; and by the time it is dismantled other non-tariff barriers will have been put in place which will effectively close their markets to our textile exports.
It is clear that for those small and medium-sized countries in which a significant proportion of their population depends on agricultural and processed food exports, an increase in market access is crucial in the short term. The primary concern of market access will not be addressed in its true sense for the majority of such WTO members, unless NAV and NTMs are simultaneously addressed in the Doha Round, together with the introduction of the AVEs. While there have been some negotiations within the WTO committees, there has been little progress in addressing these true concerns.
In summary, developing countries’ agricultural sectors have, in general, come under even greater stress because of the technological divide between developed and developing countries. The distortion effects of NAVs and NTMs has exceeded the impact generated by an equivalent measure of ad-valorem tariff imposed by importing countries and has a prolonged effect on the various segments of production and marketing value chains because of the uncertainty generated around the rules of trade. This may have significant implications for the allocation of production, consumption and trading activities across developing countries.
As the developing country trade negotiators are grappling with unresolved implementation issues under the Doha Round, many of them directly related to the AoA, such as effective TRQ Administration, decoupled payments under domestic subsidies, etc., it is important for the developing country negotiators to press upon the WTO membership to have specific requirements to convert the NAV tariffs into more simplified forms. These are indicative of the questions being raised regarding the WTO’s ability to promote balanced and fair MTNs process and rules that address the past and current inequities which developing countries face.
Even if Doha Round were to be concluded, it may not assure a real solution to market access hindrances caused by these large quantum of NAV tariff lines in A&AS; to understand the complexities also see Kallummal (2005: 36, Annex Table 1). There is an urgent need to bring in some parity in the global market access scenarios between the AV and NAV tariffs, especially in the agricultural and allied sector.
Footnotes
Acknowledgements
The author is extremely grateful for the comments and support provided by Professor Abhijit Das of the Centre for WTO Studies, IIFT. Furthermore, the author is grateful to Ms. Hari Maya Gurung and Ms. Sapna Dua for their research support. Responsibility for the views presented in this article belongs to the author.