
Abstract
Background:
The use of bridge-enhanced anterior cruciate ligament (ACL) restoration (BEAR) procedures is on the rise. Yet, there is a paucity of literature describing the radiographic appearance of the ACL after this procedure.
Purpose:
To present the quantitative and qualitative postoperative changes in healing ACLs within the first 24 months after an ACL restoration procedure.
Study Design:
Case series; Level of evidence, 4.
Methods:
A total of 64 patients (64 knees, 19.4 ± 5 years, 57% women) underwent magnetic resonance imaging (MRI) of the knee 6, 12, and 24 months after ACL restoration surgery with an extracellular matrix scaffold as part of a randomized-controlled trial. The ACL sagittal elevation angle and tunnel positions, along with ACL volume, mean cross-sectional area (CSA), length, and normalized signal intensity (SI), were quantified from MRI. Patients were divided into quartiles based on SI at 24 months after surgery for inclusion in the qualitative analysis with an adapted framework for assessing tissue quality. Additional cases were selected for qualitative analysis based on clinical representations. Linear mixed modeling with Tukey post hoc corrections was used to analyze quantitative ACL healing parameters.
Results:
Tunnel positions were anatomic in 26.6% of femurs and 68.8% of tibias. The healing ACL sagittal elevation angle remained stable (<1° change between postoperative time points; P > .1) and was comparable with the contralateral native ACL (<2° difference between contralateral and BEAR at postoperative time points; P > .05) at all time points. The healing ACL volume and CSA decreased over time (P < .01) but remained 20% (volume) and 15% (CSA) larger than the contralateral ACL at 24 months postoperatively (by 341 mm3 volume and 6 mm2 CSA; P < .001). The healing ACL length was constant over time (<1 mm change between postoperative time points; P > .1) and was 5% longer than the contralateral native ACL at final follow-up (by 1.8 mm; P = .027). The ACL SI decreased over time (P < .001) and was 10% less than the contralateral ACL at 24 months (by 0.1 ± 0.3; P = .022). Seven relevant clinical scenarios were highlighted to show a spectrum of healing trajectories after ACL restoration surgery.
Conclusion:
The present study demonstrates that throughout 2 years of serial imaging after an ACL restoration procedure, the healing ACL becomes smaller cross-sectionally and more organized (lower normalized SI). Despite changes in the ACL size and ACL SI, the sagittal orientation remains unchanged and comparable with the contralateral native ACL. In the qualitative analysis, 7 distinct healing trajectories were identified. These data are important for interpreting postoperative imaging after the BEAR procedure, and for identifying that several healing trajectories exist after a restoration procedure. Further studies are warranted to identify patient-specific factors that may influence these trajectories.
Registration:
NCT02664545 (ClinicalTrials.gov identifier).
Keywords
There is a growing prevalence of anterior cruciate ligament (ACL) injuries in the general population. 40 The current standard of care, ACL reconstruction (ACLR) with a tendon graft, is often recommended, especially in younger patients, to restore knee stability and function and expedite return to activity. Initial clinical trials have suggested that an ACL restoration procedure, in which suture repair of the torn ACL is performed in conjunction with an extracellular matrix scaffold to promote healing (Bridge-Enhanced ACL Restoration [BEAR]), may serve as a potential alternative to ACLR, as it has comparable failure rates, patient-reported outcomes, and knee laxity values 2 years after surgery.28,29 Furthermore, patients who underwent ACL restoration surgery had earlier symptom resolution and earlier return of function, 3 as well as higher levels of psychological readiness earlier in their postoperative recovery. 39
The results of a randomized controlled trial comparing outcomes between patients undergoing ACL restoration or autograft ACLR supported the United States Food and Drug Administration (FDA) decision to grant marketing authorization for the ACL restoration procedure 28 using the BEAR Implant (MIACH Orthopedics) in December 2020. Because ACL restoration promotes ligament healing rather than replacing the torn ACL with a tendon graft,25,26 magnetic resonance imaging (MRI) images obtained in the postoperative period appear different after the 2 procedures. While there is a growing body of literature on normal healing patterns after ACLR,32,35,42 less has been documented about radiographic healing patterns in patients undergoing ACL restoration surgery. A previous small cohort study demonstrated that restored ACLs may heal in an orientation more similar to native ACLs, 25 whereas another study demonstrated that ACL remodeling is location specific in both repaired and reconstructed ACLs. 26
Given the recent FDA approval of an extracellular matrix implant and the onset of commercial use of this technique in orthopaedic and sports medicine practices, the purpose of this study was to present quantitative and qualitative postoperative changes in healing ACLs within the first 2 years after an ACL restoration procedure, as assessed by MRI. Standard MRI views and quantitative MRI (qMRI) techniques were used to characterize the ACL tunnel position, sagittal elevation angle, normalized signal intensity, and mean cross-sectional area.2,18,25,26,30 Additionally, a standardized framework for qualitatively evaluating ACL grafts was adapted for the evaluation of ACL healing after the restoration procedure. In delineating postoperative changes in ACL features and appearance after ACL restoration, the aim was to provide clinicians with a frame of reference to assist in monitoring ACL healing and patient recovery after surgery. We hypothesized that the healing ACL after restoration would progress toward a morphology similar to the patients’ contralateral/control ACL both quantitatively and qualitatively.
Methods
Study Population
The data supporting this study were obtained from the restoration arm of the BEAR II trial (IDE G150268; NCT02664545). 28 The institutional review board approved the trial (IRB P00021470), and all patients granted their informed consent before participating. Between May 2016 and June 2017, a total of 65 patients who had a complete ACL tear, were <45 days from injury, had closed physes, and had at least 50% of the length of the ACL attached to the tibia as determined from a preoperative MRI were included in this analysis. These patients were between the ages of 13 and 35 years (43% women; mean age, 19.4 ± 5 years). Patients were excluded from enrollment if they had a history of ipsilateral knee surgery, a history of knee infection, or had risk factors that could adversely affect ligament healing (nicotine/tobacco use, corticosteroids in the past 6 months, chemotherapy, diabetes, or inflammatory arthritis). Patients were also excluded if they had a displaced bucket-handle tear of the medial meniscus requiring repair. All other meniscal injuries were included. Patients were also excluded if they had a full-thickness chondral injury, a grade 3 medial collateral ligament injury, a concurrent complete patellar dislocation, an operative posterolateral corner injury, or injuries to any other ligaments of the knee joint. A detailed description of the trial, along with clinical and functional outcomes, has been previously reported, 28 and these outcomes were used for the narrative case examples in the present study.
Surgical Procedure and Postoperative Rehabilitation
The ACL restoration procedure uses an extracellular matrix-based implant, which, when saturated with the patient's blood, stimulates the torn ACL to heal. 33 The implant is a scaffold composed of bovine extracellular matrix proteins, primarily collagen. 34 Details of the ACL restoration procedure have been previously described.28,29 Briefly, a tibial aiming device (Acufex Director Drill Guide; Smith & Nephew) was used to place a 2.4-mm guide pin through the tibia and into the tibial footprint of the ACL. The pin was overdrilled with a 4.5-mm reamer (Endoscopic Drill; Smith & Nephew). A notchplasty was performed using a combination of a shaver and a curette to facilitate visualization of the femoral footprint. A guide pin was then placed in the femoral ACL footprint, drilled through the femur, and subsequently overdrilled with the 4.5-mm reamer. In some cases, the tunnels were drilled outside of the footprints to avoid damaging the remaining tissue stumps. A whipstitch (Vicryl; Ethicon) was placed in the tibial stump. A cortical button combined with a polyester suture stent (Ethibond; Ethicon) was passed through the femoral tunnel and secured to the proximal femoral cortex to repair the ACL for additional support. The implant was introduced into the knee through a mini-arthrotomy and injected with the patient's blood to activate the implant.28,29 Once the restoration procedure was completed, the incisions were closed in a standard fashion.
A physical therapy protocol for ACLR, adapted from the Multicenter Orthopaedics Outcomes Network,43,44 was prescribed for all patients. A locking hinged brace (TScope; Breg) was applied postoperatively to limit joint range of motion between 0° to 50° of knee flexion for 2 weeks, and from 0° to 90° for the next 4 weeks, unless they had a concomitant meniscal repair, in which case the brace range was restricted to 0° to 40° for the first 4 weeks postoperatively before increasing to 0° to 90° of flexion. All patients were provided with a cold therapy unit (Iceman; DJO Global). Patients were allowed partial weightbearing for 2 to 4 weeks, then weightbearing as tolerated with crutches until 4 to 6 weeks, depending on meniscal repair status. A functional ACL brace (CTi brace; OSSUR) or a simple hinged knee brace was recommended for 6 to 12 weeks, with the functional knee brace recommended for cutting and pivoting sports for 2 years after surgery. Patients were cleared to return to sports (RTS) at the operating surgeon's discretion after completing the International Knee Documentation Committee (IKDC) subjective score, hamstring and quadriceps strength testing, and bilateral hop testing at the 6-month visit, with potential retesting and clearance at a 9-month visit for some cases.
MR Imaging
MR images were acquired from the surgically treated knees at 6, 12, and 24 months postoperatively using a 3.0-T scanner (Tim Trio; Siemens) and a 15-channel knee coil (Siemens). The contralateral knees were also scanned at least once over the follow-up visits (6, 12, or 24 months), depending on MR magnet availability. We used the first available contralateral knee MRIs to analyze the contralateral native ACL. Standard proton density-weighted (PD) and T2-weighted (T2) sequences were used, as well as the constructive interference in steady state (CISS) sequence, to quantify the mean cross-sectional area and normalized signal intensity of the ACL.2,18,25,26,30 Details of the image acquisition parameters are provided in Table 1. All images were acquired in the same imaging session. PD images were reformatted in the coronal and axial planes to facilitate evaluation.
Image Acquisition Parameters a
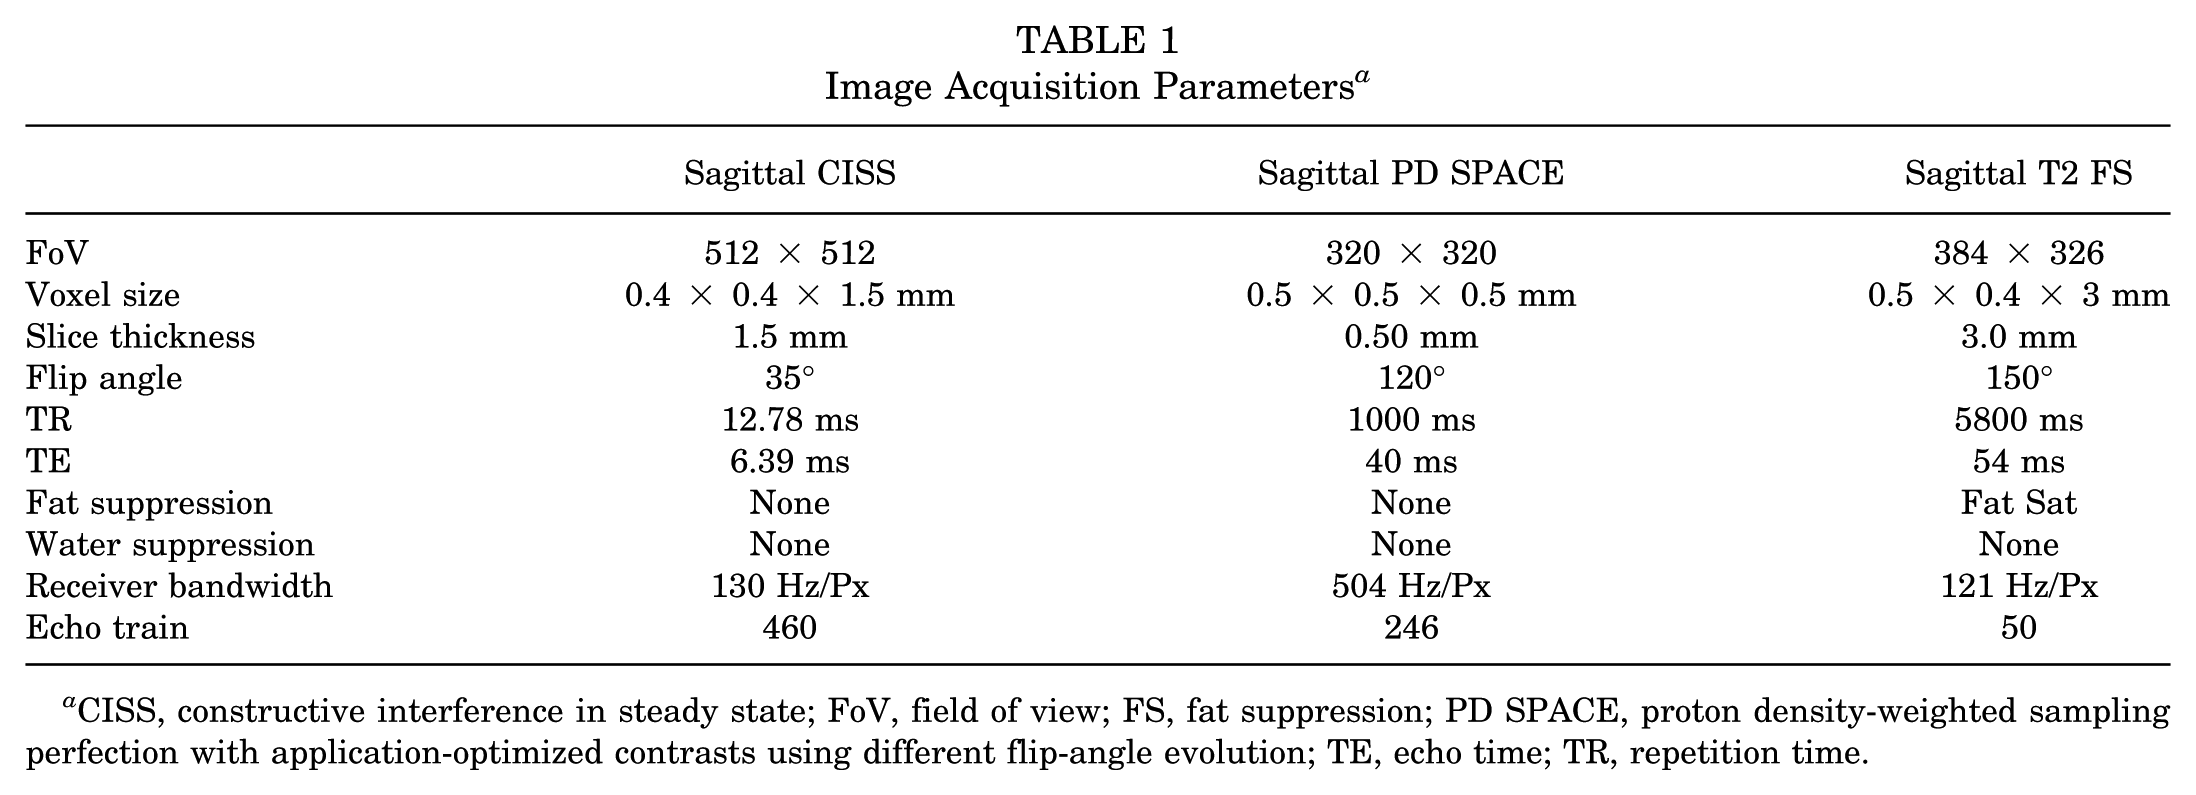
CISS, constructive interference in steady state; FoV, field of view; FS, fat suppression; PD SPACE, proton density-weighted sampling perfection with application-optimized contrasts using different flip-angle evolution; TE, echo time; TR, repetition time.
Quantitative Analysis of ACL Morphology and Longitudinal Healing
The PD and T2 images were reviewed by a senior musculoskeletal radiologist (K.E.) to clinically assess knee recovery and ACL healing. The CISS images were used to quantify the integrity of the healing ACL. Briefly, the ACLs were manually segmented by an experienced examiner (A.M.K.), who demonstrated high intra-rater reliability (ICC >0.9) for segmenting intact and surgically treated ACLs15-17 using image processing software (Mimics Version 17.0; Materialize). The reconstructed 3-dimensional masks of the segmented images were used to measure the ACL length and volume (Appendix Figure A1).25,26 The mean cross-sectional area was calculated as the ligament volume divided by its length. The normalized median signal intensity was calculated from the grayscale values of each voxel within the segmented ACL, normalized to the posterior cortex of the femoral diaphysis, and log-transformed base-2, as the data were not normally distributed.
The ACL orientation (sagittal elevation angle) and tunnel positions were quantified on the PD sequence using a commercial medical image viewer (OsiriX Version 8.5; Pixmeo SARL) after the techniques previously described (Appendix Figure A1).20,25,41 To measure the ACL sagittal elevation angle, the longitudinal axis of the tibia was established using the technique described by Hudek et al. 23 The ACL longitudinal axis was defined as the line colinear with the long axis of the ligament in a sagittal slice with maximum coverage of the ACL. The ACL sagittal elevation angle was measured as the angle between the longitudinal axis of the ligament and the line perpendicular to the long axis of the tibia.25,41 The femoral and tibial tunnel positions were measured from the MR images obtained 6 months after surgery (Appendix Figure A1). For the femoral tunnels, the first sagittal slice showing the tunnel on the lateral condyle was selected, and the width and height of the lateral condyle of that slice were measured. The distances from the center of the tunnel to the posterior and distal cortices of the condyle were measured and normalized to the width and height of the lateral condyle to quantify the location of the femoral tunnel in anterior-posterior and superior-inferior directions. Using the same image stack, the most medial slice showing the tibial tunnel was used to measure the tibial width. The distance between the tibial tunnel center and the front of the tibia was also measured and normalized to the tibial width to quantify the tibial tunnel anterior-posterior location. Similar methods were used to quantify the locations of the ACL femoral and tibial insertions from preoperative MR images.20,25
Qualitative Assessment of ACL Healing
Patients were selected for qualitative analysis based on ACL normalized signal intensity at 2-year follow-up. ACL normalized signal intensity has been used as a surrogate measure of tissue quality (eg, collagen organization, tensile failure load), where a lower signal (ie, a darker appearance) is indicative of a more organized and mature ligament.4-6,8-10,19,26 After rank ordering patients based on the ACL normalized median signal intensity 2 years after surgery, 1 patient from the top quartile, 1 patient from the middle 2 quartiles, and 1 patient from the bottom quartile were randomly selected to show a generalizable sample of MRI changes over time. After agreement between the authors, additional cases highlighting important healing trajectories after ACL restoration were also selected, including cases in which revision surgery was needed due to reinjury, inappropriate healing, early injury that healed without revision, or lack of femoral stump integration. A standardized framework for assessing the healing ACL from MRI was adapted from the Anterior Cruciate Ligament Osteoarthritis Score (ACLOAS). 38 The ACLOAS is a semiquantitative assessment tool to evaluate joint health after ACL injury with independent scores for different knee tissue structures and regions. This study focused on the ACL graft subscores, originally defined as 0 = hypointense, regular thickness; 1 = hyperintense, regular thickness; 2 = thinned or elongated graft; and 3 = graft failure, complete discontinuity. We modified these scores to account for the healing ligament after ACL restoration surgery (Table 2). A similar approach has been recently used for MRI assessment of ACL healing after nonoperative management of ACL tears.13,14
Qualitative ACL Healing Assessment a

ACL, anterior cruciate ligament.
Statistical Analysis
Linear mixed modeling was used to evaluate longitudinal changes in healing ACL sagittal elevation angle, CSA, and normalized signal intensity (all defined as continuous dependent variables) against ligament status (ie, contralateral or months after surgery) as an independent variable. The Tukey post hoc test was used to adjust for multiple comparisons. The mean and 95% CI of the measurements done on the contralateral native ACLs were used as reference. Two-sided P values are reported and considered significant when P < .05. Analyses were performed using statistical software (Prism Version 9.0; GraphPad Software Inc).
Results
The detailed demographic characteristics, along with pre- and postoperative outcomes through 2 years of this cohort, have been previously published. 28 Briefly, in the 64 patients (64 knees) in the final BEAR arm, the median age of patients was 17 (interquartile range, 16-20), and 37 (57%) of the patients were women. At 2 years postoperatively, the mean IKDC score was 88.9 ± 13.2, and 9 (14%) patients underwent conversion to ACLR.
Tunnel Positions
On average, the femoral tunnels were located at 28.1% ± 5.2% (range, 16%-40%) and 52.7% ± 8.9% (range, 35%-80%) in the anterior-posterior and superior-inferior directions, respectively. On average, the tibial tunnels were located at 33.5% ± 7.8% (range, 15%-51%) and 42.5% ± 3.4% (range, 33%-51%) in the anterior-posterior and medial-lateral directions, respectively. In 26.6% of knees, the femoral tunnel was drilled inside the ACL femoral insertion, while the tibial tunnel was drilled inside the ACL insertion in 68.8% knees. Considering the involvement of the torn tibial and femoral stumps in the healing process during ACL restoration, the healing ACL bridged from both insertion to insertion as well as tunnel to tunnel (Figure 1A). The further anterior placement of the femoral tunnel resulted in a complex femoral attachment morphology that included both femoral tunnel and native insertion (Figure 1B).
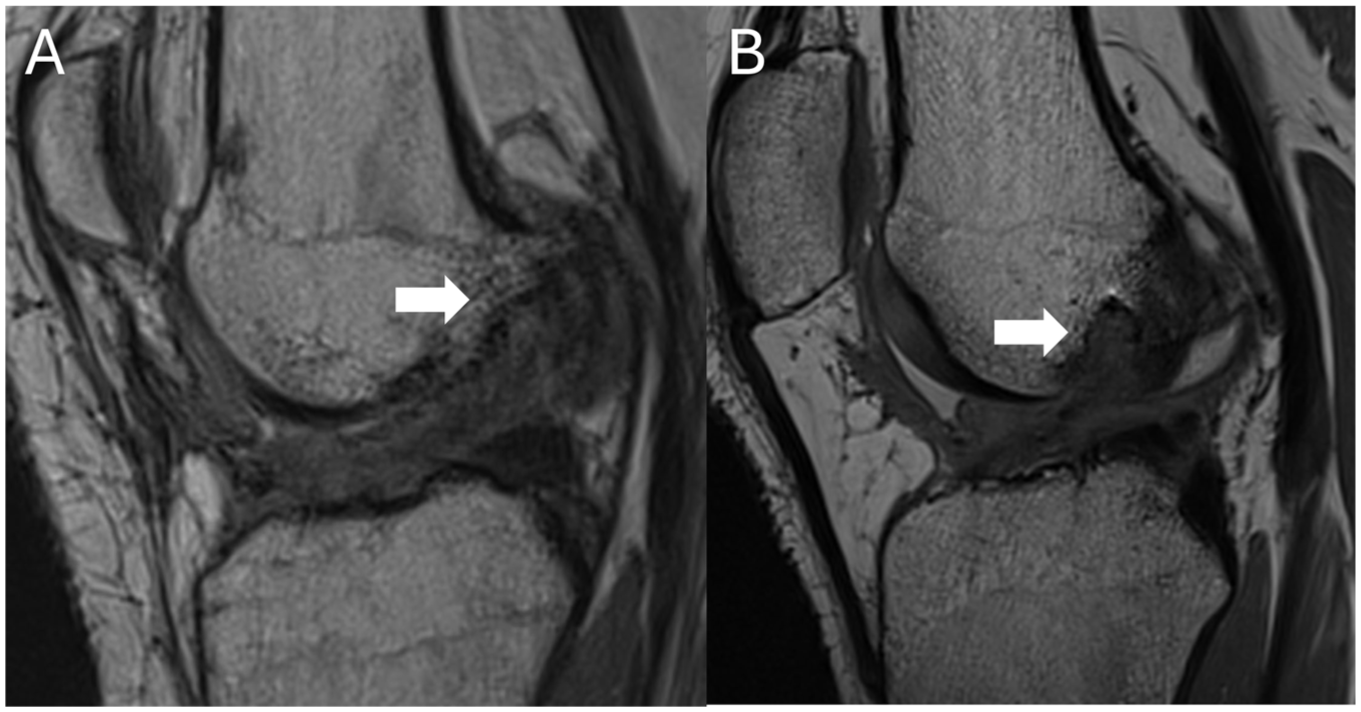
Treated ACL healing from tibia to femur (Both panels: Sagittal PD MRI). (A) ACL healing in a knee with femoral tunnel close to the native attachment (anterior-posterior location: 18%). (B) ACL healing in a knee with femoral tunnel further anterior to the native attachment (anterior-posterior location: 40%). Femoral tunnels are highlighted with the white arrows. ACL, anterior cruciate ligament; MRI, magnetic resonance imaging; PD, proton density weighted.
Longitudinal Changes in ACL Quantitative Properties
The healing ACL sagittal elevation angle was comparable with the contralateral native ACL (P > .05) at all timepoints and remained unchanged from 6 to 24 months after surgery (P > .1) (Figure 2). At 24 months, the mean ACL sagittal elevation angle was 47.6°± 5.3° compared with 48.8°± 3.1° in the native contralateral knees. The healing ACL volume significantly decreased overtime (P < .01) but remained 35% larger than the contralateral native ACL at 6 months (by 596 mm3 [95% CI, 429-764]; P < .001), 28% larger at 12 months (by 475 mm3 [95% CI, 327-623]; P < .001), and 20% larger at 24 months (by 341 mm3 [95% CI, 168- 515]; P < .001) after surgery (Figure 2). At 24 months, the mean ACL volume was 2047 ± 524 mm3 compared with 1706 ± 455 mm3 in the native contralateral knees.
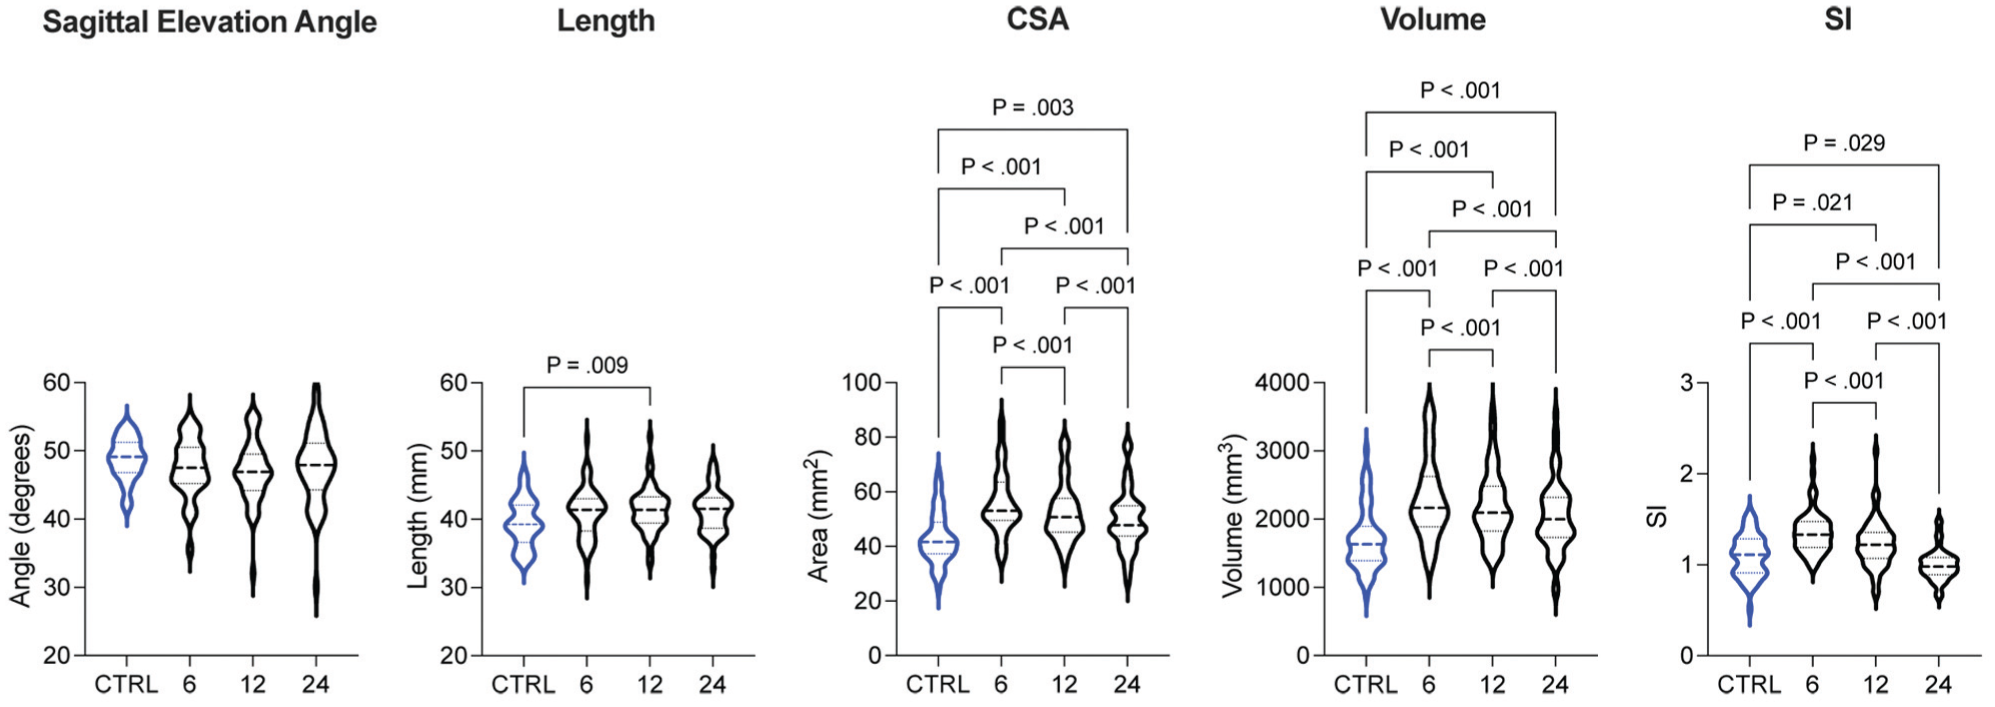
Violin plots indicating the longitudinal changes in ACL orientation, size, and normalized signal intensity from 6 to 24 months after surgery, and compared with the contralateral native ACL (CTRL). PD images were used to measure sagittal elevation angle, and CISS was used to assess tissue quality and size. Dash lines indicate the median and interquartile range. Significant P-values are shown. ACL, anterior cruciate ligament; CISS, constructive interference in steady state; CTRL, control/contralateral native ACL; PD, proton density weighted.
Similarly, the healing ACL mean cross-sectional area decreased overtime (P < .01) but remained 30% larger than the contralateral native ACL at 6 months (by 12.8 mm2 [95% CI, 9.1-16.6]; P < .001), 22% larger at 12 months (by 9.5 mm2 [95% CI: 5.9-13]; P < .001), and 15% larger at 24 months (by 6.4 mm2 [95% CI, 2.5-10.4]; P <.001) after surgery (Figure 2). At 24 months, the mean cross-sectional area was 49.5 ± 11 mm2 compared with 43 ± 9.4 mm2 in the native contralateral knees. While there were no significant changes in healing ACL length from 6 to 24 months (P > .1), the healing ACL mean length was 5% longer than the contralateral native ACL at 12 months (by 2 mm [95% CI, 0.4-3.6]; P = .011) and 5% longer at 24 months (by 1.5 mm [95% CI, 0.2-3.3]; P = .027) after surgery (Figure 2). At 24 months, the mean ACL length was 41.2 ± 3.2 mm compared with 39.4 ± 3.5 mm in the native contralateral knees.
The healing ACL normalized signal intensity significantly decreased overtime (P < .001) from being 24% higher than the contralateral native ACL at 6 months (by 0.25 [95% CI, 0.16 to 0.35]; P < .001) and 12% higher at 12 months (by 0.13 [95% CI, 0.02 to 0.24]; P = .017) to being 10% less than the contralateral native ACL at 24 months (by 0.1 [95% CI, 0.01 to – 0.18]; P = .022) (Figure 2). At 24 months, the mean ACL signal intensity was 1 ± 0.17 compared with 1.10 ± 0.23 in the native contralateral knees.
Representative Images of the ACL after BEAR
Grade A MR Result (Intact fibers with signal intensity in the top quartile of healers). Figure 3 shows an example of a Grade A healing trajectory in a 23-year-old female patient in the top quartile of healers (ie, lowest signal intensity). Table 3 shows this patient's quantitative healing markers. At 6 months after surgery, the ACL had a nearly normal appearance with intact fibers following from the femoral to the tibial attachment without curvature (Grade B; slight heterogeneity and increased signal). At 12 months, the ACL continued to have a nearly normal appearance (Grade B; slight heterogeneity and increased signal), with continuous fibers throughout. At 24 months, the ACL remained healthy (Grade A; homogeneous, low-signal) and appropriately thick.

Six-, 12-, and 24-month postoperative images of a patient who underwent ACL restoration—(A-C) top panels: sagittal PD MRI, (D-F) bottom panels: sagittal T2 MRI—demonstrating above-average healing. Progressively lower signal in intact fibers is observed at all time points, including a near-normal ACL appearance at 24 months (white arrows). ACL, anterior cruciate ligament; MRI, magnetic resonance imaging; PD, proton density weighted.
Example of Grade A Healing a
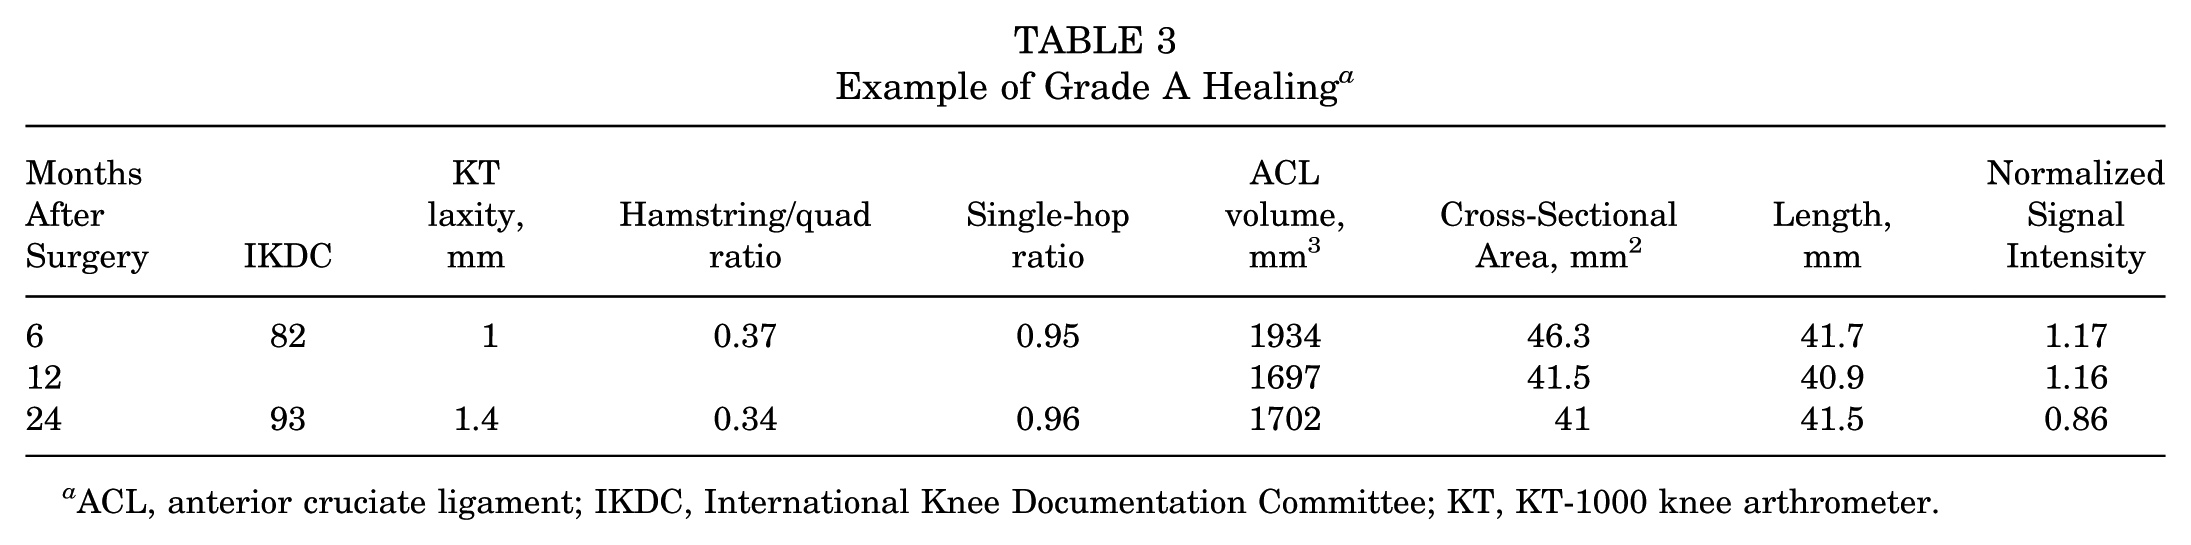
ACL, anterior cruciate ligament; IKDC, International Knee Documentation Committee; KT, KT-1000 knee arthrometer.
Grade B MR Result (Intact fibers with signal intensity around the median of patients). Figure 4 shows an example of a Grade B healing trajectory in a 17-year-old male patient near the median 24-month signal intensity. Table 4 shows this patient's quantitative healing markers. At 6 months after surgery, the healing ACL had multiple intact fibers coursing from the femoral to the tibial attachment. However, there was increased fluid signal intensity around the ACL and extending into Hoffa's fat pad (Grade C; heterogeneous, slightly increased signal, moderate curvature). At 12 months, the ACL continued to have intact fibers (Grade B; slight heterogeneity and increased signal) throughout and slightly decreased fluid signal. At 24 months, the ACL still had continuous, intact fibers.
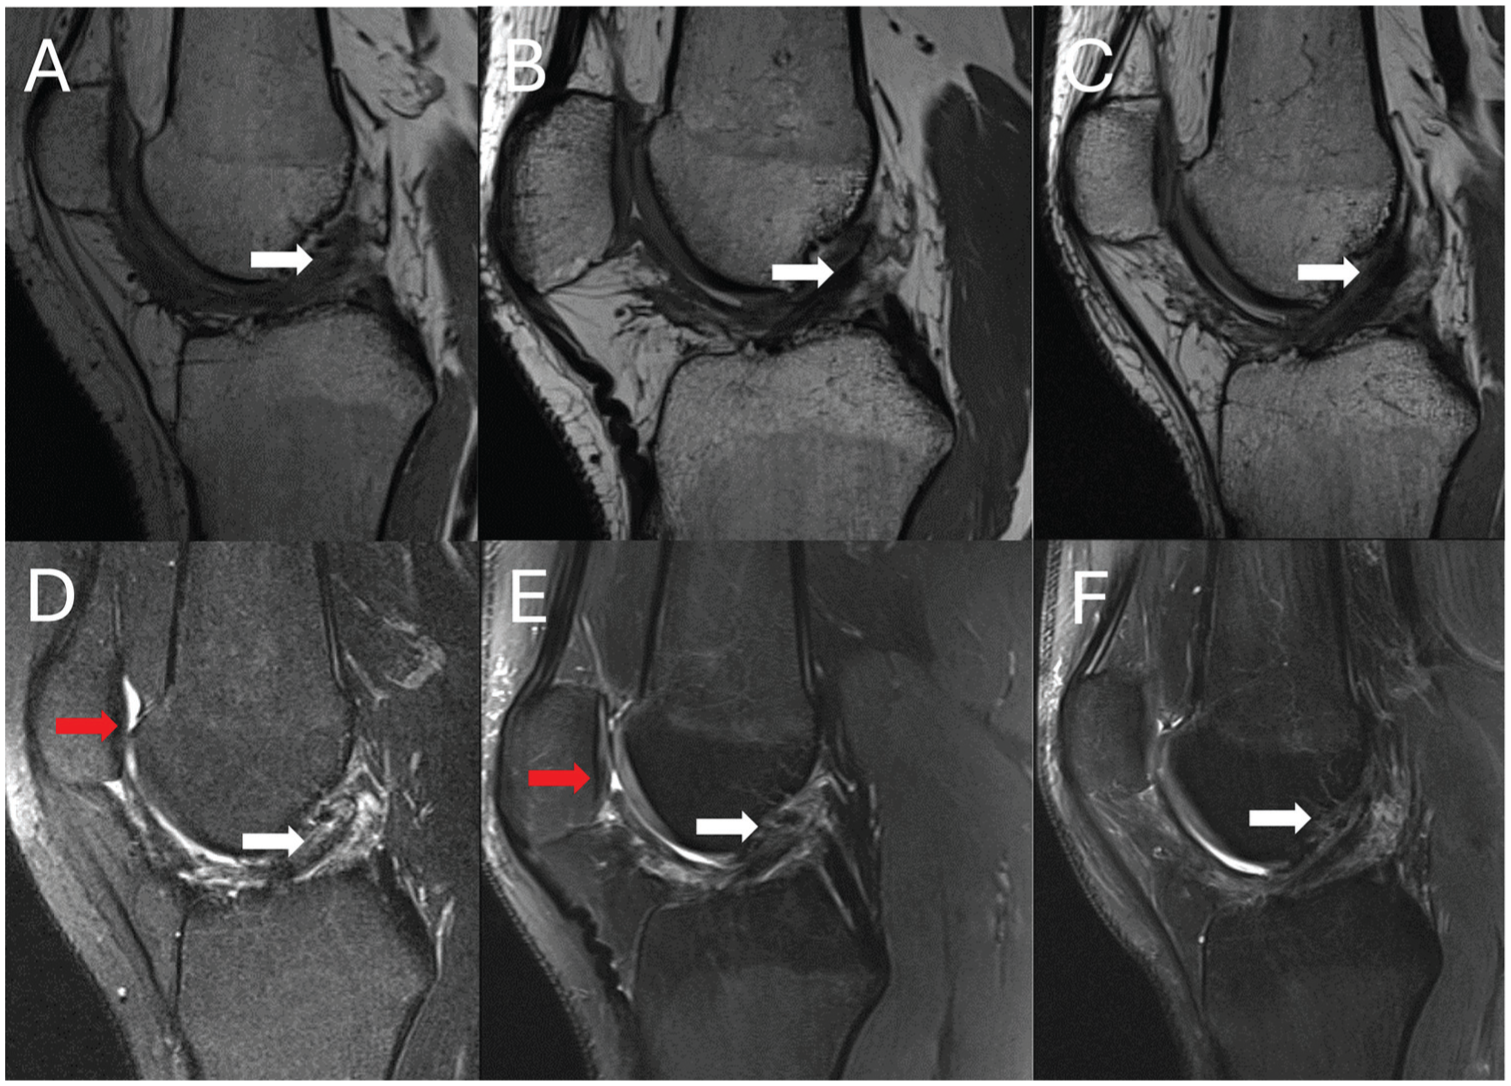
Six-, 12-, and 24-month postoperative images of a patient who underwent ACL restoration—(A-C) top panels: sagittal PD MRI, (D-F) bottom panels: sagittal T2 MRI—demonstrating average healing. Low-signal intact fibers are seen throughout all time points, including a near-normal ACL appearance at 24 months (white arrows). There is increased fluid signal intensity extending into Hoffa's fat pad (red arrows), indicating associated edema, which improved over time. ACL, anterior cruciate ligament; MRI, magnetic resonance imaging; PD, proton density weighted.
Example of Grade B Healing a

ACL, anterior cruciate ligament; IKDC, International Knee Documentation Committee; KT, KT-1000 knee arthrometer.
Grade C MR Result (Intact fibers with SI in the bottom quartile of healers). Figure 5 shows an example of a Grade C healing trajectory in an 18-year-old female patient in the bottom quartile of healers (ie, highest signal intensity). Table 5 shows this patient's quantitative healing markers. At 6 months after surgery, intact fibers from the femoral to tibial attachment were present, with moderate edema within Hoffa's fat pad; however, the fibers had high signal intensity (Grade C; increased signal intensity, heterogeneity, curvature). At 12 months, there was moderate fluid signal intensity around and within the ACL (Grade C; increased signal intensity, heterogeneity, curvature), slightly decreased from before. At 24 months, the ACL appearance was slightly improved (Grade C; increased heterogeneity and signal intensity); however, the patient's clinical status did not change much during follow-up.

Six-, 12-, and 24-month postoperative images of a patient who underwent ACL restoration—(A-C) top panels: sagittal PD MRI, (D-F) bottom panels: sagittal T2 MRI—demonstrating below-average healing. Despite associated edema extending into Hoffa's fat pad throughout (red arrows), the ACL has interval improvement with intact fibers from the femoral to tibial attachments (white arrows). ACL, anterior cruciate ligament; MRI, magnetic resonance imaging; PD, proton density weighted.
Example of Grade C Healing a

ACL, anterior cruciate ligament; IKDC, International Knee Documentation Committee; KT, KT-1000 knee arthrometer.
Revision After Secondary Injury. The previous cases describe variations in the restoration of low-signal fibers coursing between the femur and tibia in patients with acceptable clinical status. Figure 6 shows an example of a 16-year-old male patient who also had intact fibers seen in the region of the ACL at 6 months after surgery, but 1 month later experienced a noncontact injury when changing direction during football. Table 6 shows this patient's quantitative healing markers. At 6 months after surgery, ACL fibers were observed coursing from the femur to the tibia, with moderately increased fluid signal (Grade C; heterogeneous, slightly increased signal, moderate curvature). The ligament was less mature compared with the contralateral ligament (ACL volume: 3008 mm3; mean cross-sectional area: 66.8 mm2; length: 44.91 mm; and normalized signal intensity: 0.89).
Six-, 9-, and 12-month postoperative images of a patient who underwent ACL restoration and experienced a tear after a normal healing trajectory—(A-C) top panels: sagittal PD MRI, (D-F) bottom panels: sagittal T2 MRI. (A, D) Intact fibers are seen at 6 months, but (B, E) after an injurious event, there is greater signal heterogeneity, and intact fibers cannot be followed from the femoral to tibial attachments (white arrows). (C, F) At 12 months, the ACL had a notably more horizontal appearance than expected. ACL, anterior cruciate ligament; MRI, magnetic resonance imaging; PD, proton density weighted.
Example of Patient Experiencing Secondary Injury a

ACL, anterior cruciate ligament; IKDC, International Knee Documentation Committee; KT, KT-1000 knee arthrometer.
At 7 months, however, the patient experienced a buckling event while cutting during football. On MRI at 9 months, no intact fibers were identified, and the ligament appeared more horizontal than on the 6-month images (Grade D; no intact fibers). At 12 months, the ACL continued to have a more horizontal course, and low-signal-intensity ACL fibers could not be followed to the distal femur. The patient elected to undergo revision ACLR after 12 months.
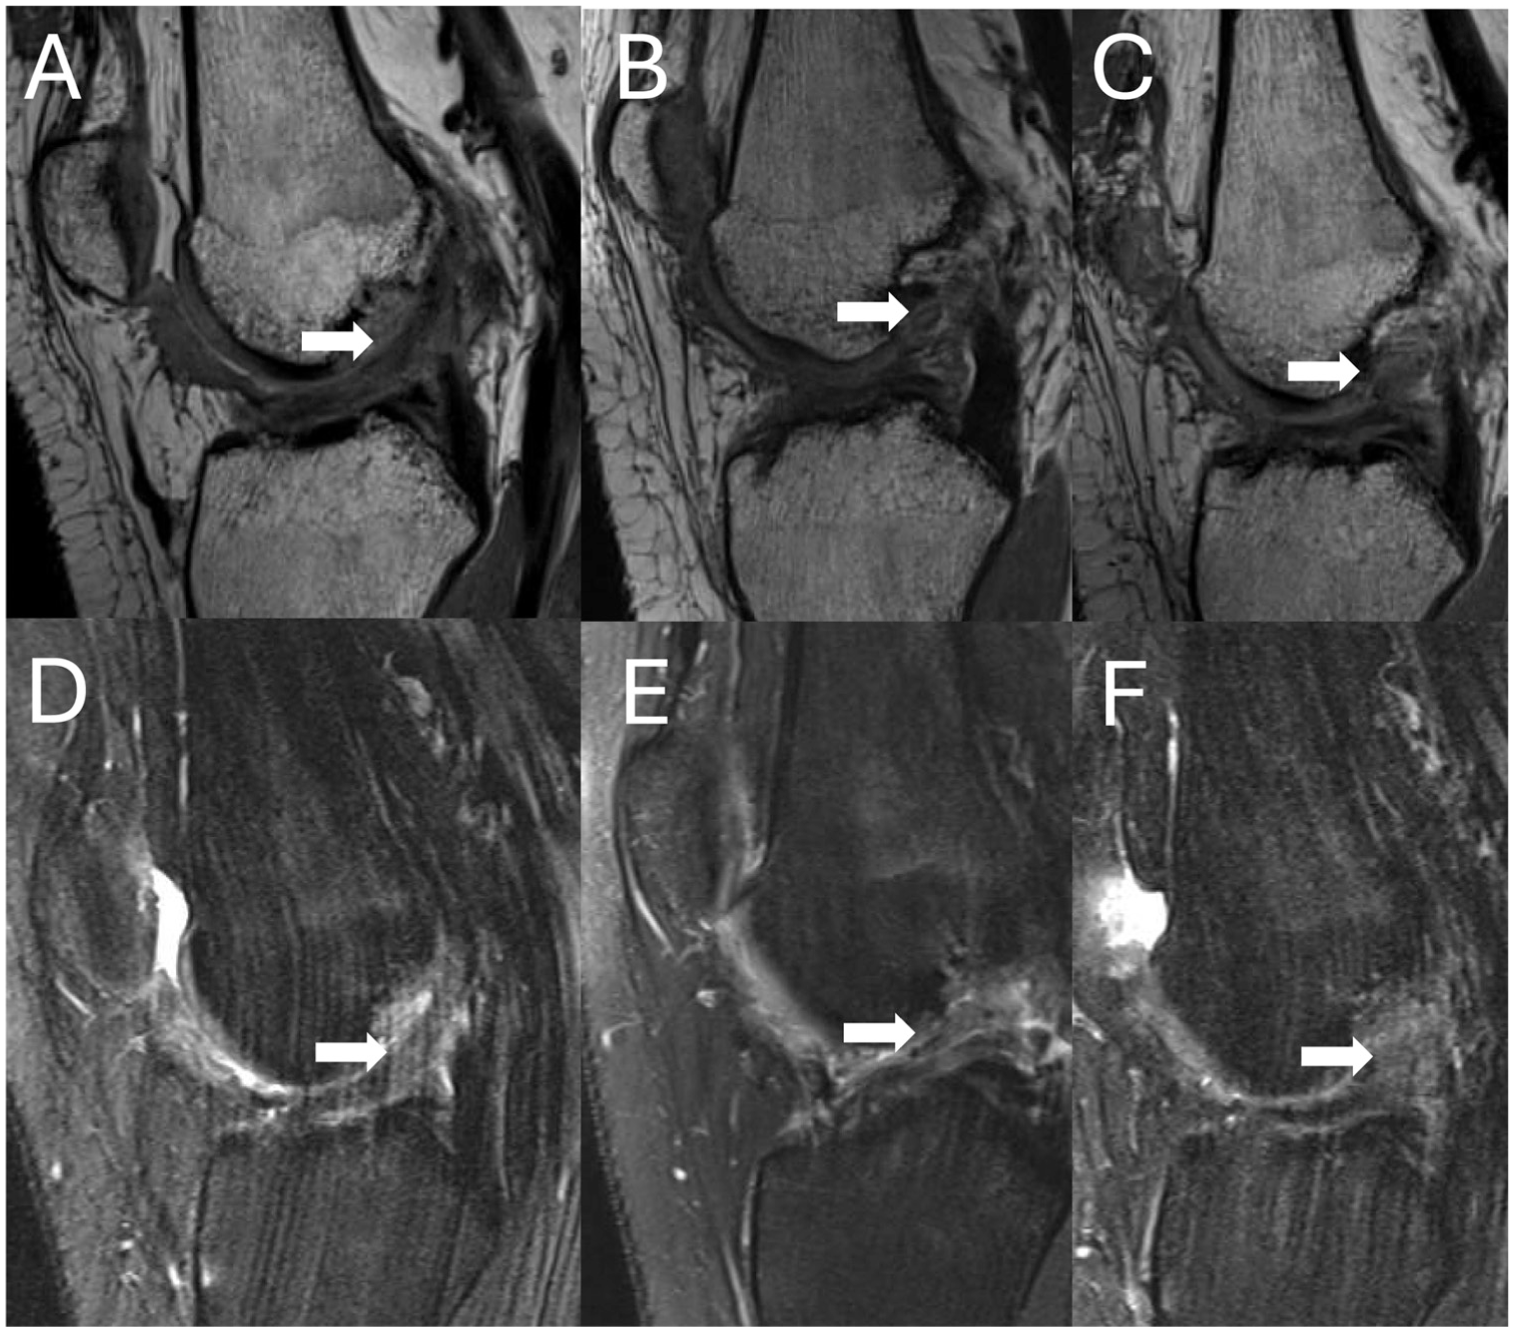
Subsequent treatment with ACLR Due to Insufficient Healing. Figure 7 shows a case of a 16-year-old male patient in whom the ACL restoration procedure failed to result in low signal intensity fibers coursing from the femur to the tibia. Table 7 shows this patient's quantitative healing markers. At 6 months after surgery, the femoral and tibial tunnels were well aligned, but no discrete, intact, low signal ACL fibers were evident (Grade D; no intact fibers). There was heterogeneous tissue with overall increased fluid signal intensity in the intercondylar notch, consistent with disorganized tissue. At 12 months, the patient had a valgus contact injury while playing football and presented with signs of instability. A postinjury MRI showed discontinuity of the tissue in the region of the ACL (ACL volume: 1792 mm3; mean cross-sectional area: 44.6 mm2; length: 40.2 mm; and normalized signal intensity: 1.06). At 14 months, no ACL fibers were evident, and increased fibrosis was observed (Grade D; no intact fibers). The patient subsequently underwent ACLR.

Six-, 12-, and 14-month postoperative images of a patient who underwent ACL restoration and demonstrated poor healing—(A-C) top panel: sagittal PD MRI, (D-F) bottom panels: sagittal T2 MRI. There is increased fluid signal intensity noted in the intercondylar notch, indicating fibrosis, and no intact ACL fibers can be followed from the femoral to tibial attachments (white arrows). ACL, anterior cruciate ligament; MRI, magnetic resonance imaging; PD, proton density weighted.
Example of Patient with Insufficient Healing a

ACL, anterior cruciate ligament; IKDC, International Knee Documentation Committee; KT, KT-1000 knee arthrometer.
Early Injury with Appropriate Healing. While the previous 2 patients required a second surgery with ACLR after a secondary injury, some patients were able to recover from an injury sustained during the postoperative course. Figure 8 shows an 18-year-old male patient who sustained a second injury after surgery and healed appropriately without further surgery. Table 8 shows this patient's quantitative healing markers. At 6 months, continuous fibers with some signal heterogeneities were observed (Grade B; slight heterogeneity and increased signal). At 12 months, continuous, heterogeneous fibers were still observed (Grade B; signal heterogeneity), indicating a slower restoration of low-intensity tissue in the ACL region.

Six-, 12-, 15-, and 24-month postoperative images of a patient who underwent ACL restoration, who demonstrated recovery after an injury during month 15—(A-D) top panels: sagittal PD MRI, (E-H) bottom panels: sagittal T2 MRI. (B, F) The normal appearance in the 12-month images (white arrows) is lost after (C, G) the injurious event (red arrows). (D, H) However, normal appearing fibers are observed at 24 months. PD: proton density weighted.
Example of Appropriate Healing after Early Injury a
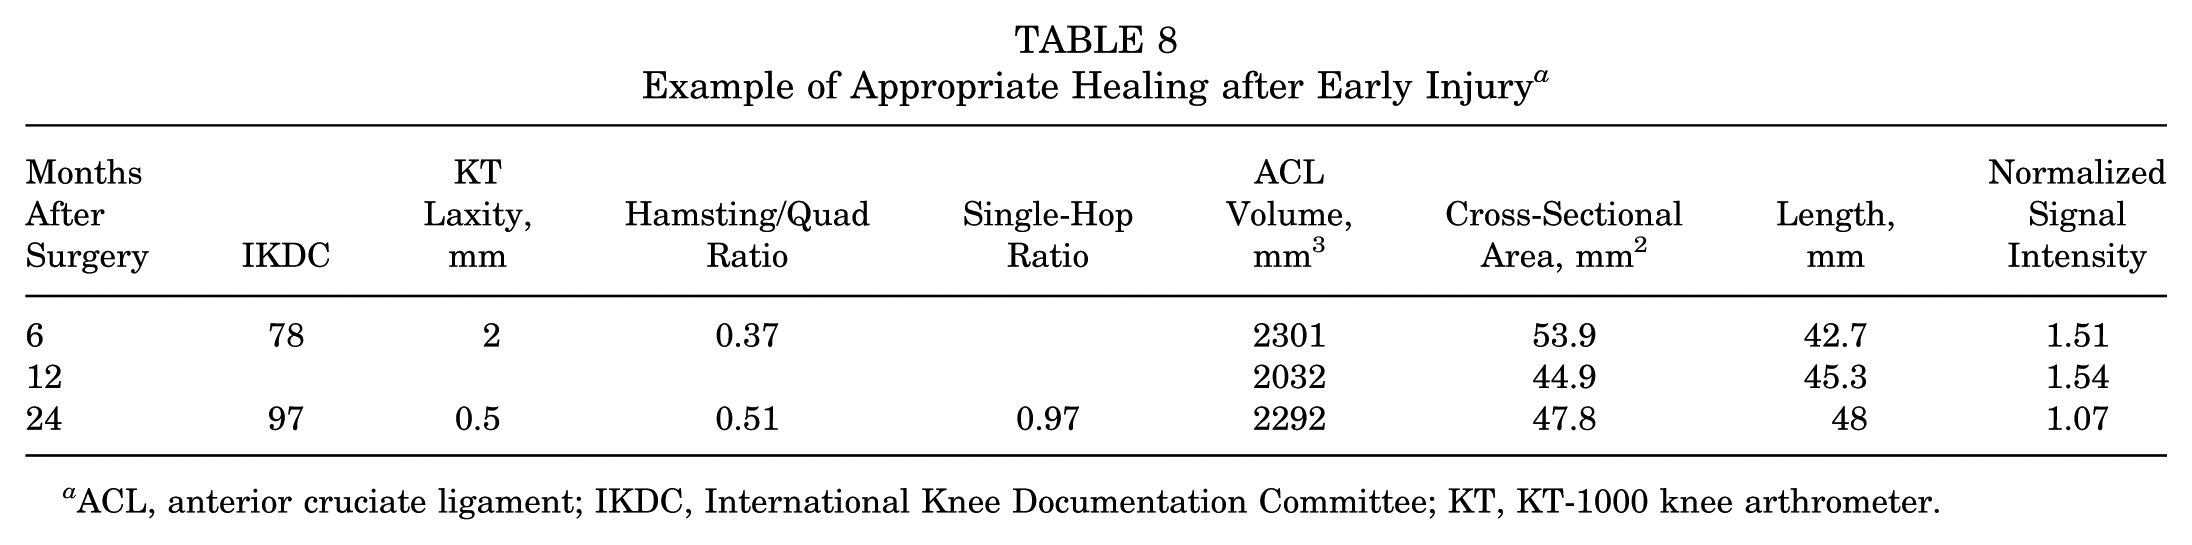
ACL, anterior cruciate ligament; IKDC, International Knee Documentation Committee; KT, KT-1000 knee arthrometer.
However, the patient had an injurious event at 15 months. MRI at this time showed increased signal intensity and disruption of the normal appearance, with few intact fibers (Grade C; increased signal intensity, heterogeneity, abnormal orientation), suggestive of a sprain. The patient did not want to proceed with additional surgery at this time and continued to improve with physical therapy. At 24 months, the patient had continued to improve clinically without the need for revision surgery.
Lack of Femoral Stump Integration
Figure 9 shows a case of a 17-year-old female with a below-average healing trajectory (ie, highest signal intensity). Her 24-month MRI scans are highlighted to show an important scenario in which the healing ACL fails to bridge into the femoral stump (either naturally or due to subsequent injury), yet there is healing at the site of the femoral tunnel (Grade C; increased signal intensity, heterogeneity, inappropriate integration). On the femoral side, the restored ACL typically grows into the femoral tunnel and the femoral stump, with tissue in between the two strands. In this patient, the two attachment sites remained separate (ACL volume: 1835 mm3; average cross-sectional area: 43.9 mm2; length: 41.8 mm; normalized signal intensity: 1.07). This patient improved clinically and did not require revision surgery during follow-up (IKDC: 72.4; side-to-side difference in KT laxity: 1.7 mm; hamstrings-to-quadriceps ratio: 0.44; single-hop ratio: 0.96).

Twenty-four–month postoperative images of a patient who underwent ACL restoration and demonstrated a lack of femoral stump integration—(A) left panel: sagittal PD MRI, (B) right panel: sagittal T2 MRI. There is a clear separation (yellow arrows) between the ACL tissue connecting the tibia to the femoral tunnel (white arrows) and the ACL fibers coming from the native femoral insertion (red arrows). Despite the appearance of 2 separate strands, the patient did well clinically and did not require revision. ACL, anterior cruciate ligament; MRI, magnetic resonance imaging; PD, proton density weighted.
Discussion
The findings of the present study suggest that ACLs treated with ACL restoration surgery undergo significant remodeling within the first 2 years after surgery. In general, the healing ACL becomes smaller cross-sectionally but remains 15% larger than the contralateral ACL at 24 months postoperatively and becomes more organized (lower normalized signal intensity, 10% lower than the contralateral ACL at 24 months). Despite the changes in the healing ACL size and structural properties, the sagittal orientation remains unchanged and comparable with the contralateral native ACL, even in the presence of nonanatomic tunnel positions for the supporting sutures. Most importantly, contrary to our hypothesis, we observed notable variations in the healing response, directly captured on postoperative MRIs, with significant implications for postoperative care, including rehabilitation and clearance for RTS/activities.
In this study, the healing ACL signal intensity significantly decreased over time to levels below those of the contralateral native ACL at 24 months postoperatively, suggesting an active healing process after ACL restoration. These findings reflect previous histological analyses showing active remodeling in hamstring grafts, with irregular collagen orientation up to 12 months postoperatively, which subsequently remodel to better recreate the histology of the native ACL. 24 In their study, Lutz et al 27 found that signal intensity in hamstring tendon grafts peaked around 6 months, then progressively decreased toward the signal of the native ACL between 12 and 24 months postoperatively. Similarly, Ntoulia et al 31 used contrast-enhanced MRIs between 3 days and 24 months postoperatively to show that the amount of revascularization in and around healing hamstring and bone-patellar-tendon-bone ACL grafts influenced graft appearance on MRI and the associated signal intensity, which decreased over the follow-up period. The authors also reported a progressive decrease in the graft's cross-sectional area over the 2-year follow-up period, which was location-dependent and larger intra-articularly than intraosseously. The authors proposed that the intra-articular environment fosters the development of a peripheral hypervascular envelope to support healing of the reconstructed graft, which gradually decreases as it matures. 31 Similarly, the present study demonstrated that the healing ACL mean cross-sectional area decreased over time but remained significantly larger than the contralateral native ACL at all time points. While there is a growing body of literature supporting the notion that signal intensity and graft cross-sectional area decrease in the 24 months after ACL surgery,25-27,31 the ramifications of these findings, or lack thereof, are unclear. Some authors have found that graft signal intensity after ACL surgery is correlated with clinical, functional, and patient-reported outcomes,7,36 while other studies report the contrary.11,21,27 Additionally, further studies demonstrate variation in signal intensity measurements and changes based on graft type,1,32 graft source, 32 fixation method, 12 and concomitant procedures. 37 These conflicting results could be due to the different imaging sequences that have been used. Future large cohort studies are needed to better characterize these observations and understand patient-specific healing patterns after ACL surgery.
The present study details an array of healing trajectories, including patients stratified by signal intensity and patients with atypical postoperative courses. In general, one would expect a high-intensity, heterogeneous ligament (Grade B or C) to trend toward a low-intensity, homogeneous ligament (Grade A) over the course of healing. However, the present study suggests that some patients may either heal at different rates or that some patients may definitively heal with less mature-appearing grafts. As MRI evaluation is uncommon in monitoring healing after ACL surgery, qualitative data are generally scarce. Historically, the Howell classification21,22 has been used to describe the appearance of an ACL graft on MRI, where a Grade 1 signal is used to describe a homogeneous, low intensity graft resembling the posterior cruciate ligament, Grade 2 for at least 50% normal ligament signal with some edematous areas, Grade 3 for <50% normal ligament signal, and Grade 4 for a completely edematous graft with no normal-looking strands. In their original study, Howell et al 21 found that signal changes were not observed in all patients, with 2 of their 21 patients not demonstrating changes in graft appearance over the first 48 weeks postoperatively. The present study highlights a patient who had a Grade C ACL at final follow-up after ACL restoration, with appropriate clinical improvement and function. These findings support observations from clinical and histological studies that recovery after ACL surgery is nonlinear; some ligaments become highly organized and mature by 2 years, while others persist as a mixture of organized and unorganized fibers. More recently, the ACLOAS 38 score has been proposed to comprehensively evaluate the knee after ACL injury. Studies incorporating this method, such as that by Filbay et al, 13 showed marked variation in ACL appearance after nonoperative management, which was seemingly affected by rupture characteristics. This variation in qualitative assessments of patients with similar, appropriate outcomes after ACL restoration surgery highlights the need for personalized assessment and postoperative care after surgery.
In a qualitative assessment of the ACL after ACL restoration, it is important to note that the ACL restoration femoral footprint differs from that in ACLR, as the ACL heals into the femoral insertion (femoral stump). In most cases, these 2 separate strands integrate, forming a healed ACL more similar in appearance to the native ACL. 25 The present study portrays an example of this phenomenon, where the healing ACL failed to bridge into the femoral stump, leaving 2 separate yet seemingly functional (based on clinical examination and IKDC score) strands. As such, the presence of continuous fibers bridging from the tibial stump to the femoral insertion was sufficient to provide clinical benefit for this patient and should be a primary focus when assessing ligamentous integrity after ACL restoration. In their work, Filbay et al 13 observed that 6 of the 8 Grade 3 ACLs were either attached to the lateral wall (n = 3) or to the lateral wall and the posterior cruciate ligament (n = 3), with unclear effects on function, stability, or rerupture. 13 Overall, their conclusions are similar to those of the present study, in that fiber continuity is likely associated with improved knee function. This notion is further supported by the patients in this series who sustained an ACL injury after ACL restoration. The 2 patients who required surgery for symptomatic instability had Grade C/D MRI findings before their injury, and absent fiber continuity after injury. In contrast, the patient who healed without revision surgery had Grade B findings preinjury and sustained an incomplete (Grade C) injury that went on to heal completely. Future studies assessing the long-term clinical and functional effects of incomplete femoral stump integration would be beneficial, as would further analyses of the potential to heal ACL injuries sustained after ACL restoration surgery.
Limitations
This study is not without limitations. Primarily, this is a small case series aimed at providing a qualitative analysis of MRI findings in patients after ACL restoration surgery with an extracellular matrix scaffold. As a result, it is difficult to capture the full extent of variation in healing patterns among patients after this procedure. While we sought to improve the generalizability of this analysis by randomly selecting MRIs of ACLs within ACL signal-intensity quartiles, it is possible that some abnormal healing patterns were missed. Additionally, the qualitative nature of this study limits the ability to establish causal relationships or identify significant trends in healing across different patient cohorts. Accordingly, a more robust quantitative analysis of MRI findings after ACL restoration is of future interest to identify which factors, if any, alter the postsurgical healing process.
Conclusion
The present study demonstrates that throughout 2 years of serial imaging after an ACL restoration procedure, the healing ACL becomes smaller cross-sectionally and more organized (lower normalized SI). Despite changes in the ACL size and ACL SI, the sagittal orientation remains unchanged and comparable with the contralateral native ACL. In the qualitative analysis, 7 distinct healing trajectories were identified. These data are important for interpreting postoperative imaging after nonreconstruction ACL procedures, and for identifying that several healing trajectories exist after a restoration procedure. Further studies are warranted to identify patient-specific factors that may influence these trajectories.
Footnotes
Appendix
Final revision submitted February 19, 2026; accepted March 14, 2026.
One or more of the authors has declared the following potential conflict of interest or source of funding: This study received funding support from the Translational Research Program at Boston Children's Hospital, the Children's Hospital Orthopaedic Surgery Foundation, the Children's Hospital Sports Medicine Foundation, the National Institutes of Health, and the National Institute of Arthritis and Musculoskeletal and Skin Diseases through grant numbers R01-AR065462, R01-AR056834 and P30-AR066261. This research was also conducted with support from the Football Players’ Health Study at Harvard University. The Football Players’ Health Study is funded by a grant from the National Football League Players Association. The content is solely the responsibility of the authors and does not necessarily represent the official views of Harvard Medical School, Harvard University, or its affiliated academic health care centers, the National Football League Players Association, Boston Children's Hospital, or the National Institutes of Health.
M.M.M. is a founder, paid consultant, and equity holder in Miach Orthopaedics, Inc, which was formed to work on upscaling production of the BEAR scaffold. M.M.M. maintained a conflict-of-interest management plan that was approved by Boston Children's Hospital and Harvard Medical School during the conduct of the trial, with oversight by both conflict-of-interest committees and the institutional review board of Boston Children's Hospital, as well as the United States Food and Drug Administration. B.C.F. is an assistant editor for The American Journal of Sports Medicine and the spouse of M.M.M., with the same inherent conflicts. A.M.K. is a paid consultant for Miach Orthopedics, Inc, and maintained a conflict-of-interest management plan that was approved by Boston Children's Hospital and Harvard Medical School during the conduct of the trial, with oversight by both conflict-of-interest committees and the institutional review board of Boston Children's Hospital. D.E.K. is a paid consultant for Miach Orthopaedics and DePuy Synthes and receives education support from Kairos Surgical. Y.M.Y. has received consulting fees from OrthoPediatrics and Smith & Nephew. L.J.M. is an unpaid consultant for Carticel.
Ethical approval for this study was obtained from the Boston Children's Hospital Institutional Review Board (IRB P00021470).