






Abstract
Background:
Graft failure after anterior cruciate ligament (ACL) reconstruction remains a significant clinical challenge, particularly in revision surgery. Increasing biomechanical and clinical evidence suggests that tibial slope morphology influences anterior tibial translation and ACL graft forces, potentially increasing failure risk. While posterior tibial slope has been implicated in graft failure, the relative contributions of medial tibial slope (MTS), lateral tibial slope (LTS), and slope asymmetry remain incompletely defined.
Purpose:
To evaluate the association between tibial slope parameters and the risk of ACL reconstruction failure.
Study Design:
Cohort study; Level of evidence, 3.
Methods:
A retrospective cohort study was conducted at a tertiary academic center in Singapore, including 204 patients who underwent primary (n = 120) or revision (n = 84) ACL reconstruction between 2009 and 2022. Preoperative magnetic resonance imaging (MRI) was used to measure MTS, LTS, and LTS-MTS asymmetry using standardized anatomic landmarks. Demographic, clinical, and intraoperative variables were collected, along with patient-reported outcome measures (PROMs), including the Lysholm Knee Score and Knee injury and Osteoarthritis Outcome Score. Receiver operating characteristic (ROC) curve analysis was performed to determine predictive performance and optimal cutoff values for tibial slope parameters. Multivariable regression analysis was used to identify variables independently associated with revision ACL reconstruction.
Results:
Patients undergoing revision ACL reconstruction demonstrated significantly greater mean LTS (9.73°± 3.49° vs 7.91°± 3.12°; P < .01) and LTS-MTS asymmetry (1.68°± 3.99° vs 0.20°± 4.01°; P = .01) compared with patients undergoing primary reconstruction. No significant difference in MTS was observed between groups (P = .43). ROC analysis showed that LTS (area under the curve [AUC] 0.65; cutoff ≥7.65°) and LTS-MTS asymmetry (AUC 0.61; cutoff ≥1.85°) were significantly associated with the revision ACL reconstruction cohort, whereas MTS was not. Multivariable analysis identified LTS ≥7.65°, LTS-MTS asymmetry ≥1.85°, and concomitant meniscal tears as independently associated with the revision cohort. Higher tibial slope values were associated with lower PROM scores, although these differences were not clinically meaningful.
Conclusion:
This study underscores the importance of evaluating LTS and LTS-MTS asymmetry on MRI in relation to revision ACL reconstruction status. LTS ≥7.65°, LTS-MTS asymmetry ≥1.85°, and concomitant meniscal tears were significantly associated with belonging to the revision group, highlighting the need for careful assessment of tibial morphology and consideration of these parameters during preoperative planning.
Despite generally favorable outcomes after anterior cruciate ligament reconstruction (ACLR), a significant proportion of patients experience graft failure, necessitating revision surgery. Revision ACLR is associated with inferior functional outcomes, increased health care utilization, and prolonged absence from sports. 14
Increasing attention has been directed toward anatomic risk factors, particularly tibial slope morphology, as important determinants of anterior cruciate ligament (ACL) graft integrity. 8 Previous biomechanical and clinical studies have demonstrated that a steeper lateral tibial slope (LTS) increases anterior tibial translation under axial loading, thereby elevating strain on the reconstructed ligament and predisposing it to graft failure.4,22,24 Furthermore, asymmetry between the lateral and medial tibial plateaus (LTS–medial tibial slope [MTS] asymmetry) may promote increased internal femoral rotation during knee flexion, further increasing ACL graft strain and potentially contributing to associated intra-articular pathologies such as meniscal tears. 25
Despite the growing recognition of these associations, clinical evidence remains inconsistent. 36 A key limitation of previous studies is the imaging modality used to assess tibial morphology. Tibial slope has traditionally been measured using plain radiographs, which provide a 2-dimensional estimate that is highly sensitive to patient positioning and beam orientation, limiting the ability to accurately differentiate MTS from LTS. In contrast, magnetic resonance imaging (MRI) allows 3-dimensional, multiplanar assessment of tibial slope and plateau asymmetry. However, MRI-based measurements may be affected by variations in scan orientation, rotational alignment, and limited tibia coverage, which can introduce errors in defining the mechanical tibial axis. 28 The existing literature on MRI-derived tibial slope parameters as risk factors for ACL graft failure remains limited, highlighting the need for further investigation.
Most of the current literature is derived from predominantly White populations, whereas data from Asian cohorts remain scarce. Given accumulating evidence that knee morphology, including tibial plateau geometry and posterior tibial slope (PTS), differs among ethnic populations, caution is warranted when extrapolating these findings to other groups. 18
Therefore, this study aims to evaluate the LTS, MTS, and LTS-MTS asymmetry in an Asian cohort and to examine their relationship with ACLR revision rates and patient-reported clinical outcomes. It would improve our understanding of population-specific tibia morphologic associations on ACL graft failure, which may enhance preoperative risk stratification, guide surgical planning, and provide insight into factors differentiating patients who undergo primary versus revision ACLR. We hypothesize that increased LTS, MTS, and LTS-MTS asymmetry would be associated with revision ACLR.
Methods
Ethical Statement
This study was conducted in accordance with the Declaration of Helsinki and received approval from the Institutional Review Board of the National Health Group Singapore Research Ethical Committee (CIRB: 2022/00650).
Study Design and Patient Selection
This retrospective, single-center study was conducted at the National University Hospital, Singapore. Data were derived from a prospectively maintained institutional database of patients who underwent isolated single-bundle ACLR using hamstring tendon autografts between January 1, 2009, and December 31, 2022. All included patients had a minimum postoperative follow-up of 24 months.
The inclusion criteria in the study are patients aged ≥21 years who had isolated ACL or ACL graft rupture, with available preoperative MRI of the affected knee obtained before either primary or revision ACLR. All included patients had completed a minimum of 24 months of postoperative clinical follow-up.
Exclusion criteria are patients younger than 21 years, presence of concomitant ligamentous injuries requiring surgical intervention, radiographic evidence of knee osteoarthritis (Kellgren-Lawrence grade ≥2), bony deformities affecting the tibial plateau or proximal tibia alignment, history of proximal tibial fracture, or previous corrective osteotomy. Patients were also excluded if preoperative MRI scans demonstrated motion artifacts, metal artifacts, or inadequate visualization of proximal tibial landmarks or if MRI data were unavailable or of insufficient quality for reliable radiologic assessment.
The revision cohort included patients who had undergone index ACLR at either our institution or other institutions within the country.
Patient-Reported Outcome Measures
Patient-reported outcome measures (PROMs), including the Lysholm Knee Score and the Knee injury and Osteoarthritis Outcome Score (KOOS), were administered during the preoperative assessment and at subsequent follow-up visits by trained research assistants using standardized protocols.
Radiologic Assessment
All MRI scans were performed using standardized institutional knee imaging protocols to ensure consistent tibial orientation across patients. Each patient was positioned supine within the MRI scanner using a dedicated knee coil. Axial images were acquired parallel to the tibial joint line, including visualization of the patella and fibular head. Coronal images were obtained parallel to the posterior femoral condyles and extended from the patella to approximately 2 cm posterior to the condyles. Sagittal images were oriented perpendicular to the femoral condyles to allow visualization of the ACL in its entirety on a single slice.
MRI-based cross-sectional imaging enabled precise multiplanar reconstruction, thereby reducing measurement errors related to knee malrotation. 17 However, a recognized limitation of the MRI scan is its restriction to proximal tibial coverage, which limits accurate delineation of the true longitudinal tibial axis and may reduce measurement precision compared with full-length imaging. To mitigate this, all MRI scans included in this study had at least 15 cm of tibial length visible. MRI scans that did not include at least 15 cm of tibial length were excluded from the study.
Medial and lateral PTS measurements were obtained from preoperative MRI scans using the method described by Hashemi et al. 19 The center of the tibial plateau was identified on coronal and axial views. In the central sagittal plane, the longitudinal tibial axis was established by connecting the centers of 2 circles: the proximal circle positioned 5 cm distal to the joint line and the distal circle placed as far distally as possible (Figure 1).
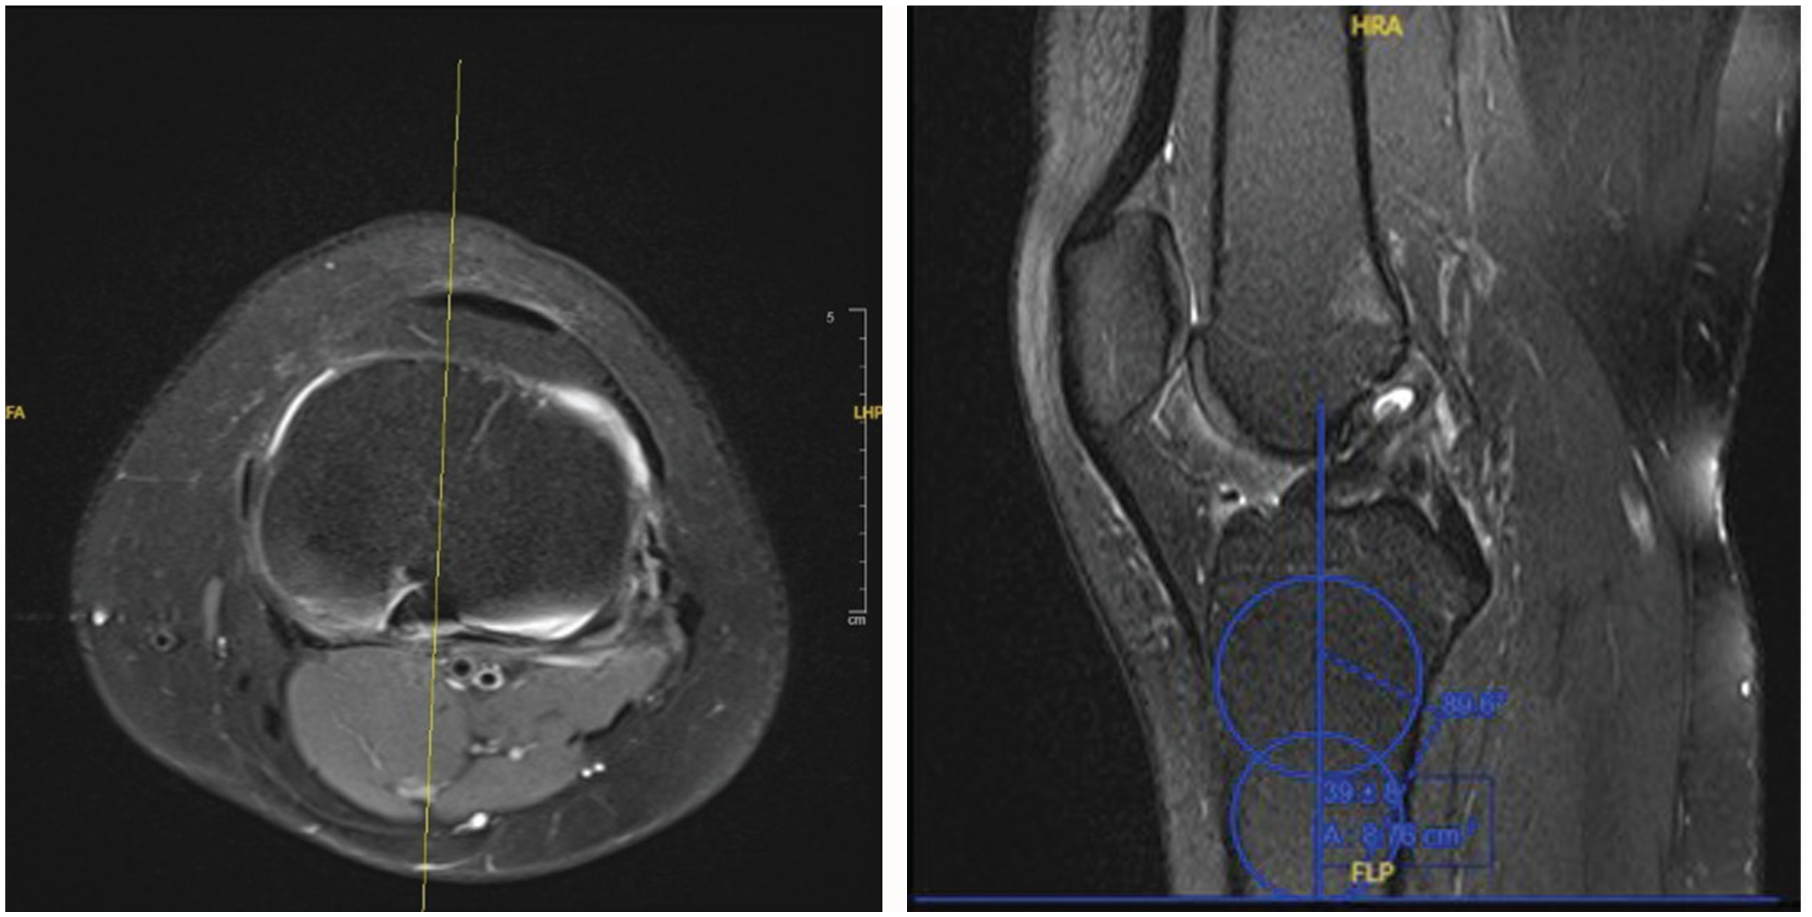
(Left) Center of the tibial plateau in the axial view. (Right) While referencing the axial view, 2 circles were drawn on the corresponding sagittal image. A line intersecting the centers of these circles was defined as the longitudinal axis of the tibia.
This axis was then transposed to the sagittal cut representing the midpoint of the medial tibial plateau (Figure 2A). On the sagittal cut, a tangential line was drawn connecting the most superior points of the anterior and posterior cortices of the medial tibial plateau. The MTS was defined as the angle between this tangential line and a line perpendicular to the longitudinal axis. The LTS was measured using the same method on the corresponding lateral tibia sagittal cut (Figure 2B). LTS-MTS asymmetry was assessed as the difference between LTS and MTS. A positive value indicates that the LTS was steeper than the MTS, and a negative value indicates a steeper MTS.
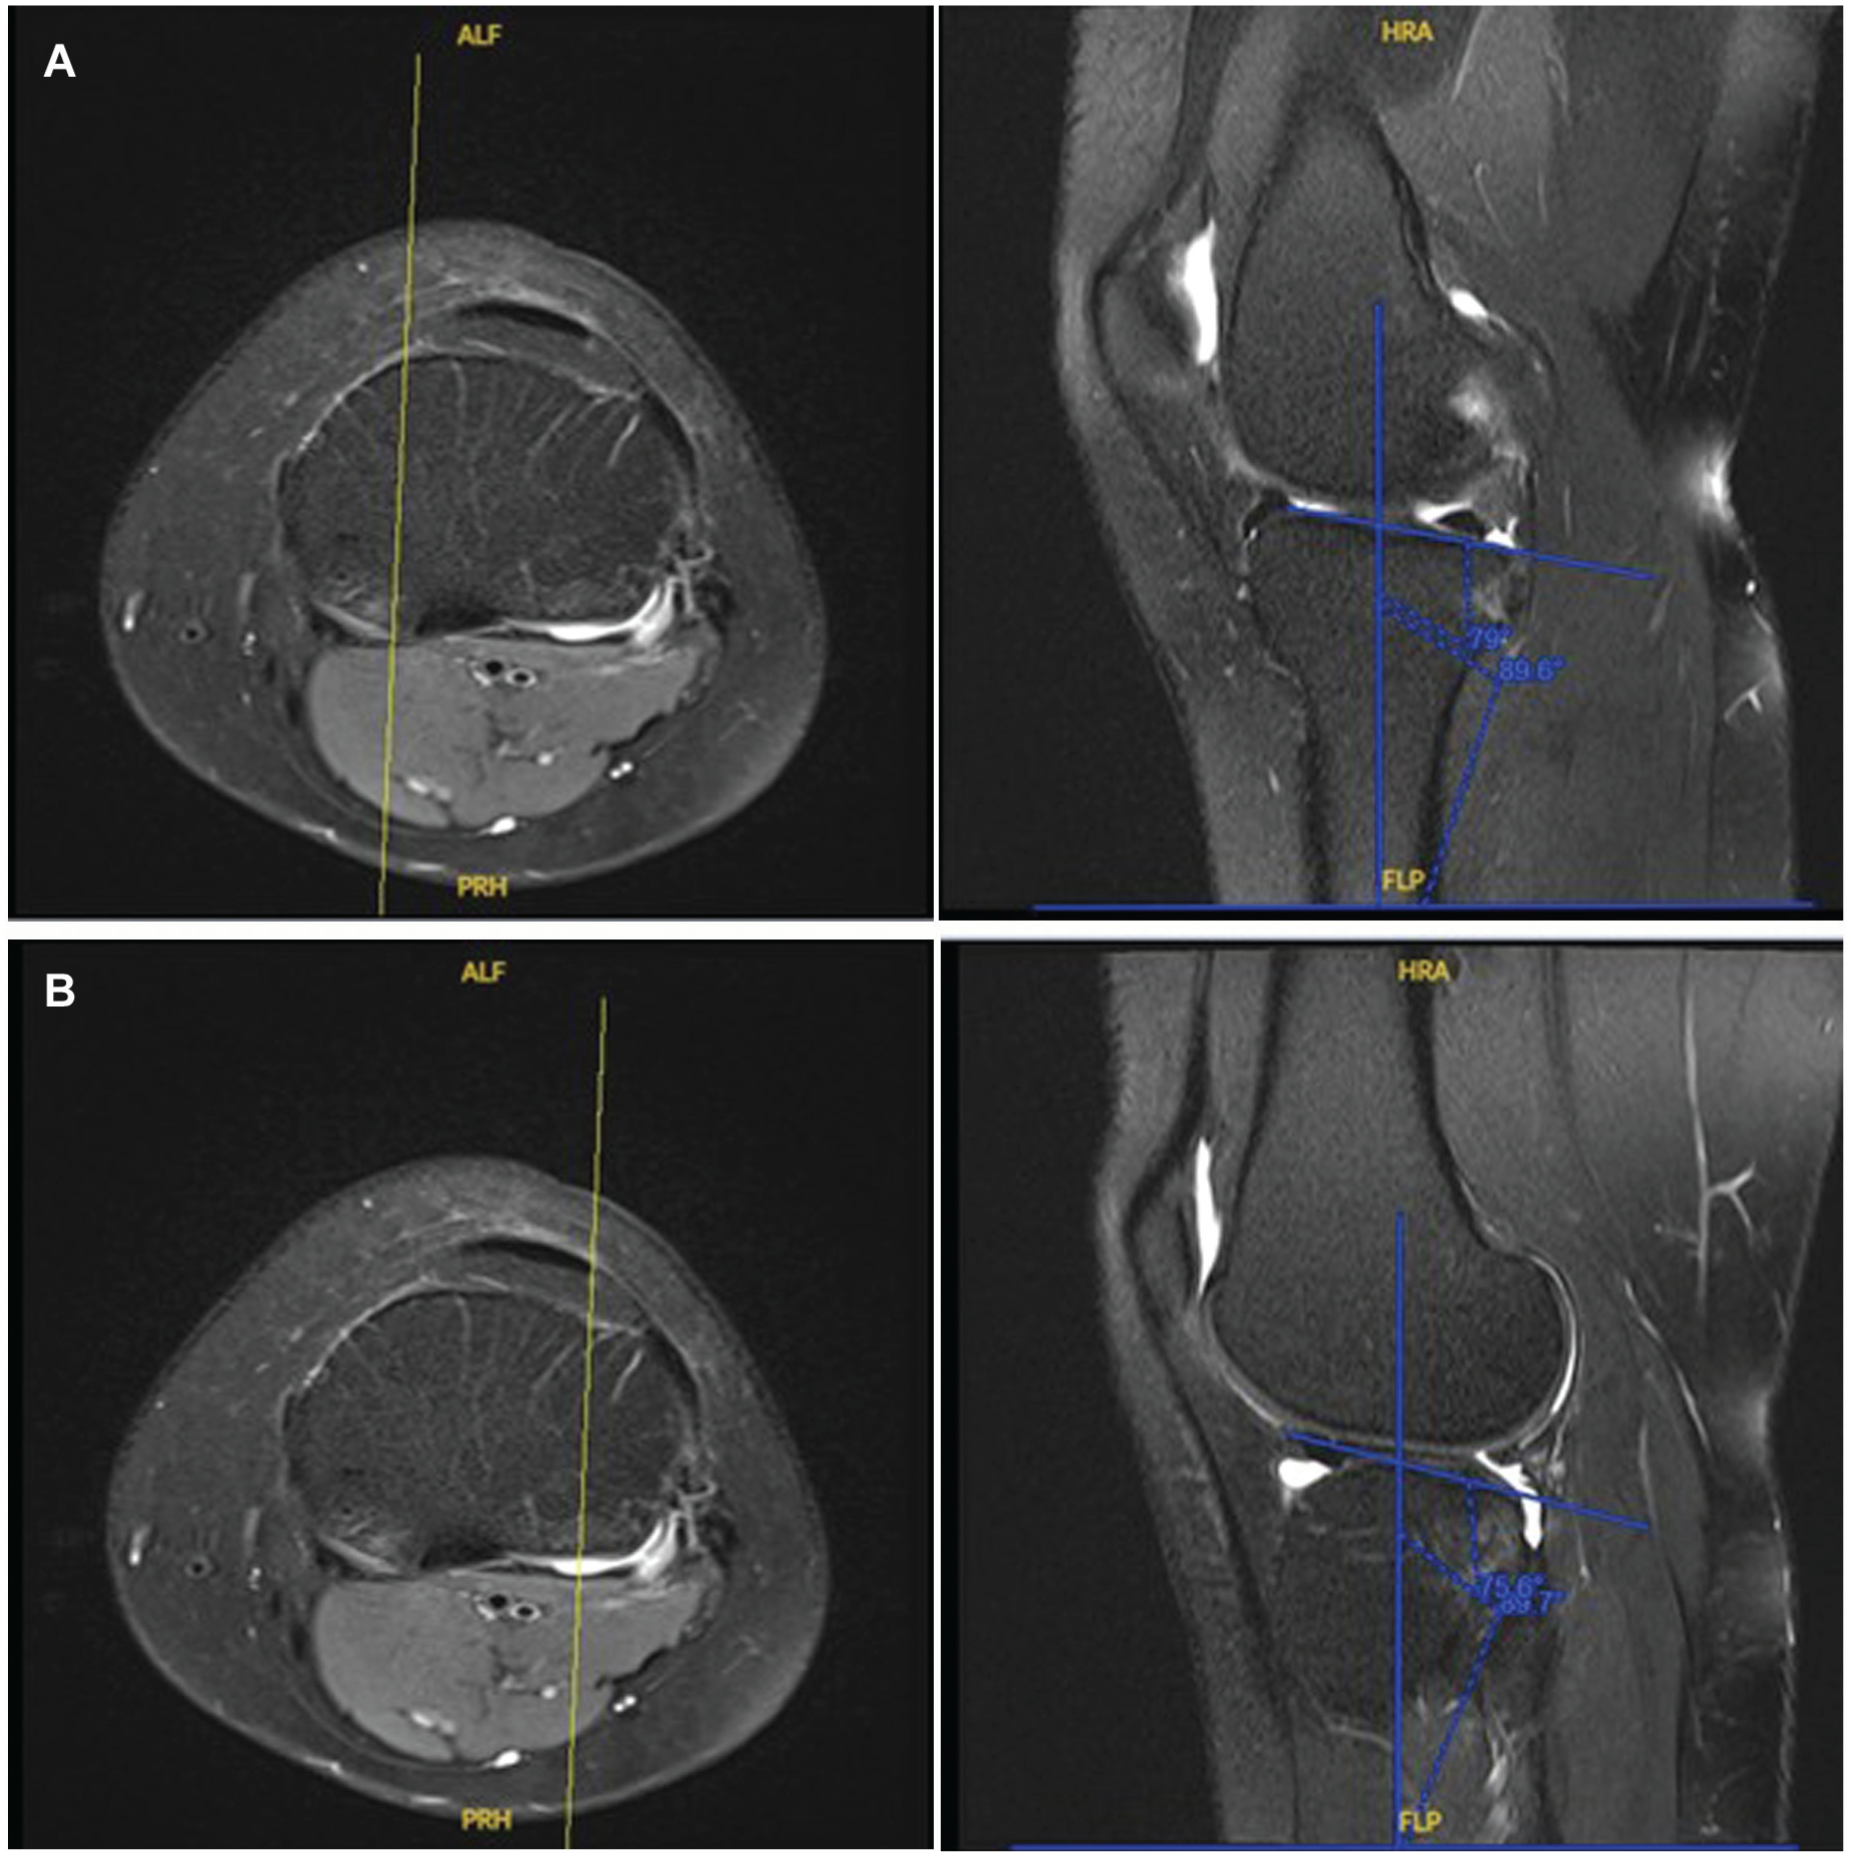
Measurement of the (A) medial tibial plateau and (B) lateral tibial plateau, using a constant axis.
Surgical Techniques and Rehabilitation Procedure
All patients underwent anatomic single-bundle ACLR using autologous hamstring tendon grafts, consisting of either the semitendinosus tendon alone or in combination with the gracilis tendon. Femoral tunnel placement was achieved through an anteromedial portal and positioned anatomically within the native ACL footprint. The tibial tunnel was similarly centered within the ACL tibial footprint and sized according to the graft diameter. Graft fixation was performed at 30° of knee flexion, using an extracortical suspensory fixation device (ACL TightRope; Arthrex) on the femoral side and a biocomposite interference screw (BioComposite FastThread; Arthrex) on the tibial side.
Postoperatively, patients followed a standardized rehabilitation protocol. 11 From 0 to 3 weeks, they were restricted to toe-touch weightbearing (approximately 20% body weight) with knee range of motion limited to 0° to 90° using a hinged knee brace. Between 3 and 6 weeks, partial weightbearing (50% body weight) was permitted while maintaining the same motion limits. After 6 weeks, patients progressed to full weightbearing as tolerated and were allowed unrestricted knee motion. Strengthening exercises were gradually reintroduced beginning at 6 weeks postoperatively.
Statistical Analysis
An a priori power analysis was conducted to detect a 1° difference between tibial slope measurements based on effect sizes reported in previous literature examining PTS differences. With an α level of 0.05 and a β of 0.80, 6 a minimum of 56 patients per group was required to achieve 80% statistical power.
Demographic variables, including age, sex, and ethnicity, were collected from patients’ electronic records. Continuous variables were presented as mean (95% CI), while categorical variables were presented as proportions. Differences in age and follow-up duration were compared using independent t tests, while demographic differences were assessed using chi-square tests. Nonparametric data from related samples, such as radiologic parameters, were analyzed using the Wilcoxon signed-rank test.
Receiver operating characteristic (ROC) curves were constructed to assess the discriminative ability of the radiologic parameters in distinguishing patients who underwent primary ACLR from those who underwent revision surgery. Optimal cutoff values were identified using Youden's index (sensitivity + specificity – 1). The area under the ROC curve (AUC) was used to quantify overall diagnostic performance, representing the ability of each parameter to distinguish between positive and negative cases. An AUC of 0.5 indicates no discriminative ability beyond chance, whereas values approaching 1.0 indicate excellent discrimination. In this study, higher AUC values represent greater accuracy in differentiating between primary and revision ACLR groups.
Bivariate linear regression analyses were performed to evaluate the correlation between patient-reported outcomes and tibial slope parameters (MTS, LTS, and LTS-MTS asymmetry). Pearson correlation coefficient (R) was calculated and classified via the following: perfect (R = ±1), strong (±0.5 ≤R < ±1), medium (±0.3 ≤R < ±0.5), or weak (R < ±0.29). Variables with P < .25 in the univariate analysis were entered into multivariable binary logistic regression models using a forward conditional approach to identify independent parameters associated with revision ACLR.
Subsequently, radiologic parameters demonstrating statistically significant AUC values were entered into binary logistic regression models using the derived diagnostic cutoff values to further evaluate their association with revision ACLR surgery. Due to the high degree of collinearity between the radiologic values, separate regression models were constructed to prevent confounding the regression estimates. All data analysis was performed using IBM SPSS Statistics version 22 (IBM Corp).
Results
Baseline Characteristics
A total of 262 patients were initially identified, of whom 155 underwent primary ACLR surgery and 107 underwent revision surgery. Fifty-eight patients (22%; 35 primary and 23 revision cases) were excluded due to inadequate MRI. The final cohort comprised 204 patients (78%), including 120 primary and 84 revision ACLR cases. No significant differences in demographic characteristics were observed between the primary and the revision groups (Table 1).
Demographic Data of the Study Participants Included a
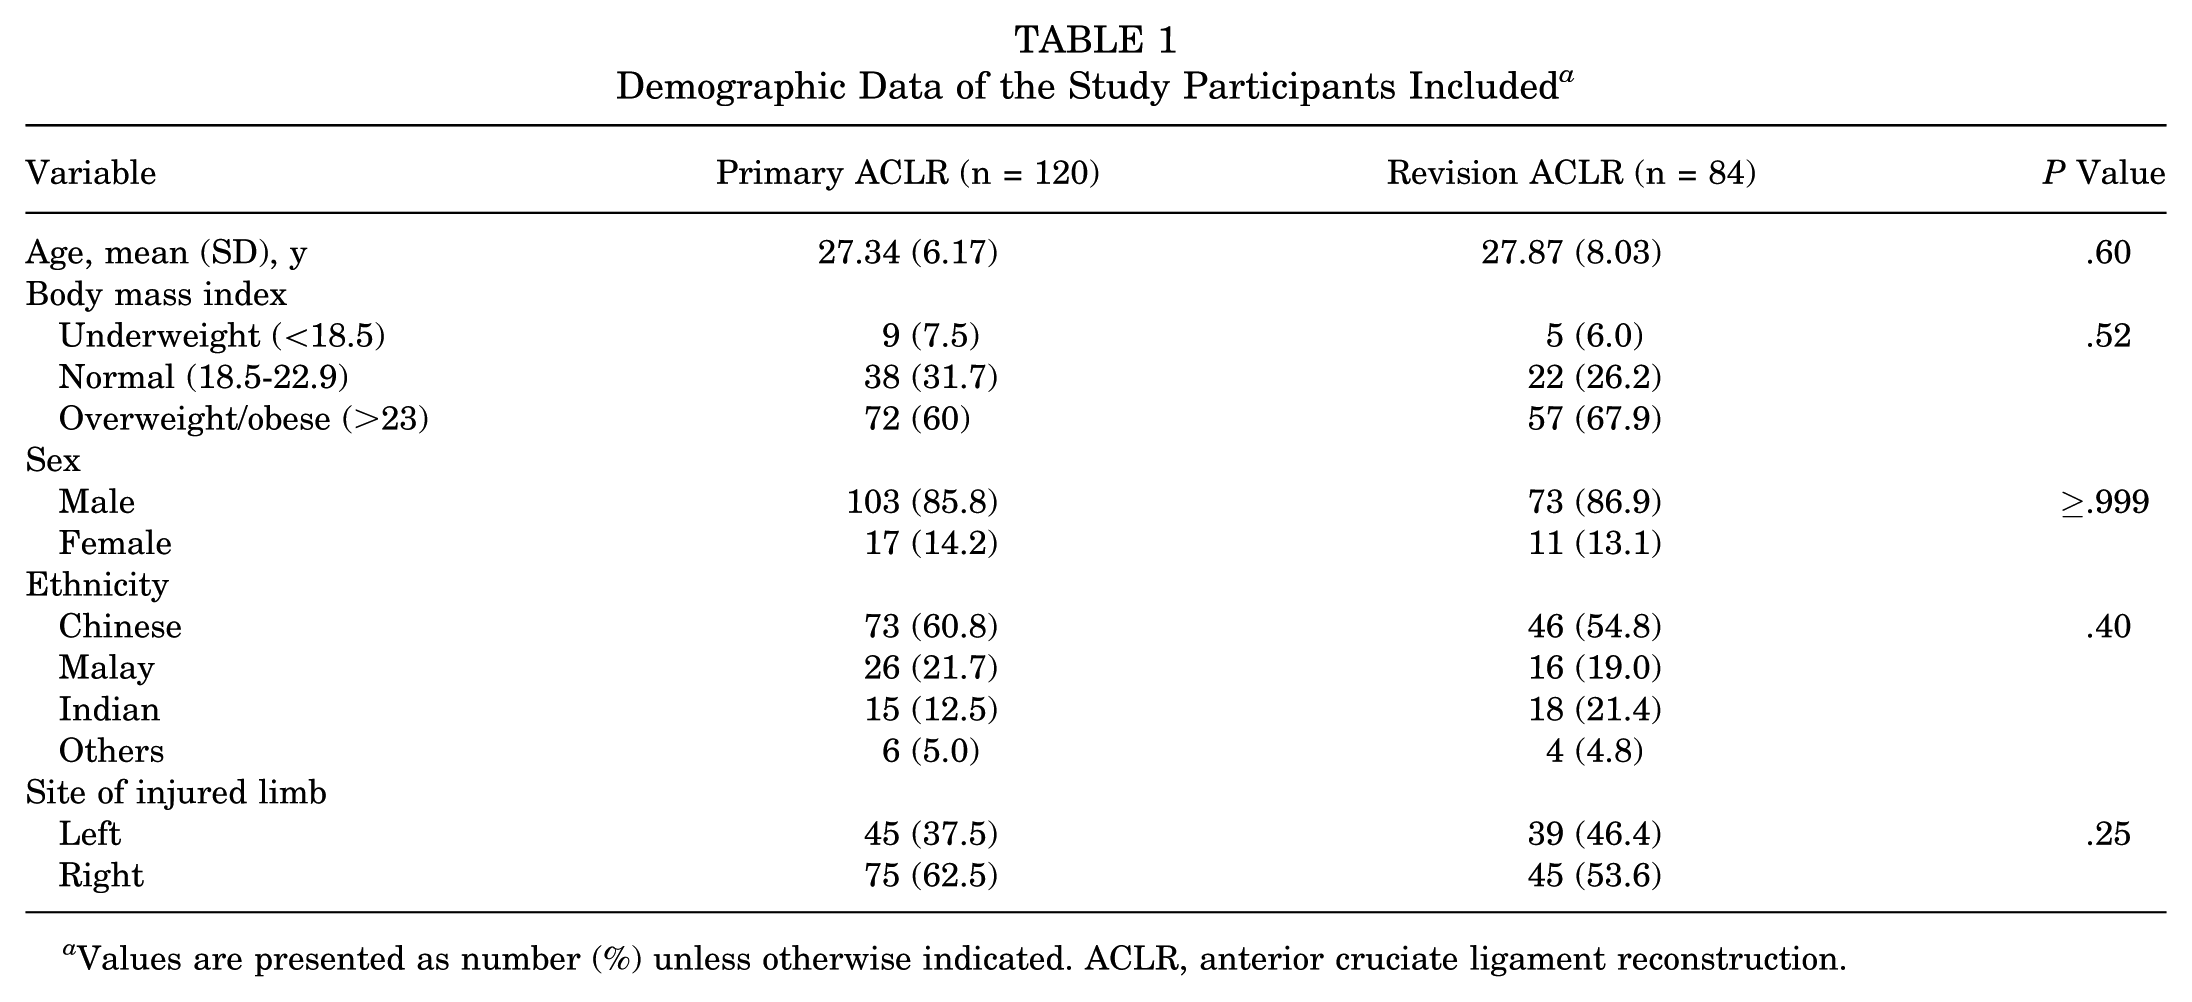
Values are presented as number (%) unless otherwise indicated. ACLR, anterior cruciate ligament reconstruction.
Comparison Between Primary and Revision ACLR Groups
The revision cohort demonstrated a significantly greater mean LTS (9.73°± 3.49° vs 7.91°± 3.12°; P < .01; 95% CI, –2.74 to −0.90) and greater LTS-MTS asymmetry (1.68°± 3.99° vs 0.20°± 4.01°; P = .01; 95% CI, –2.60 to −0.34). The presence of meniscal tears was also significantly higher in the revision group (63.1% vs 29.2%; P < .01) (Table 2).
Anatomic and Clinical Data of the Study Participants Included a
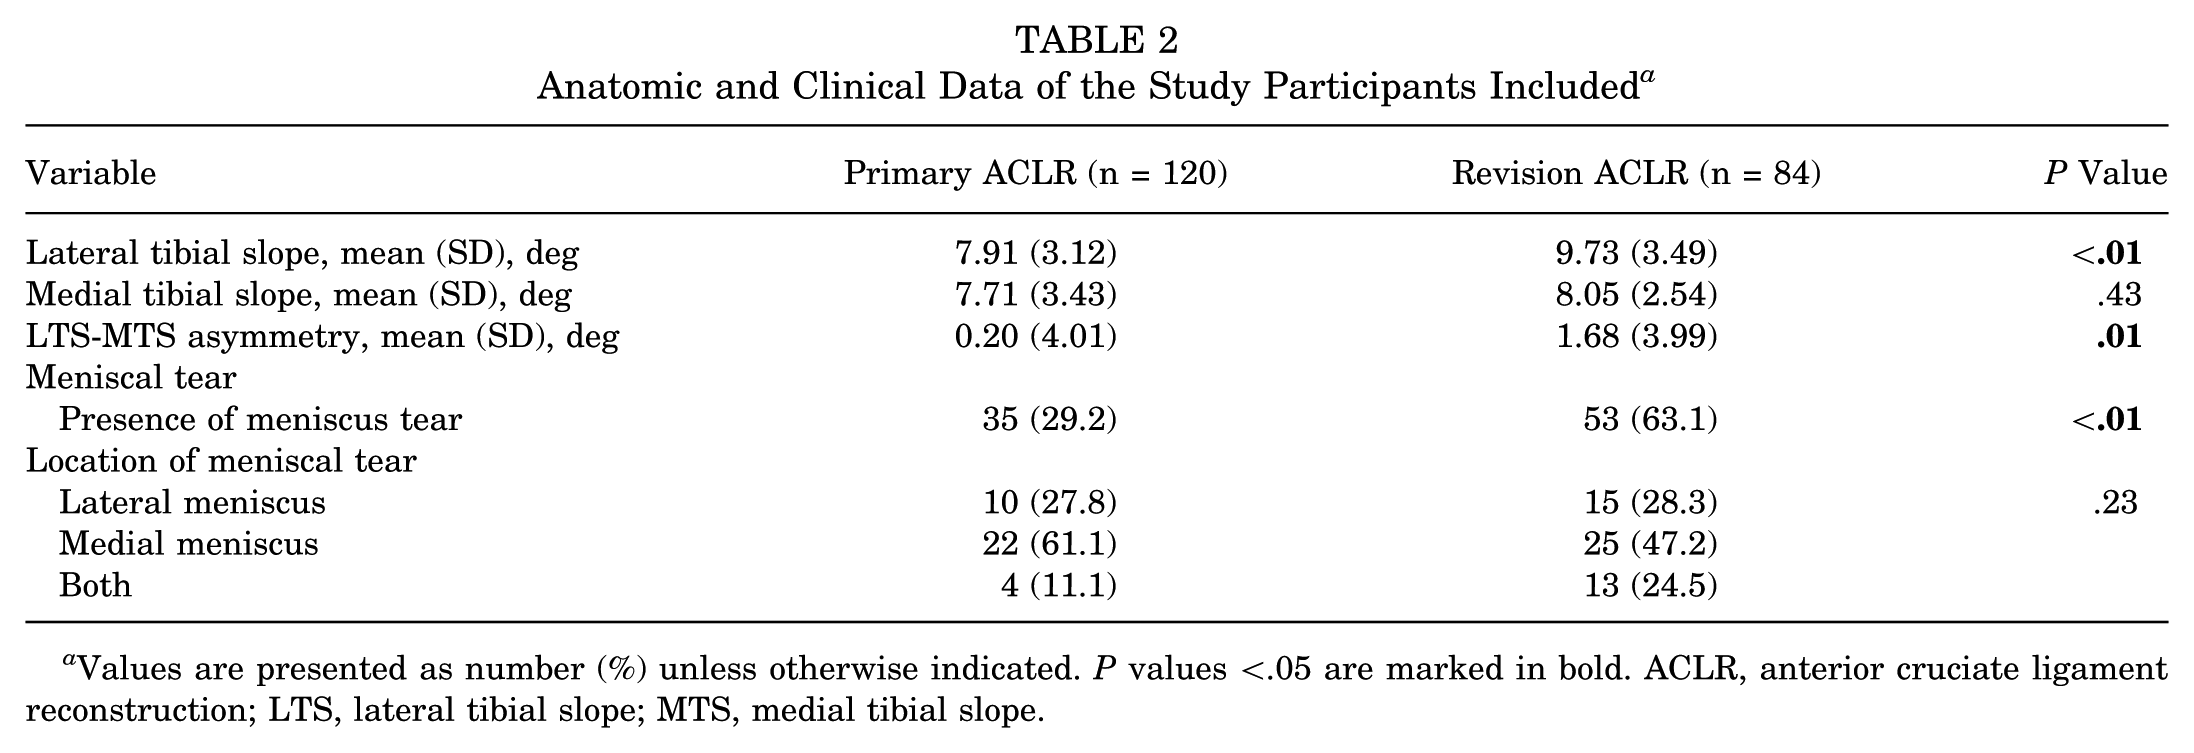
Values are presented as number (%) unless otherwise indicated. P values <.05 are marked in bold. ACLR, anterior cruciate ligament reconstruction; LTS, lateral tibial slope; MTS, medial tibial slope.
In the continuous variable analysis, higher LTS and greater LTS-MTS asymmetry were independently associated with the revision ACLR cohort. Each 1° increase in LTS was associated with an 18% increase in the odds of belonging to the revision surgery cohort (odds ratio [OR], 1.18; 95% CI, 1.08-1.29; P < .01), while each 1° increase in LTS-MTS asymmetry increased the odds of revision group classification by 10% (OR, 1.10; 95% CI, 1.02-1.18; P = .01) (Table 3).
Multivariable Logistic Regression Analysis of Continuous Tibial Slope Parameters and Their Association With Revision Versus Primary Anterior Cruciate Ligament Reconstruction a
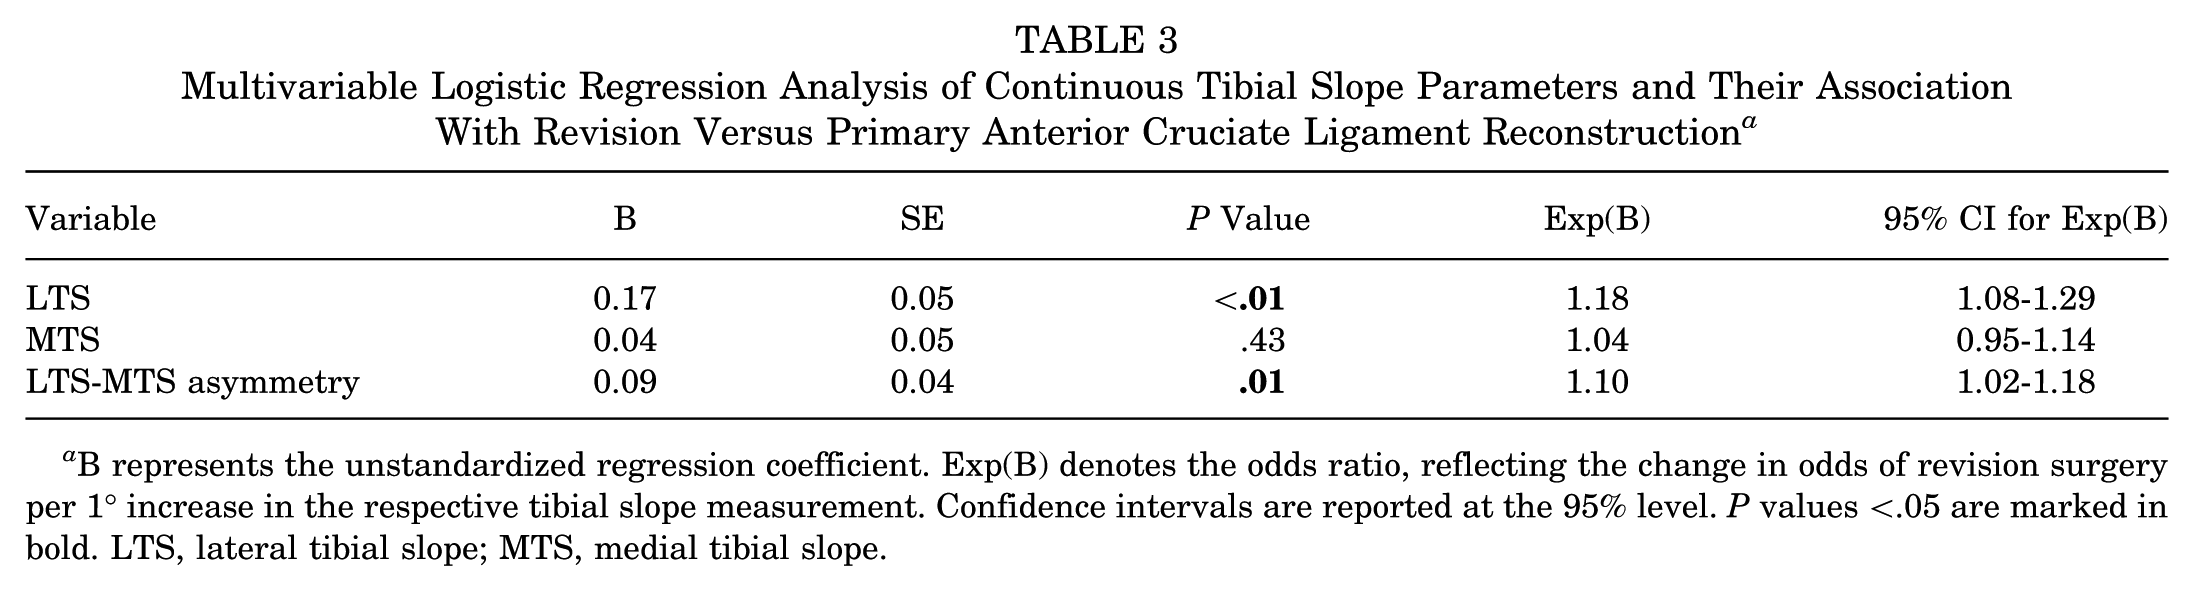
B represents the unstandardized regression coefficient. Exp(B) denotes the odds ratio, reflecting the change in odds of revision surgery per 1° increase in the respective tibial slope measurement. Confidence intervals are reported at the 95% level. P values <.05 are marked in bold. LTS, lateral tibial slope; MTS, medial tibial slope.
In the categorical variable analysis, LTS ≥7.65° (B = 0.81, P = .01) and LTS-MTS asymmetry ≥1.85° (B = 2.30, P = .01) were both significantly associated with revision ACLR status. These thresholds corresponded to ORs of 2.24 (95% CI, 1.20-4.19) and 2.30 (95% CI, 1.25-4.22), respectively, indicating higher odds of belonging to the revision cohort. Concomitant meniscal tears were also independently associated with revision surgery (B = −1.38, P < .01), with an OR of 3.97 (95% CI, 2.17-7.26) (Table 4).
Multivariable Logistic Regression Analysis of Categorical Tibial Slope Parameters and Meniscal Tears Associated with Revision Anterior Cruciate Ligament Reconstruction a
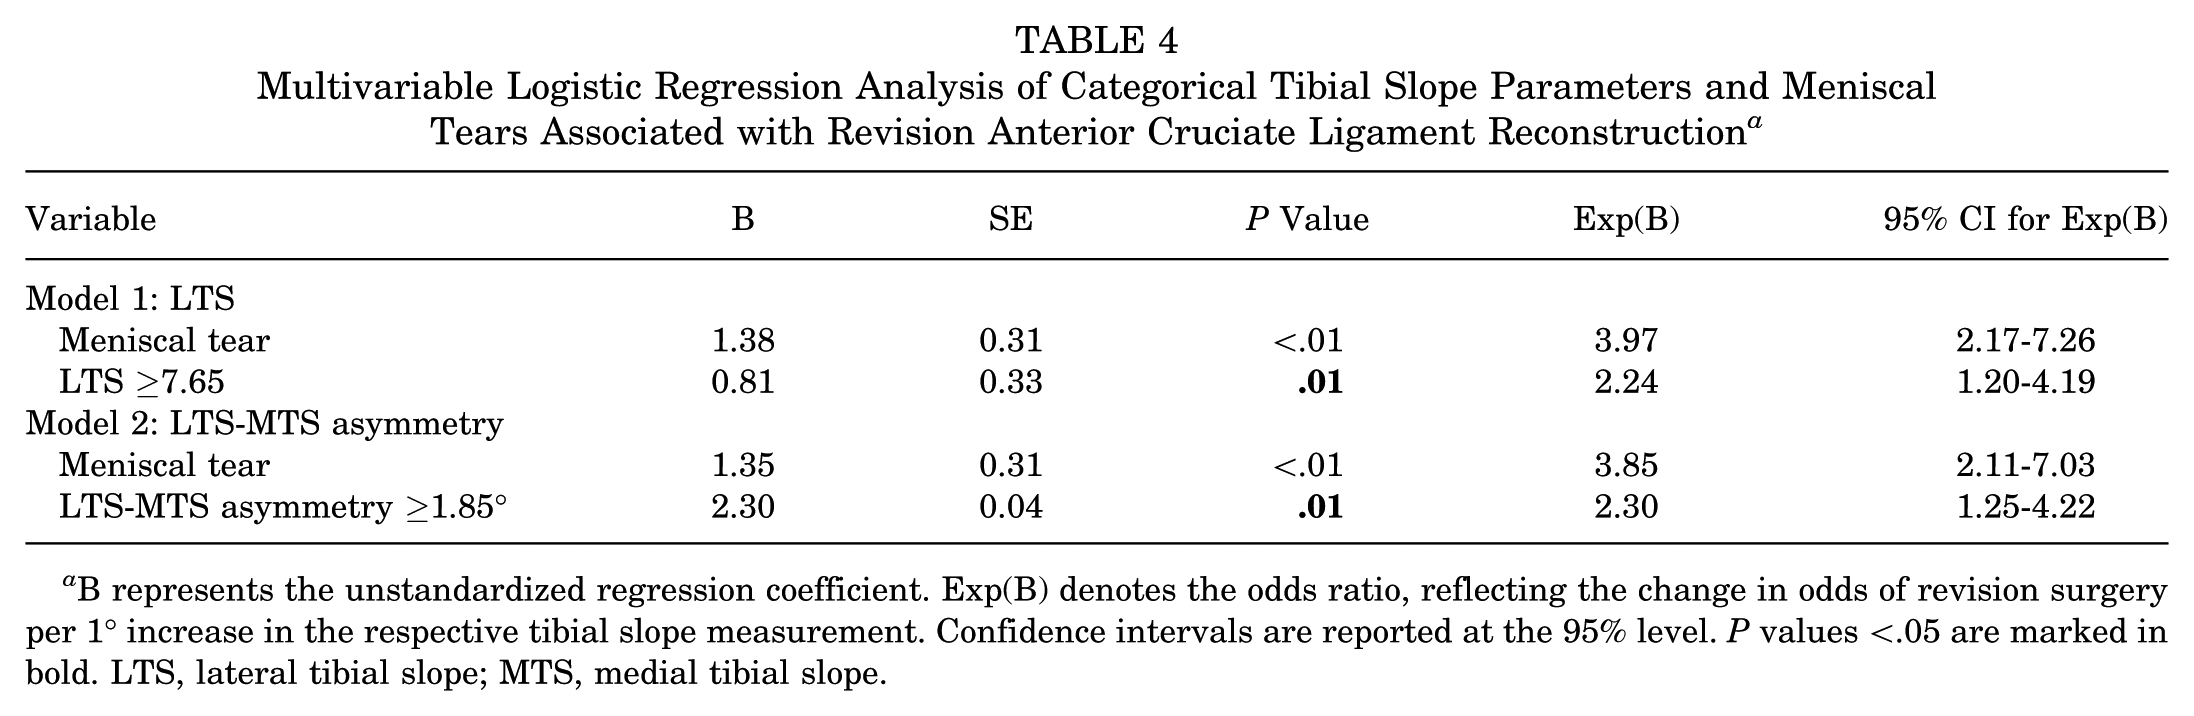
B represents the unstandardized regression coefficient. Exp(B) denotes the odds ratio, reflecting the change in odds of revision surgery per 1° increase in the respective tibial slope measurement. Confidence intervals are reported at the 95% level. P values <.05 are marked in bold. LTS, lateral tibial slope; MTS, medial tibial slope.
Discriminative Performance of Radiologic Parameters for Revision ACLR
ROC curve analysis was performed to determine the optimal cutoff values for LTS, MTS, and LTS-MTS asymmetry by maximizing the Youden index (Table 5; Figure 3). The AUC for LTS was 0.65 (95% CI, 0.57-0.73; P < .01), indicating moderate discriminatory ability at the cutoff value of ≥7.65°. Similarly, the AUC for LTS-MTS asymmetry was 0.61 (95% CI, 0.52-0.68; P = .02), with an optimal cutoff value of ≥1.85°. These findings suggest that both increased LTS and greater LTS-MTS asymmetry were significantly associated with revision ACLR status and showed modest ability to differentiate between primary and revision groups. In contrast, the AUC for MTS was not statistically significant (0.56; 95% CI, 0.48-0.64; P = .17), indicating limited discriminative capacity for distinguishing between primary and revision surgery.
Diagnostic Performance of Tibial Slope Parameters in Distinguishing Revision From Primary Anterior Cruciate Ligament Reconstruction a
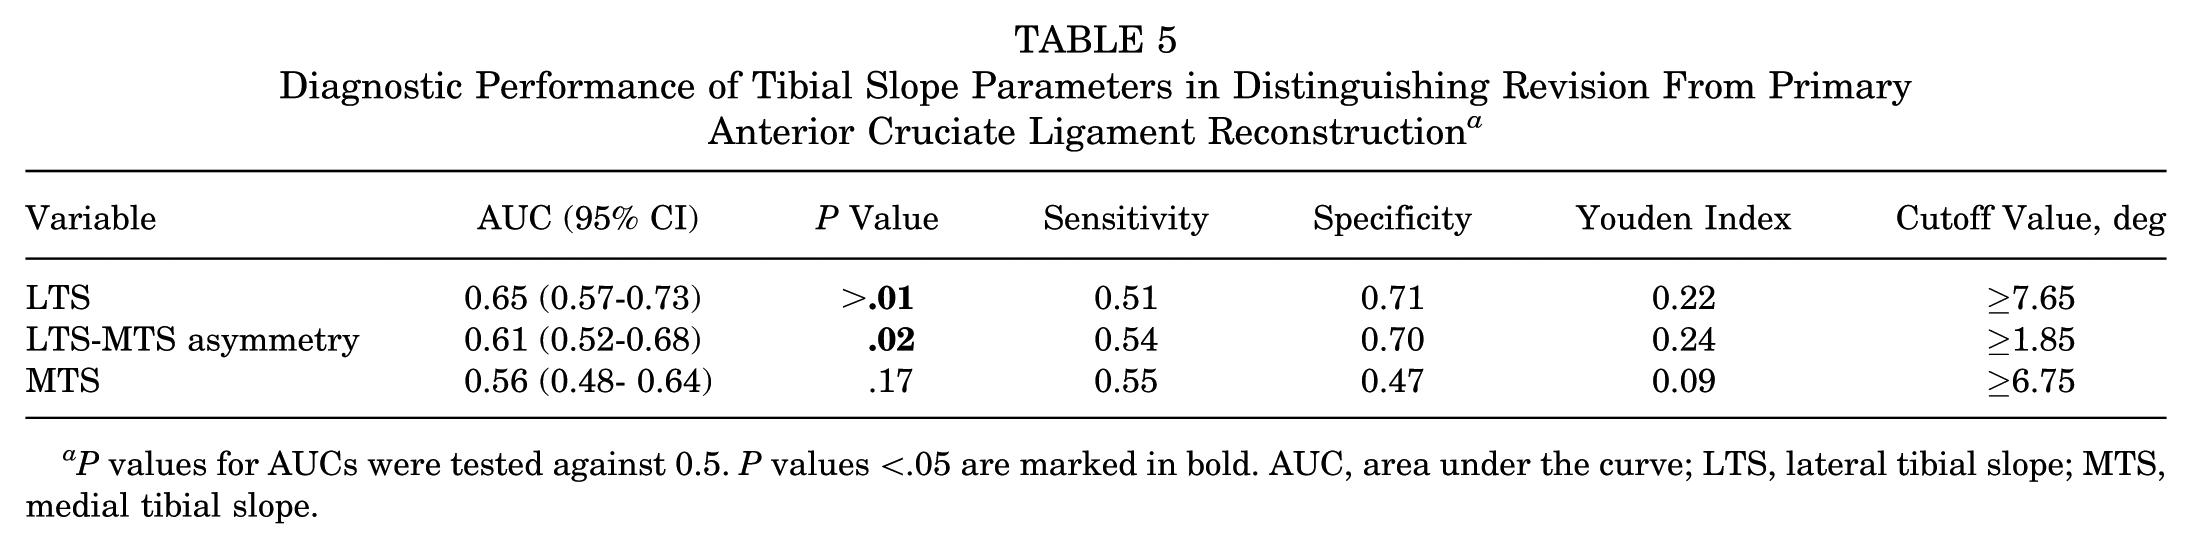
P values for AUCs were tested against 0.5. P values <.05 are marked in bold. AUC, area under the curve; LTS, lateral tibial slope; MTS, medial tibial slope.
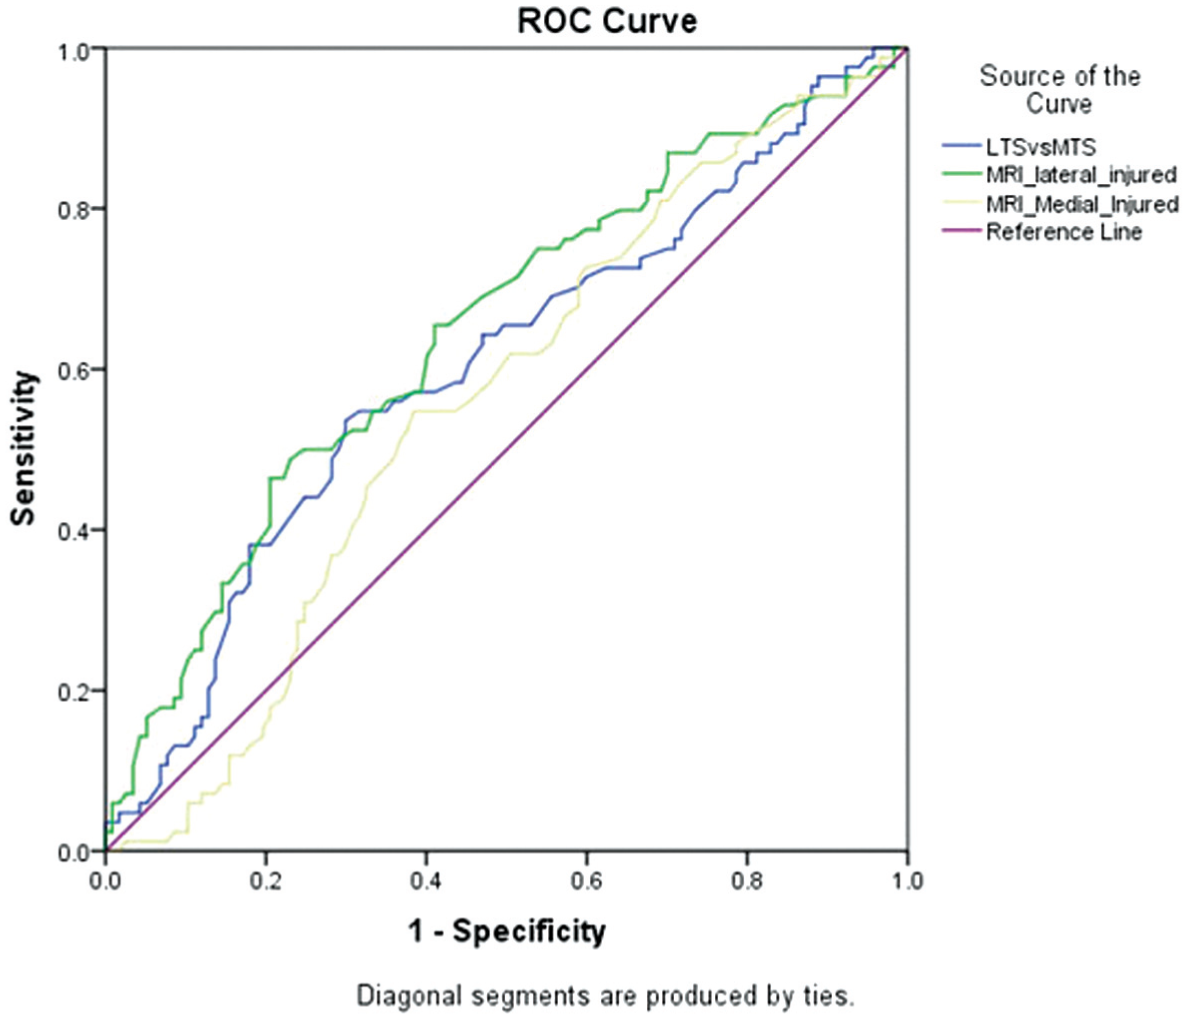
Receiver operating characteristic curves of different radiologic parameters.
Association Between Tibial Morphology and Functional Outcomes
Linear regression analyses demonstrated that increased MTS was significantly associated with lower patient-reported outcome scores across several KOOS subdomains, including Symptoms (β = 0.038, P < .01), Pain (β = 0.039, P < .01), Activities of Daily Living (β = 0.031, P = .01), and KOOS Total score (β = 0.030, P = .04). No significant association was observed between MTS and KOOS Quality of Life (P = .25). Notably, the magnitude of these effects was small, corresponding to changes of <0.5 points in KOOS scores per 1° increase in slope.
LTS and LTS-MTS asymmetry demonstrated only borderline associations with Lysholm score (B = 0.03, P = .05 and B = 0.04, P = .06, respectively) and KOOS Pain (B = −0.05, P = .06 for asymmetry), with no significant associations across other KOOS subdomains. These coefficients indicate changes of <0.2 points in Lysholm or KOOS scores per degree, which did not exceed established minimal clinically important difference (MCID) thresholds (Table 6).
Linear Regression Results Assessing the Association MTS, LTS, and LTS-MTS Asymmetry With Lysholm and KOOS Subscales a
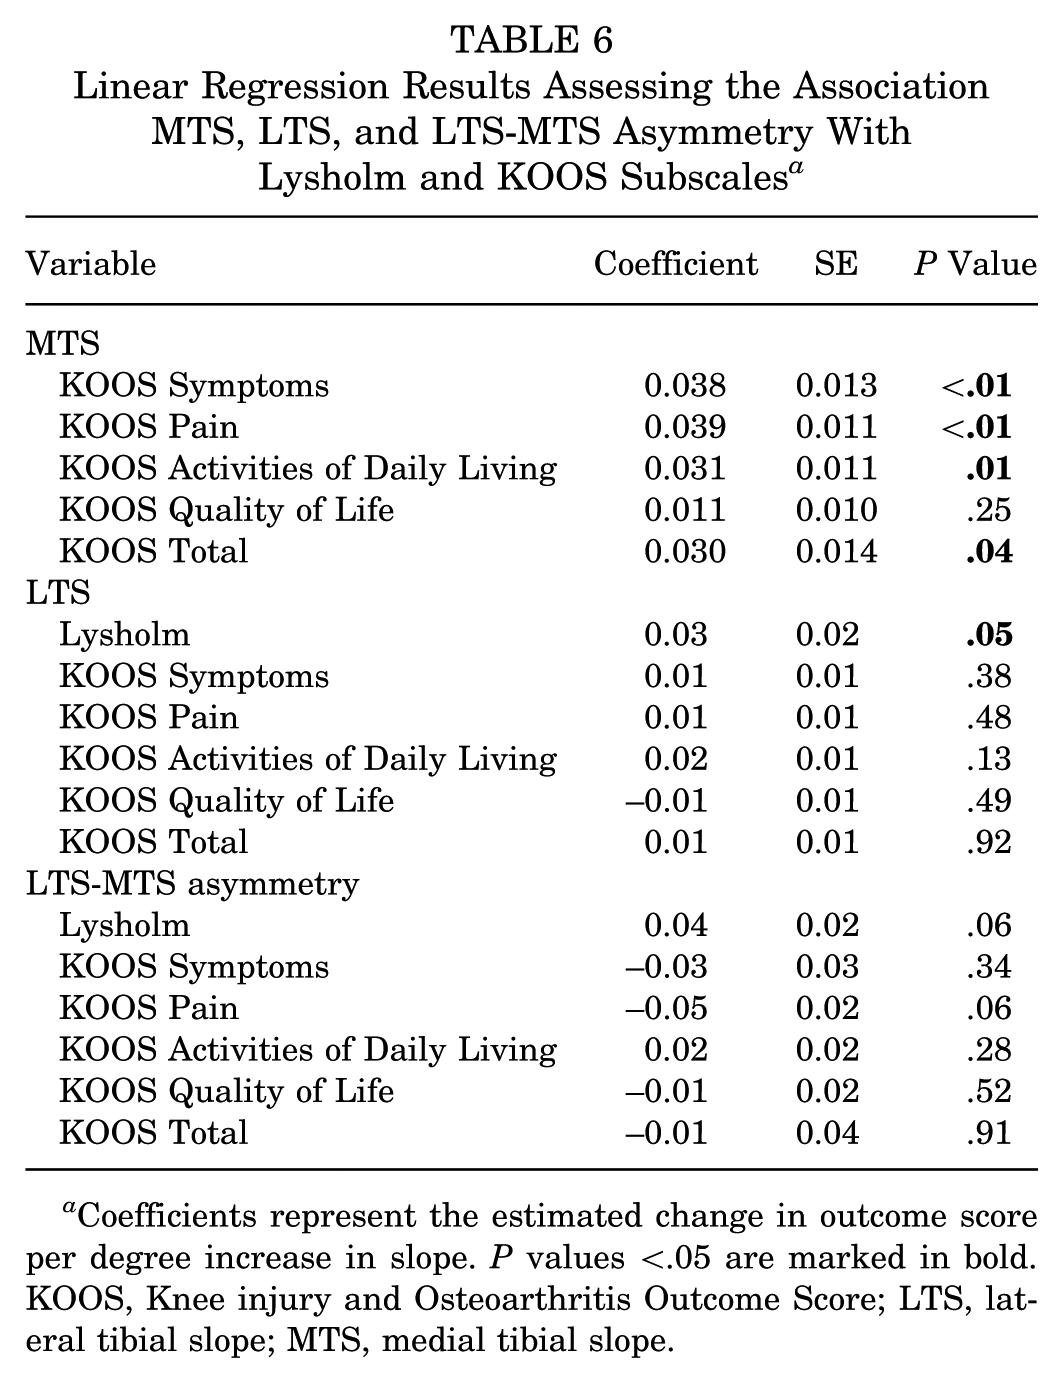
Coefficients represent the estimated change in outcome score per degree increase in slope. P values <.05 are marked in bold. KOOS, Knee injury and Osteoarthritis Outcome Score; LTS, lateral tibial slope; MTS, medial tibial slope.
Discussion
The main findings of this study are 3-fold. First, a steeper LTS (≥7.65°) showed the strongest radiologic association with revision ACLR status, with a sensitivity of 51% and specificity of 71%. Second, LTS ≥7.65°, LTS-MTS asymmetry ≥1.85°, and the presence of concomitant meniscal tears were independently associated with the revision group on multivariable analysis. Third, each 1° increase in LTS corresponded to 18% higher odds of belonging to the revision cohort. Although higher LTS and MTS were statistically associated with lower PROMs, the observed effect sizes did not exceed the MCID, suggesting limited clinical relevance.
In the present study, mean (SD) MTS and LTS among patients undergoing primary ACLR were 7.71 (3.43) and 7.91 (3.12), respectively, values consistent with previously reported Asian cohorts 18 and notably higher than those typically observed in the Western cohort. 15 Previous studies have highlighted that tibial morphology varies across different ethnic populations. Haddad et al 18 reported significantly greater mean MTS and LTS values in Asian patients compared with White and Afro-Caribbean/European cohorts. Specifically, the mean (SD) MTS was 7.9° (3.3°) in Asians, compared with 6.0° (3.3°) in Afro-Caribbean/European patients and 4.2° (3.7°) in Whites. Similarly, mean (SD) LTS was 8.1° (4.0°) in Asians, compared with 4.6° (4.2°) and 4.4° (4.2°), respectively. These ethnic differences underscore the importance of population-specific studies on tibial slope morphology, as steeper tibial slopes may predispose Asian patients to increased biomechanical stress of the ACL graft and a higher risk of subsequent graft failure.
Our findings further demonstrate a significant association between increased LTS and revision ACLR status. Each 1° increase in LTS was associated with 18% higher odds of belonging to the revision cohort, and patients with LTS ≥7.65° were 2.24 times more likely of being in the revision cohort. These findings are consistent with existing literature indicating that steeper LTS is associated with ACL graft failure. 36 In particular, Grassi et al14 reported a comparable threshold, with an LTS >7.4° demonstrating 88% sensitivity and 84% specificity for predicting ACL graft failure. From a biomechanical perspective, an increased tibial slope results in greater anterior tibial translation and increased compressive forces across the tibiofemoral joint under axial loading, thereby increasing the mechanical load on the ACL graft. 13 In addition to its effect on graft strain, steeper LTS has also been associated with greater rotational instability, high-grade pivot shifts, anterolateral ligament injury, and increased rotational laxity.2,3,21
Although some studies have reported inconsistent associations between LTS and ACLR graft failure,5,20 systematic reviews indicate that overall increased LTS is associated with graft failure.8,36 Importantly, most studies employing the MRI measurement technique described by Hashemi et al 19 have demonstrated a significant relationship between LTS and graft failure, with only 1 reported exception. In contrast, studies using alternative methods, such as those by Hudek et al, 20 have yielded more heterogeneous results.7,20,36 This suggests that variability in measurement methodology may contribute to discrepancies in reported outcomes, highlighting the importance of standardized, reproducible imaging techniques.
The current study also identified LTS-MTS asymmetry as significantly associated with the revision ACLR cohort. Each 1° increase in LTS-MTS asymmetry was associated with 10% higher odds of belonging to the revision cohort, while patients with asymmetry ≥1.85° had 2.30 times higher odds of being in the revision cohort. Biomechanical evidence suggests that LTS-MTS asymmetry alters tibiofemoral rotation, increasing susceptibility to both ACL and meniscal injuries. 1 Several studies have proposed that an LTS-MTS asymmetry threshold of ≥3° is associated with an increased meniscal injury risk.25,33 During ACL rupture, posterior subluxation of the lateral femoral condyle on the lateral tibial plateau can entrap the posterior horn of the lateral meniscus, increasing the risk of a lateral meniscus tear. A greater LTS-MTS asymmetry may accentuate this mechanism by enhancing posterior sliding of the femur along a steeper LTS, resulting in increased femoral external rotation and tibial internal rotation.9,32 Given that the lateral meniscus serves as a secondary restraint to internal tibial rotation,12,27,30 excessive rotational strain may explain the higher prevalence of meniscus injuries observed in patients with significant slope asymmetry.
In contrast to LTS and slope asymmetry, MTS was not significantly associated with revision ACLR in the present study. This aligns with the broader literature, which remains inconclusive. A recent meta-analysis of 11 studies found that only 6 reported a significant increase in MTS among patients with graft failure, while 5 found no such association. 36 Even among studies that did report a significant relationship, many authors emphasized that the LTS was a stronger and more consistent predictor of ACL graft failure compared with MTS.16,34 Our findings are consistent with those of Liu et al, 26 Panigrahi et al, 29 and Ziegler et al, 37 who also observed a steeper MTS in patients requiring revision ACLR, but without statistical significance. One possible biomechanical explanation, as proposed by Simon et al, 31 is that under axial loading, a steeper LTS causes the lateral femoral condyle to slide posteriorly along the lateral plateau, using the medial plateau as a pivot. This results in increased tibial internal rotation, which has been shown to increase strain on the ACL and lateral meniscus.10,25 Furthermore, differences between LTS and MTS have been shown to influence tibiofemoral rotational mechanics. 25 These observations suggest that MTS alone may not fully explain the variation in the revision ACLR cohort and that the asymmetry between medial and lateral slopes may be of greater clinical relevance.
Lastly, increases in LTS, MTS, and LTS-MTS asymmetry were associated with greater reductions in PROMs when comparing primary and revision ACLR groups. However, although some associations reached statistical significance, the magnitude of the regression coefficients was small, corresponding to changes of <1 point per degree of slope across PROMs, and therefore did not exceed the established MCID threshold.
While biomechanical studies have demonstrated that a steeper PTS contributes to residual instability and increased pivot shift, particularly in patients with multiple ACL failures, the direct impact of tibial slope on subjective functional outcomes remains unclear. 15 Clinical data examining this relationship are currently sparse. Yang et al 35 reported that a higher LTS was associated with poorer long-term outcomes after double-bundle ACLR; however, the correlation coefficient reported was below 0.5, indicating only a weak to moderate relationship. These findings suggest that while tibial morphology plays a critical role in biomechanical stability, its influence on patient-reported outcomes may be indirect and multifactorial. Further studies are required to further elucidate the relationship between tibial morphology and functional outcomes.
Limitations
We acknowledge several limitations. First, as a retrospective study, our analysis is limited by available data and potential for selection bias. We only included patients with adequate preoperative MRI scans, which may have excluded a nonrandom subset of the population, introducing selection bias. Second, this study did not account for pivot-shift grading or quantitative measures of rotational instability. Given that a steeper LTS has been associated with higher pivot-shift grades and greater rotational laxity, this represents a limitation in the functional interpretation of our anatomic observations. Another limitation of this study is that we were unable to establish the minimal detectable change for the MRI measurements. A recent study found that radiographic medial PTS increases over time in patients undergoing revision ACLR, 23 suggesting that longitudinal changes could influence the interpretation of our findings.
Lastly, while meniscal tears were significantly more common in the revision group, this study did not control for the type, severity, or specific surgical management of meniscal injuries. Variability in how these injuries were treated (eg, repair vs meniscectomy) could have independently influenced clinical outcomes and revision risk, confounding the observed associations.
Conclusion
This study underscores the importance of evaluating LTS and LTS-MTS asymmetry on MRI in relation to revision ACLR status. LTS ≥7.65°, LTS-MTS asymmetry ≥1.85°, and concomitant meniscal tears were significantly associated with belonging to the revision group, highlighting the need for careful assessment of tibial morphology and consideration of these parameters during preoperative planning.
Footnotes
Final revision submitted February 17, 2026; accepted February 24, 2026.
The authors have declared that there are no conflicts of interest in the authorship and publication of this contribution.
Ethical approval for this study was obtained from the Institutional Review Board of the National Health Group Singapore Research Ethical Committee (CIRB: 2022/00650).
