






Abstract
The morphology of today’s cities is the result of historic urban developments and on-going urban transformation resulting in complex urban spatial structures. While functionally as well as spatially, cities are structured into sub-units such as the city center, business districts, residential areas, or industrial and commercial zones, their precise localization in the geographic space is sometimes difficult. City centers in particular are difficult to grasp because they stand for many different urban functions. Generally, they are characterized as areas of high densities, such as employment, population, or commerce, but also as areas of high structural densities. In past studies, various approaches, data, and cut-off values have been presented to separate city centers from the surrounding transition zones in geographical information systems based on density values. To overcome the difficulty in defining the right density threshold, the current study presents an approach which integrates the subjective perception of citizens on the urban spatial structure and relates it to the floor area ratio to delineate city centers to infer a characteristic density threshold. In a large empirical study of 67 monocentric cities in Germany, we observe a decreasing floor area ratio gradient toward the urban fringes. The result of the study reveals a relative threshold for city centers at around 30% of the density of the “central place.”
Introduction
The spatial structure of cities has undergone fundamental transformations over the past centuries. Today’s cities appear often as decentralized, polycentric (Garreau, 1991) urban structures; they are sometimes even seen as an intermediate step to a dispersed urban world (Batty et al., 2004). This is mostly a result of planning policies in the 20th century where urban functions have been segregated and decentralized shaping modern cities as complex urban systems connecting urban functions and urban forms throughout spatial and functional networks (Batty, 2008). While these described processes are mainly observed in North America and recently in Asia, European cities mostly still resemble what they looked like “in the lifetime of St. Thomas Aquinas […] built in the 13th century” (Holmes, 2001). Medieval European cities were characterized as places with a mix of urban functions (e.g. housing, trade and commerce, consumption, employment) in very close spatial proximities resulting in the majority of jobs being concentrated in central manufacturing areas (Anas et al., 1998). Since city sizes were regulated by walking or horseback riding distances, spatial congruency between these functions could be enabled inside city walls which were constructed in the shortest, thus in a circular shape around a “central place” which served as nuclei of urban development, e.g. the central market (Schlüter, 1899). This has led to the development of monocentric urban spatial structures in European cities which could be preserved until the 19th century when the Industrial Revolution gave way to new usages of urban spaces and processes of de-concentration and suburbanization gained in prevalence (Siedentop, 2005). A key prerequisite for the latter was the decreasing importance of spatial proximity as a necessity for economy due to new transport technologies. Thus, the importance of the historical city centers in terms of trade and commerce has eventually declined over time (Besussi and Chin, 2003; Schiller, 2001; Thomas and Bromley, 2003), but they are still important for the provision of urban functions and soft economies today, favoring high density and mixed locations (Batty et al., 2004).
In fact, high density and high diversity are considered as the most important characteristics when defining city centers. Most commonly, functional characteristics are used to define and delineate city centers, such as high concentrations of commerce, economic activities, employment, high individual and public traffic (including pedestrians), as well as high diversity of activities and touristic attractions, respectively (Anas et al., 1998; McMillen, 2004; Murphy and Vance, 1954; Sert, 1952; Thurstain-Goodwin and Unwin, 2000). Besides urban functions, also morphological characteristics were used to delineate city centers, mostly in terms of structural density (Krehl et al., 2016; Murphy, 1971; Murphy and Vance, 1954; Taubenböck et al., 2013, 2016). As a result of this plurality of characteristics for defining city centers, a commonly agreed and consistent definition of city centers has not evolved (Ralphs and Wyatt, 2003), and moreover, no commonly accepted density threshold has been found.
This ambiguity in defining and delineating city centers is addressed in the present paper. We aim at taking up on the fuzziness for delineating city centers by analyzing cognitive perceptions of citizens on city centers and relate it to the floor area ratio (FAR) to empirically infer a density threshold value for separating city centers from the transition zone. In this way, we analyze people’s cognitive perceptions to spatially define city centers, since citizens recognize and realize the presence of a city center when they are standing in a city center even if they cannot define it. The use of subjective perception to create “mental maps” has been introduced by Lynch (1960) where he describes the concept of “legibility,” making parts of the city recognizable to its dwellers and thus triggers to spatially organize the city in the sense of mental maps. They are a subjective interpretation of the environment as a function of individual social values and constraints (Rengert and Pelfrey, 1997). This concept is related to the direct perception theory (Gibson, 1979) where specific objects are related to specific functions or activities. For example, a park affords relaxing or a street affords walking (Jiang, 2012). In this way, a city creates also a mental map for citizens (Haken and Portugali, 2003).
Based on these concepts, we search empirically for a characteristic degree of FAR which is commonly accepted by citizens to separate city centers from their surrounding areas. Thus, this paper contributes to research on the delineation of city centers. The work provides new perspectives on delineating city centers following an empirical, quantitative analysis of 67 monocentric major cities in Germany. In an experimental setting, we calculate structural density represented as FAR based on 3D building models and relate it to cognitive perceptions of citizens on the city center. To demonstrate the proof of concept, we divide the statistical population of all cities into four groups based on population density since it provides a proxy value for the urban spatial structure. We argue feasibility of this proof of concept if the empirically derived distances are similar among the four groups.
The remainder of this article is structured as follows: we begin by reviewing how city centers are defined and localized in previous studies based on functional and morphologic features (“Delineation of city centers: Related work” section). The “Data and methods for delineating city centers” section describes the used data and the workflow for the calculation of urban morphologic features such as the FAR and the integration of survey data on cognitive perception of city centers. This is followed by a discussion on the proposed analysis in the “Discussion of empirical findings” section and the final section concludes the paper with an outlook.
Delineation of city centers: Related work
To delineate city centers, we need to have an understanding of how and based on which criteria they are separated from their surrounding areas. But these surrounding “zones of transition,” as introduced in the classical models of urban land-use (Park and Burgess, 1925), remain also rather fuzzy in definition and shape. They are described as areas with lower densities than the city center, e.g. population density (Borruso and Porceddu, 2009) and also lower land prices as a function of the accessibility to the central business district (CBD) as introduced in the classical, monocentric urban bid rent model by Alonso (1964) and still applied in current studies (D’Acci, 2019). From the aspect of historical urban development, the transition zone represents the former suburbs of the historic city, mostly located outside former city fortifications. In some cities, these fortifications could be preserved until today, e.g. Neuf-Brisach (France) or Lucca (Italy), and still delimit a sharp border between the city center and its surroundings, mostly visible by significant differences in density (Figure 1(a)). In other cases where the city walls have been torn down, we find today other structuring elements in their place such as boulevards, e.g. the “Ringstraße” in Vienna (Austria), the “boulevard périphérique” in Paris (France) or parks, e.g. Cologne (Germany) which still keep the separating function of the former city walls alive, mostly still visible by changing morphological densities (Figure 1(b)). Another example are cities with no more clearly visible separating element in their today’s urban spatial structure between their former city centers and their surroundings since their urban morphology has been transformed more severely over the past centuries (Figure 1(c)), e.g. due to large-scale destruction and rebuilding, e.g. Rotterdam (The Netherlands). In these cases, the physical circumscription of the city center cannot be easily identified since the transition zone is an area of flux which is characterized by a continuous change in urban function or land-use as well as a decrease in density without any obvious threshold.
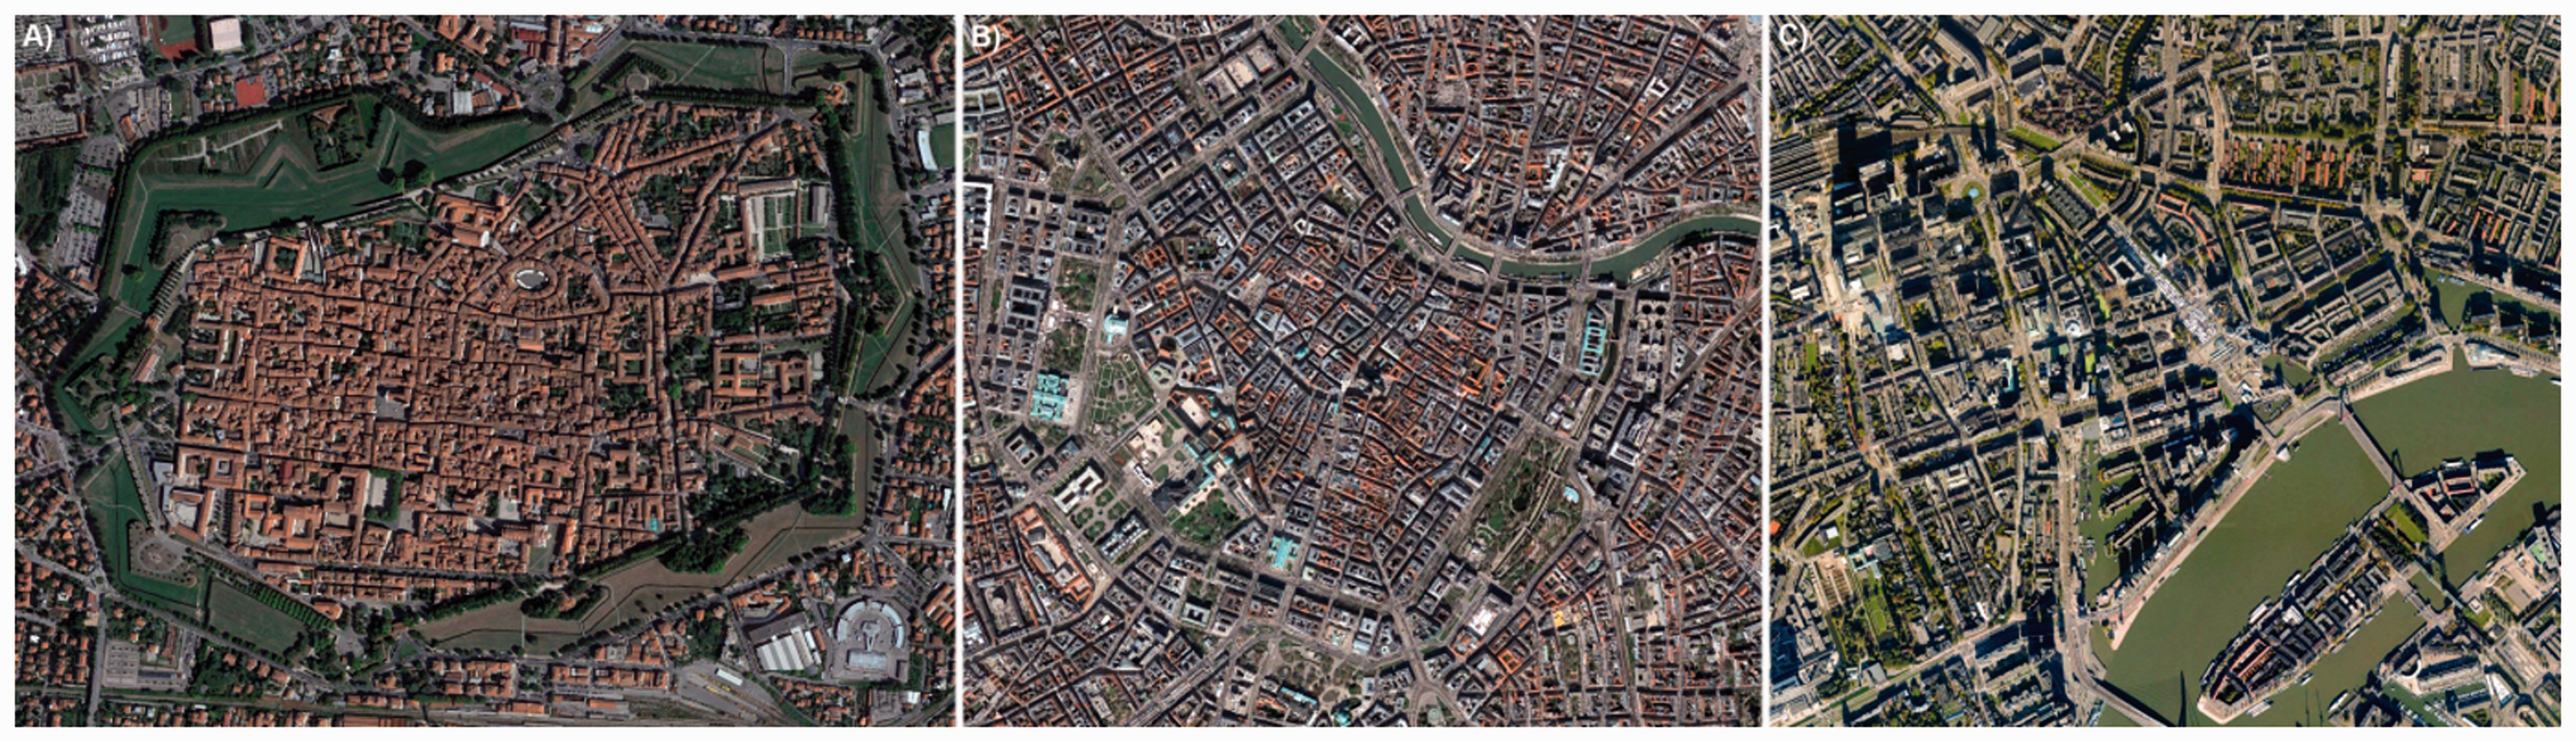
Examples for city centers: (a) preserved city walls: Lucca (Italy), (b) former walls replaced by structuring elements such as boulevards: Vienna (Austria), and (c) entirely transformed: Rotterdam (The Netherlands). Source: © Google Earth.
From a scientific point there exists neither a single, commonly agreed feature nor cut-off value to delineate the city center from its surroundings. Due to the fuzziness of city centers, the use of geographical information systems for their delineation has been criticized for a long time (Taylor, 1995), although more recent approaches have successfully addressed this issue (Batty et al., 2004). In related work, city center detection was performed based on a large spectrum of features, such as functional characteristics (Borruso and Porceddu, 2009; Lloyd, 2009; Thurstain-Goodwin and Unwin, 2000), travel flows (Ratti et al., 2006; Roth et al., 2011), location-based social networking (Sun et al. 2015), social media data (Chen et al., 2017; Hollenstein and Purves, 2010), urban land-use data (Zhu and Sun, 2017), points of interest, and road network data (Lei et al., 2015; Yu et al., 2015). Besides functional characteristics, also morphological features such as the density were used to delineate CBDs (Krehl et al., 2016; Murphy and Vance, 1954; Taubenböck et al., 2013). These related works approach city center delineation either in terms of a clear-cut spatial delineation based on a broad set of different kinds of data or approach the fuzziness of city centers understanding it as higher order geographical phenomenon. In this way, Burrough and Frank (1996) find city centers based on the cognitive perception of citizens such as mental maps, as introduced by Lynch (1960). The approach of using social studies participants’ individual perception for spatially structuring urban areas by the features location, density, and function was successfully adapted by Hoffmeyer-Zlotnik (2000). Further studies related citizens’ perceptions to the appearance of specific urban functions of city centers (Alarasi et al., 2016; Le et al., 2005; Lüscher and Weibel, 2012), assessed the quality of a center (Rengert and Pelfrey, 1997), or delineated the area of city centers for a small number of cities (Le et al., 2005; Lüscher and Weibel, 2012; Montello et al., 2003). Despite the related work in this context, one remaining drawback is that the individual choice of criteria for describing a city center remains very subjective for each individual. Thus, it is very unlikely that two citizens agree on a similar set of criteria (Thurstain-Goodwin and Unwin, 2000) making the search for an optimal feature set a very difficult task. Therefore, instead of searching for a commonly accepted set of functional criteria to delineate city centers for all cities under investigation, we base our approach to citizens’ perceptions on their household locations to delineate city centers and relate it to the FAR as a very visible and objective criterion. Moreover, we aim at finding a generalizable, characteristic FAR-threshold for separating city centers from their surroundings.
Data and methods for delineating city centers
The proposed workflow for empirically inferring a characteristic FAR-threshold to delineate city centers is based on citizens’ perceptions and decreasing FAR gradients in monocentric cities (Barr and Cohen, 2014). To evaluate the proposed proof of concept, we base our study on a large sample of major cities in Germany. Selection of sample cities was based on several criteria: (1) a minimum population size of 100,000 inhabitants to ensure a significant size of the city center and the transition zone, (2) a monocentric urban structure following a radial FAR gradient, (3) a historic city center to avoid recently planned city foundations, and (4) their spatial development has not been too impaired by natural barriers such as mountains or water surfaces. All German major cities have been individually evaluated with regards to their historic development and their urban spatial structure based on (historic) maps and satellite images. Cities that have undergone significant territorial reforms (e.g. Berlin, Wuppertal, Remscheid), with decreasing population sizes (e.g. Zwickau, Wilhelmshaven), with a spatial development which is affected by natural barriers such as the sea (e.g. Bremerhaven, Kiel, Flensburg) or cities without a historical city center (e.g. Wolfsburg, Karlsruhe, Leverkusen, Ludwigshafen) have been removed resulting in a total of 67 major cities for the current study. For the selected cities, 3D building models are used to calculate the FAR on the spatial level of city blocks. Further, citizens’ perceptions from a socio-economic survey are used to spatially delineate the extent of city centers. In a consecutive step, the spatial extents of the perceived areas of city centers are spatially superimposed with the values to infer a characteristic FAR-threshold value at the edge between the city centers and the transition zone. In the absence of objective validation data for the size of city centers, we test the proof of concept with the help of creating four groups from the 67 cities based on the following assumption: if the inferred FAR-threshold values are similar among these groups, an interrelation between FAR and cognitive perception on city centers can be argued. The four groups are based on the population density of the 67 cities since the population density integrates both, population size and area of a city. Using Jenks’ natural breaks classification algorithm (Jenks and Caspall, 1971), the following four groups are created: (1) ≤850 inh./km2, (2) 850–1600 inh./km2, (3) 1600–2500 inh./km2, and (4) >2500 inh./km2. The proposed workflow is presented in detail below and an overview of the required steps is depicted in Figure 2.
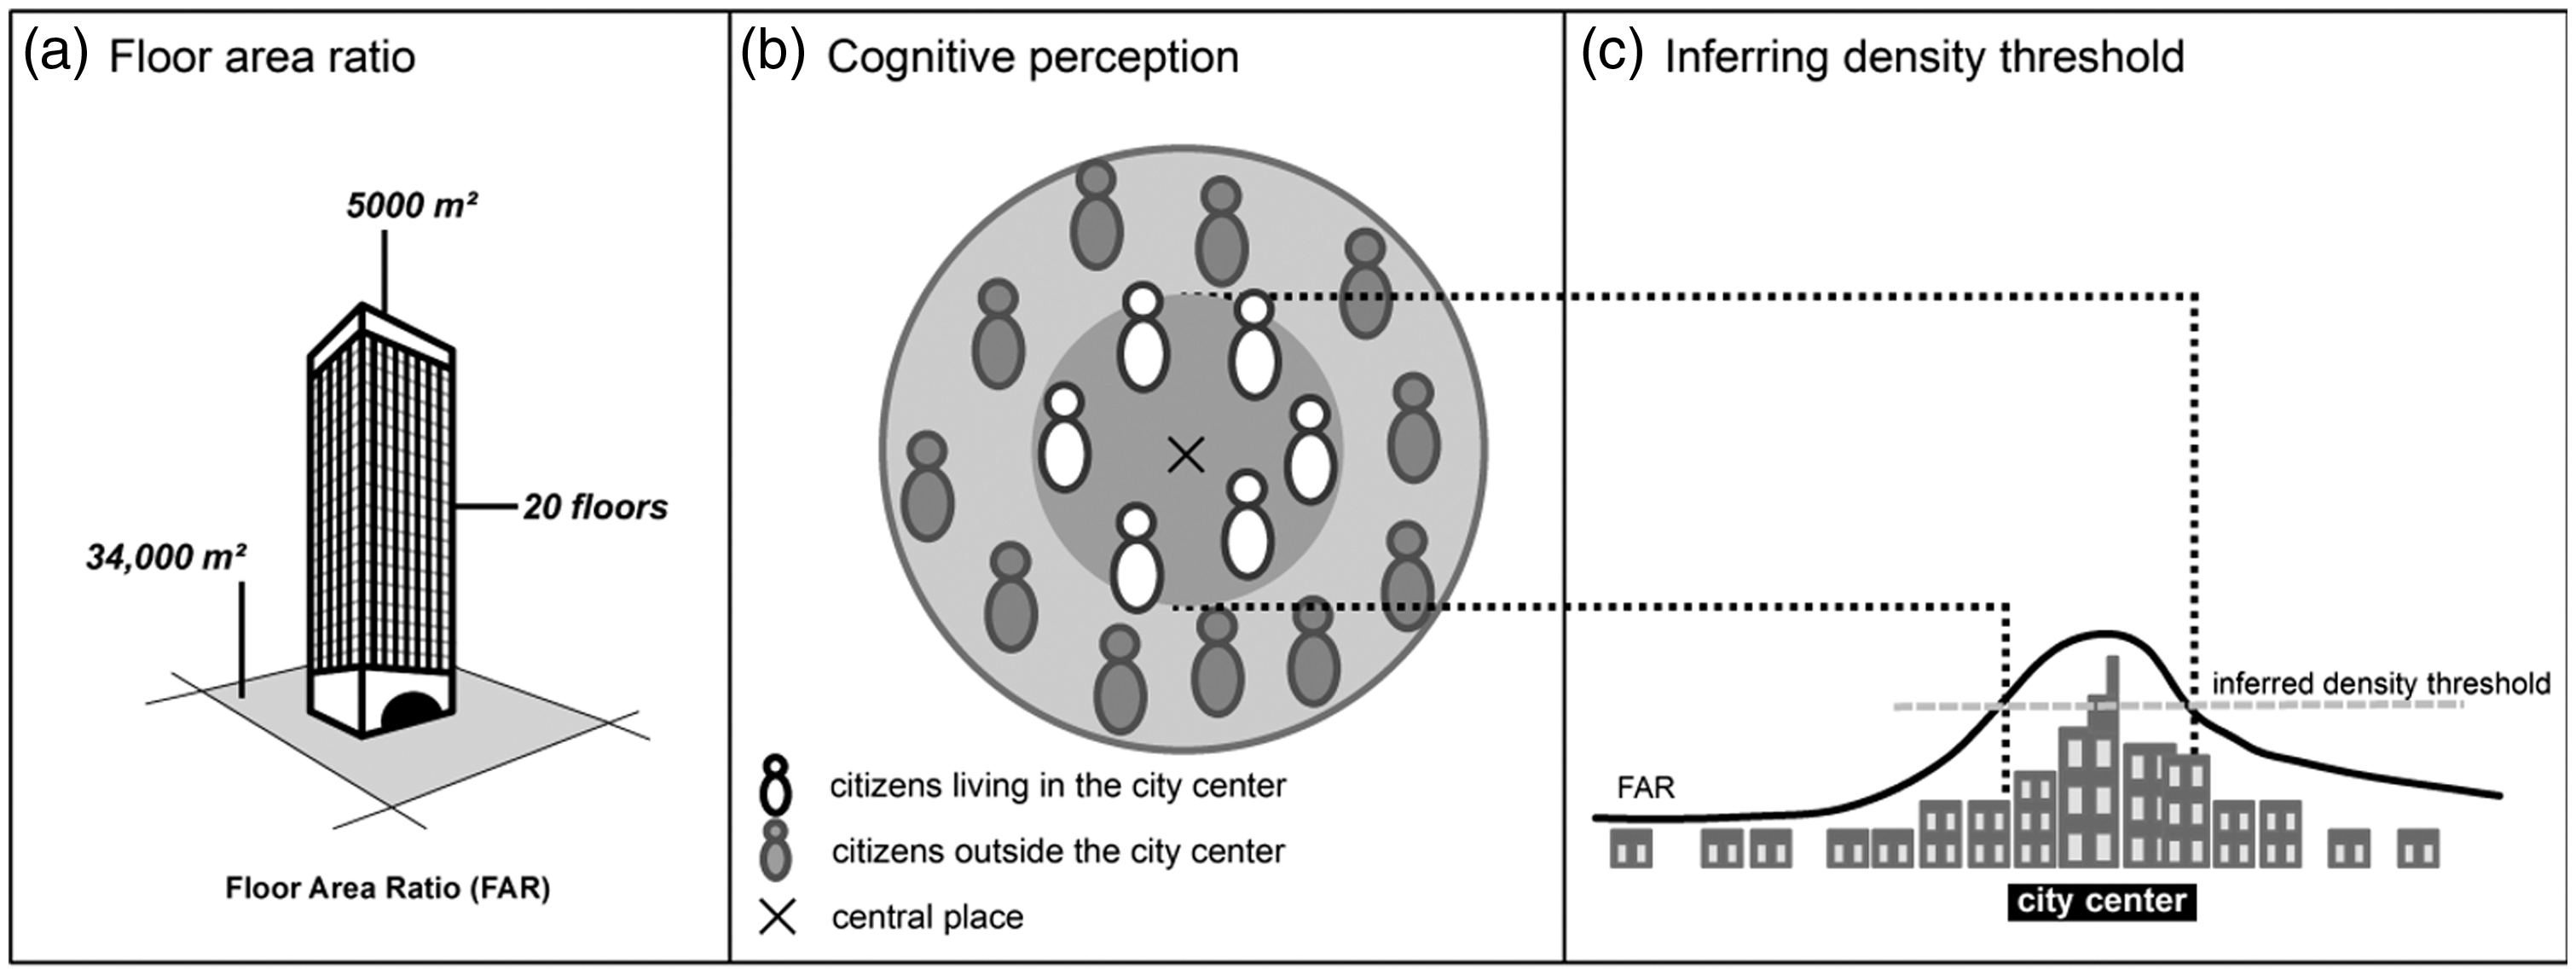
Workflow for delineating city centers based on FAR and cognitive perception: (a) Calculation of FAR (“Inferring the FAR-threshold” section), (b) using citizens’ perceptions to delineate city centers (“Cognitive perception of citizens” section), and (c) inferring the FAR-threshold (“Inferring the FAR-threshold” section).
Calculation of FAR
Structural density represents a key feature for the characterization of urban morphology and is crucial for describing urban activities (e.g. Acioly and Davidson, 1996). It stands for proximity because with rising density of a city, distances are decreasing and citizens cover more distances walking in the city, by bike or public transport. Density serves as a trigger for synergies and concurrences, thus having a positive impact on prosperity and innovation. Despite its wide application in urban studies and planning, structural density still represents a fuzzy concept (e.g. Krehl et al., 2016; Taubenböck et al., 2016). For its calculation, usually building footprint areas or volumes are related to the area of the land lot or the city block. An objective and comparable measure of structural density for analyzing the urban spatial structure represents the FAR (Barr and Cohen, 2014; Wurm et al., 2014). It is defined as the ratio of total usable floor space to the size of the plot, e.g. the FAR of a plot with a 5-story building constructed over the entire plot would equal to 5, while a 10-story building over half the plot size would also equal to 5 (Barr and Cohen, 2014). For the current study, FAR is calculated based on ministerial 3D building models at the Level-of-Detail-1 (LoD-1) and data on city block geometries. LoD-1 building models represent the shape of buildings as block model incorporating building footprint geometries (e.g. area) and a metric building height value; however, these data usually do not incorporate the number of floors. Thus, these data represent a simple 3D representation of buildings. For detailed information on the related LoD-1 building model, we refer to the official product catalogue for federal agencies on the website of the data provider.
1
Since for calculation of FAR, the buildings’ areas and the number of floors are required, we infer the number of floors based on empirically established linear regression models with a sample of 600,000 buildings including data on metric height and number of floors. The approach for inferring floor numbers based on LoD-1 building models is related to Wurm et al. (2011) and Krehl et al. (2016), and we refer to these studies for a detailed description of the workflow. The model is validated in a two-fold cross validation procedure, yielding an adjusted R2 of 0.746. After application of the model to all 9.5 million individual buildings, FAR is calculated for all 417,000 city blocks in all 67 cities (Figure 3). Since the range of FAR values varies significantly among the cities, we use the normalized FAR for better comparability. Normalized FAR (

FAR for all 67 cities of the study, presented in four groups of population density.
Cognitive perception of citizens
For all 67 cities in this study, we use cognitive perception of citizens to create a common understanding of the size of the city centers. These “mental maps” are based on national household survey data from the Socio-Economic Panel Study (SOEP) on more than 23,000 individuals in about 11,000 households in Germany (Goebel et al., 2018). In SOEP, detailed socio-economic data about objective and subjective life conditions are surveyed on a yearly basis. One question asks participants to locate their house in the city as being located either “in the city center” or “outside the city center.” In total, 2865 households claim to live in a city center. For each citizen’s house located in the city center, the distance between the geographic location of the house and the “central place” 2 is calculated using anonymized geographically referenced household data 3 (Goebel and Pauer, 2014). In the last step, the mean distance value for all the households is calculated. This distance value stands for the commonly perceived size of the spatial extent of the city center by the citizens. In the following analysis step in the “Inferring the FAR-threshold” section, this distance value is used to infer the FAR-threshold. Figure 4 displays the households’ distances to the “central places” for each population density group: with rising population density, also the distances to the central place rise for the households claiming to live in the city center. For inferring the FAR-density threshold (“Inferring the FAR-threshold” section), the mean distance values are used for the four groups: (1) 1.40 kilometers, (2) 1.94 kilometers, (3) 2.55 kilometers, and (5) 2.85 kilometers.
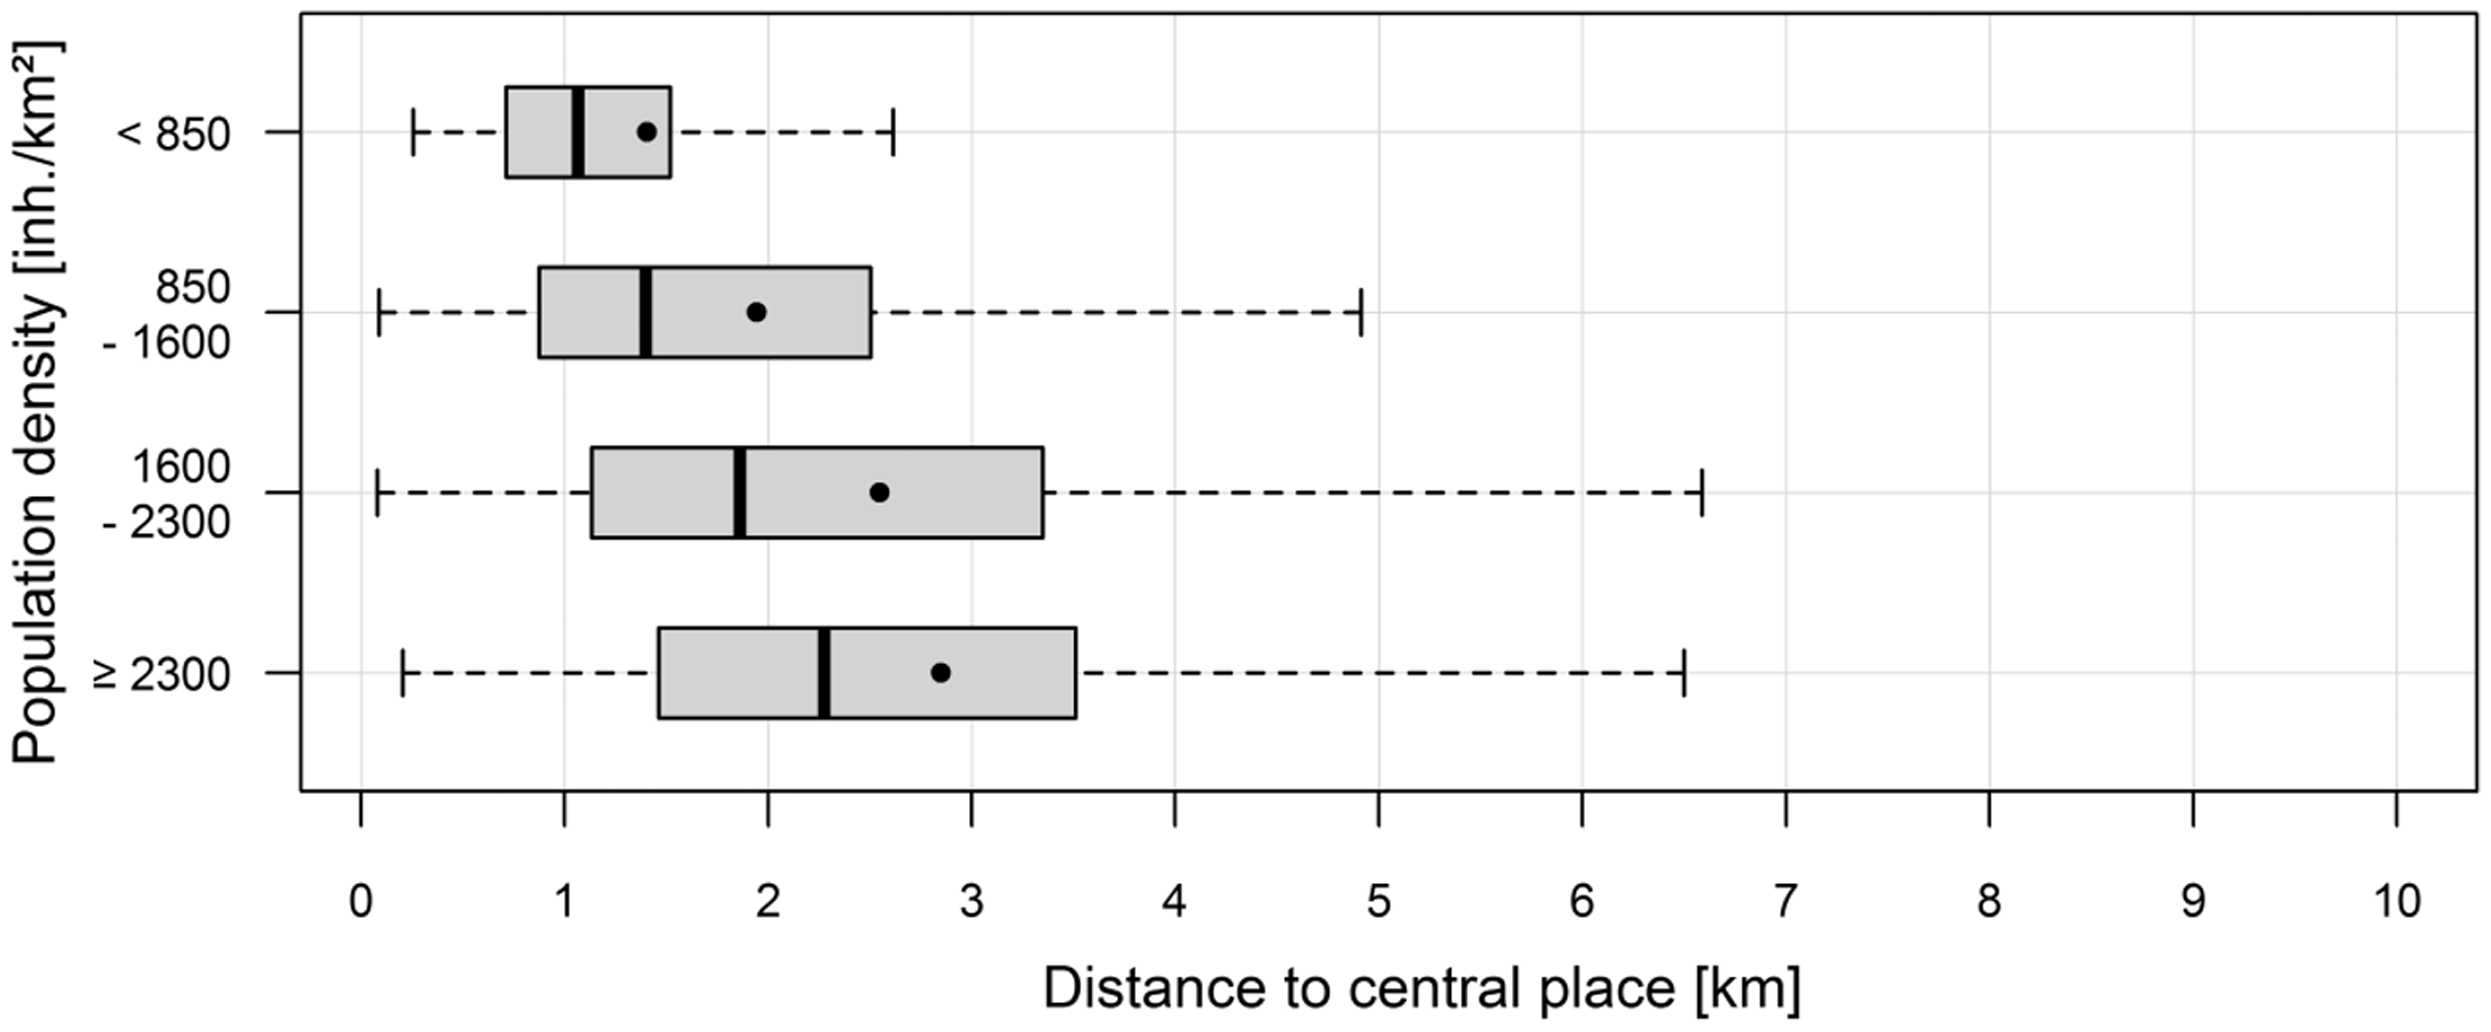
Boxplots of distances between geographic locations of households and the “central place” grouped by the population density. The mean distance values are depicted as black dots inside the boxes.
Inferring the FAR-threshold
In this step, derived distances based on citizens’ perceptions and normalized FAR-density
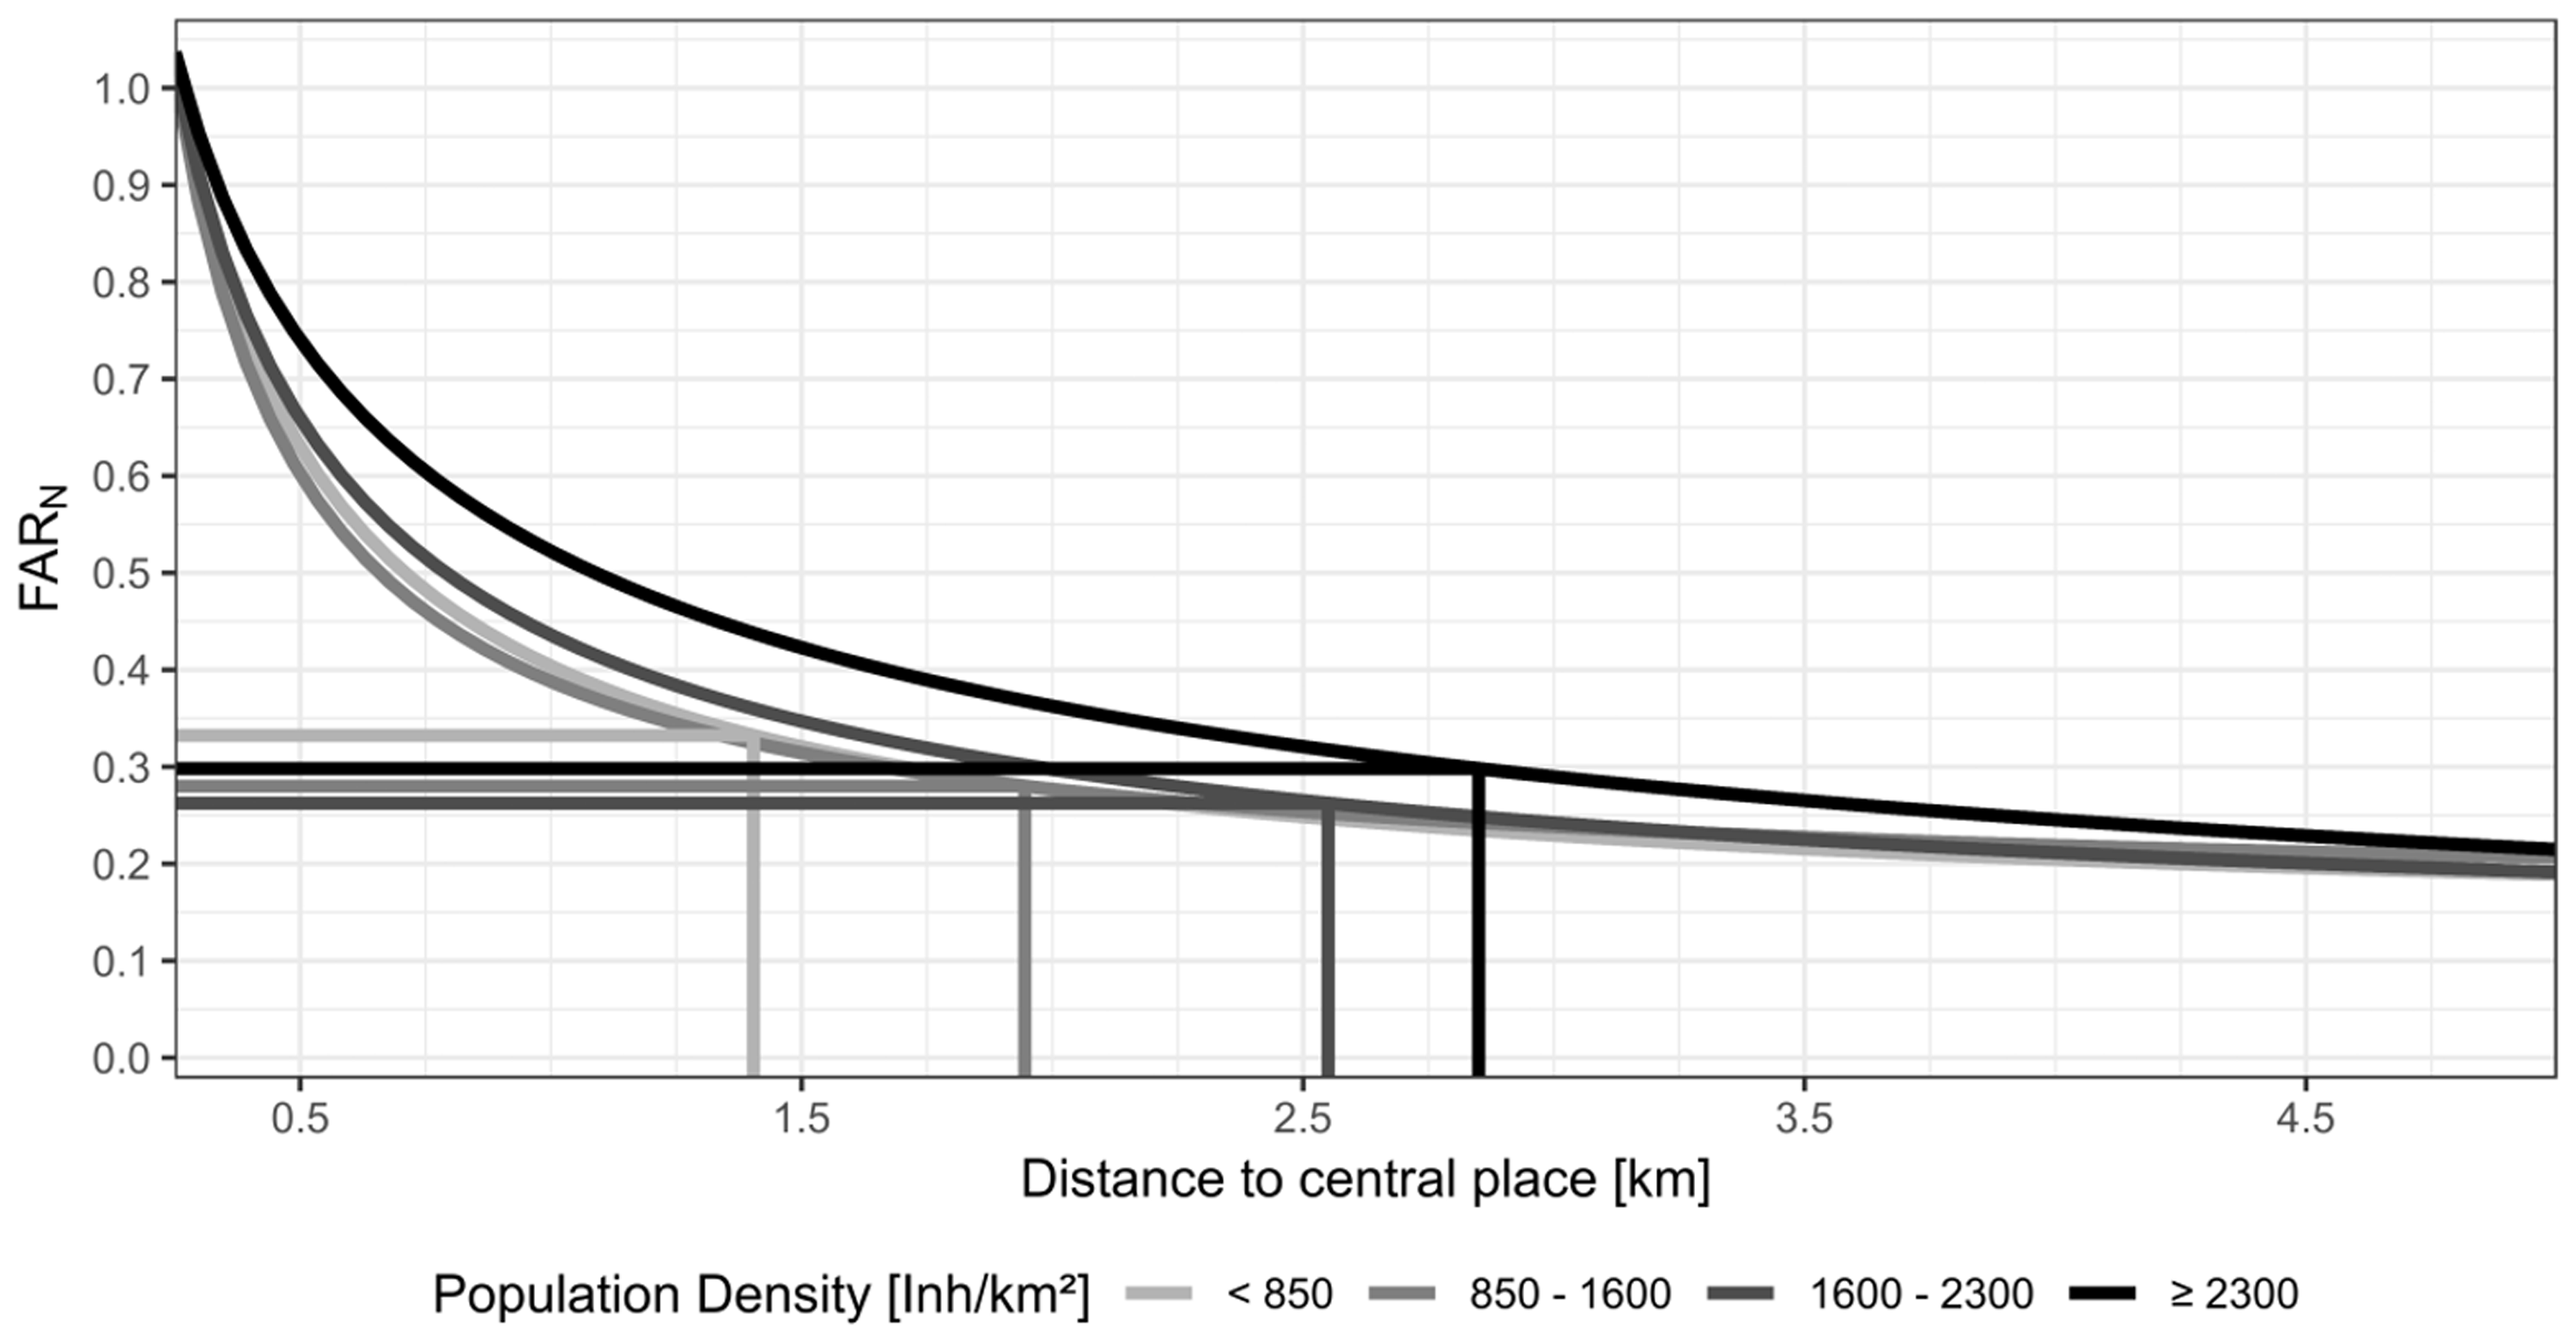
Inferred FAR-thresholds for the four population density classes: gradients represent an exponential function of the decreasing
The shape of the modeled functions varies between the four groups, e.g.
Inferred FAR values for the four groups are depicted in Figure 5. The derived subjective distances to the central place vary between 1.4 kilometers (for the lowest population densities in the first group) and 2.85 kilometers (for the highest population densities in the last group). This accounts for an almost 250% difference in distance from the “central place” across the 67 sample cities. Regarding the inferred
Discussion of empirical findings
General remarks on the approach
What from an initial perspective seems to be a very trivial issue—pointing a city center on a map—becomes easily very complex when generalized descriptions and spatial circumscriptions of city centers are sought. While historical walled cities made a precise spatial demarcation of the city a feasible task, morphological transformations of the urban spatial structure and observed deconcentration processes of urban functions toward polycentric urban structures in European cities complicate this task to a high degree. The debate on defining and spatially delineating city centers takes up on the debate on the fuzziness of geographical places in urban areas which are more or less only qualitatively defined or are merely just spatial concepts at higher level. The underlying challenge of this ambiguity in definitions comes to light especially when entirely different aspects of these geographical places are addressed, such as functional and morphological characteristics. While their precise definition and thus also their spatial delineation is subject to such a broad heterogeneity among scholars, their presence in urban areas cannot be neglected. For most of those geographical concepts, it holds true that they are “hard to define, but you know it when you see it” (Cervero, 2000). This perspective on the issue follows the empirical research on central places, which aims at exploring the organization of urban systems in an analytical way without the restrictions of formal theory (Burger and Meijers, 2012).
In the direction of these related studies, we also embed the presented study on cognitive perception and the urban spatial structure. This study presents an empirical approach to link cognitive perceptions of citizens and the structural density of cities. In this way, the concept of mental maps is integrated into the study design. Mental maps are very relevant because every citizen has his/her own individual perspective of the urban spatial structure and the location as well as the spatial circumscription of the city center. The individual perception of the location and extension of the city center is influenced by each citizen’s unique subjective, personal history and understanding of the urban spatial structure (Rengert and Pelfrey, 1997). From the vast amount of morphological or functional attributes which characterize city centers, each citizen structures the city wittingly or unwittingly in his/her mind.
The presented approach allows for integrating a larger quantity of samples and cities than approaches using in-depth interviews. The latter mostly aim at precise spatial circumscriptions of city centers drawn by participants on a map, mostly as a case study for just one or a few cities (e.g. Lüscher and Weibel, 2012). These approaches may eventually lead to higher spatial precision and they can be analyzed in geographical information systems, but results are mostly restricted to a handful of case studies. Contrarily, our approach cannot predict a precise delineation for individual cities, but aims at associating urban structure and density on a more generalizable level. Therefore, it must be underlined that the inferred distances from cognitive perceptions cannot be transferred back to single cities for comparison with the actual situation since there is only one value for all cities from the same group of population density.
For a meaningful interpretation of this empirical study, general preconditions must be considered and therefore we highlight the following points:
the approach derives a Euclidian distance for finding the extent of city centers. Since only one distance is used, a radial extension of the city center around the most “central place” is assumed together with a circular circumscription of the transition zone around it. Hence, the approach requires the assumption of a monocentric city model which can be more or less accepted for most German cities with similar historic city development (Schlüter, 1899). A linear transfer of the approach to cities with a completely different urban spatial structure, e.g. to polycentric urban structures, appears at this point under consideration of the used data not feasible. for all cities where a discrete delineation of the city center is not possible, a precise association of the respective functional and morphological urban areas into city center and transition zone is beyond feasibility since these measures do not follow a strict concept. Moreover, in today’s cities the transition between the city center and the transition zone is mostly continuous. Therefore, approaches for finding city centers use selected physical and/or functional, quantifiable characteristics of city centers. The perception of citizens integrates all objective and subjective characteristics of each individual’s surroundings. Thus, the vast number of attributes influencing people’s perception is difficult to fit into a model. To account for all these features, the current study relates to citizens’ cognitive perceptions of the city center by the location of their houses.
Findings
In due consideration of the above mentioned aspects, the presented empirical study aims at relating the urban spatial structure to the cognitive perception of citizens. Cognitive perceptions of 2865 households living in a city center are analyzed with regard to their distances to the most “central place” of each city. Subsequently, the derived distance is used to delineate the city centers and intersected with the FAR gradient to infer a FAR-threshold for separating city centers from the transition zone. For comparability between cities, we use the normalized
Conclusion and outlook
The empirical experiments in this study indicate a relation between structural density and cognitive perception of city centers. The study brings data of great heterogeneity together for seeking new insights on the complex urban spatial structure. In detail, an interdisciplinary analysis of spatial and non-spatial data was conducted in the form of a combination of GIS-data and socio-economic survey data. With respect to the data, we performed the analysis for 67 cities with 9.5 million individual buildings to calculate the FAR. Furthermore, response from 11,000 households participating in the SOEP were used to analyze the city centers providing a very large database for the experimental setup of study.
For related studies in the future, to gain even more reliable and transferable results, we propose the use of a higher spatial density of household observations. Furthermore, with respect to future works, while this approach was empirically setup and tested for German cities with similar historic developments, a comparison to cities with different historic development would be of great interest, e.g. to North-American cities featuring CBDs or polycentric urban structures; however, the generation of a representative amount of households data on the individual perception might be the limiting factor. Further, since the current study focuses solely on the morphologic aspects of the urban spatial structure, we propose to extend the study by the integration of additional functional characteristics, e.g. employment density or commerce.
Footnotes
Declaration of conflicting interests
The author(s) declared no potential conflicts of interest with respect to the research, authorship, and/or publication of this article.
Funding
The author(s) received no financial support for the research, authorship, and/or publication of this article.