
Abstract
Tactile paving is vital infrastructure for safe mobility among 2.2 billion visually impaired individuals worldwide, but in complex urban environments it faces both static damage and dynamic encroachment. This study develops an intelligent evaluation framework that integrates visual-language models (VLMs) with pedestrian-view street imagery to assess tactile paving usability around urban metro stations. Using GPT-4o and GoPro-collected imagery, we built a three-tier risk detection system covering the tactile paving body, a 250 mm proximity zone, and the surrounding environment. The framework includes 26 structural and 24 situational indicators with differentiated risk-scoring thresholds. Based on 110 metro stations within Beijing’s Third Ring Road, we analyzed the spatial distribution of tactile paving obstructions. The 250 mm proximity zone showed the highest obstruction rate (34.46%), exceeding the tactile body (33.03%) and environment (19.79%), mainly due to spatial pressure from wall attachments, poles, and adjacent facilities. Structural obstacles reflected persistent damage and encroachment, whereas situational obstacles showed greater temporality, peak intensity, and spatial variability, especially within the proximity zone. AI evaluations closely matched expert ratings (Pearson r = 0.943), and iterative scoring reduced false positives from 54% to 11%, confirming the reliability of VLMs in complex urban contexts. Fengtai District scored poorest in both indicator categories, with Majiapu Station as a key case. We recommend introducing a “proximity buffer zone” and improving fine-scale maintenance in high-density areas. The resulting intelligent platform is scalable and transferable for nationwide monitoring and governance of accessible infrastructure.
Keywords
Introduction
Tactile paving and mobility challenges for the visually impaired
Tactile paving, commonly referred to as “guiding paths,” is an essential component of accessible navigation systems specifically designed for people with visual impairments (PVIs), and it is increasingly recognized as critical infrastructure ensuring safe mobility for the world’s 2.2 billion individuals with visual limitations (Organization, 2022). Due to their limited ability to perceive environmental information visually, visually impaired individuals face considerable challenges during travel, particularly when navigating complex intersections, varied street designs, and interference from both motorized and non-motorized traffic (Bentzen et al., 2020; Ma et al., 2023). Tactile paving plays a vital role in improving their efficiency and safety when crossing streets.
As urban public transportation networks expand, visually impaired travelers face mounting challenges during the first mile, transfers, and last mile (Vega et al., 2025). Areas around metro stations concentrate high pedestrian volumes, buses, bicycles, and walking flows (Commission, 2023), generating frequent transfers and movement uncertainty. Under such spatial pressure and usage intensity, tactile paving systems show increasingly pronounced structural deficiencies and functional challenges (Feng et al., 2023).
From a static perspective, the accessibility and continuity of tactile paving are often disrupted by physical damage, infrastructure aging, and spatial encroachment. Typical situations include the long-term occupation of tactile paths by waste bins and movable municipal facilities, as well as the accumulation of construction materials (Park and Chowdhury, 2018). From a dynamic perspective, tactile paving is frequently affected by temporary and unpredictable obstructions, such as disorderly parked shared bicycles, overgrown tree branches, and temporary illegal parking or construction barriers (Yoon et al., 2025). These disruptions vary greatly in time and location, increasing the unpredictability of travel routes. Thus, tactile paving degradation stems from both long-term structural failures and short-term external disruptions, often beyond conventional design standards and impairing its guiding function. Optimizing usability around metro stations requires a differentiated assessment and intervention strategy tailored to specific conditions across multiple urban dimensions.
Current approaches to tactile path assessment
Research on urban tactile paving identification and assessment generally follows two paths: computer vision-based approaches and field investigations. Early wearable systems for visually impaired individuals mostly relied on image processing and threshold segmentation. Ke et al. (2008) integrated thresholding, color-space segmentation, and texture analysis to extract tactile paving area and direction from sidewalk images for real-time navigation. Later, HSV-based methods enabled wearable cameras to detect tactile paving and obstacles and issue warnings (Ghilardi et al., 2016). Although simple and data-efficient, these methods are less robust under changing outdoor light and diverse surface materials in real-world environments.
With the development of deep learning, researchers began to adopt more advanced models to improve detection accuracy and real-time performance. Yoshikawa and Premachandra (2022) applied the VGG16 transfer learning model to detect tactile paving, achieving an accuracy of 97.50%. With the emergence of large language models, a multimodal convolutional neural network was employed to semantically segment street view images, enhancing the automated identification of sidewalks, crosswalks, and tactile paving networks in urban settings (Hosseini et al., 2023).
These object detection methods primarily help visually impaired users recognize point-based obstacles during walking, but they do not fully capture the overall condition of tactile paths. To obtain broader information, semantic segmentation studies have extracted tactile paving distribution and identified continuity interruptions, improper tile placement, excessive angles, and misalignment (Hu et al., 2020). However, physical form alone is insufficient because dynamic urban factors also affect usability. Lakoud et al. (2024) examined tactile paving occupation by parked vehicles, while Ito et al. (2021) studied assistive facilities that use sound or vibration for safer crossings. Despite progress in algorithm optimization and device interaction, existing studies still focus mainly on individual navigation or single metrics, leaving a need for comprehensive frameworks addressing tactile paving accessibility and continuity in urban environments.
SVI and VLM in urban accessibility mapping
The integration of widely accessible street view imagery (SVI) with vision–language models (VLMs) has opened new avenues for large-scale identification of urban accessibility features. In recent years, SVI has been increasingly utilized in conjunction with machine learning algorithms for remote assessment of facilities such as sidewalks and tactile paving. For instance, Julia Camacho (2022) used Google Street View API to collect roadway images and applied a CLIP-based model to detect features such as accessible ramps, pedestrian crossings, tactile paving, and disability parking signs. Progress has also been made in the automated detection of accessibility components. A real-time monitoring system combining image recognition and sensors was proposed, employing a MobileNetV2 + SSD model to classify facility damage types (Chen et al., 2023).
However, SVI-based visual models still face challenges in real-world assessments, including issues related to image resolution and visual obstructions. To improve detection accuracy, researchers have begun incorporating VLMs for their cross-modal semantic understanding capabilities, enhancing the model’s ability to interpret complex scenes. Most mainstream SVI is captured from motor vehicle lanes, providing limited coverage of sidewalks, plazas, and other pedestrian spaces where accessibility features are concentrated. Consequently, the application of SVI + VLM methods is constrained by image scope and angle. Collecting imagery from perspectives closer to actual user experiences can enhance recognition accuracy and yield more comprehensive assessments. This study adopts pedestrian-perspective imagery as the primary data source for model development.
Research gaps and objectives
Current urban tactile paving monitoring and assessment still face several limitations. First, existing studies focus mainly on static tactile-paving features and give limited attention to surrounding conditions, so temporary obstructions such as construction barriers, shared bicycles, and street vendors are often missed. Second, vehicle-mounted street view imagery often fails to capture ground-level details because of its height and angle. Third, many single-modality vision models perform poorly under occlusion, lighting variation, and cross-scene shifts (Raghu et al., 2024), whereas multimodal models show greater robustness (Zhou et al., 2020). Finally, governance still relies on manual inspection and post hoc repair, with limited channels for public reporting, uploading, and tracking accessibility issues.
This study aims to develop a method that integrates vision–language models (VLMs) with street view imagery (SVI) to evaluate the usability and accessibility of tactile paving around urban metro stations. It focuses on two core research questions: (1) To what extent can the integration of structural and situational indicators provide a more comprehensive reflection of tactile paving usage conditions near metro stations? (2) How effectively can VLMs substitute traditional field surveys by enabling automated recognition and assessment of key indicators? To address these questions, we construct a composite evaluation index that captures both embedded structural risks and situationally induced risks. We then compare model outputs with expert assessments to analyze hallucination rates and alignment with human judgment.
Data and methods
Study area and data collection
This study examines areas within 100 m of 110 metro station entrances inside Beijing’s Third Ring Road (Figure S1 in the Supplementary Material). These spaces, marked by dense transport nodes, varied street layouts, and high spatial use, face challenges from underground utility works and uneven facility upgrades, resulting in inconsistent tactile paving continuity and usability. The sampling strategy captures representative real-world conditions and key accessibility issues.
To capture actual tactile paving conditions around metro entrances, this study used a pedestrian-network-based data collection strategy. Street-level videos were recorded within a 100-m buffer around each entrance from a pedestrian perspective, focusing on sidewalk infrastructure, tactile paving, surrounding obstacles, and walkability. A Python algorithm extracted static frames from continuous video streams at 20-s intervals. Each frame was standardized to GoPro’s default resolution (1920 × 1080 pixels), and image stabilization reduced walking-related blur and jitter, improving clarity under dynamic recording conditions.
During image composition, the vanishing point of the tactile paving was precisely aligned with the geometric center of each frame, creating a visual axis oriented along the tactile path. This composition strategy maximized the spatial information density of the surrounding environment. The methodological design aims to overcome the inherent limitations of vehicle-mounted street view imagery in terms of spatial coverage and detail resolution. By strengthening data acquisition from a ground-level perspective, the study provides standardized visual references for assessing tactile-paving layout, usage status, and its relationship with adjacent objects, while the spatial interpretation remains a VLM-guided semantic assessment rather than pixel-level segmentation or metric reconstruction.
Defining faulty tactile paths at the street level
This study focuses on the accessibility challenges faced by people with visual impairments (PVIs) in areas surrounding metro stations, using vision language models (VLMs) to explore image recognition methods with improved precision and robustness. Drawing on the concept of the “accessibility chain” (Cohen et al., 2024) and the theory of “environmental disability” (Mace, 1996), the research highlights the importance of ensuring continuous and uninterrupted accessibility from origin to destination for visually impaired individuals. Although the current national Accessibility Design Code (China., 2012) offers general guidance, it lacks adaptability in addressing dynamic disturbances, micro-barriers, and infrastructure aging. There is a clear need for more operational and specific recognition indicators.
To address this, the study defines a “malfunctioning tactile path” as a walking route disrupted by physical defects, spatial interference, or lack of guiding information in real urban settings. A three-level identification system is established based on spatial proximity and risk type, covering the tactile paving itself (typically 600 mm wide under national standards), the 250 mm surrounding zone, and the broader environment. We selected this 250 mm buffer because it equates to over 40% of the standard path width and serves as an essential safety margin for white cane detection. It incorporates both structural and situational obstacles to provide standardized classification logic for risk modeling and automated detection.
Structural indicators are long-term barriers caused by design flaws in tactile paving or adjacent infrastructure, often resulting in complete interruptions. Examples include broken tiles, misleading steps, manhole gaps, missing segments, or interference from walls and poles that hinder white cane detection. Environmental factors such as narrow sidewalks, curb height differences, damaged pavement, construction debris, and illegal parking are also included for their impact on continuous movement. Situational indicators are temporary or dynamic obstructions with sudden, unpredictable characteristics, such as pedestrian crowding, randomly parked shared bicycles or scooters, street vendors, and portable signs. Without clear guidance or alternate route information, these can cause confusion and blocked movement for visually impaired individuals.
In data labeling, all visible structural and situational obstacles in each image are documented, with the most visually prominent and navigation-disruptive obstruction selected as the primary label. This ensures annotation consistency and model performance, enabling effective classification of tactile path barriers.
Prompt-based scoring and threshold calibration
The workflow leverages large language models’ semantic reasoning and output formatting to build an efficient, scalable image analysis pipeline, reducing manual annotation needs and creating a structured data foundation for accessibility maps based on crowdsourced street-level imagery (Table S2 in the Supplementary Material).
This study employs GPT-4o with Base64-embedded images and structured prompts to constrain visual interpretation to predefined tactile-paving indicators, including surface damage, path interruption, proximity-zone encroachment, and environmental obstruction. Object detection, tactile-paving delineation, obstacle identification, and 250 mm proximity-zone judgment were implemented as VLM-guided visual-reasoning tasks rather than independent pixel-level segmentation, object-detection, or metric 3D measurement modules. The 250 mm zone was judged by whether detected objects overlapped with, touched, or immediately adjoined the tactile-paving edge, using the 600 mm standard paving width, centered image composition, and expert-calibrated thresholds as spatial references. To reduce reliance on contextual cues alone, the prompts required the model to first identify the visible tactile-paving body and edge, and then judge obstacle position and buffer-zone encroachment (Figure S3 in the Supplementary Material). GPT-4o and the expert panel evaluated each image using the same QID-based indicator system and output standardized risk scores from QID: 0.0000 to QID: 1.0000. Each score Si ∈ [0,1] represented the likelihood and severity of issue i, where 0 indicated no visible risk and 1 indicated a clearly identifiable and severe obstruction or defect. In total, 23 experts in accessible design, urban planning, and barrier-free facility assessment participated in this validation process.
In preliminary tests, a binary 0/1 scoring scheme was first applied, but the model often hallucinated when multiple similar elements appeared in an image, incorrectly identifying issues. Under binary scoring, ∼54% of 100 sampled images showed inconsistencies or clear deviations from human judgment, markedly reducing accuracy. To enhance reliability and assess uncertainty associated with model dependence, continuous scores were compared with human annotations, and a stratified 25% subsample was further examined through sensitivity and ablation analyses, including complex visual conditions, contextual-region removal, viewpoint variation, and alternative prompting strategies. Discrepancies emerged for certain issue types (Table S5 in the Supplementary Material), especially in cases of ambiguous boundaries or low color contrast. For instance, for bricks with similar colors or indistinct edges, lowering the threshold to 0.25–0.3 improved alignment with human interpretation.
Based on this analysis, we introduced two differentiated thresholds tailored to the nature of the issue for discretizing risk scores (Figure S2 in the Supplementary Material): • •
Accordingly, we constructed the following Boolean function to transform continuous scores Si ∈ [0,1] into discrete values Bi ∈ {0,1} for modeling and statistical analysis, as shown in equation (1):

If a score for a given issue code is not returned, it is treated as missing and assigned Bi = 0 to prevent null values from disrupting evaluation. By setting optimal thresholds for each issue type, continuous risk scores are converted into actionable classification labels, improving both consistency and practical usability. For quantitative assessment, we defined the Composite Risk Impact Index (CRII) for each spatial tier or station as the mean proportion of positive labels across the applicable issue codes, CRIIj = (1/nj) ΣBi,j, where higher values indicate stronger composite obstruction impact. Output visualization used bar charts with issue categories on the horizontal axis and either occurrence frequency or the proportion of “1” classifications on the vertical axis. This revealed distribution patterns of tactile paving obstructions across metro station samples, providing an intuitive basis for urban accessibility assessment (Figure 1). Framework for tactile paving obstruction assessment based on multi-dimensional classification and language model scoring.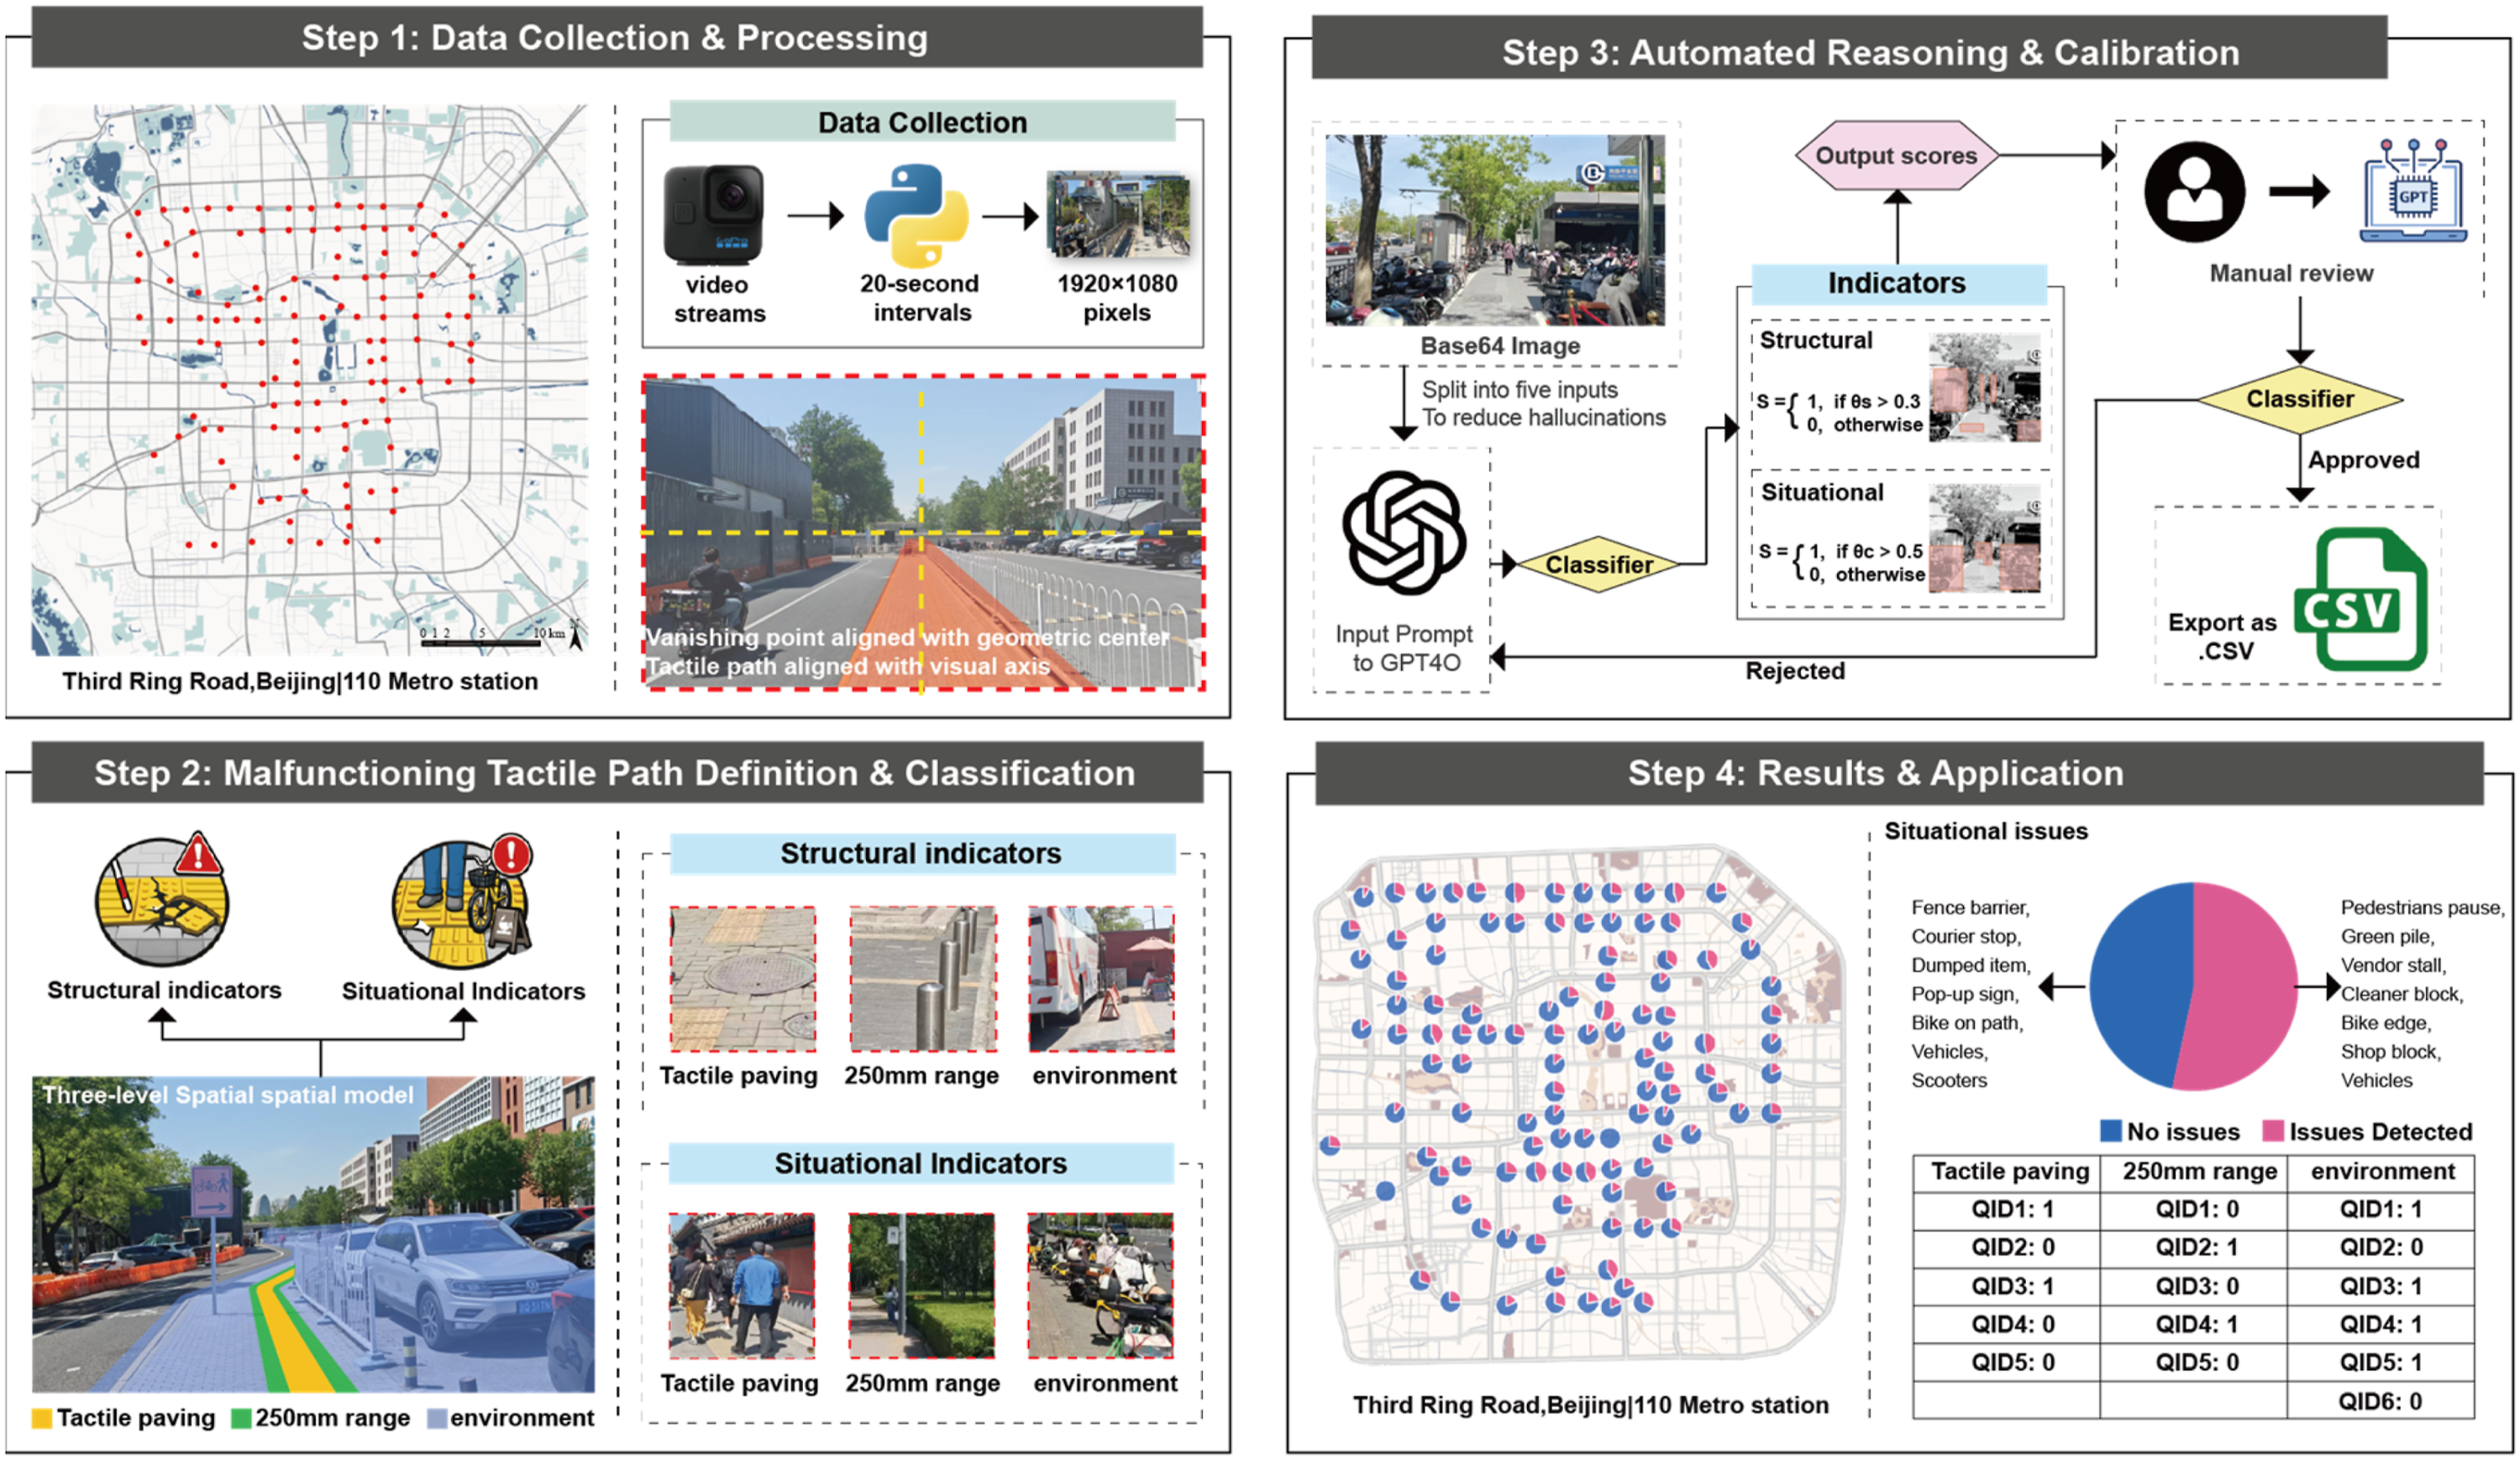
Results
GPT and expert scoring
All raw model outputs were saved in .txt format for future tracking, semantic extraction, and performance analysis. Corresponding binary scoring results for each image, B = [B1,B2,…,B8], were stored in .xlsx files, with the first column recording image filenames and subsequent columns representing specific issue codes (QIDs), enabling statistical modeling, visual analysis, and spatial data integration. To evaluate the consistency between AI-generated scores and expert assessments, the 23 expert ratings were averaged for each image and QID as the human reference score, discretized using the same issue-specific thresholds as the model outputs, and then compared with GPT-4o results using inter-rater reliability metrics and Bland–Altman analysis. As shown in Figure S4 in the Supplementary Material, the results indicate a high degree of agreement between the two. The Pearson correlation coefficient reached 0.943 (95% CI: [0.912, 0.967]), and the intraclass correlation coefficient ICC(2,1) was 0.898 (95% CI: [0.854, 0.933]), demonstrating strong overall consistency between AI and human ratings (p < 0.001) (Table S6 in the Supplementary Material).
The Bland–Altman analysis further confirmed this agreement, showing a mean bias of −0.0024 with 95% limits of agreement ranging from [−0.018, 0.013], indicating minimal differences. Additionally, the root mean square error (RMSE) was calculated as 0.021, suggesting a low overall deviation between AI and human scores in numerical terms (Table S1 in the Supplementary Material). In the stratified 25% sensitivity and ablation sample, agreement remained high overall, but declined when contextual regions were removed, viewpoints were altered, or prompts were simplified, indicating that both visual context and structured language reasoning contributed to model performance (Table S3-S4 in the Supplementary Material).
Tactile paving monitoring results across all study sites
This study conducted a hierarchical probability assessment of tactile paving-related issues in the areas surrounding metro stations across five districts in Beijing: Chaoyang, Haidian, Dongcheng, Xicheng, and Fengtai. Following the proposed analytical framework, CRII values were calculated for three spatial dimensions: the tactile paving itself, its immediate 250 mm proximity zone, and the broader surrounding environment. These tier-specific CRII values correspond to the reported obstruction probabilities and were used to compare composite risk levels across spatial scales and administrative districts. These results were visualized through statistical charts to facilitate quantitative comparisons across spatial scales and administrative districts.
Spatial analysis of structural obstruction risks
Figure 2 illustrates structural obstruction probabilities across districts and spatial scales. The 250 mm proximity zone showed the highest average probability of tactile paving-related issues (0.287), followed by the broader environment (0.253) and tactile paving body (0.183), a pattern consistent across all five districts. Chaoyang and Fengtai had the highest proximity-zone means (0.362 and 0.343), while Haidian remained below 0.200 at all levels. Tactile paving body issues averaged 33.03% and peaked in Xicheng (37.82%), mainly due to material aging, construction inaccuracies, and design flaws such as cracked tiles, misaligned paths, and manhole-cover interruptions near turning points and station entrances. The 250 mm zone’s 34.46% obstruction rate pointed to adjacent facilities, including walls, poles, bins, and utility boxes, as key risks caused by spatial compression; Fengtai and Dongcheng led here (36.41% and 36.06%). Environmental issues averaged 19.79% (SD about 8.55%), with Fengtai highest at 26.80%; these included nonstandard curbs, narrow sidewalks, damaged pavement, and missing buffers that collectively impeded visually impaired navigation. Distribution and spatial patterns of structural tactile paving obstruction probabilities across districts and spatial scales.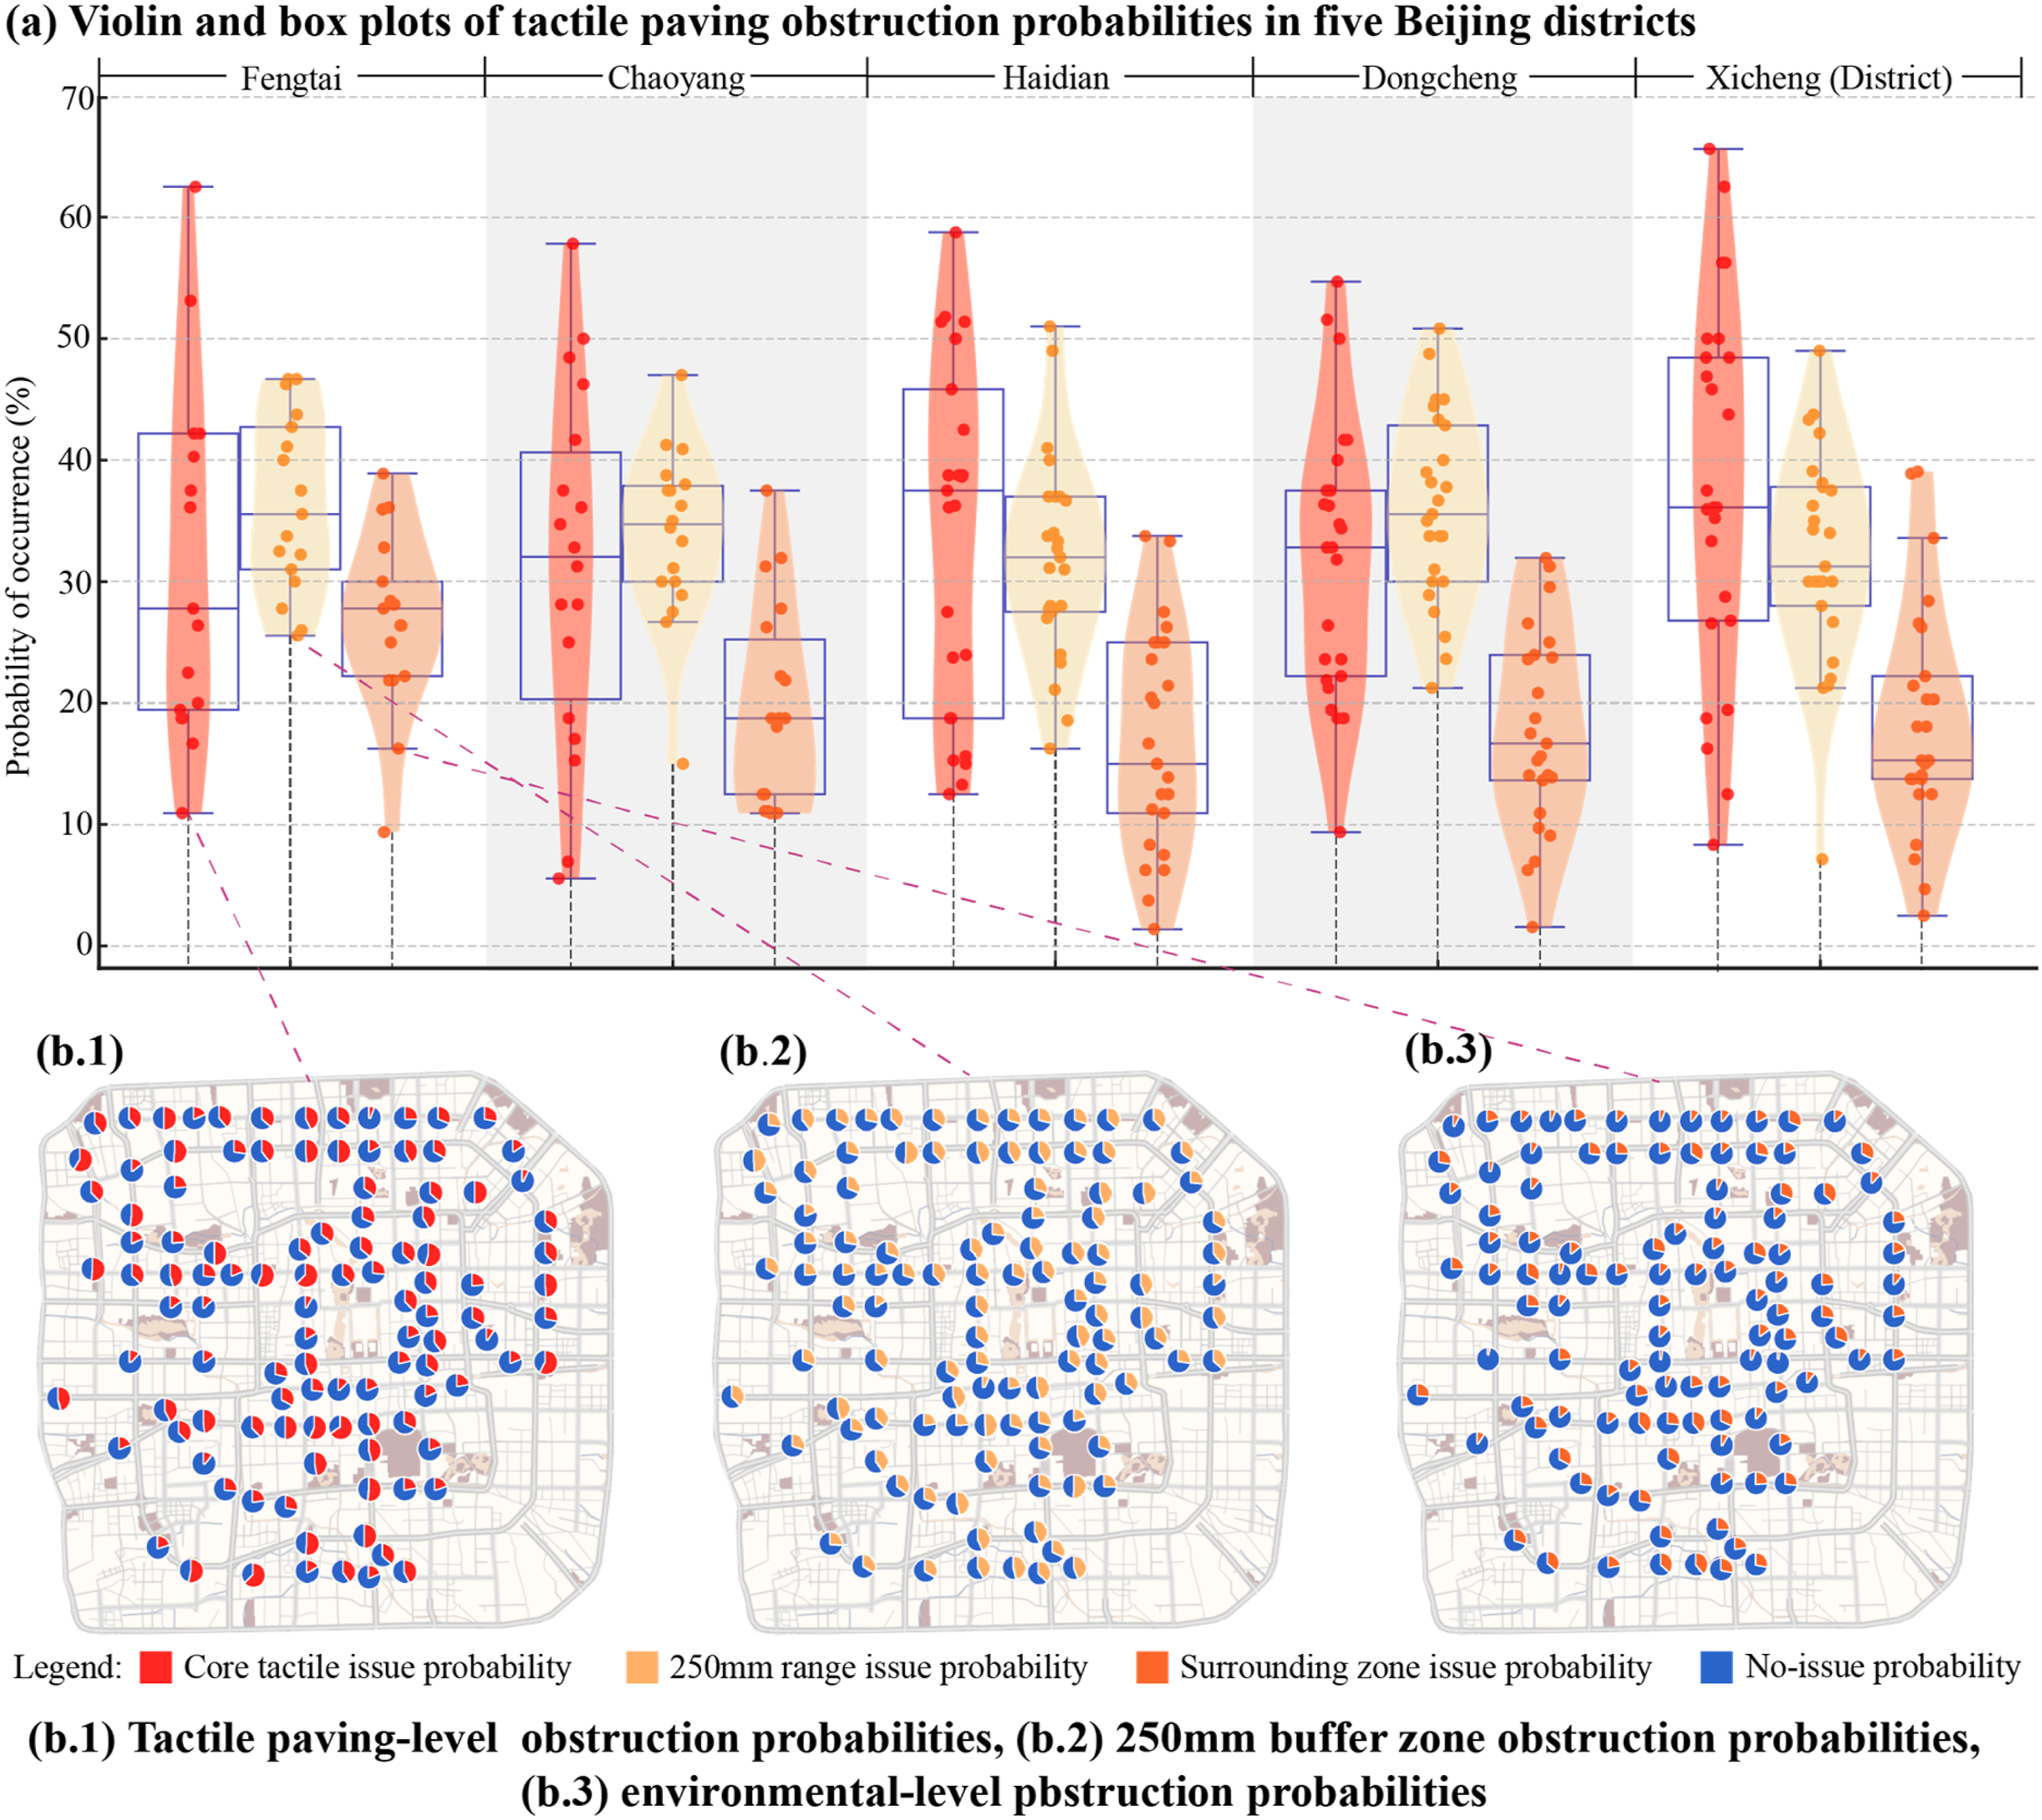
Distribution and dynamics of situational obstruction risks
To explore the spatial distribution and risk structure of these issues, Figure 3 presents a detailed analysis of situational tactile paving barriers around metro stations across three spatial dimensions. Specifically, the spatial maps (Figure 3 b.1-b.3) explicitly map these probabilities at the station level across the network, revealing micro-spatial clustering patterns that district-level statistics alone cannot capture. This geographic visualization is essential for identifying localized risk hotspots and guiding targeted, site-specific urban enforcement. Based on the findings shown in the visuals, situational issues exhibit greater dynamism, variability, and governance complexity compared with structural obstacles. Beyond what is directly presented in the charts, it is important to note that these problems are often caused by human-related factors such as encroachment, temporary storage, or disorder in traffic operations. Distribution and spatial patterns of situational tactile paving obstruction probabilities across districts and spatial scales.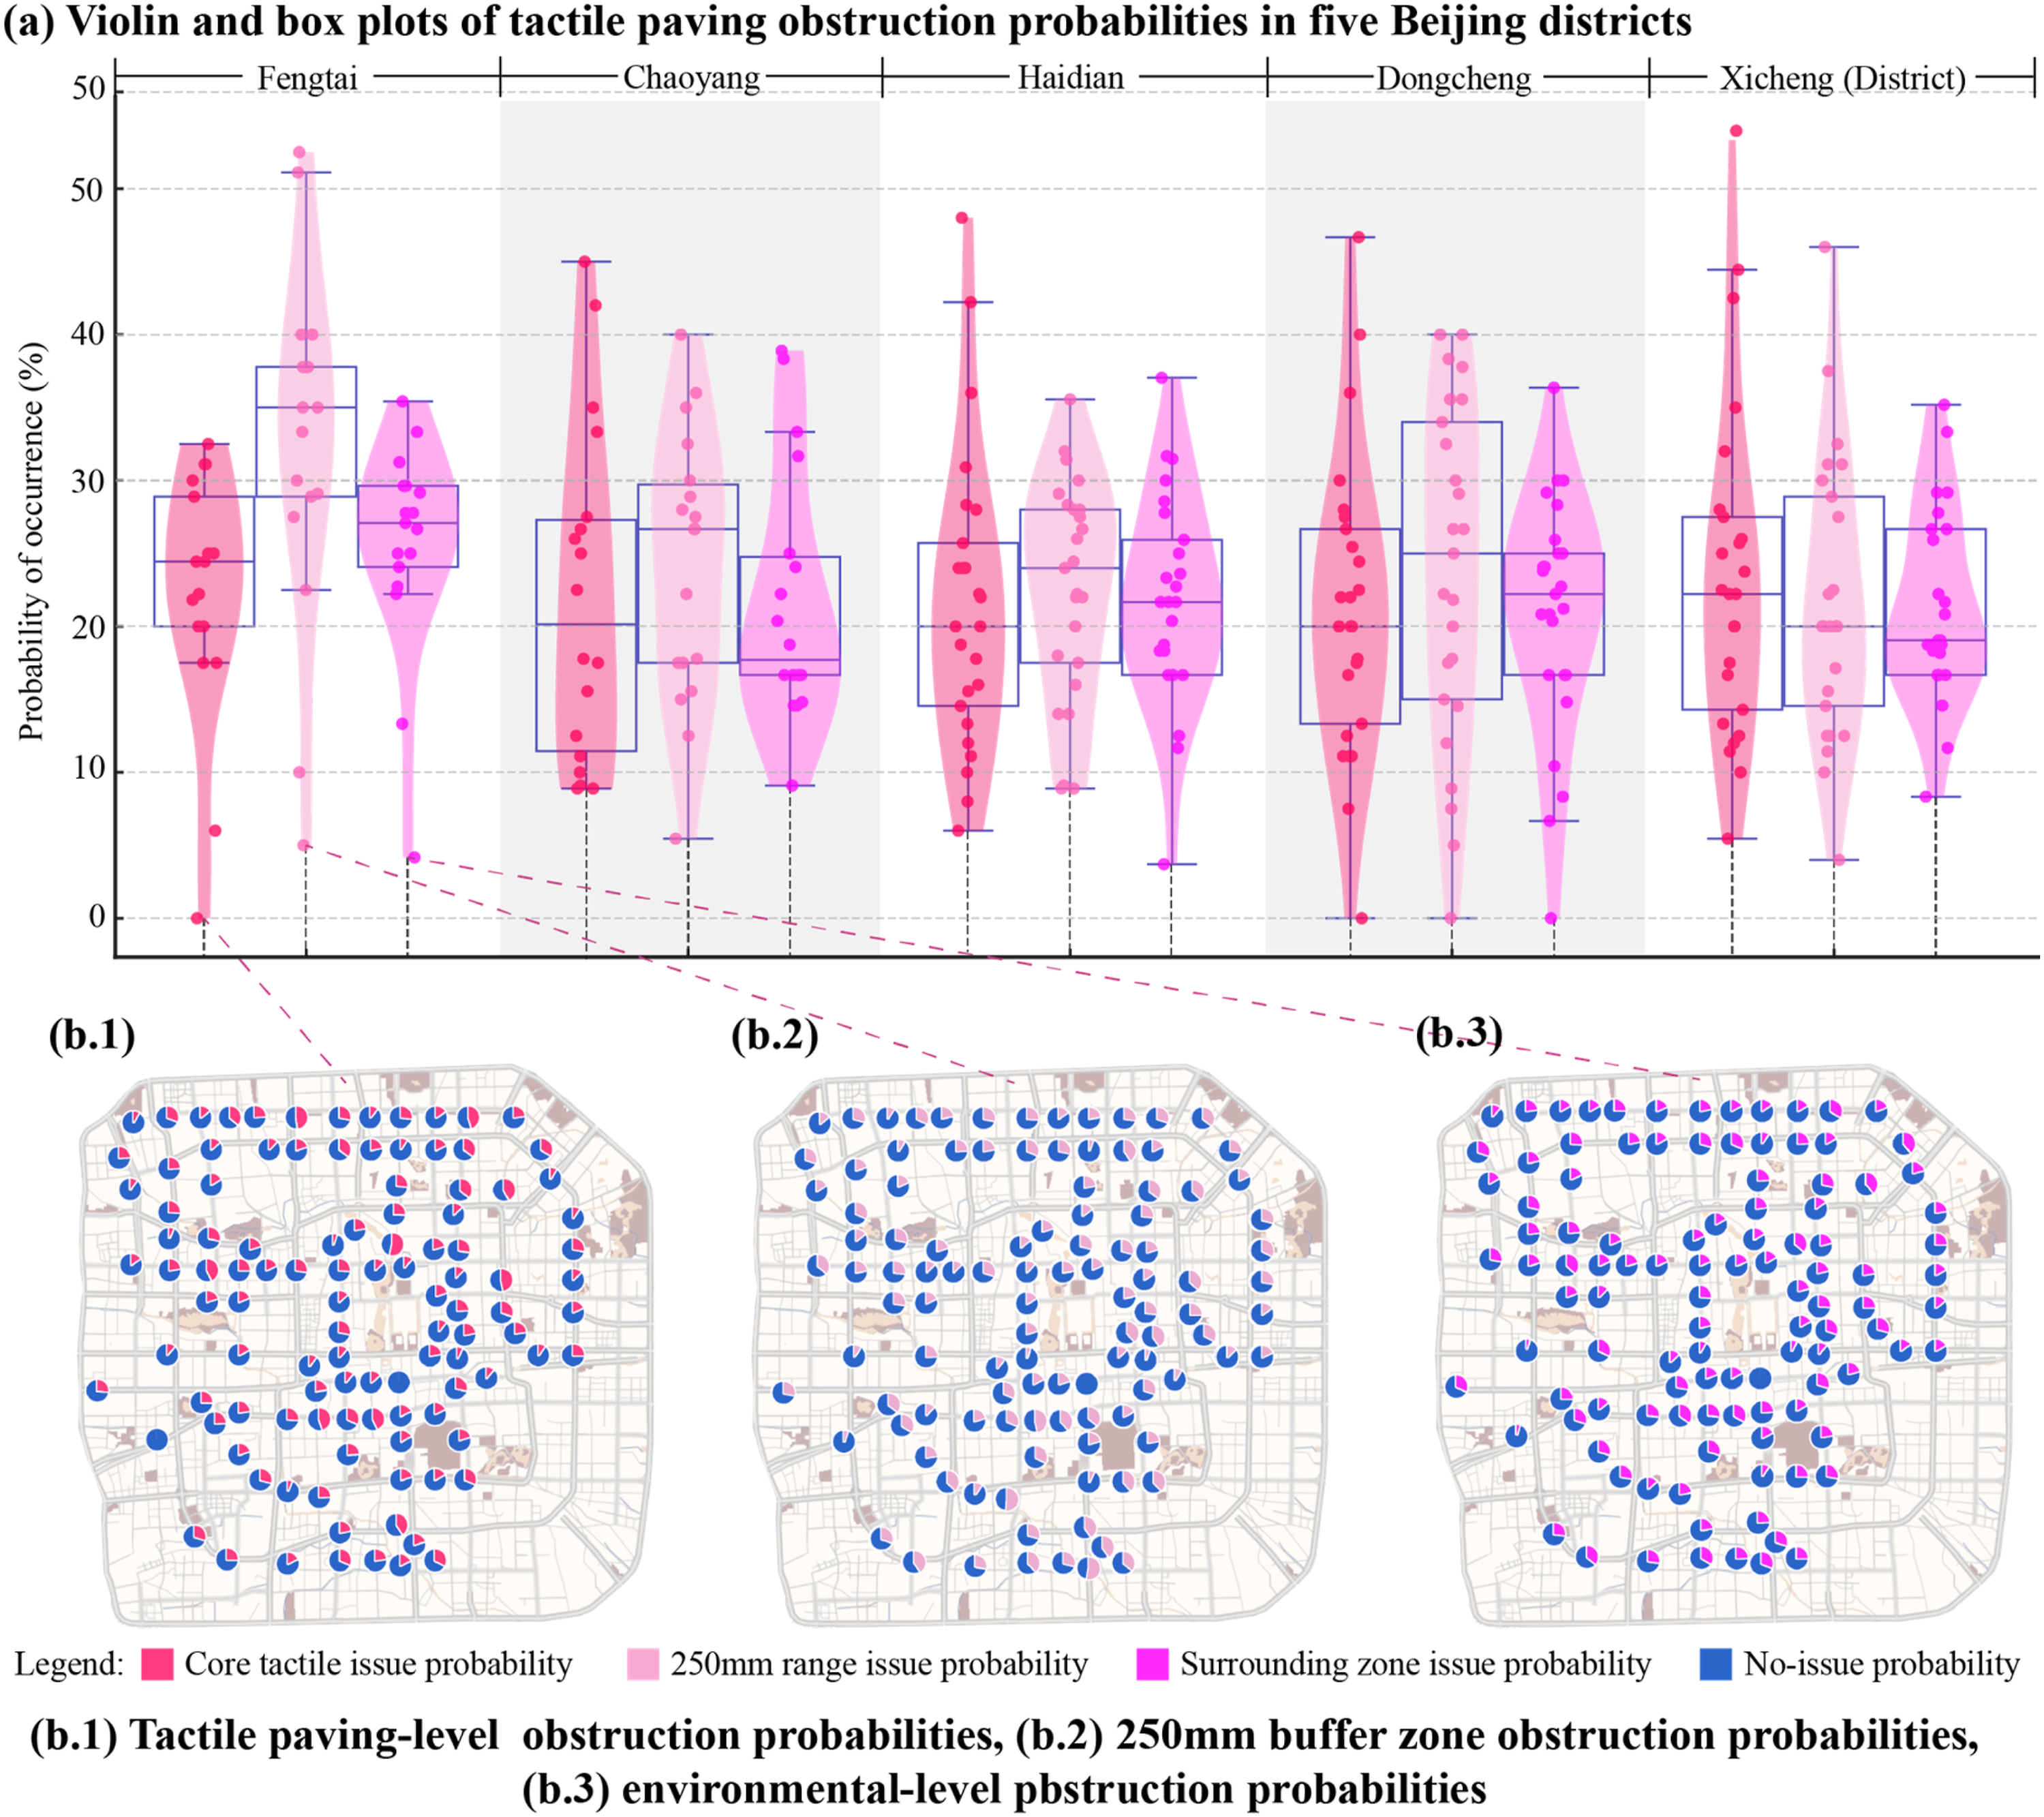
At the tactile paving level, situational issues are relatively limited, with an average occurrence rate of 22.04% across the five districts. Common obstacles include temporary halts by couriers, pedestrians, or delivery vehicles, typically found near metro station entrances, commercial zones, or areas where tactile paving overlaps with pedestrian walkways (Dewi Junita Koesoemawati et al., 2025). The data indicate that Xicheng District has a slightly higher rate at 23.33%, while Haidian (21.54%) and Dongcheng (21.19%) show lower risks. The standard deviation remains around 10%, suggesting a moderate degree of predictability and potential for targeted intervention. These problems are often concentrated near traffic hotspots and during peak hours, and may be addressed through time-specific regulations and intelligent monitoring systems.
The 250 mm proximity zone remains the highest-risk area for situational issues, averaging 24.91%, above both the tactile paving and environmental levels. Fengtai District shows the most severe problems (32.54%), nearly 11 percentage points higher than Xicheng, the lowest at 21.58%. The high standard deviation (10.67%) indicates marked variability across locations. Common obstructions include electric scooters, shared bicycles, construction barricades, and street vendors temporarily occupying the tactile path edge. These issues are shaped by spatial management leniency and enforcement strength, characterized by high mobility, complex origins, and limited regulatory capacity. Addressing them requires digital governance tools and proactive infrastructure planning for early prevention.
At the environmental level, situational issues average 22.98%, similar to the other two spatial levels, but with the smallest standard deviation (7.61%), indicating a more balanced distribution across metro station sites. Typical problems include sidewalk garbage accumulation, construction sites without detour guidance, and nonmotorized vehicles that, while not directly blocking the tactile path, still restrict pedestrian space. These are slow-onset disturbances. Fengtai again records the highest rate (25.54%), likely linked to greater informal space use and unclear enforcement in peripheral areas. Other districts—Haidian, Chaoyang, Dongcheng, and Xicheng—show similar rates, suggesting these issues relate more to street-level operational systems than to physical space constraints.
Localized analysis of tactile paving around metro stations
Figure 4 illustrates the spatial characteristics of tactile paving obstructions and urban contextual factors, focusing on Majiapu Station in Fengtai District as a representative case for micro-level analysis. The selection of this site is firmly grounded in the data presented in the visuals. First, as shown in Figure 4(c), Fengtai District showed higher average scores for both structural and situational barrier indicators compared to other districts. Second, the heatmap results (Figure 4(b)) indicate that Majiapu and its surrounding stations exhibit significantly higher overall obstruction scores than other areas within Fengtai. Building on this macro-level context, Figure 4(a) explicitly details the spatial distribution of obstruction probabilities at Majiapu Station, highlighting broader accessibility issues that are not immediately apparent without localized assessment. Spatial characteristics of tactile paving obstructions and urban contextual factors at Majiapu Metro Station.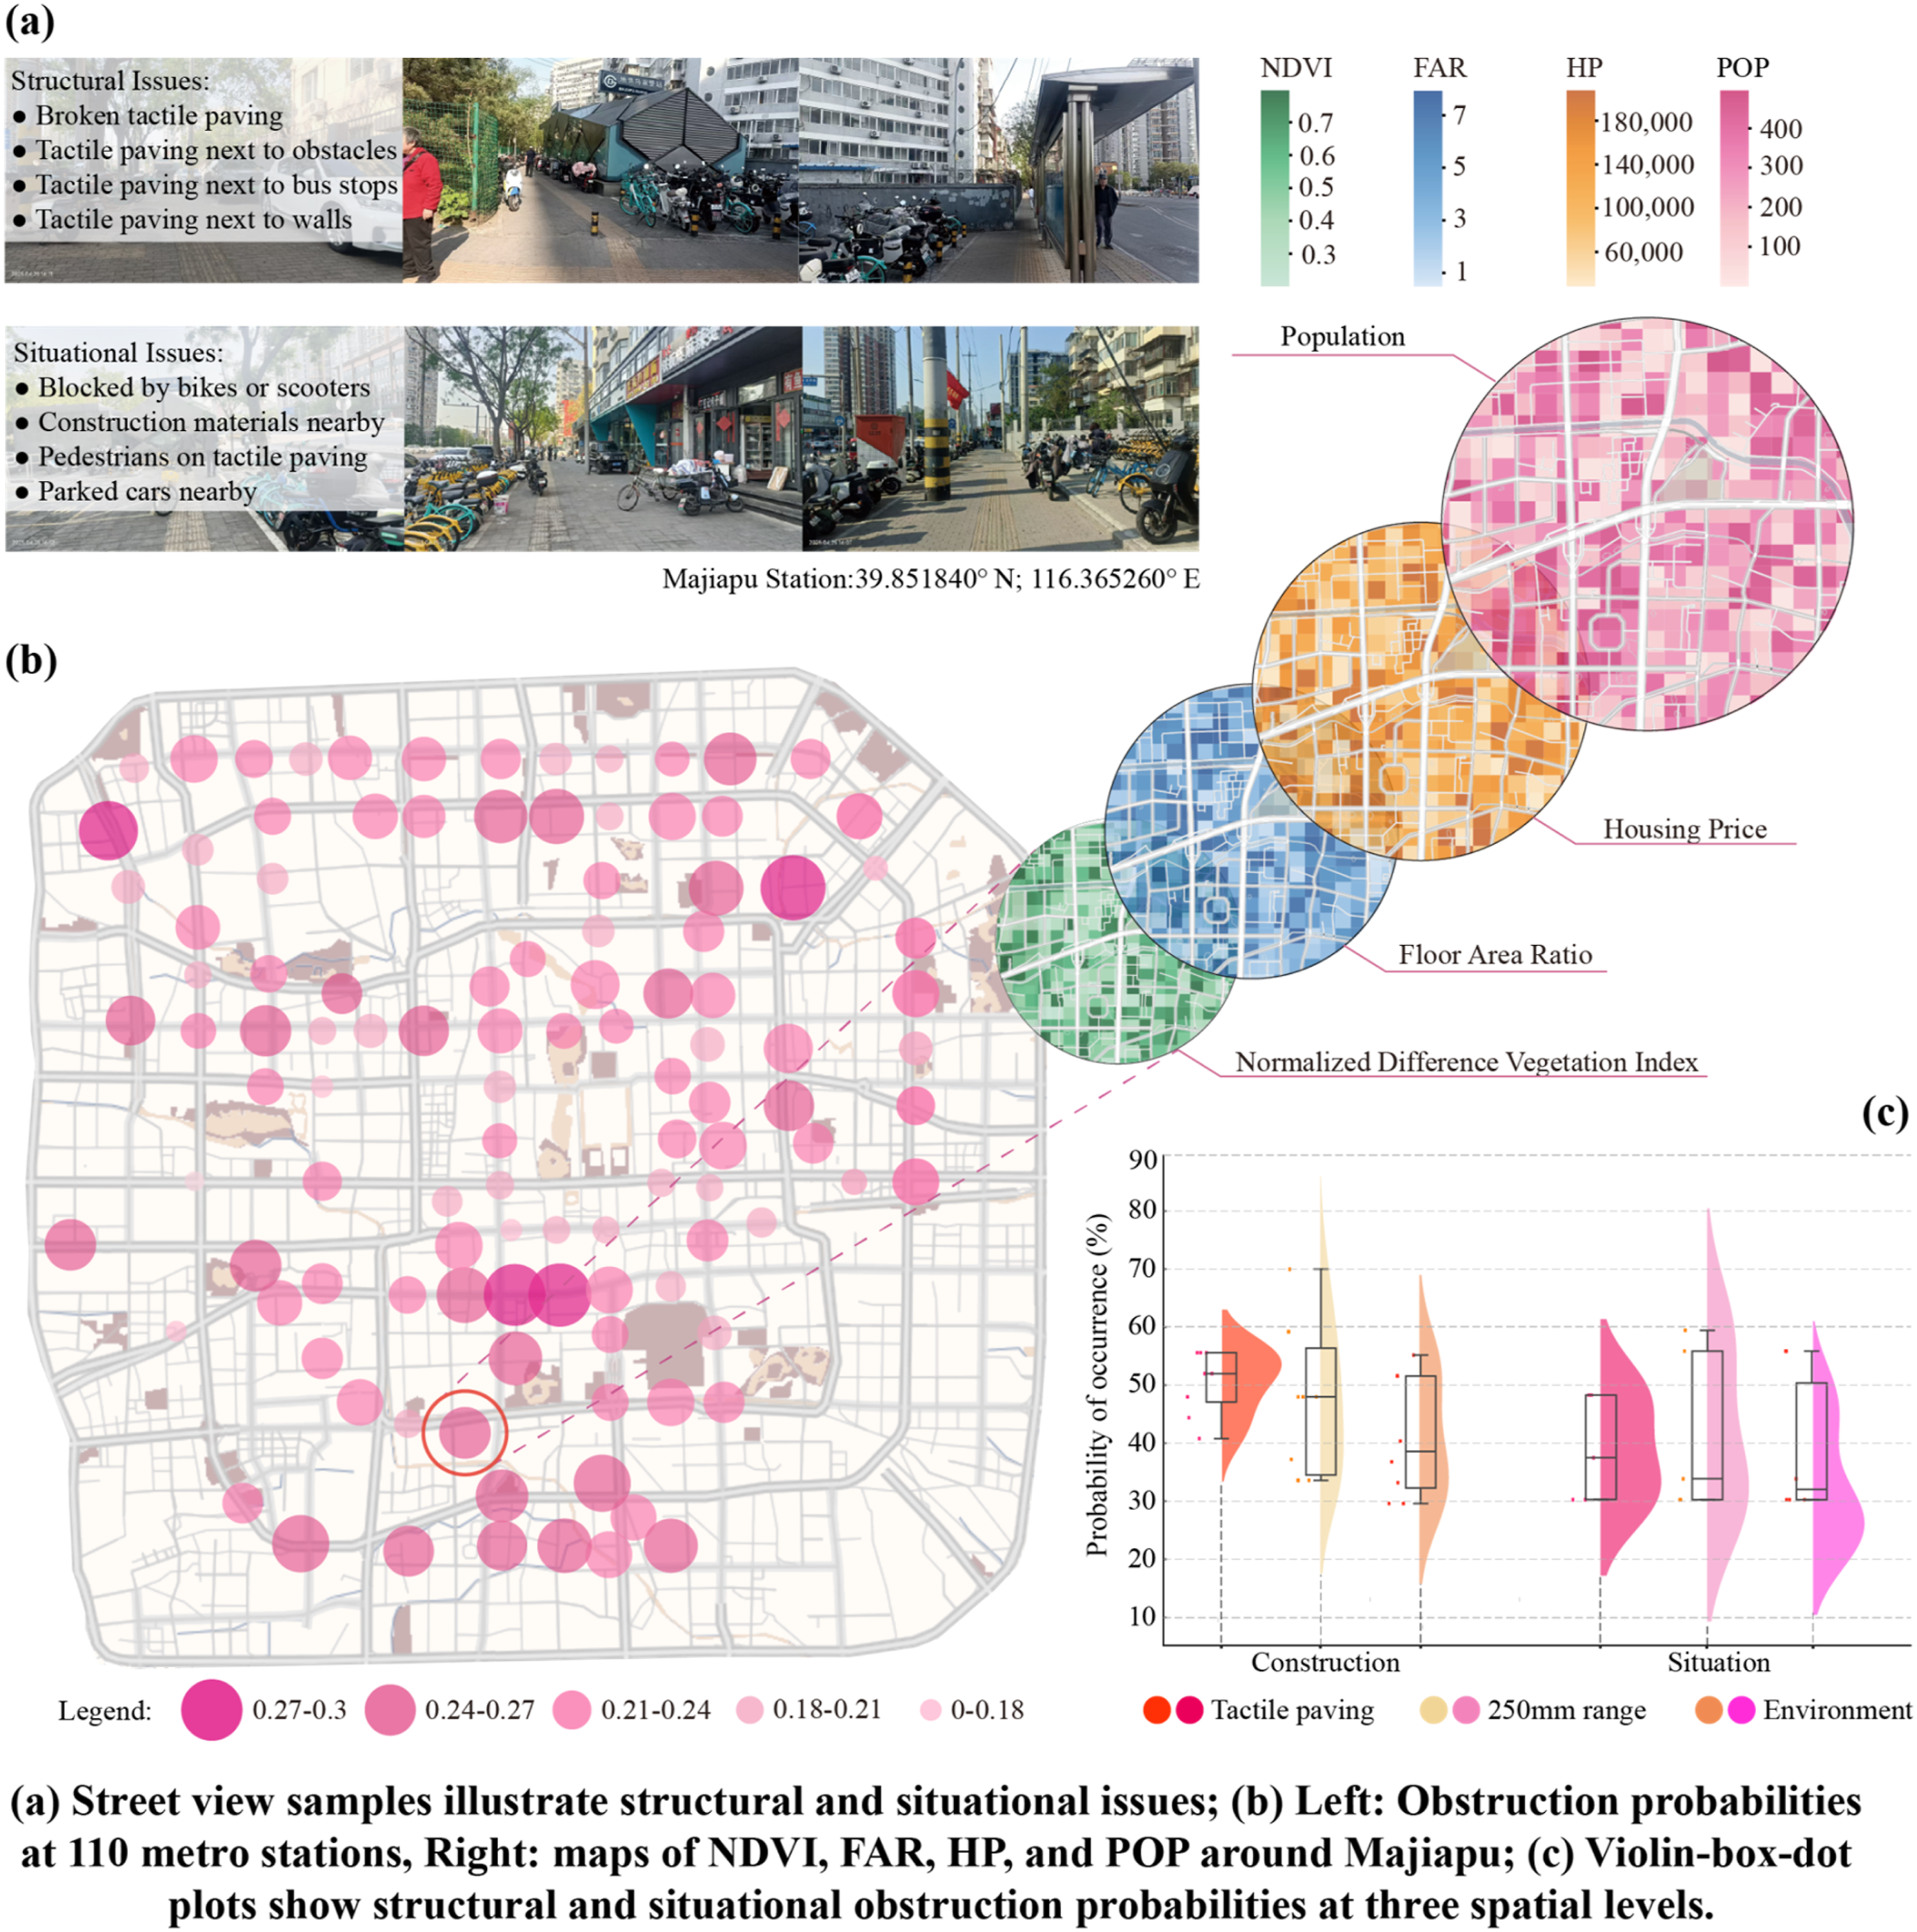
Structural problems are primarily concentrated within the tactile paving itself and the 250 mm proximity zone. Several individual barrier items exceeded a probability of 0.6, with spatial patterns that are both dense and continuous. In contrast, although the obstruction rate at the environmental level is slightly lower, it shows greater fluctuation, reflecting the impact of temporary factors such as illegal parking, street vendors, or discarded items.
Within the 250 mm proximity zone, walls (item 2.1.1) and lamp posts or signage poles (item 2.1.5) exhibited the highest obstruction probabilities, reaching 0.74 and 0.68, respectively (Figure 4(c)). These are the primary contributors to disrupted continuity of pedestrian paths. In the tactile paving layer, misleading directional cues (item 1.1.5) and surface damage (item 1.1.1) were the most prominent issues, exposing legacy design flaws and maintenance deficiencies. At the environmental level, the most frequent problems were vehicle encroachment (item 3.1.8) and ground surface damage (item 3.1.6), although their overall probabilities remained lower than those of structural issues, suggesting that such problems are more sensitive to governance and enforcement intensity (Figure S2 in the Supplementary Material).
Each spatial level exhibited distinct risk characteristics. The median obstruction probability in the 250 mm proximity zone was 0.45 with a standard deviation of 0.29, indicating both high intensity and volatility. The tactile paving layer had a median of 0.34 with a more stable distribution, reflecting persistent design-related issues. In contrast, the environmental level showed a lower median of 0.13 with relatively low variance, indicating that most disturbances were occasional and context-specific. Image labeling followed the principle of identifying the “dominant obstruction type” to avoid the confusion of multi-label classifications and to enhance consistency. High-risk zones were concentrated at corners, station entrances, and areas with dense shared infrastructure.
Majiapu is situated in a transitional urban zone characterized by high population density, moderate housing prices, medium floor area ratio (FAR), and low NDVI (Figure 4(b)). Integrating these macro-level urban metrics is crucial, as they reveal how socio-spatial pressures and constrained street spaces systematically drive the micro-level accessibility failures observed in our data. Key findings include the following: • In areas with FAR greater than 3.0, the mean obstruction probability in the 250 mm proximity zone increased by approximately 12%, suggesting that high-density built environments tend to compress pedestrian boundaries. • In zones where NDVI is below 0.2, the probability of perceived pathway obstructions significantly increased, indicating reduced visual contrast and greater difficulty in tactile path recognition. • Housing prices showed no significant negative correlation with obstruction probability, implying insufficient resource allocation for monitoring and maintenance. • Population density exhibited a weak positive correlation with structural barriers, suggesting that in high foot traffic areas, infrastructure is more vulnerable to wear and disruption.
In summary, the correlation between these urban metrics and obstruction probabilities suggests that Majiapu is a “proximity-interference-dominated” hotspot, where high-density indicators like FAR and population density directly drive accessibility failures. More importantly, the challenges observed at Majiapu, quantified here through FAR, POP, and NDVI, are not isolated but rather symptomatic of broader accessibility trends in compact, high-density urban environments.
Discussion
Theoretical innovation in urban accessibility assessment through the integration of VLM and SVI
First, this study developed a task-specific vision–language reasoning workflow rather than a new foundation VLM. The framework couples GPT-4o with pedestrian-perspective street imagery, an accessibility-oriented indicator ontology, and a constrained prompt-scoring-validation procedure. Image observations are parsed against predefined structural and situational indicators, transformed through continuous scoring, graded thresholds, and discrete labeling, and then checked against expert annotations. Building on recent studies showing that pretrained VLMs and large-scale SVI datasets support zero-shot urban inference and comparative streetscape analytics (Huang et al., 2024), our results indicate that VLMs can recognize multidimensional accessibility risks when constrained by predefined indicators and expert-calibrated thresholds. The model identified risks such as wall encroachment and shared-bike obstruction with strong expert agreement, although this reflects applied task performance rather than full transparency of internal reasoning. Pedestrian-view GoPro data also reduced the height and angle limitations of vehicle-mounted imagery and enabled high-level semantic interpretation with limited computational resources.
Secondly, consistent with recent evidence on barriers faced by visually impaired pedestrians in urban streetscapes (Cushley et al., 2025) and the accessibility-chain perspective (World Bank, 2025), the study introduced a three-tier spatial analysis framework consisting of the tactile paving body, the 250 mm proximity zone, and the broader environment. Based on this, a comprehensive system of 26 structural and 24 situational indicators was established, along with the Composite Risk Impact Index (CRII) for quantitative assessment. This operationalized the concept of continuous accessibility by incorporating spatial scale distinctions and weighted indicators, enhancing practicality and providing a standardized basis for comparative studies across cities and scenarios.
Thirdly, the study built and released a high-quality urban tactile paving dataset covering 110 metro station areas in central Beijing. Captured with GoPro devices at 1920 × 1080 resolution, the dataset includes expert annotations and raw GPT-4o outputs, forming a complete and transparent data pipeline. It serves as an authoritative benchmark for developing deep learning algorithms targeting micro-scale accessibility infrastructure, with substantial scholarly and practical value. Nevertheless, the present study does not provide mask-level segmentation accuracy such as IoU or boundary error; future work should develop manually annotated tactile-paving and buffer-zone masks to test whether VLMs can support explicit geometric localization across cities and imaging conditions.
Furthermore, to address inherent dataset limitations such as spatial blind spots and perspective biases, this study conceptualizes a citizen-centered, bottom-up street view image collection framework (Figure 5). Recent participatory AI research has shown that community-generated street-view data can improve streetscape inclusivity assessment by incorporating user perspectives into scalable image analysis (Mushkani and Koseki, 2026). Similarly, empowering the public to capture and upload street-level images during daily routines can enhance spatial coverage and viewpoint diversity. While the detailed deployment of this intelligent detection platform falls outside the primary scope of this paper, the prototype illustrates a critical pathway for fostering data co-production and multi-stakeholder collaborative urban governance in future accessibility monitoring. User interface design of the participatory obstruction detection app.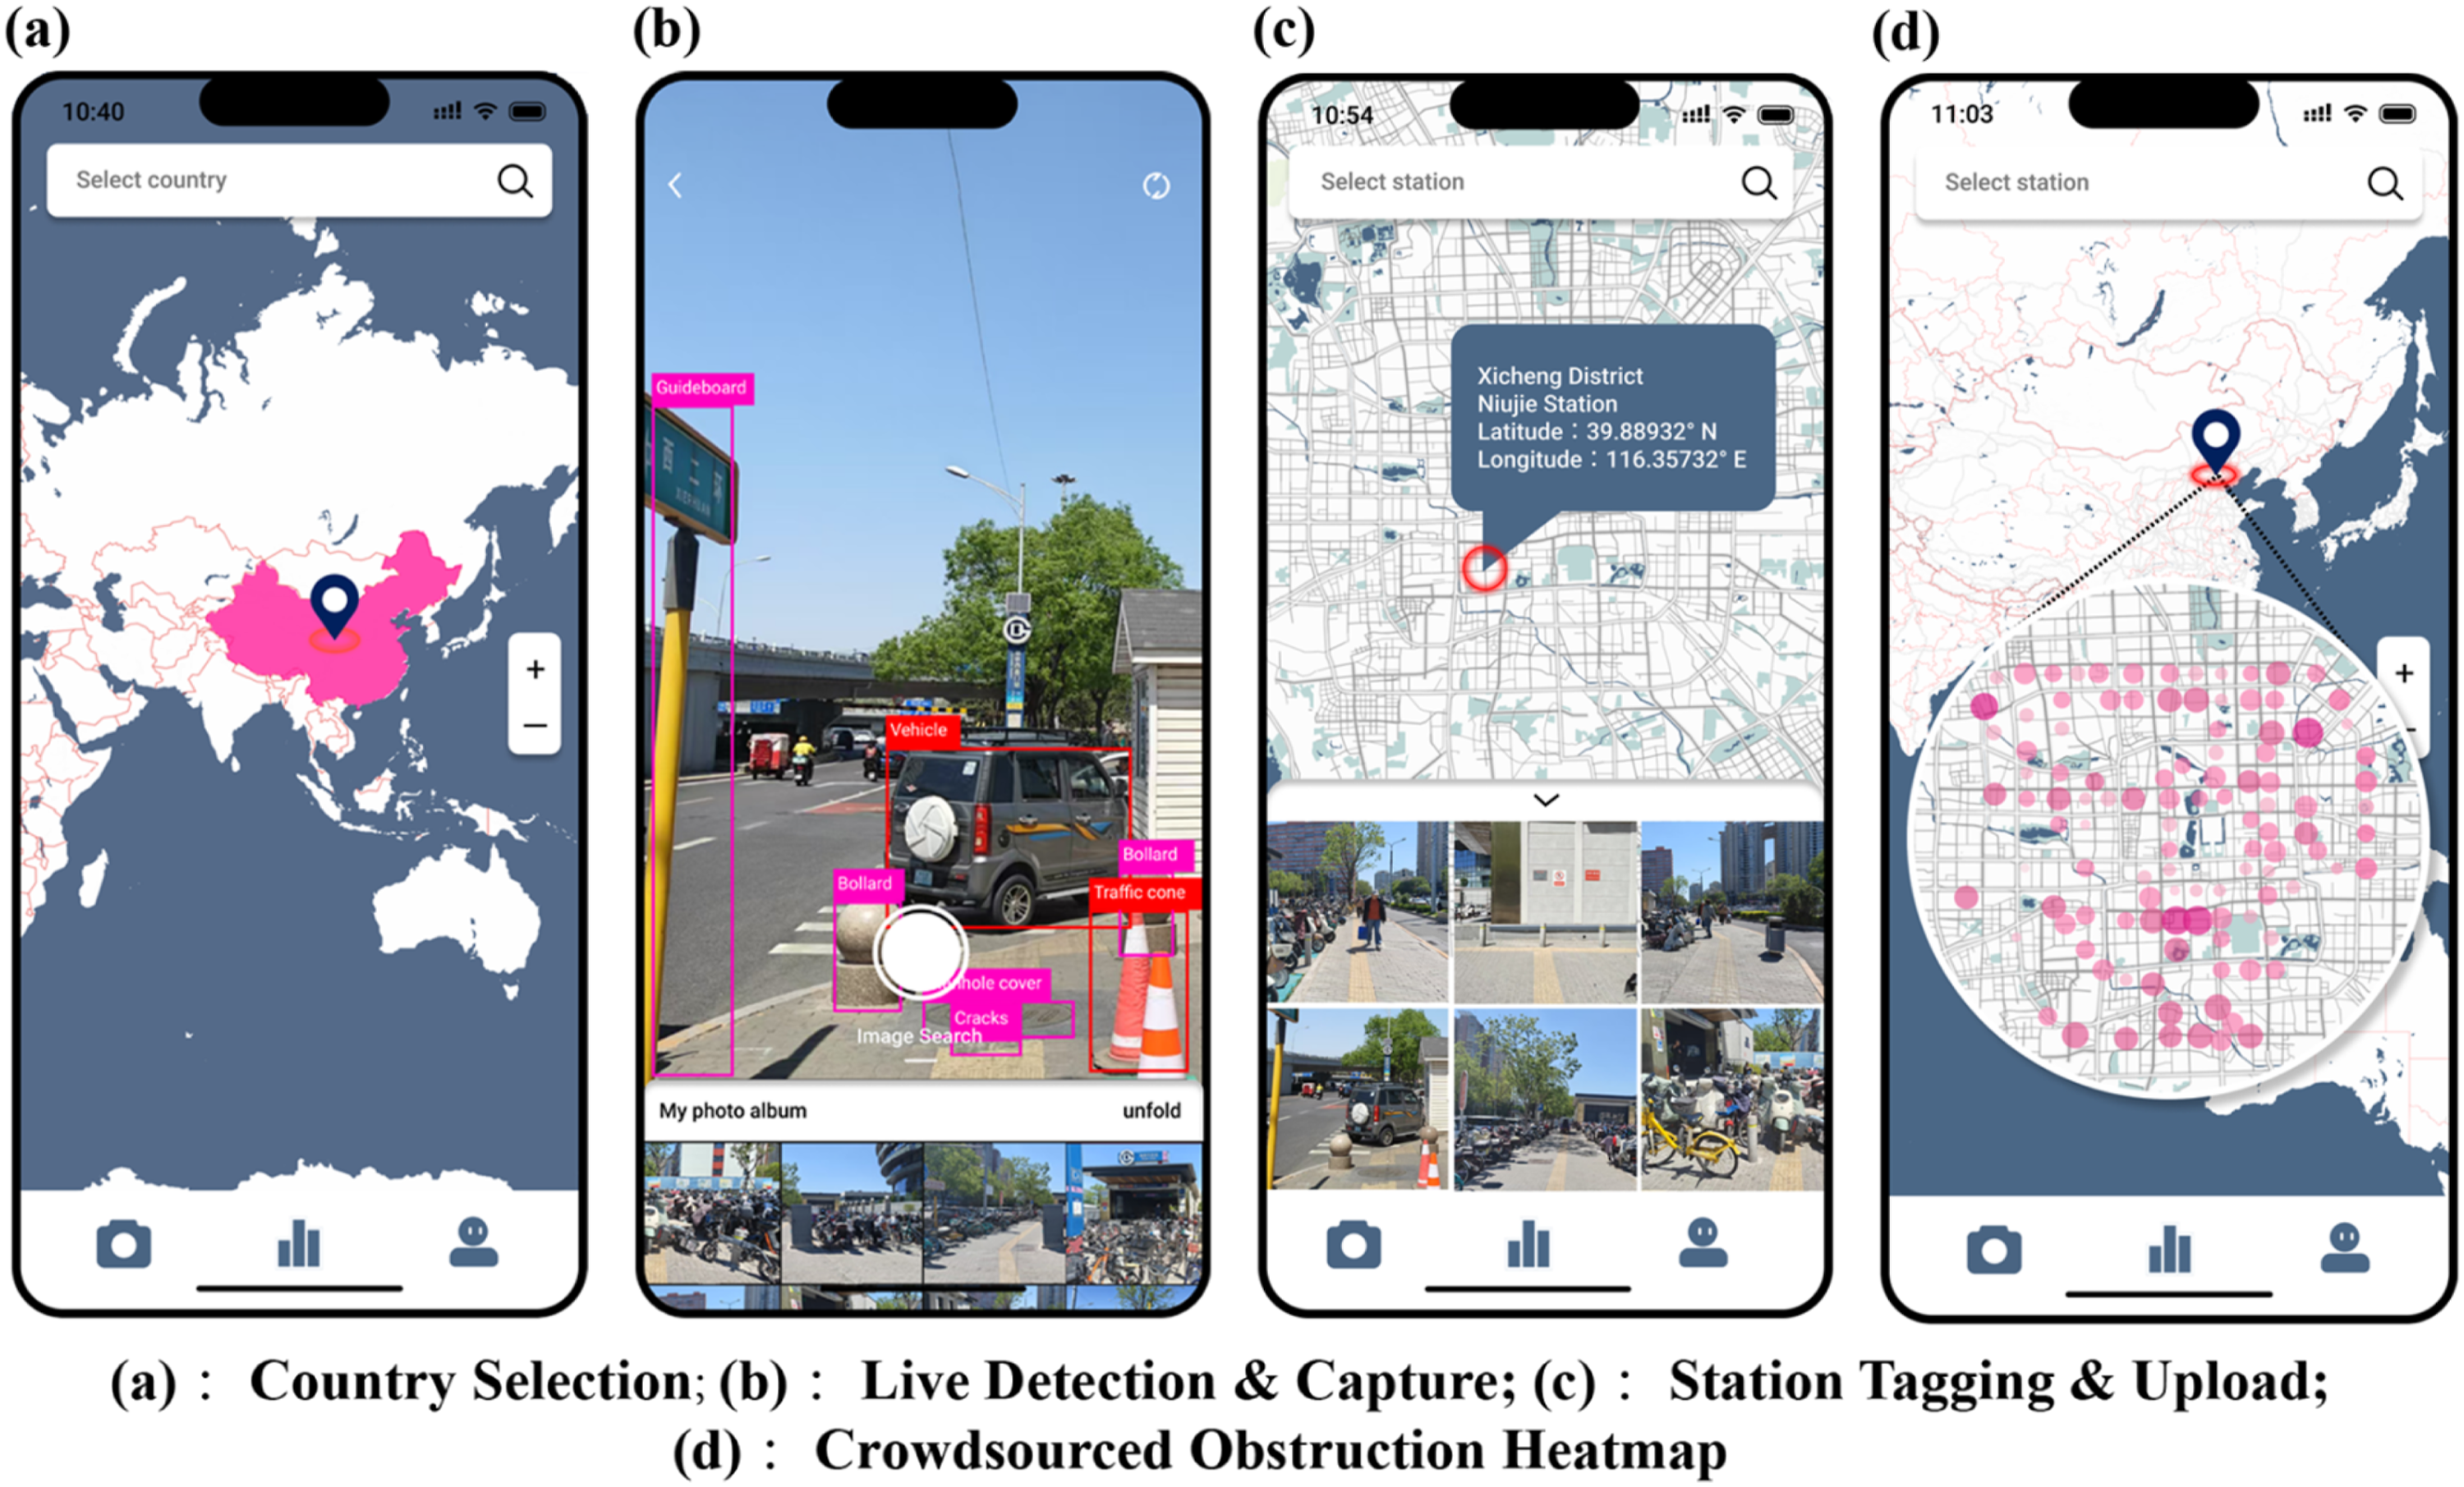
Practical effectiveness and system advantages
Compared to previous models, the tactile paving classification framework developed in this study was more closely aligned with the operational needs of environmental management departments. The proposed intelligent model enabled automatic identification and classification of various obstruction types, providing robust technical support for local governments in formulating efficient remediation strategies. In real-world applications, the system demonstrated three core advantages: (a) (b) (c)
Policy recommendations for improving urban tactile paving governance
This study provided empirical evidence and governance insights to guide urban accessibility policy and planning. The 250 mm proximity zone emerged as a high-incidence area for both structural encroachment and temporary occupation, with frequent, volatile risks such as wall-side compression, pole intrusion, and disturbances from shared bicycles and electric scooters. This finding is consistent with recent work showing that street-level barriers, construction obstructions, and inaccessible visual environments can substantially affect mobility and route planning for visually impaired pedestrians.
The study recommends adding a “tactile paving proximity buffer zone” indicator to the Standards for Urban Road Accessibility Infrastructure Configuration to define spatial constraints and directional requirements for adjacent facilities. Incorporating this into municipal evaluation systems could shift governance from isolated point-based compliance to an integrated, continuous framework. Risks were particularly high in dense districts such as Chaoyang and Fengtai, highlighting the need for targeted interventions and resource allocation. Older residential areas, commercial clusters, and transport hubs frequently obstructed by shared mobility devices and temporary facilities should be prioritized for refined maintenance and protection. A spatially informed approach enables optimized patrols and resource deployment, focusing limited capacity on urgent locations. This differentiated governance strategy improves policy targeting and effectiveness while maximizing the impact of accessibility management under fiscal constraints.
Limitations and future research directions
Although this study established an automated assessment workflow for the usability of tactile paving around metro stations by integrating VLMs with SVI, the framework should be understood as an applied reasoning and evaluation pipeline rather than a newly trained vision–language model. GPT-4o provided the underlying multimodal perception and language reasoning capacity, while the study’s methodological contribution lies in the accessibility-specific indicator system, spatial risk zoning, prompt-constrained scoring rules, threshold calibration, and expert validation. Several limitations therefore remain and warrant further refinement in future research, particularly the reliance on a single closed-source VLM whose internal visual feature extraction and reasoning process cannot be fully inspected. Although the sensitivity and ablation analyses showed stable model–expert agreement in a stratified 25% subsample, the conclusions remain partly dependent on GPT-4o′s capabilities and biases, especially when visual context is removed, viewpoints deviate from the pedestrian-centered framing, or tactile paving layouts are ambiguous.
First, the temporal resolution of SVI is relatively low, providing only static “snapshots” of a given moment in time, which fails to capture dynamic variations such as pedestrian peak hours or seasonal construction activities. To address this, we suggest conducting regular sampling at high-risk stations or deploying low-power IoT cameras, which, when combined with time-series prediction models, can enable early warning and responsive adaptation to evolving obstructions. Second, the risk threshold currently relies on expert heuristics and sample-based tuning, limiting its adaptability across diverse scenarios. Future work may incorporate Bayesian optimization or reinforcement learning to dynamically learn optimal decision boundaries under varying conditions, thereby enhancing the model’s self-adaptive capability. Lastly, since SVI may contain identifiable facial features or pedestrian trajectories, it is necessary to implement privacy-preserving mechanisms such as face blurring and background de-sensitization to ensure data security and regulatory compliance.
In summary, intelligent evaluation and management of tactile paving facilities require interdisciplinary collaboration, supported by multi-source data integration, dynamic monitoring, and community co-creation mechanisms, to collectively advance an inclusive and sustainable urban mobility environment.
Conclusions
This study developed an intelligent evaluation framework integrating VLMs with SVI to systematically identify and quantify tactile paving usability issues around 110 metro stations in Beijing. Using the GPT-4o model and high-resolution pedestrian-perspective data collected via GoPro devices, it established a multidimensional risk assessment system covering both structural and situational obstacles, marking a shift from manual inspection to precise, automated monitoring of urban accessibility infrastructure.
Four key findings emerged: First, the 250 mm proximity zone had the highest obstruction rate (34.46%), exceeding the tactile paving body (33.03%) and broader environment (19.79%), mainly due to spatial compression from wall encroachments and poles. Second, AI assessments closely matched expert ratings (Pearson r = 0.943, ICC = 0.898), validating VLM-based semantic reasoning in complex contexts. Third, Fengtai District performed worst across indicators, reflecting challenges in high-density urban environments. Fourth, continuous scoring with threshold-based classification reduced the false-positive rate from 54% to 11%, greatly improving detection accuracy and utility.
The study contributes at three levels: Theoretically, it refines the “accessibility chain” into a three-tier framework (paving body, 250 mm proximity zone, environment) and introduces a 50-indicator risk evaluation system. Methodologically, it combines VLM semantic reasoning with pedestrian-view SVI, overcoming vehicle-mounted imagery limits and creating a low-cost, high-efficiency monitoring model. Practically, it develops a crowdsourced street view collection platform for collaborative data generation and participatory governance, aligning classification-based identification with public management strategies to enhance the precision and timeliness of maintenance.
Supplemental material
Supplemental material - Street-level monitoring of urban tactile paving obstructions through visual-language models and street view imagery
Supplemental material for Street-level monitoring of urban tactile paving obstructions through visual-language models and street view imagery by Hanbei Chen and Jin Rui in Environment and Planning B: Urban Analytics and City Science
Footnotes
Funding
The authors received no financial support for the research, authorship, and/or publication of this article.
Declaration of conflicting interests
The authors declared no potential conflicts of interest with respect to the research, authorship, and/or publication of this article.
Data Availability Statement
A subset of the data used in this study has been deposited in the Zenodo repository and is publicly available at https://doi.org/10.5281/zenodo.20748802 by ![]()
Supplemental material
Supplemental material for this article is available online.
Author biographies
References
Supplementary Material
Please find the following supplemental material available below.
For Open Access articles published under a Creative Commons License, all supplemental material carries the same license as the article it is associated with.
For non-Open Access articles published, all supplemental material carries a non-exclusive license, and permission requests for re-use of supplemental material or any part of supplemental material shall be sent directly to the copyright owner as specified in the copyright notice associated with the article.