
Abstract
Among the marginalized and overlooked segments of India, Scheduled Caste (SC) and Scheduled Tribe (ST) women on intimate partner violence (IPV) is mixed. In contrast, women in the General category experience less IPV. Based on Psychoanalytic and Social learning theories, this study quantifies the disparity in IPV between these groups and examines the role of digital and mass media in analyzing IPV. This research endeavours to bridge this existing gap. Its objective is to comprehensively investigate the contributing factors and explain the disparity in IPV between SC, ST and General women by using the National Family Health Survey (2019–2021). The study utilized binary logistic regression and multivariate decomposition analysis to examine the contribution of each factor to IPV. The findings indicate that women exposed to digital media are less likely to experience IPV compared to those without exposure, while those exposed to broadcast media have an insignificant impact on the likelihood of experiencing IPV. However, women are more likely to experience IPV due to their husband’s alcohol consumption, parental IPV, and acceptance of IPV as justified and controlling behaviour, which increases IPV reporting.
Introduction
Caste denotes a rigid social hierarchy where individuals are born into specific groups and remain within them throughout their lives. The caste system is defined by endogamy, which forbids inter-caste marriages and automatically assigns children to their parents’ caste. The caste system has historically been a key feature of Indian society (Chowdhury et al., 2024; Singh et al., 2019). The hierarchical system is prevalent in society and has been attributed to hereditary transmission of the life cycle, occupational structure and social status. Those at the bottom of society are considered Vulnerable and untouchable, Harijans, Dalits and Avarnas. The traditional caste system divided society into two main divisions: the Savarna (Privileged or touchable) and the Averna (oppressed or untouchable). The Savarna category encompassed four significant groups: Brahmins (priests) hold the highest rank, followed by Kshatriyas (warriors), Vaishyas (merchants) and Shudras (labourers) at the lowest level of the upper caste social hierarchy (Savarna). Averna were a marginalized section deemed so inferior that they were rejected and isolated by the Saverna groups (Chowdhury et al., 2024). After independence, the Indian Constitution included provisions to safeguard the rights of marginalized communities (Dushkin, 1967). Scheduled Castes (SCs) differ from Scheduled Tribes (STs), with the latter primarily defined by their geographical isolation. Unlike SCs, STs experience marginalization rooted in factors other than the conventional caste hierarchy in Indian society. The oppression faced by STs stems from influences that extend beyond the traditional caste-based framework.
Certain communities in India, which have historically faced marginalization and discrimination but are not included in the category of SC and ST, are identified as Other Backwards Classes (OBCs). Castes that do not fall under the SC, ST, or OBC classifications are often called Others, General, Savarnas, or High Castes. In recent years, numerous policies, programmes and protective measures have been introduced through legislation to tackle discrimination, exploitation and violence against SCs and STs. These measures aim to enhance their quality of life by providing reservations in education and employment, as outlined in laws such as the (Chalam, 1990; Devi, 1989).
Rationale of the Study
Due to patriarchal norms, SC women face violence and discrimination from higher castes and within their caste, including from partners (Ackerson & Subramanian, 2008; Krishnan, 2005). Such violence can have a profound effect on women’s physical and mental well-being. After India gained independence, these groups were recognized in the Indian Constitution and renamed ‘Scheduled Castes’ and ‘Scheduled Tribes’. These groups are also known as Dalits, meaning ‘broken people’. According to the Census (2011), they comprise approximately one-sixth of India’s population, around 200 million people. For centuries, SCs have endured discrimination and abuse from higher castes (Barman, 2020; Krishnan, 2005). Deep-rooted patriarchal customs within Indian society often subject SC women to violence, prejudice and mistreatment from their partners or spouses (Ackerson & Subramanian, 2008; Krishnan, 2005). Intimate partner or spousal domestic violence can manifest in various ways, including verbal, physical, psychological and sexual mistreatment (Jewkes, 2002).
Despite the clear SC-general and ST-general gaps in intimate partner violence (IPV) against women, a dearth of studies has explored why this gap exists and how digital and mass media play a role in IPV. To create targeted policies to reduce IPV gaps between these social groups, the study examines key factors driving SC-general and ST-general gaps in IPV in India, emphasizing the impact of digital and mass media, and further examines factors contributing to the IPV gap between the SC-general and ST-general categories of women in India.
Employed women from households in India revealed that females who were the primary decision-makers were more susceptible to IPV compared to households led by males. Higher levels of IPV are less likely to occur in educated couples and among women in positions of decision-making authority, while the opposite is true for women who condone violence and who are subjected to greater husband control in the marriage (Firdaush & Das, 2025). According to the findings, there are differences in the association between gender norms and sexual and physical IPV, which suggests that different forms of IPV require different actions (Gopalakrishnan et al., 2025). IPV can also be brought on by stress or a lack of resources (Heath et al., 2020), which can lead to alcohol drinking, which inhibits self-control (Schilbach, 2019). IPV was 57% greater for women whose spouses drank more alcohol than the median (Heath et al., 2020). This can be attributed to the perception of women as subordinate within the patriarchal structure of Indian society, leading to their continual dependence on men within the family.
Culturally, it is a perception that men should be the breadwinners while women handle domestic chores. Merely achieving economic independence among women is insufficient to significantly alter the prevalence of IPV against them. Abuse in intimate relationships can take various forms, including emotional, verbal, physical, sexual, financial and digital abuse (Dasgupta et al., 2018). Several factors, including gender equality, women’s societal status, cultural and gender norms, female education, digital empowerment and social involvement, all contribute to women’s vulnerability to abuse and violence. Media exposure also plays a significant role in IPV (Gavin & Kruis, 2022). For centuries, the lower and deprived castes have faced discrimination and mistreatment from castes positioned higher in the social hierarchy (Barman, 2020). Over the past decades, Governments have implemented various laws and initiatives to combat caste-based discrimination and violence against SCs and STs through protective measures.
Furthermore, the government has sought to enhance the lives of SCs by providing reservations in education and employment (Chalam, 1990; Kapoor, 2007). However, caste-based violence and persecution against SCs and STs continue to be prevalent in many regions of the country (Khubchandani et al., 2018; Krishnan, 2005). It has a comparable impact on SC and ST women and men. In India, deeply rooted patriarchal structures frequently make SC and ST women vulnerable to violence, discrimination, and abuse, both from men of dominant castes and within their own communities, especially from intimate partners. Previous studies have highlighted the significant disparity in the prevalence of IPV based on socioeconomic and demographic factors, and violence against women is strongly associated with the status of women in society, and the use of violence is considered an exercise of power over women (Ackerson & Subramanian, 2008; Biswas, 2017). Jensen and Oster (2009) studied the impact of cable TV on women’s well-being in India. They found that its introduction reduced the acceptance of domestic violence among women in rural areas and explained this connection by suggesting that cable television exposes women to lifestyles beyond their immediate surroundings, which can shape their views on how women should be treated. The findings indicate that increased exposure to mass media is associated with a lower tendency to justify IPV against women.
The Sustainable Development Goal (SDG) 5, which focuses on gender equality and women’s empowerment, aims to eliminate all forms of violence against women. Against this backdrop, this research is trying to explore the impact of mass and digital media on IPV and the significant gap between the two social groups in India. Hence, this study is to determine the use of mass media (Newspapers/Magazines, Television and radio) with extended forms of mass media to digital media, such as ownership of mobile phones with access to the Internet and the ability to read text short message service (SMS), on reducing IPV. The significant influence of technology and the Internet on people’s social lives, particularly those of young people, is not recent. Due to the widespread use of mobile phones and the Internet, people have become increasingly reliant on them, as they enable access to the Internet anywhere. Therefore, the empirical analysis of exposure to mass and digital media and their effects on IPV using nationally representative data provides new insights into the study. Therefore, the empirical analysis of exposure to mass and digital media and their effects on IPV using nationally representative data provides new insights into the study.
Various theories of domestic violence can help explain why violence against employed women remains persistently high. These theories are often grouped into three broad categories: (a) psychoanalytical theories, (b) social learning theories and (c) socio-political critique theories (Roy, 2003). Psychoanalytical approaches emphasize stress, anxiety, anger and guilt rooted in early childhood experiences (Friedman & Schustack, 2011), arguing that men often respond with hyper-masculinity to mask underlying emotional insecurities. Social learning theories view the family as a ‘cradle of violence’, where violent behaviour is learned and passed across generations (Bandura, 1977). Socio-political critiques, drawing on thinkers such as Millet (1971), contend that domestic violence functions as a mechanism to sustain patriarchal and hierarchical social structures.
Statistical Analysis
There is a substantial disparity in IPV between SC and General Caste women, with 31.38% of SC women experiencing physical violence, which is higher than that of General Caste women (National Family Health Survey-5 [NFHS-5], 2019–2021) (Figure 1). In comparison, 74.76% of ST women reported physical violence, which is much higher than the General Caste women. All types of violence against women are significantly higher in both SC and ST castes than in women from the General category. Overall, IPV reported by SC and ST women is 35.38% and 28.81%, respectively.
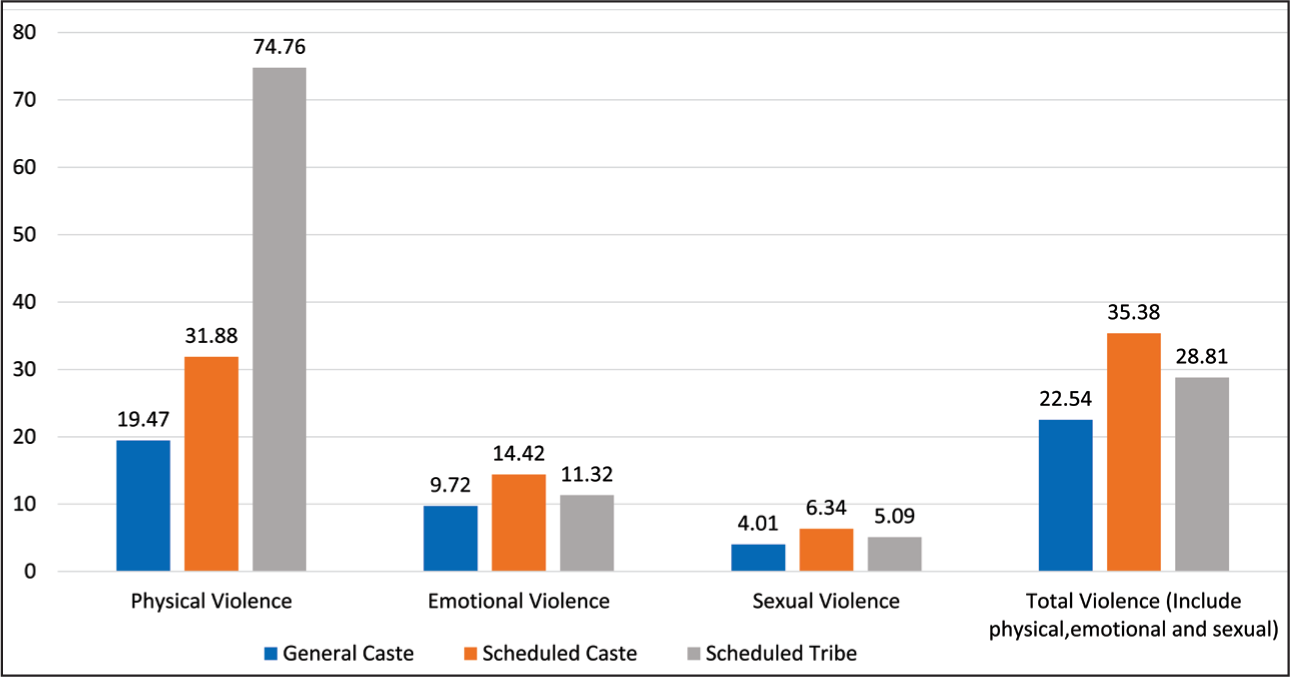
Figure 2 illustrates mass media exposure among SC, ST and General Caste women. The data reveals that 79.82% of SC women lack exposure to any mass media compared to General Caste women. Among General Caste women, 20.63% read newspapers less than once a week, higher than 13.06% of SC women. Similarly, 16.39% of General Caste women are exposed to newspapers weekly, compared to 7.12% and 6.44% among SC and ST women, respectively. This indicates a higher ratio of newspaper exposure among General Caste women. Likewise, General Caste women surpass SC women in radio and television exposure. Overall, 83.94% of General Caste women are exposed to mass media compared to 72.16% of SC and 62.57% of ST women. Notably, 37.43% of ST women lack mass media exposure, double the 16.06% among General Caste women. The highest overall exposure is observed in General Caste women at 83.94%.
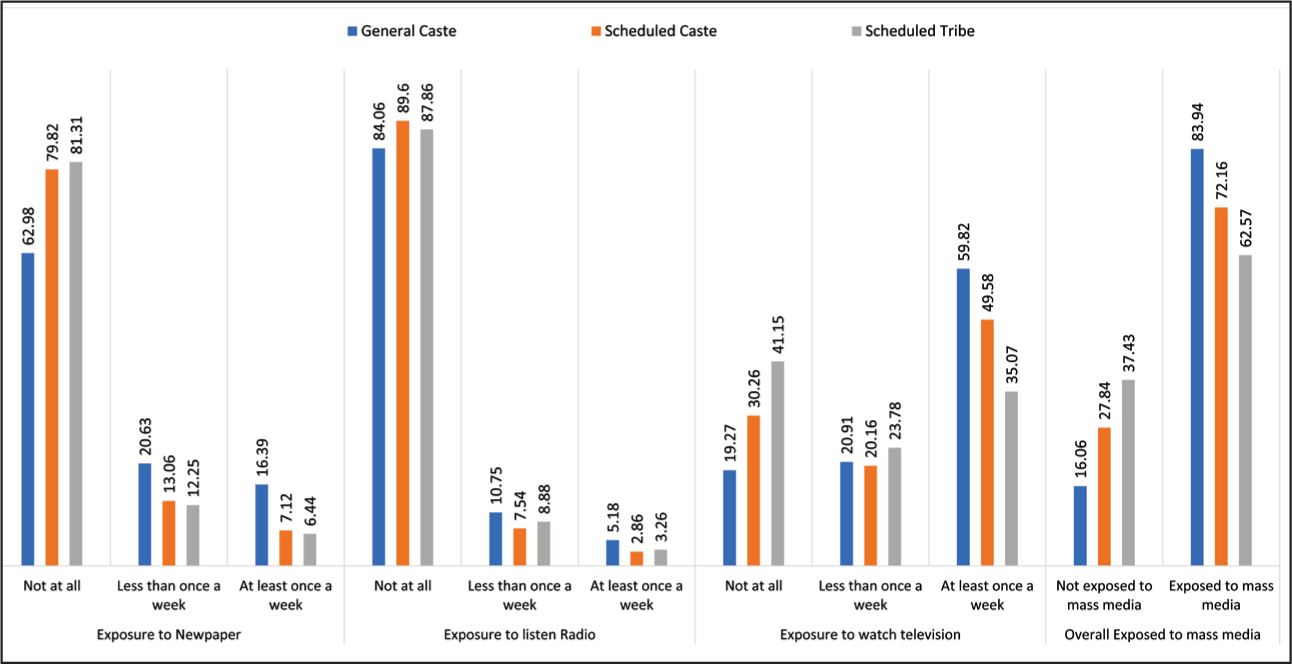
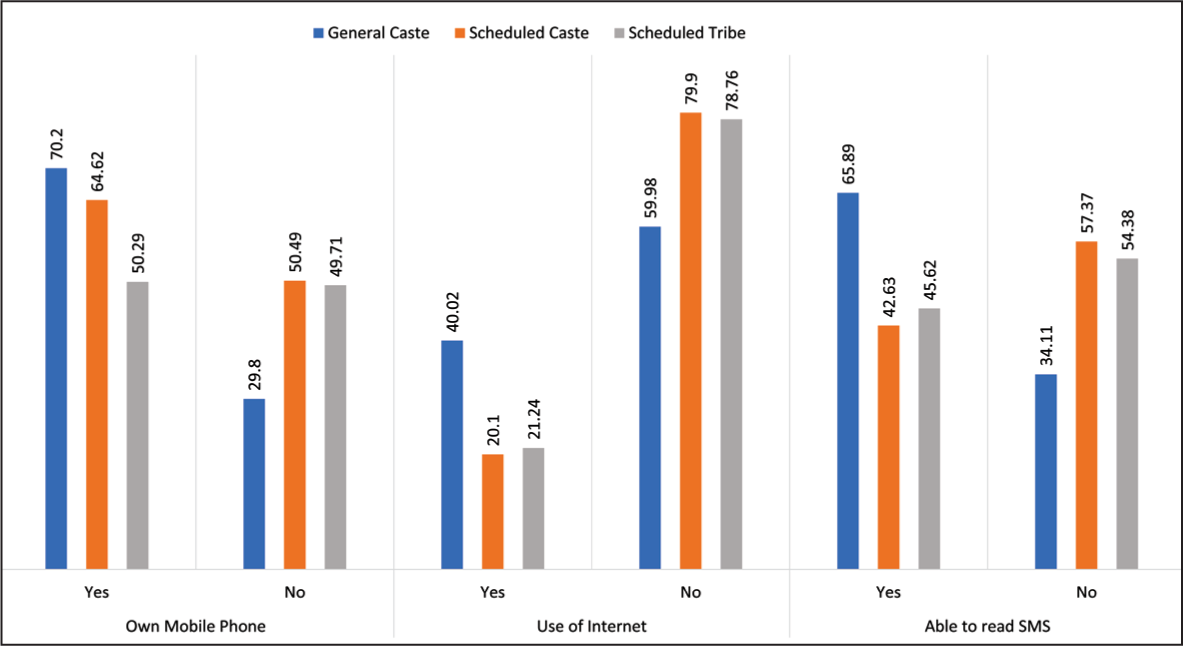
Figure 3 shows the percentage of digital media use among SC, ST and General Category women. It shows that 70.2% of the General Caste women have access to ownership of mobile phones, 40.02% have access to the Internet, and 65.89% of women can read SMS as compared to the 64.62% and 50.29% of the SC and ST women who own a mobile phone, 20.1% and 21.24% have access to the Internet, and only 42.63% and 45.62% can read SMS respectively. Due to this difference, the percentage of IPV experienced by the SC and ST category women is higher than that experienced by the women of the General category.
Prevalence of IPV at the National and International Level
According to the World Health Organisation (WHO), in 2024, globally, 27% of the ever-partnered individuals aged between 15 and 49 years have experienced physical or sexual violence from an intimate partner at least once in their lifetime. Violence against women is a significant public health problem. Estimates published by the WHO show that 1 in 3 (30%) of women worldwide have been subjected to either physical and sexual IPV or non-partner sexual violence in their lifetime (García-Moreno, 2005). The World Bank suggest that the cost of violence against women could be as high as 3.7% of a country’s GDP (‘Social Sustainability’, 2019). India is a nation characterized by social and cultural diversity, which is evident in the significant regional variance in the prevalence of IPV. (Mahapatro et al., 2012). In India, socioeconomic factors like age, caste and employment status are powerful indicators of IPV (Dalal & Lindqvist, 2012). For instance, women who marry young are more likely to experience IPV, which can last the entirety of their lives (Rocca et al., 2009). Additionally, age, education, occupation, income and socioeconomic position differences between husband and wife are all strongly linked to IPV (Abramsky et al., 2011; Dalal & Lindqvist, 2012; Kabeer, 2005). Some of these factors operate as protective barriers against physical violence committed by spouses; women with greater social, economic and educational empowerment are better protected (Jewkes, 2002; Jeyaseelan et al., 2007). The annual crime rates on reported occurrences of cruelty against women by the husband and his family members are published by India’s National Crime Records Bureau (NCRB), which keeps track of crimes against women. These rates rose dramatically from 8% in 2010 to 18% in 2016 per 100,000 females (NCRB, 2010, 2016). In 2020, there were 57 crimes against women nationwide; by 2022, that number had risen to 67. The lowest crime rate in 2022 was 5 in Nagaland, while the highest was 145 in Delhi (Pooja et al., 2024).
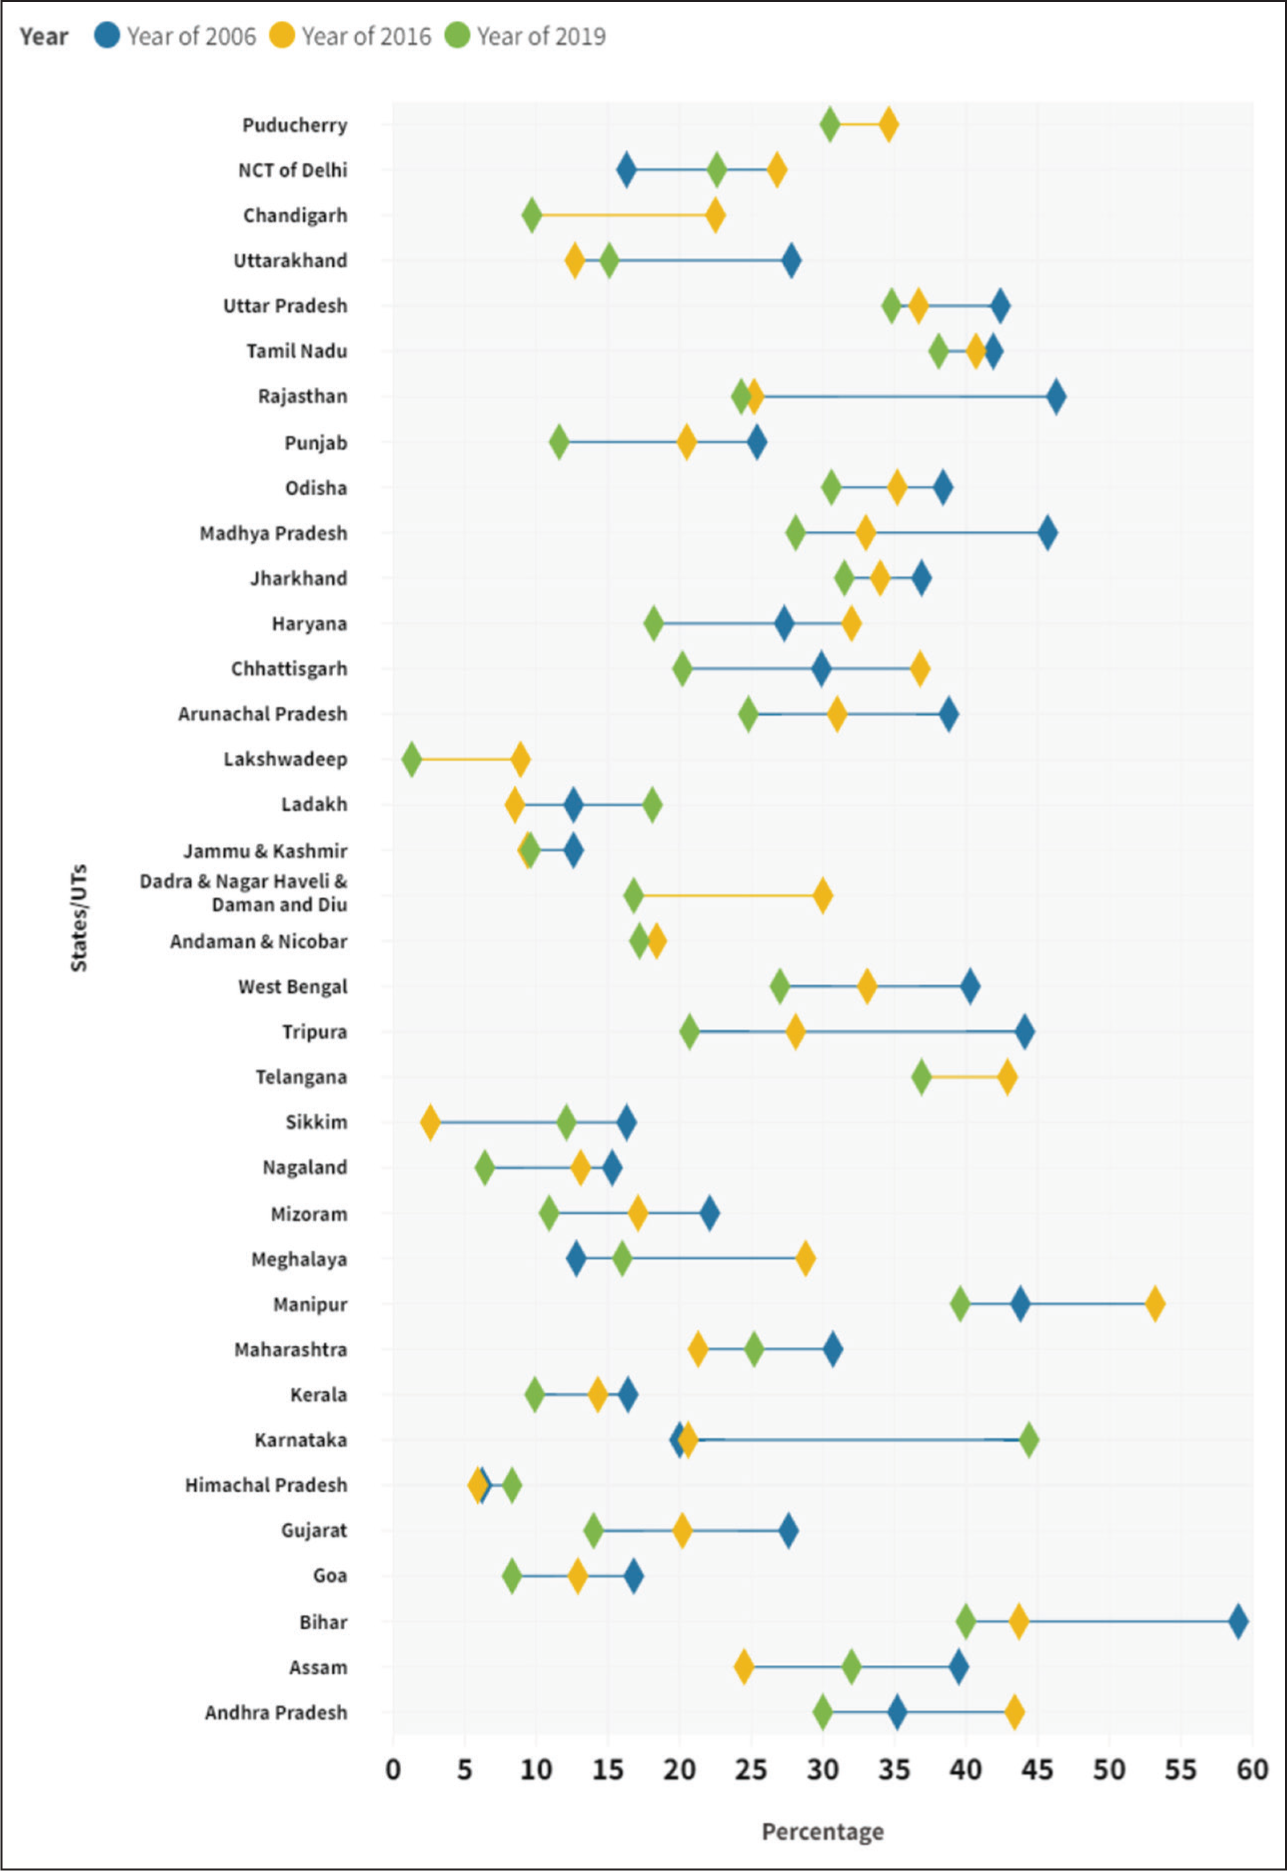
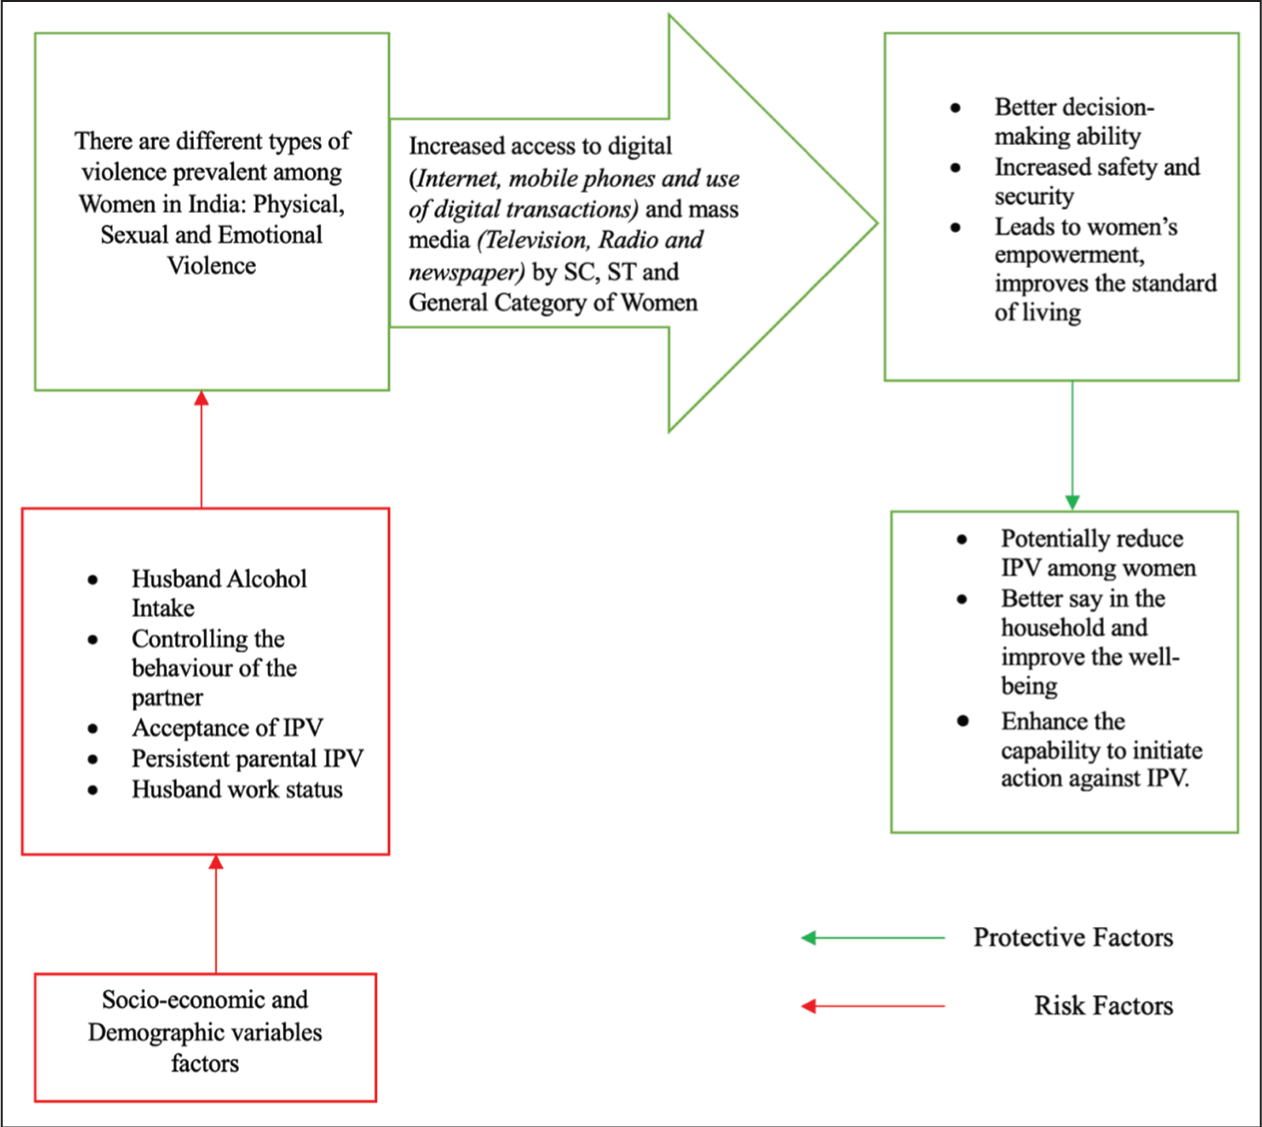
Additionally, research indicates that men’s dominating status is threatened by women’s increasing empowerment, leaving them vulnerable to violence (Atkinson et al., 2005; Dalal & Lindqvist, 2012; Gupta & Yesudian, 2006). Figure 4 presents data on spousal violence against women for the years 2006, 2016 and 2019 across all states (Suri & Sarkar, 2022) and different risk and protective factors that generate and reduce IPV via digital and mass media are represented as a conceptual framework (Figure 5).
Data Source
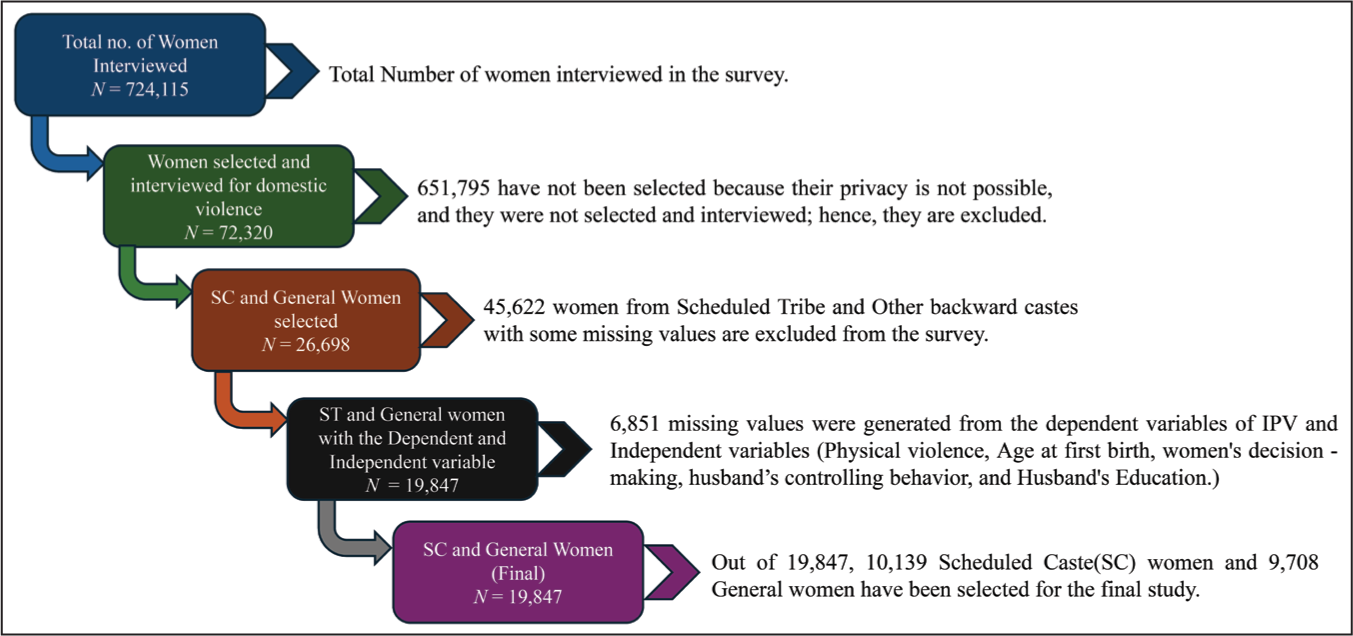
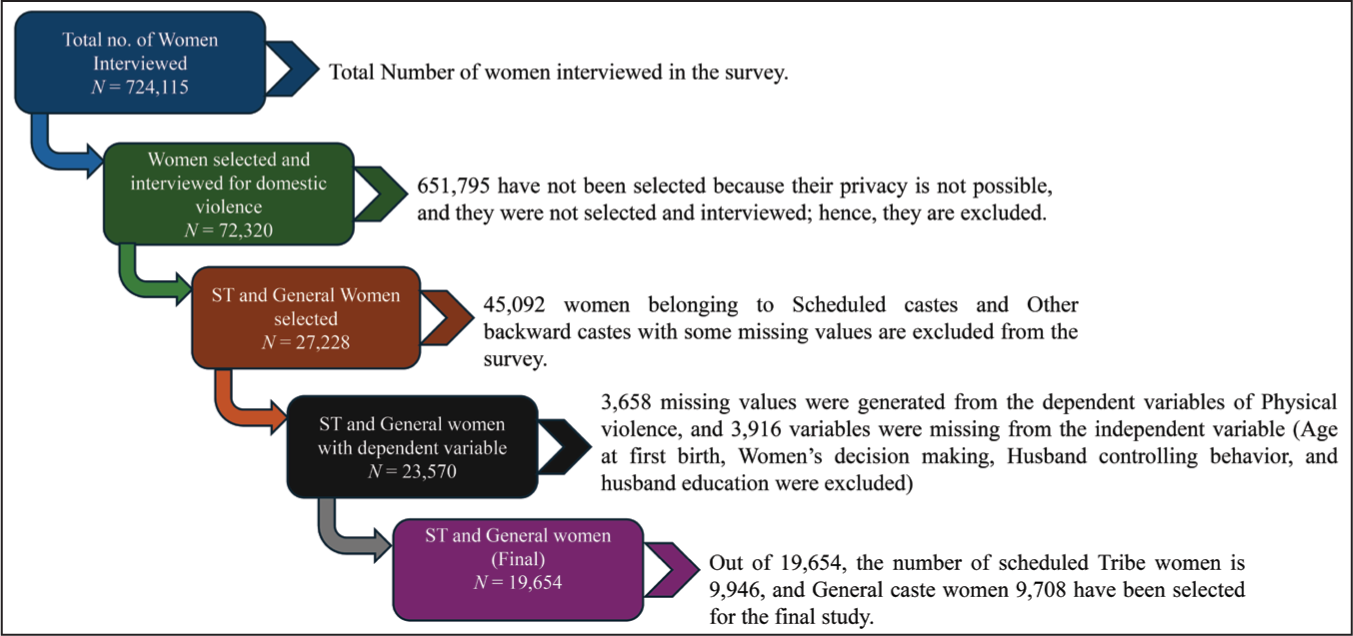
The research utilized data from the fifth round of the NFHS-5 survey, a nationally representative cross-sectional survey conducted by the Government of India between 2019 and 2021, which interviewed 724,115 women aged 15–49 years from 636,699 households.
Dependent Variable
The survey included 13 questions addressing IPV. Of these, seven questions focused on physical violence, four on sexual violence, and the remaining three gathered data on emotional violence (See Table A1 in Appendix A). Those who experienced IPV were coded as ‘1’, while those who did not were coded as ‘0’.
Independent Variable
Various factors considered for this study are place of residence, religion, respondent’s education, wealth index, woman education level, working status of women, mother’s age at the birth of the first child, reading newspaper, watching television, listening radio (The NFHS-5 categorizes media exposure frequency into the following groups: never, less than once a week, at least once a week, and almost every day), ownership of the mobile phone, able to read SMS, access to the Internet (forms of digital media), husband’s level of education; permission to seek medical care; number of living children; exposure to parental IPV; women’s acceptance of IPV; husband’s controlling behaviour; husband’s alcohol use; and region of residence (Table 1).
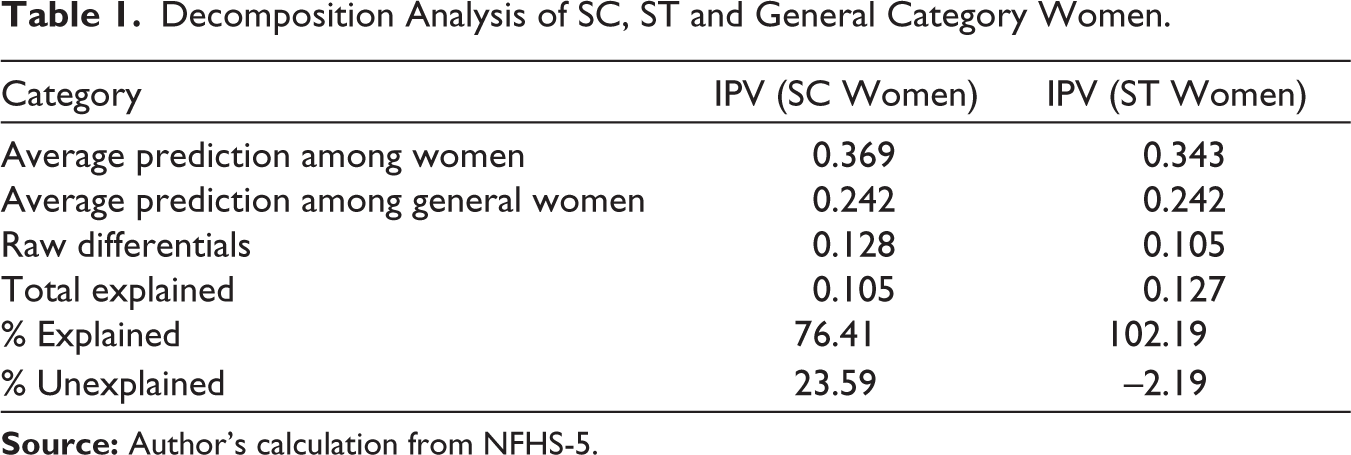
Decomposition Analysis of SC, ST and General Category Women.
Sample Design
The study focuses on the outcome variable concerning whether women have encountered IPV in their lives. Women were questioned about their experiences of physical, sexual, or emotional violence from their spouse/partner. Individuals who reported no such incidents were categorized as having never experienced IPV. The final sample included 19,847 participants, of whom 10,139 were from the SC category and 9,708 were selected for the General category population (Figure 6).
Out of a total of 724,115 individuals, 19,654 women from the ST and the general population were observed under the domestic violence module. Of these, 9,946 women were selected from the ST population, while 9,708 were from the General population (Figure 7).
Methodology
A collinearity test was conducted in this study, revealing no evidence of collinearity among the independent variables. Binary logistic regression was employed to dissect the influence of variables contributing to IPV while drawing a comparison between the SC and General Category women, as well as the ST and General Category women (See Table B1 in Appendix B).
Model
To examine differences in IPV prevalence across SC, ST and General groups, the analysis was carried out using Stata 17. Logistic regression was conducted to examine the IPV and its relation with access to IPV among SC, ST and General women. The dependent variable is binary; therefore, the binary logistic regression was chosen to assess the impact of independent variables on the dependent variable, which is modelled as

Where,
π The probability of an event happening (Total IPV) β0 is the intercept, and βi is the regression coefficient of the independent variables associated with the reference. The results are presented as odds ratios with p values at a 95% significance level. Multivariate decomposition analysis was applied to assess differences in IPV prevalence between SC and the General population, and between ST and the general population.
Results
Results of Decomposition Analysis Among SC, ST and General Category Women
Various factors may contribute to the disparity in IPV between the two social groups, specifically the SC and ST categories. The study aims to identify the factors contributing to this gap and to assess their relative significance in explaining it. Fairlie Decomposition Analysis was utilized to determine the factor’s contribution (Table 1).
Table 1 shows a 0.36 probability of IPV for SC women and 0.24 for General category women, while for ST women, the probability is 0.34, compared to 0.24 for General category women. The disparity between the two groups, SC-General and ST-General, is apparent, with gaps of 0.12 and 0.10, respectively, as broken down in the analysis. Approximately 76% of the difference in IPV is accounted for by the predictors used in the analysis for SC and General Category women. The remaining 23% have not been described by the predictor variable used in the study examining differences in IPV between SC and General Category women. Similarly, the predictor variable explains the ST gap, and the remaining is unexplained. This can be due to variables that are unused or unexplained and are not considered in the study.
Table 2 presents a decomposition analysis of the IPV gap between SC and General Category women. A positive contribution from a variable suggests an increase in the difference in major IPV between the two groups, while a negative contribution indicates the opposite. The result shows that the husband’s habit of drinking alcohol contributes 19.78% to widening the gap of IPV. Husband-controlling behaviour is a significant variable contributing to 18.11% in widening the gap of IPV. Another primary variable is the wealth index, which describes the 16.30% widening of the gap in IPV. Ownership of mobile phones has contributed 10.13% to the expanding IPV gap. Women’s acceptance of violence contributes 6.45% of the gap. After that, parental violence has contributed around 5.98% to the prevalence of the IPV gap. Alive children have created around 4.25% of the widening gap in IPV. The working status of women also indicates a rise of 3.31% in the gap in IPV. However, women’s education reduces the gap by 12.51% in IPV between SC and General women. The region of states shows a 0.55% contribution to the IPV gap. Around 2.31% of the gap is minimized by reading newspapers, which, however, is not significant. Permission to seek medical care and women’s decision-making contribute 1.36% and 0.31%, respectively, to the widening IPV gap between the groups. The rest of the variables, that is, mother’s age at first birth, place of residence, reading newspapers, listening to the radio, watching television, ability to read SMS, access to the Internet, and husband’s education, show insignificant results in the contribution towards widening the gap in the decomposition analysis.
Multivariate Decomposition Analysis of the Average IPV Gap Between SC and General Category Women.
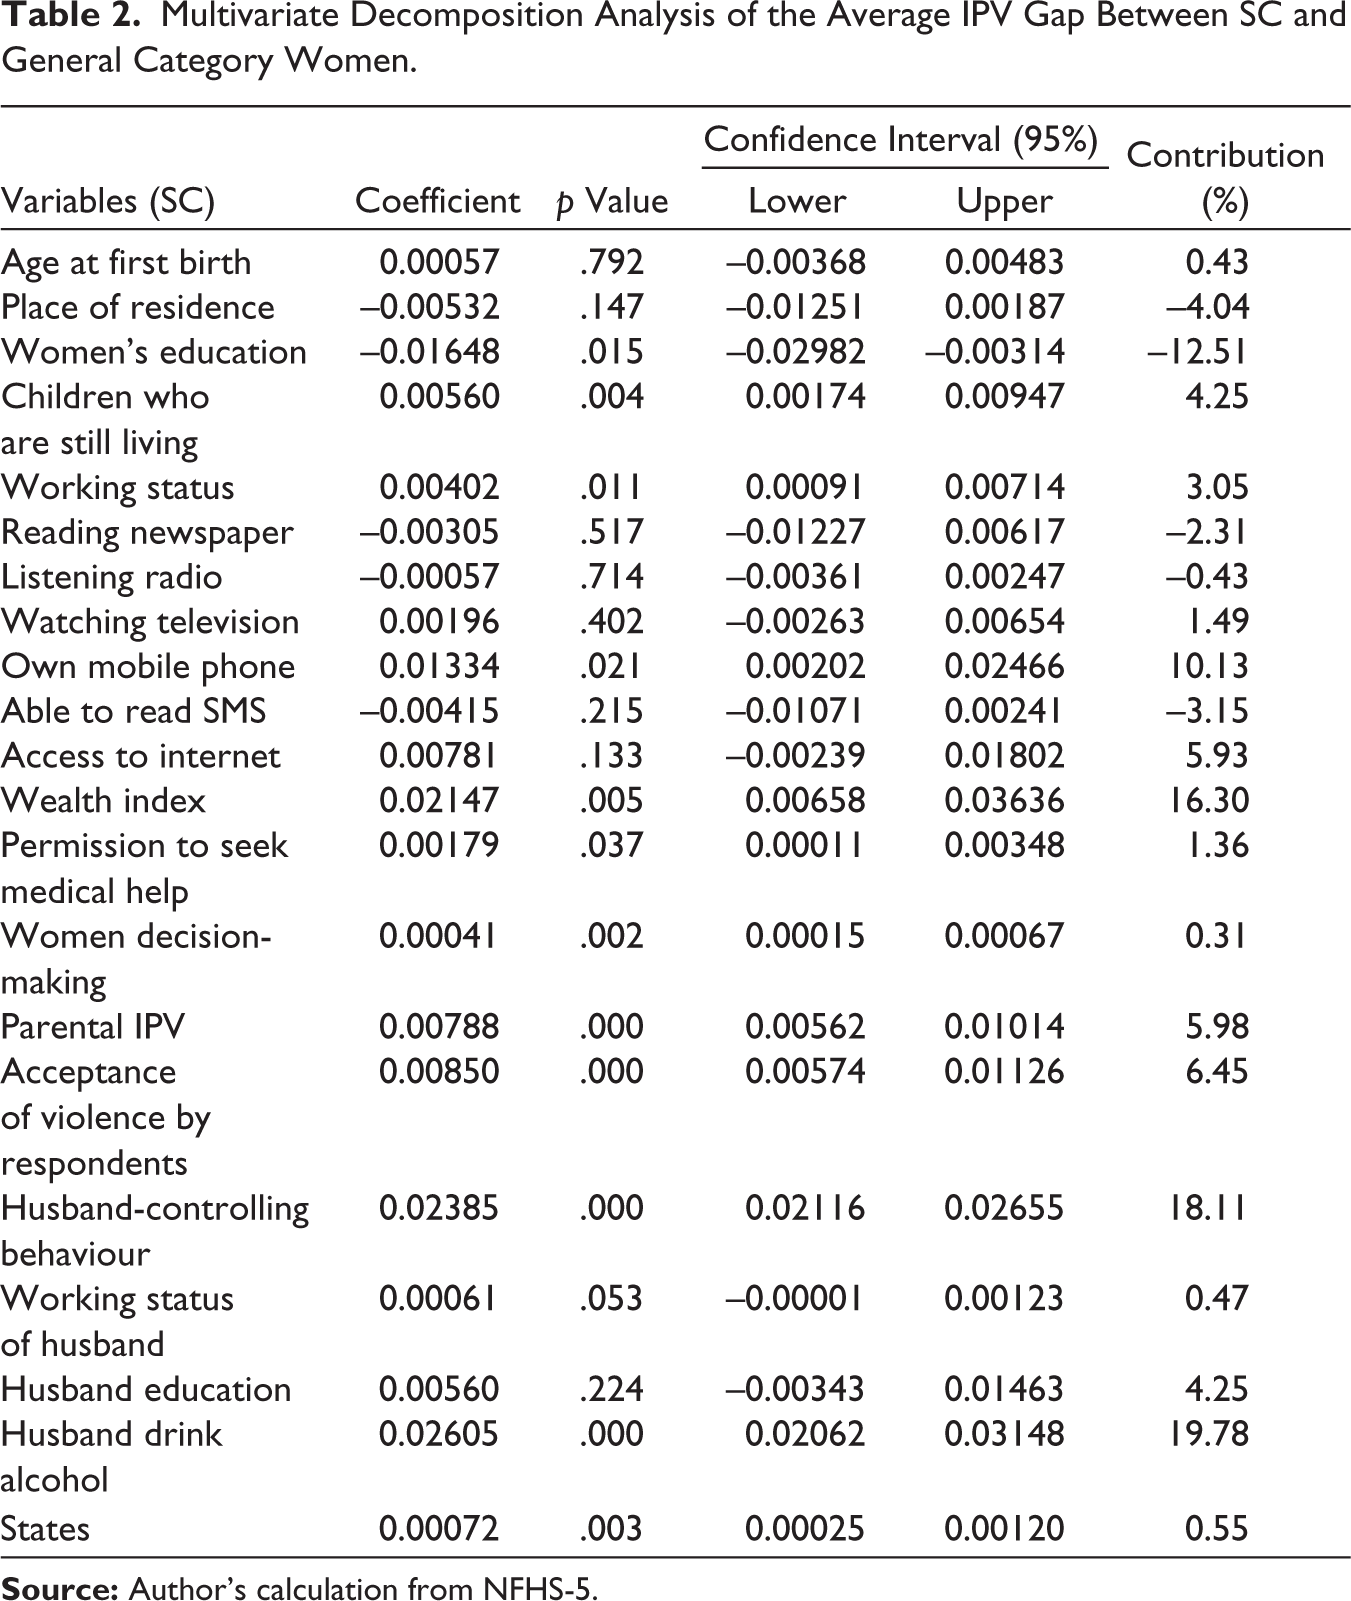
Previous studies have demonstrated that a husband’s controlling behaviour is closely linked to an increased risk of physical and sexual violence (Antai, 2011). Control by an intimate partner and the use of emotional threats are damaging behaviours that negatively affect a person’s well-being. Most of the SC and ST women expressed that their husbands control them; therefore, an inclusive approach is needed to economically empower SC and ST women raised in households with IPV. These women are more likely to accept their partners’ violent behaviour, thereby reproducing the IPV patterns seen in their parents’ relationships and using violence as a form of negotiation within their own relationships (Ler et al., 2020). Families with more children face higher costs for care, education, healthcare, and other expenses, leading to financial stress, family conflicts, and a higher risk of violence against women (Chowdhury et al., 2024).
Table 3 shows the contribution of the ST and General category women on IPV by using multivariate decomposition analysis, and quantifies the contribution of variables that have created major differences in IPV between ST and General category women. Husband’s alcohol consumption significantly widened the gap by 20.24% in the IPV between the ST and General category, which is higher than the IPV gap widening between the SC and General Category women. Place of residence also makes a significant contribution of around 20.16% to the gap. The husband’s controlling nature has made up an 11.99% contribution to the prevalence of the gap in IPV. The working status of women has also contributed to 9.66% of the IPV gap between ST and the general category of women. Parental IPV in the household of women has been shown to increase the gap by 6.32% in IPV between the two groups. Acceptance of violence has contributed to around a 5.84% gap in IPV between ST and the General category of women. Women’s decision-making has shown a 0.24% gap widening in IPV between the groups. Permission to seek medical help, too, has increased the IPV gap by 3.31%. The region of residence has contributed by 3.88% towards widening the IPV gap between the ST and General categories. The rest of the variables are the mother’s age at first childbirth, the woman’s education, currently alive children, reading newspapers, listening to the radio, watching television, ownership of a mobile phone, ability to read SMS, access to the Internet, wealth index, working status of husband and husband’s education have shown insignificant results and contribution to the gap.
Multivariate Decomposition Analysis of the Average IPV Gap Between ST and General Category Women.
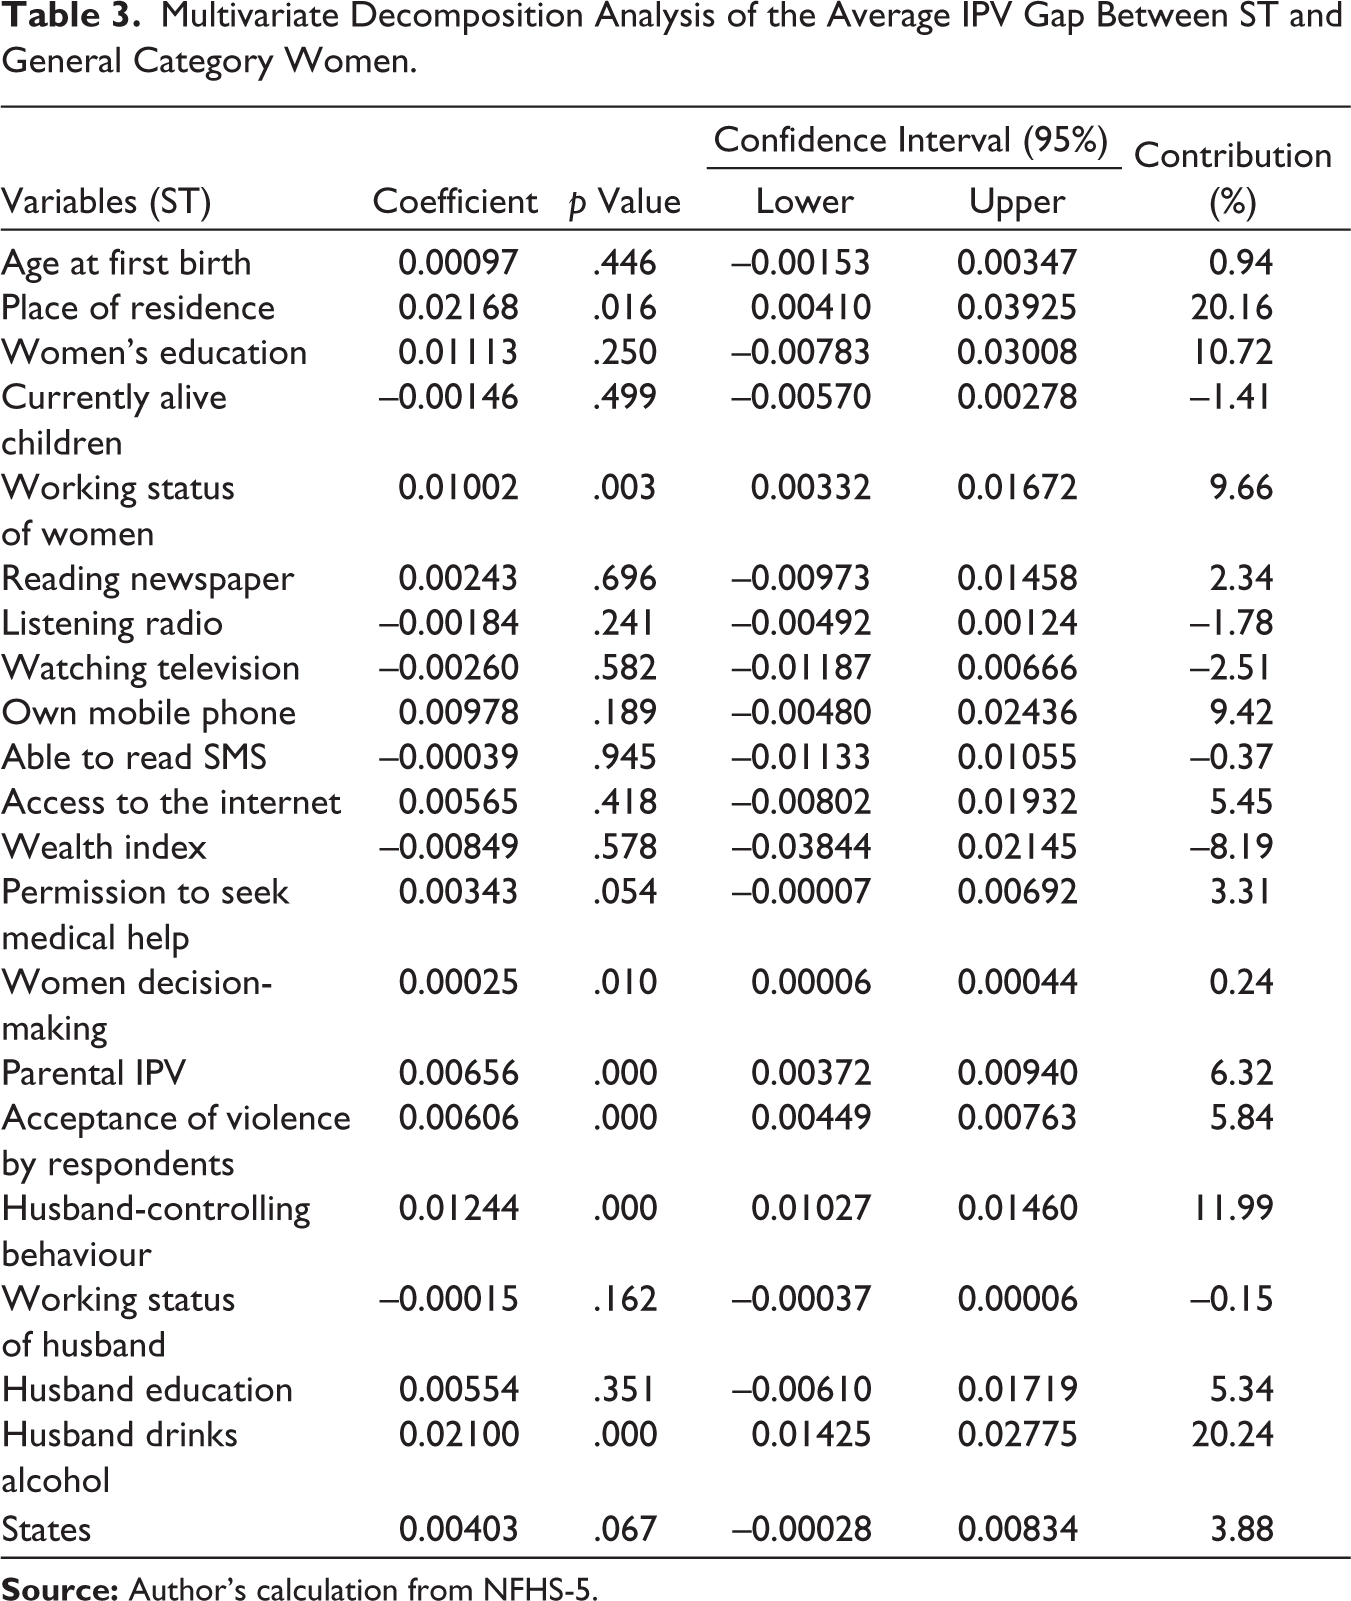
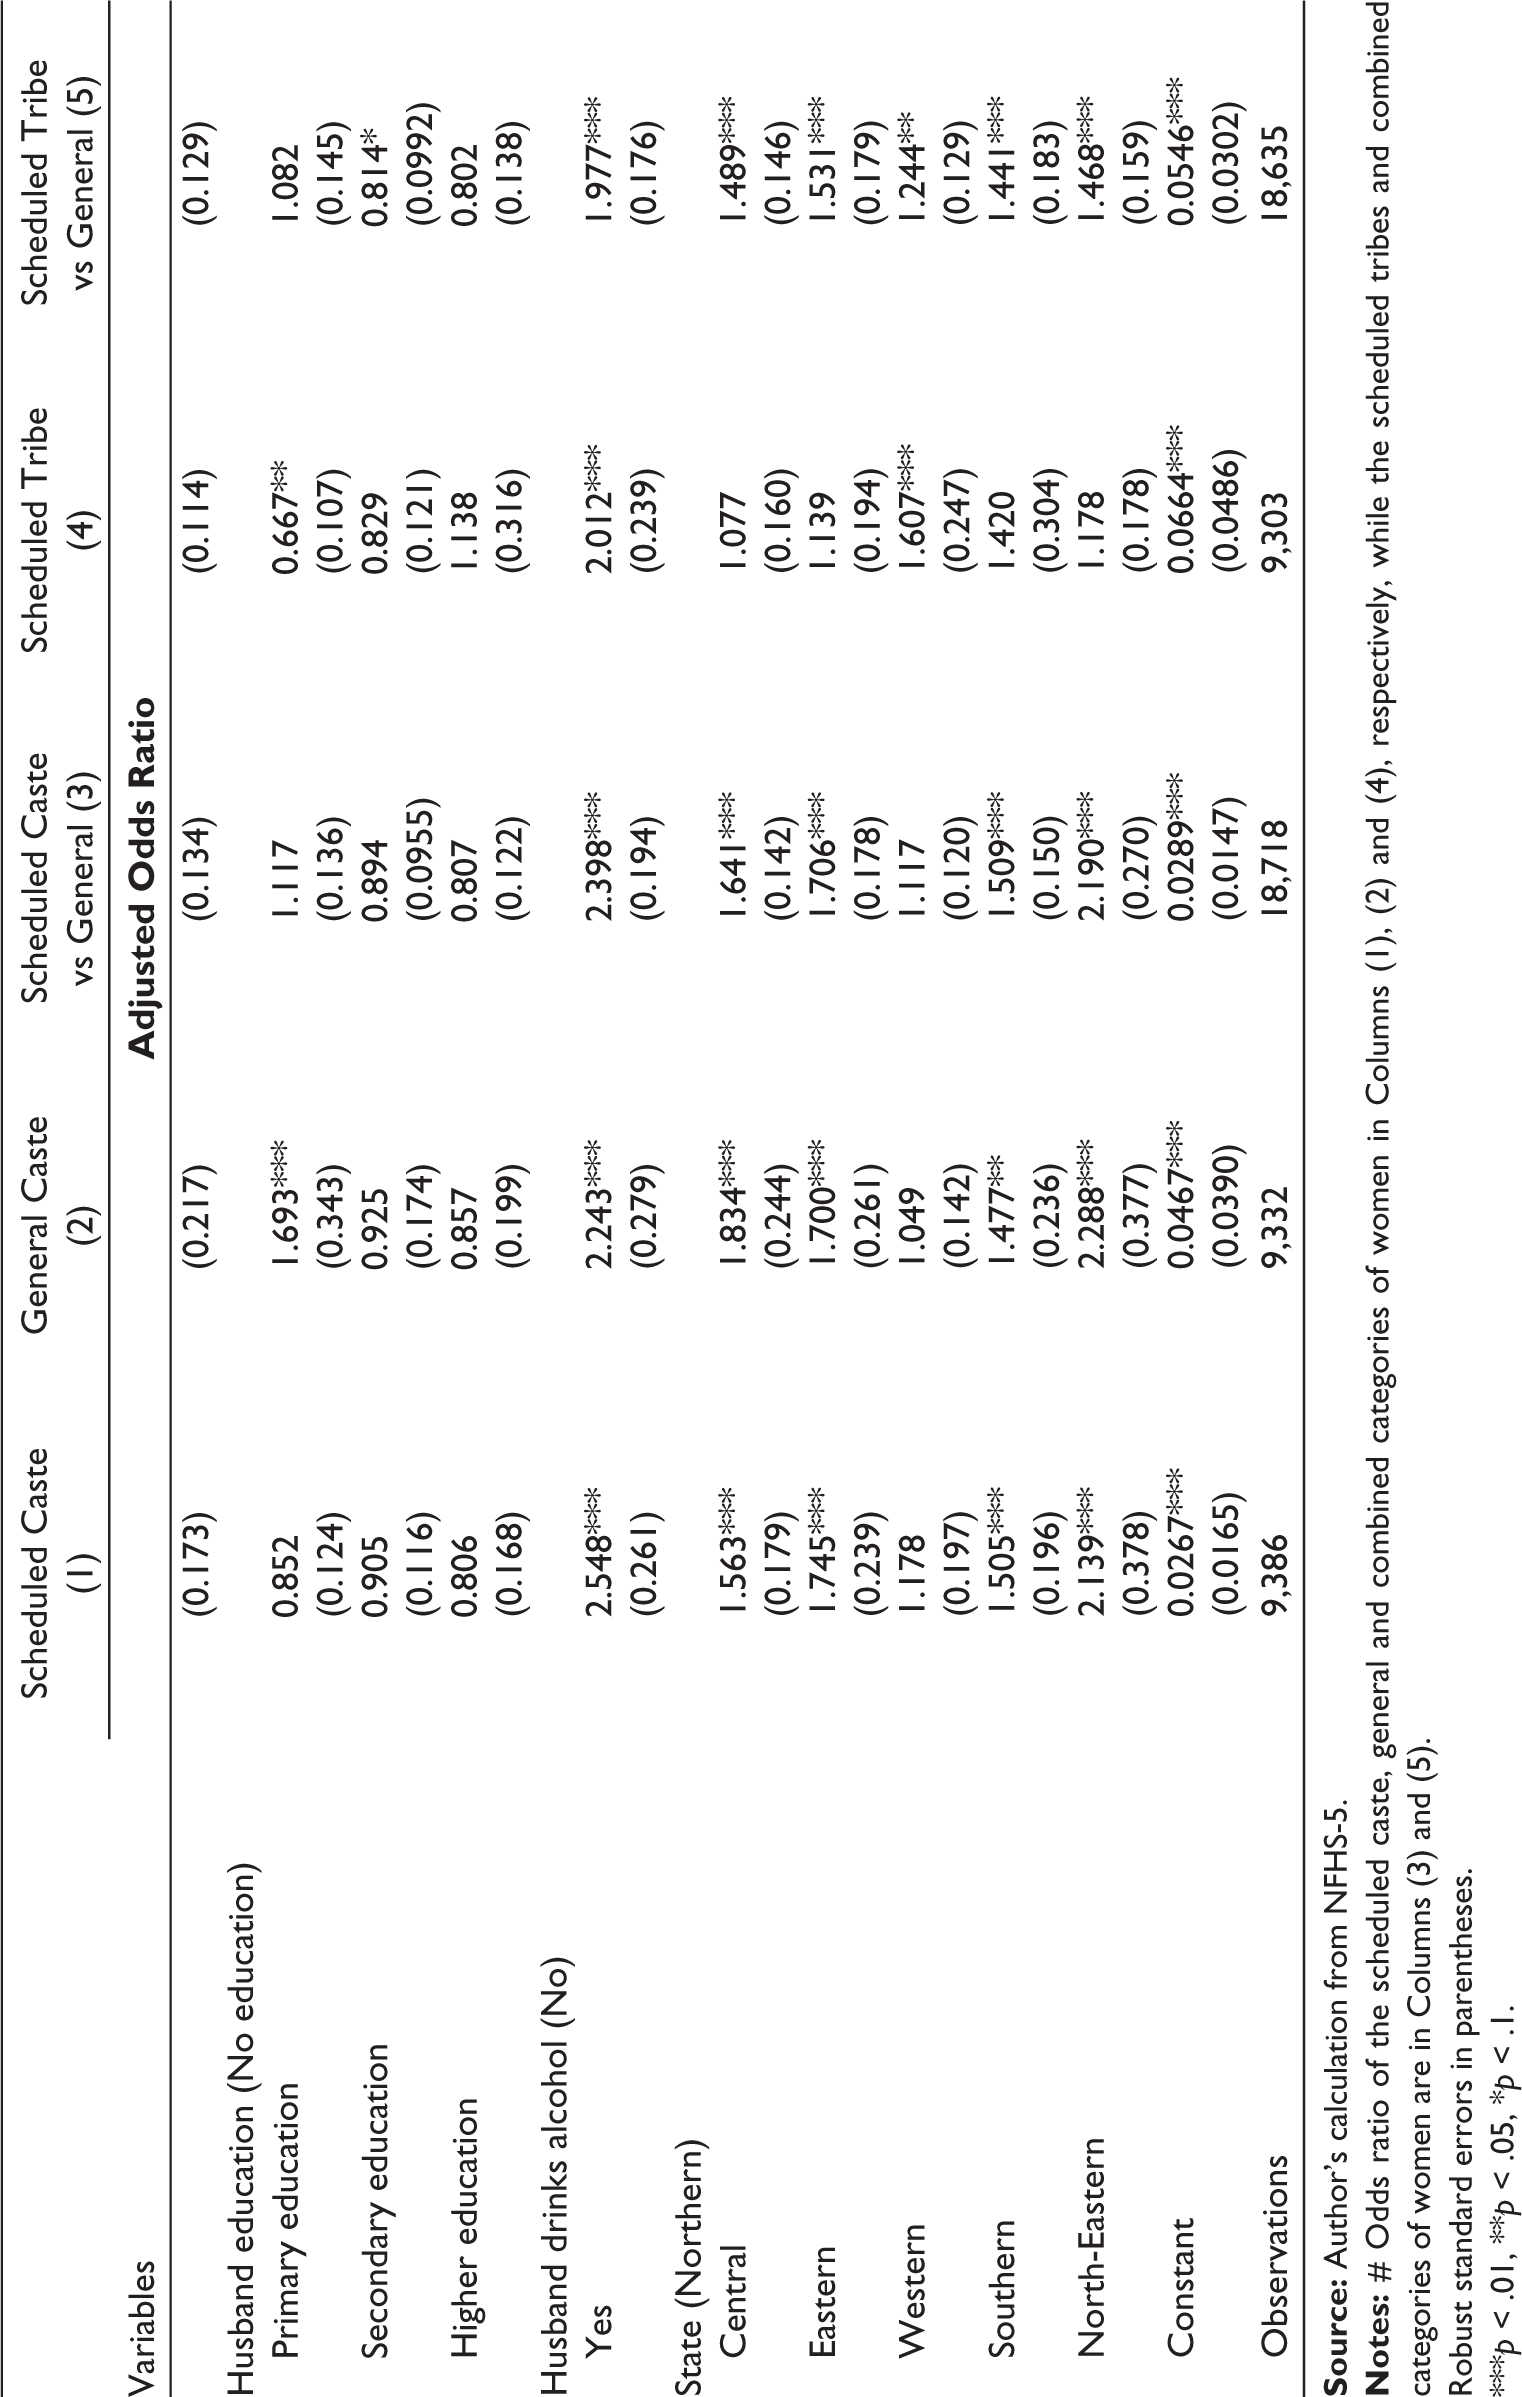
Table 4 presents the odds ratios for both SC and General women and the odds ratios for ST and General women, as well as their combined results. Results indicate that the significant causes for the occurrence of IPV in SC women are women’s working status, respondent education, more than 4+ children, reading text messages, access to the Internet, permission to take medical treatment, women’s decision-making within the household, parental IPV, acceptance of IPV by the respondents, controlling behaviour of husband, working status of the husband, region of residence and husband’s habit to drink alcohol.
Logistic Regression Results Indicate the Relationship Between IPV and Its Correlates Among SC, ST and General Women During the Period 2019–2021.
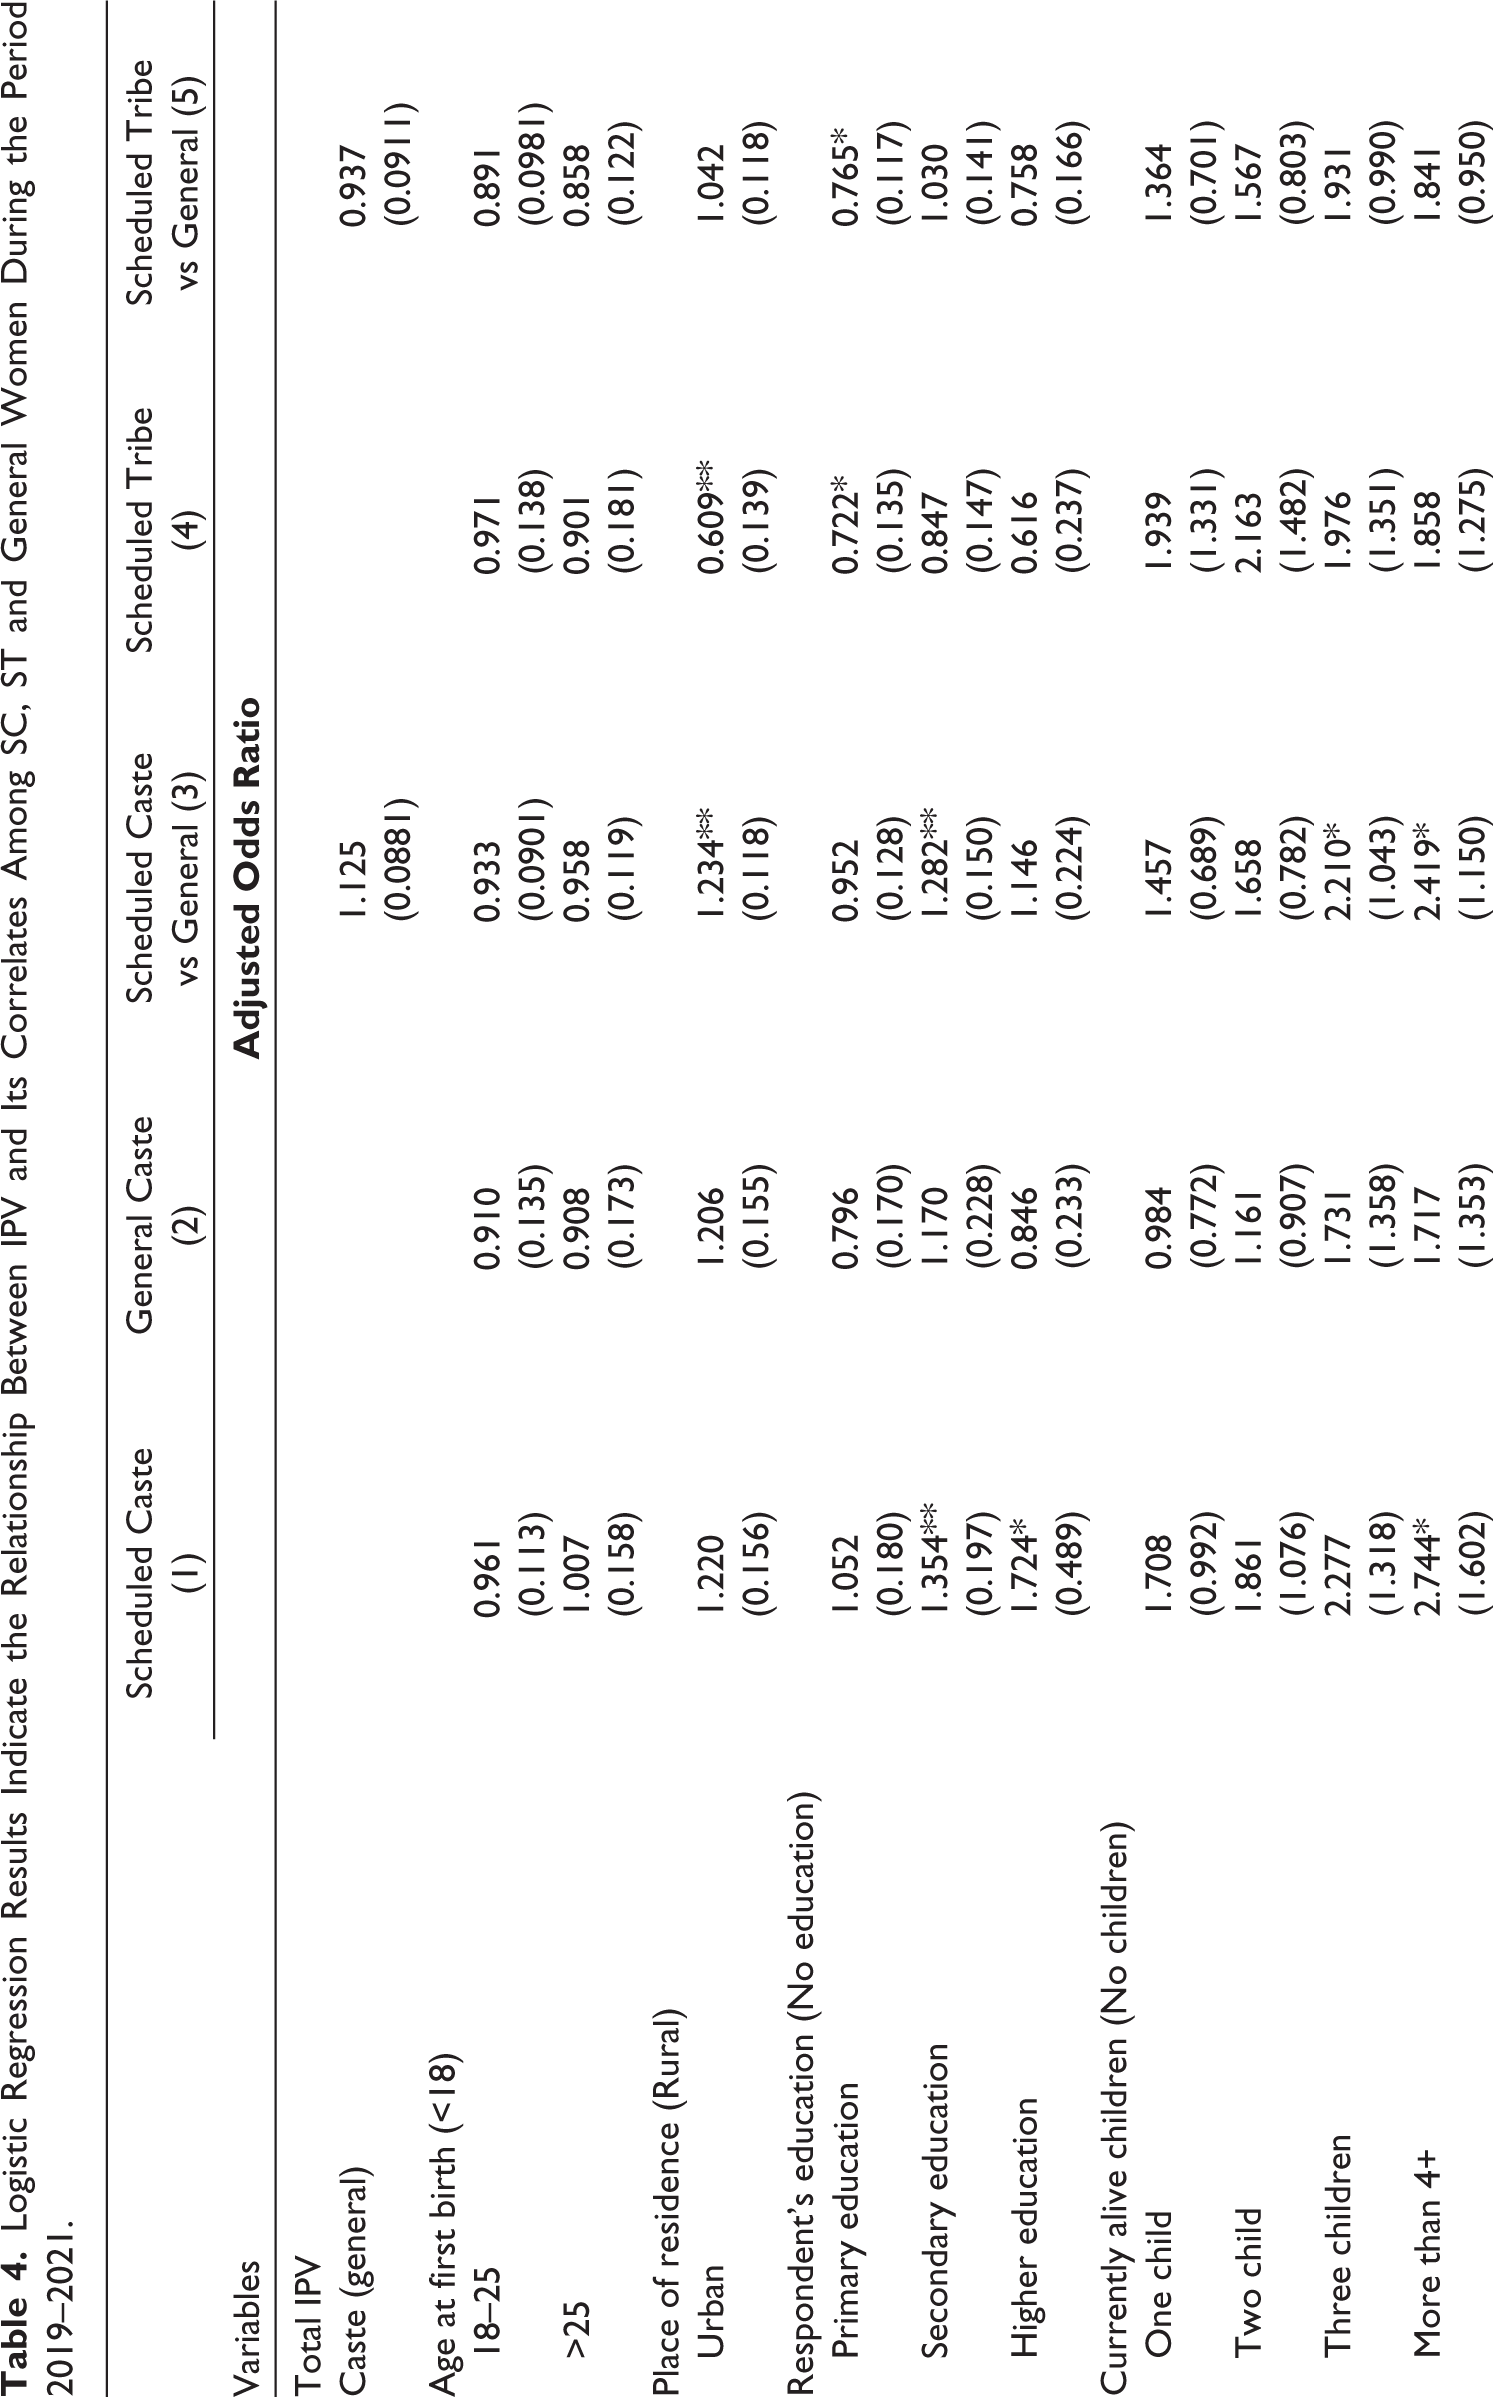
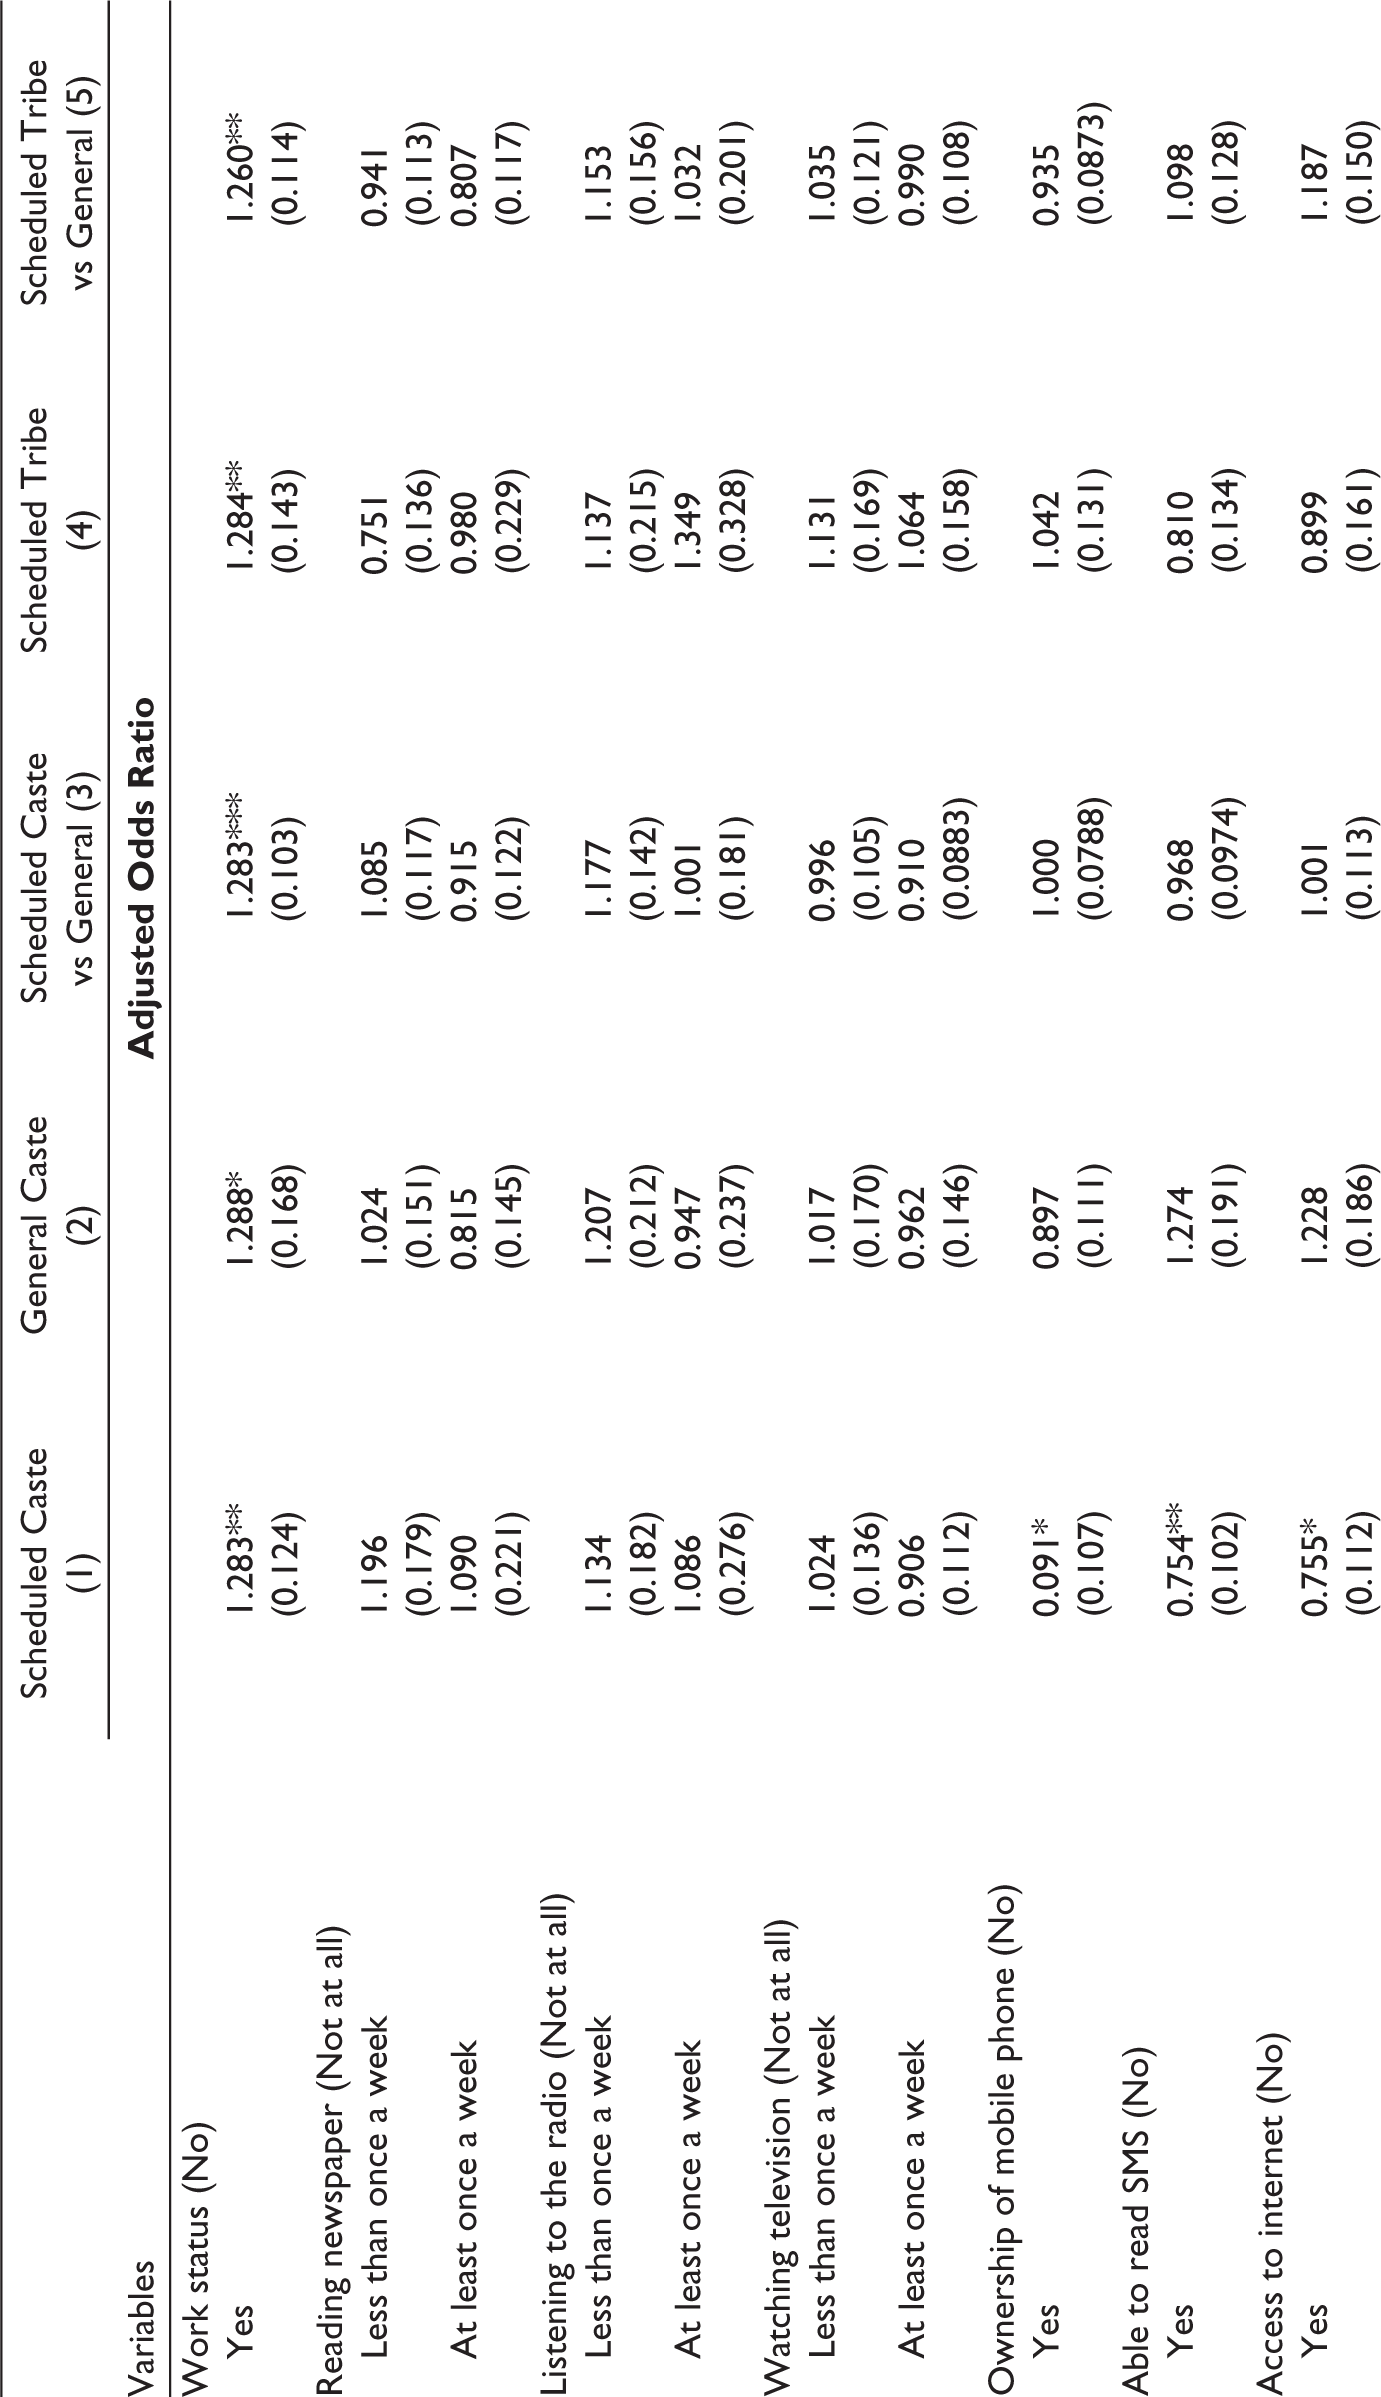
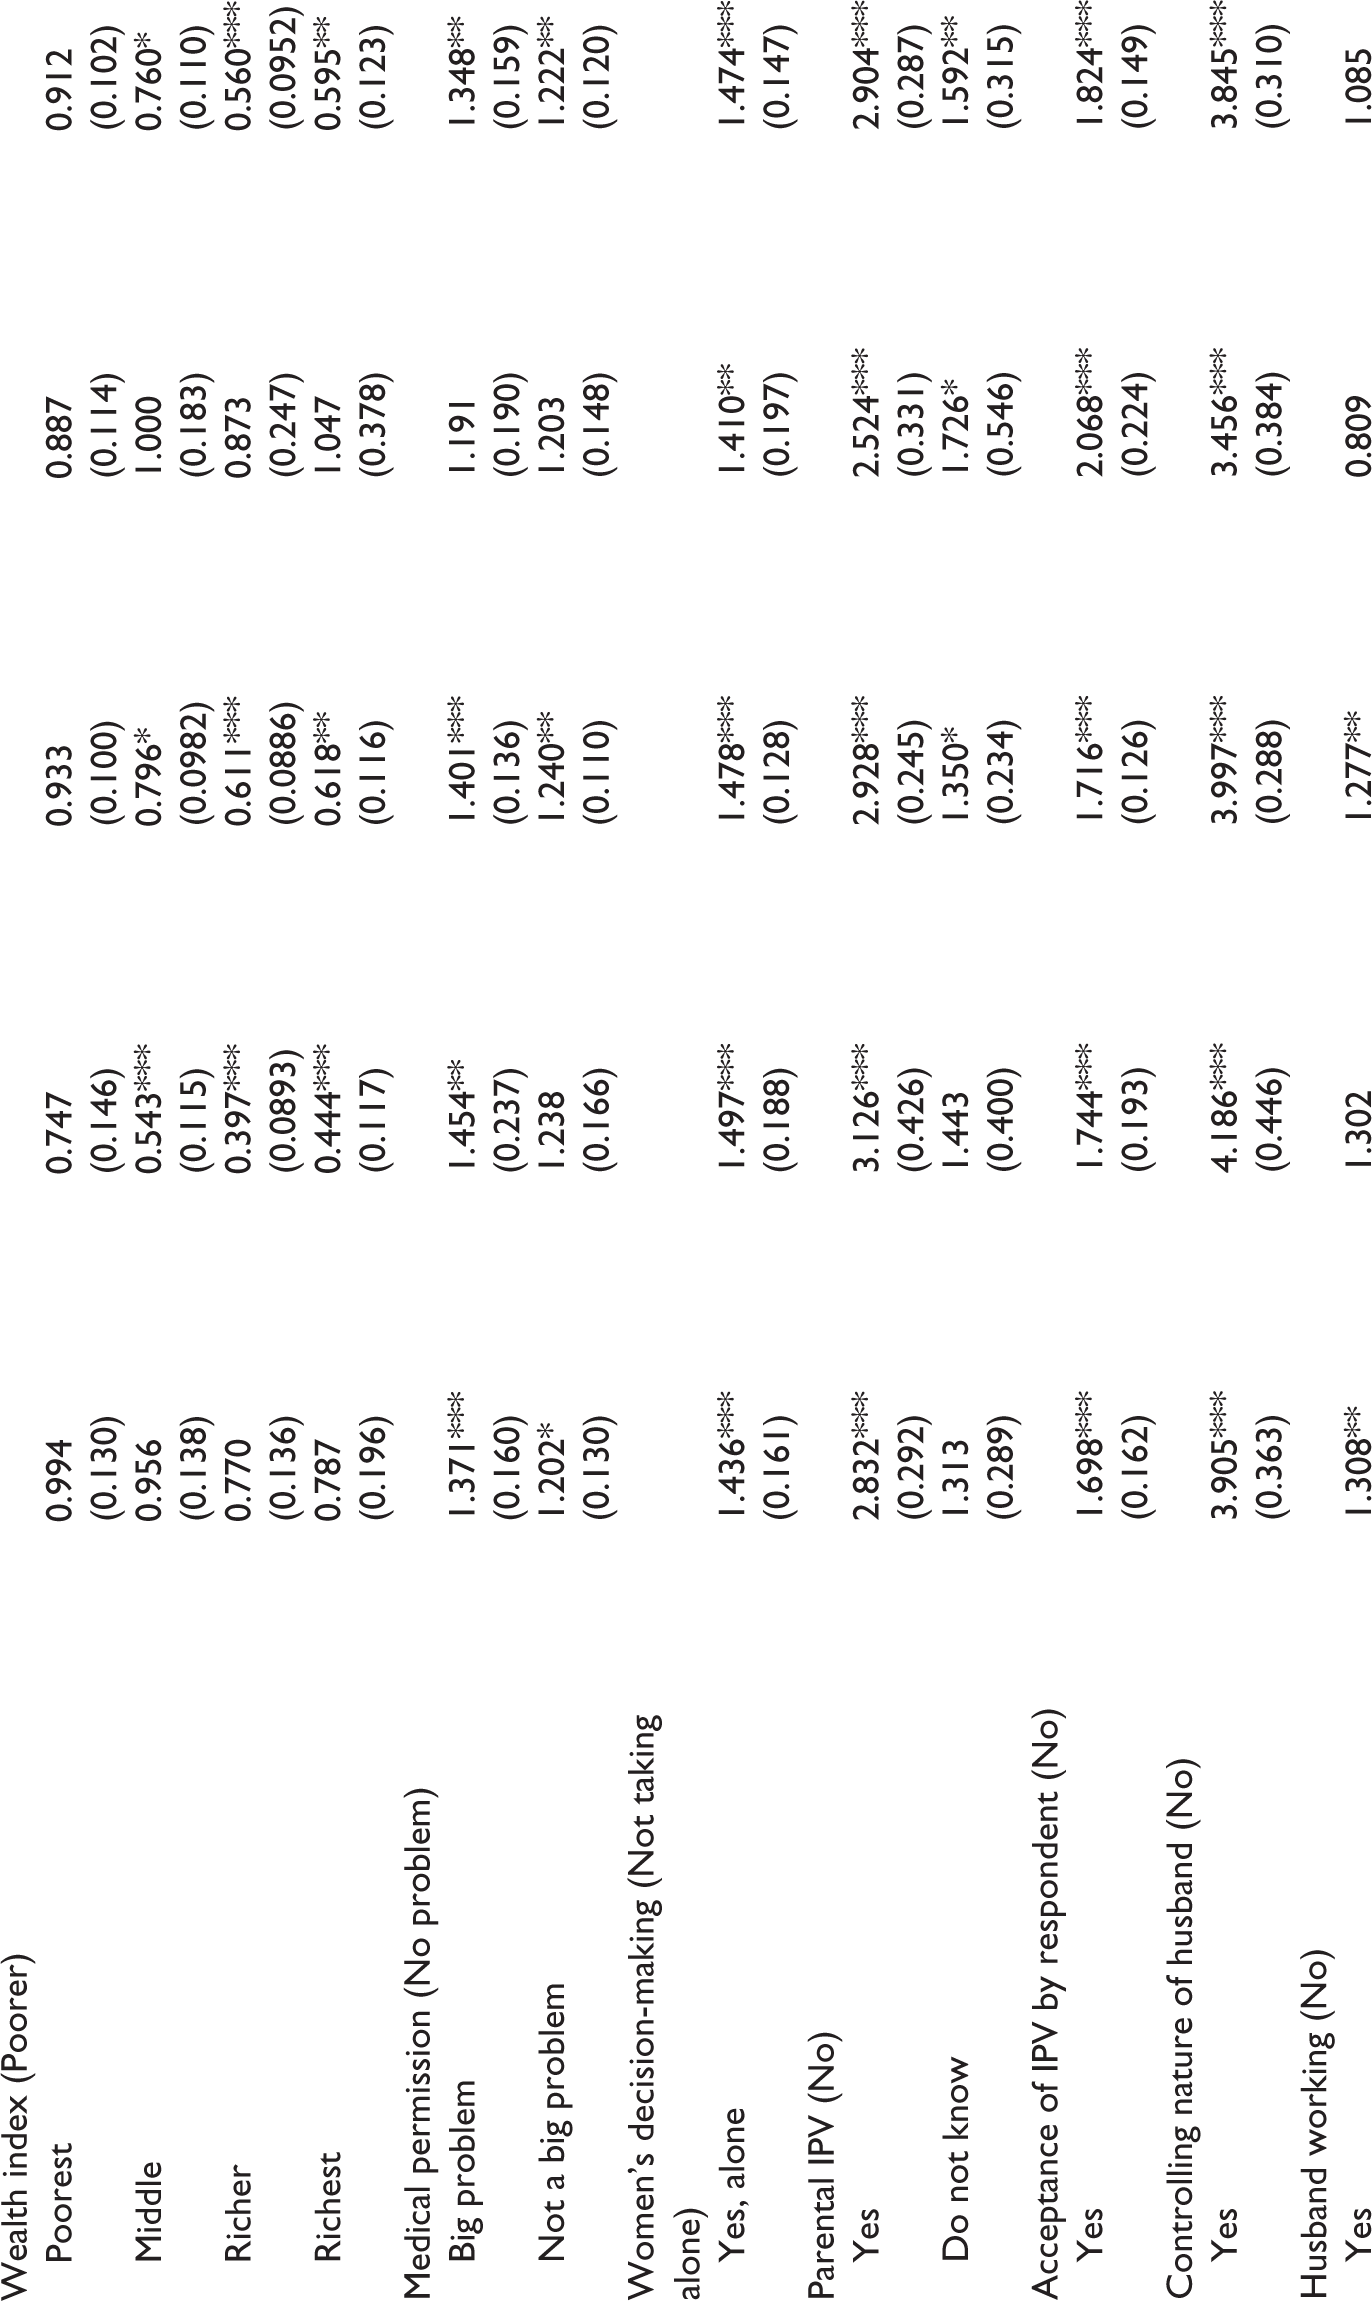
Robust standard errors in parentheses.
***p < .01, **p < .05, *p < .1.
The educational status of the women is a significant variable associated with IPV in the findings. The results suggest that women with secondary and higher education had a lower likelihood of suffering from IPV as compared to women with no education (OR = 1.35 and OR = 1.75). SC women with more education are less likely to experience IPV compared to those who are illiterate. The results align with previous literature findings in developing and developed countries (Abramsky et al., 2011; Ackerson et al., 2008). Women with higher levels of education are more likely to be employed and generate their own income, have greater confidence, better understand their rights, and have more influence in household decisions than women without higher education (Angaw et al., 2021). The study also found that women having more than 4+ children are more likely to experience IPV than those having fewer children (OR = 2.74). The desire for sons is often linked to having more children. To meet this preference, families may opt to have additional children, and women are frequently blamed and subjected to harassment for having multiple daughters (Biswas, 2017).
Moreover, the number of children directly impacts a family’s expenses. Families with more children face increased costs for infant care, education, healthcare, and other needs. This often creates financial strain, which can lead to family conflicts and, in many cases, violence experienced by women (Banerjee & Duflo, 2007; Dalal & Lindqvist, 2012). Working women who spend more than half of their time (OR = 1.28) have suffered from IPV in the household as compared to homemakers, aligning with a previous study (Bhattacharyya, 2015). The studies indicate that men in low-income families often release their frustration by physically abusing their wives, and this behaviour tends to escalate if their wives are employed. Even women in higher-level jobs are not always protected from IPV; as their economic independence grows, the incidence of IPV often increases (Rashada & Sharaf, 2016). It is shown that there is no impact of mass media, such as reading newspapers, listening to the radio, or watching television, on IPV among SC women due to their low income (Gavin & Kruis, 2022; Savage & Yancey, 2008). Mobile phone ownership among SC women shows a lower likelihood of IPV (OR = 0.091). Jensen and Oster (2009) found that access to media through digital platforms significantly reduced women’s acceptance of domestic violence in India by changing attitudes and increasing awareness. NFHS-5 (2019–2021) data show higher mobile phone usage among SC women compared to ST women, which correlates with lower IPV rates due to better connectivity and access to emergency services. As half of the women fall into the lowest wealth quintile, it is crucial to implement interventions that improve their standard of living and make a significant impact. SC women who can read SMS and have access to the Internet are less likely to experience IPV (OR = 0.75) than those who cannot read or do not have access to the Internet. Heath and Mushfiq Mobarak (2015) demonstrated that women’s economic empowerment through technology reduces IPV in the long term, as it shifts power dynamics in favour of women. Chatterjee et al. (2020) found that digital exposure fosters changes in attitudes toward IPV, making women less likely to tolerate or accept violence in their relationships.
The result shows that SC women who make decisions alone are more likely to suffer through IPV (OR = 1.43) in the household as compared to those who do not make decisions alone. Women with joint decisions with their husbands about healthcare, household spending, visits to relatives or friends, and the use of their husbands’ income were less likely to experience violence than those who made these decisions on their own. Joint decision-making likely signifies a deep sense of mutual understanding and cooperation between the partners (Raj et al., 2018). When there is mutual respect and understanding, the chances of family conflict and violence against women are significantly reduced (Svec & Andic, 2018). Most of the women have seen their parents engage in IPV (OR = 2.83), so they think that it is the regular practice of partner violence in the household. Therefore, there was an increase in the likelihood of more than two times of IPV if the respondent had ever seen their parents engage in violence. Most of the SC women are more likely to experience IPV more than two times (OR = 1.69) if the respondent has accepted the violence by her husband, such as beating, if she does not say anything, or if she goes out of the market. There was a (OR = 3.90) increase in the likelihood of reporting IPV with an increase in the controlling behaviour of the husband toward her wife. If the husband is found working, there is an increase in IPV reporting (OR = 1.30) compared to those who do not work. Husband’s education has an insignificant impact on IPV. The study also found that women with more children are more likely to experience IPV, with those with more than four children facing higher rates of partner violence (Abramsky et al., 2011; Curtis et al., 2019). SC women whose husbands found alcohol increased the likelihood of experiencing IPV (OR = 2.5) more than two and a half times compared to those who do not drink. It affects a drinker’s ability to think clearly and solve problems while heightening their focus on immediate desires and increasing their tendency to take risks, especially in male drinkers (Berg et al., 2010; Dasgupta et al., 2018; Leonard, 2005). Excessive alcohol use and heavy drinking have been associated with violence against women (Dasgupta et al., 2018). Some individuals who consume alcohol may intentionally or aggressively harm their intimate partner, believing that their intoxication will justify their actions (Wilson et al., 2014).
The findings indicate that employed women experience higher levels of domestic violence within households, encompassing both SC and ST women, as well as their combined results. Moreover, SC women who read newspapers appear to encounter more IPV compared to General women, but the difference is insignificant (Ferguson et al., 2008).
In the case of ST, women belonging to urban regions are less likely to suffer from IPV (OR = 0.60) as compared to those from rural areas of India. Women with primary education are less likely to suffer from IPV (OR = 0.722) as compared to those who are illiterate. Across all castes, the results show that working women are more experienced with IPV than nonworking women (SC, General, ST = 1.28). Wealthier women from ST show insignificant results. The results show that digital and mass media have an insignificant impact on IPV among ST women. Seeking medical help from their husband is also a trivial result. Women who make decisions alone are more likely to experience IPV (OR = 1.41) as compared to those who do not. ST women who have seen their parents engaged in IPV have experienced more than twice the likelihood (OR = 2.92) of experiencing IPV. A similar case occurred with a woman who accepted the violence by her husband and her husband’s controlling behaviour on her independence experienced two times more (OR = 2.06) and more than three times (OR = 3.45) IPV as compared to those who did not accept the violence and had not experienced the controlling nature of her husband on her many independent activities, respectively. Women whose husbands drink alcohol report an increase in the likelihood of experiencing IPV (OR = 2.10) as compared to those whose husbands do not drink. The Western region has shown more than one and a half times IPV among ST women (OR = 1.60) compared to northern India.
In wealthy households in the General category, women have ample resources to ensure a comfortable and convenient lifestyle, which in turn reduces the likelihood of women in those households experiencing IPV. Wealthy families can manage their lives more easily and smoothly, so women in affluent households experience less IPV than those in other social classes (Angaw et al., 2021; Dhar et al., 2018; Speizer & Pearson, 2011). Wealthy women from the General Caste are less likely to experience IPV than those from the poor General Caste (Middle OR = 0.543, Richer OR = 0.397, Richest OR = 0.444). General Caste women face more than one time IPV (OR = 1.45) in the case of seeking medical help from the husband, which is higher than SC and ST women. General women face similar problems in making decisions alone, and the likelihood of experiencing IPV (OR = 1.49) is almost identical to that of the SC and ST women. There was an increase in the possibility of experiencing IPV in the case of parental IPV (OR = 3.12), acceptance of IPV (OR = 1.74) by the respondents, and the controlling nature of the husband (OR = 4.186) in the General category of women. Women whose husbands have alcoholism have more than two times the likelihood of experiencing IPV (OR = 2.24) as compared to those whose husbands do not (The experience is relatively less than the IPV experience by lower caste women, SC and ST). Therefore, the husband’s alcohol consumption, parental IPV, and acceptance of IPV are significant problems in increasing IPV.
Previous studies report that IPV remains highly prevalent among tribal women, and there is a need for targeted interventions to eliminate domestic violence in the communities (Jyotirmay et al., 2022). Women from the north-eastern region of India are performing better than those from many other regions (Dey, 2025). Factors like women’s education, employment status, property rights and matriarchal society have reduced the violence against women in these regions (Pal, 2018). Women in north-east India are often viewed as relatively more empowered (Choudhury & Kumar, 2022), with greater mobility, improved access to education, higher workforce participation, and fewer or less rigid practices such as dowry and ‘parda’. This is reflected in several development indicators: many states in the region report a more balanced child sex ratio, a higher overall sex ratio, higher female literacy and greater participation of women in the workforce than most major Indian states. However, recent discussions in media reports (Parashar, 2022) have raised concern about violence against women. It shows that Manipur, with 41.6%, ranks among the worst-affected states in both the region and the country, just behind Karnataka (48.4%) and Bihar (42.5%). The reason behind the use of alcohol by men is much higher than in other states. Assam reports a higher-than-national-average rate of 34.3%, compared to the overall rate of 31.9%. In contrast, Mizoram and Nagaland perform significantly better, with much lower rates of spousal violence at 11.9% and 11.0%, respectively (Dey, 2025).
In the case of SC and ST, individuals from a lower economic background are more likely to experience spousal violence. Existing studies suggest that the higher prevalence of IPV is mainly observed among the SC and ST (Choudhury & Kumar, 2022; Donta et al., 2015), which confirms that women belong to the marginal and poor segment of society (Ackerson et al., 2008; Ahmad et al., 2021; Rocca et al., 2009).
Choudhury and Kumar (2022) argued that IPV is higher among ever-married SC women than among women in the General category in India, with 37.3% of SC women and 24.4% of General category women reporting physical, sexual, or emotional violence. The decomposition results indicate that a large share of this gap is driven by husbands’ alcohol use, household wealth, controlling behaviour, and exposure to parental IPV, highlighting the need for targeted interventions addressing alcohol consumption and related social factors to reduce the disparity. Chandra et al. (2023) argued that IPV among married women in India is strongly associated with husbands’ age, education, religion, caste, region, substance use, alcoholism, work type, wealth and attitudes that justify violence. The perception of physical IPV in northern India is shaped by patriarchal beliefs at both structural and household levels, along with factors like alcohol use. The authors argue that prevention efforts should focus more on men’s education, reducing substance abuse and alcoholism, and improving employment opportunities.
Policy Implications
Improving women’s education, employment opportunities, social networks and involvement in society is not sufficient on its own to decrease the occurrence of IPV against them. Given that half of SC and ST women in India belong to the poorest and low-income groups, it is crucial to focus on improving their economic conditions to reduce the IPV gap between SC women and those from the General category. A woman’s employment status, early marriage age, a high number of children, and her husband’s alcohol consumption were identified as significant predictors. Along with these factors, prioritizing the strict enforcement of the Protection of Women from Domestic Violence Act (PWDVA)-2005 and efforts to reduce alcoholism should be emphasized. The government should intervene by regulating major social media platforms, ensuring Internet accessibility, promoting mobile phone access, and increasing awareness of domestic violence programmes through television, radio and newspapers. The first step is to raise awareness among women that IPV is not a normative aspect of relationships but a criminal act, and they should be encouraged to voice their resistance against it. Raising awareness about laws on dowry payment, domestic violence, sexual harassment and cruelty against SCs and STs is essential. Addressing domestic violence requires community development programmes, self-help groups and online training programmes. Short-term strategies to prevent IPV should include mass media campaigns to inform the public about the law and its consequences, and to raise awareness of the law. Additionally, proper access to mass and digital media platforms will foster a positive attitude towards addressing the prevalent IPV among disadvantaged groups, and outdated socio-cultural norms and attitudes can be utilized to challenge and change them.
Conclusion
According to the above results, the gap in IPV among SC, ST and General category women is influenced by factors such as the husband’s alcohol consumption, parental IPV, the husband’s controlling behaviour, and the wealth index. Digital media, such as ownership of mobile phones, access to the Internet, and the ability to read SMS, have significantly reduced the IPV of SC women compared to other castes of women. One possible reason could be that mobile phones and SMS allow them to stay in touch with friends and family and seek assistance when necessary. Broadcast media have not shown any significant impact on IPV among social groups of women. SC and ST women from disadvantaged backgrounds, such as those who are poor, have higher parity, or have alcoholic husbands, are more likely to face IPV and its consequences compared to women from the General Caste. The study’s findings suggest that enhancing the economic status of SC and ST women could significantly reduce the differences in IPV rates between General and SC and ST women. This can only be possible over a long period. The strong influence of a husband’s alcohol use, parental IPV, and controlling behaviour emphasizes the need to change cultural norms that normalize violence against women, restricting their full rights and freedom.
Footnotes
Acknowledgements
We are grateful to the dataset, which has significantly contributed to this study and the immense help provided by the DHS programmes, International Institute of Population Sciences (IIPS), in terms of providing NFHS data.
Authors’ Contribution
Sudha Yadav conducted the literature search, conceptualized the idea, conducted data analysis, finalized the methodology and wrote the original draft of the article. Sheela Yadav reviewed, supervised and finalized the manuscript.
Data Availability Statement
The data from the National Family Health Survey that we analysed in the current study are publicly available. More information is available here
Declaration of Conflicting Interests
The authors declared no potential conflicts of interest with respect to the research, authorship and/or publication of this article.
Ethical Approval
This study does not include Human and Animal for analysis purposes. Therefore, approval is not required.
Funding
The authors received no financial support for the research, authorship and/or publication of this article.
Appendix A
Type of Violence Among SC, ST and General Category Women.
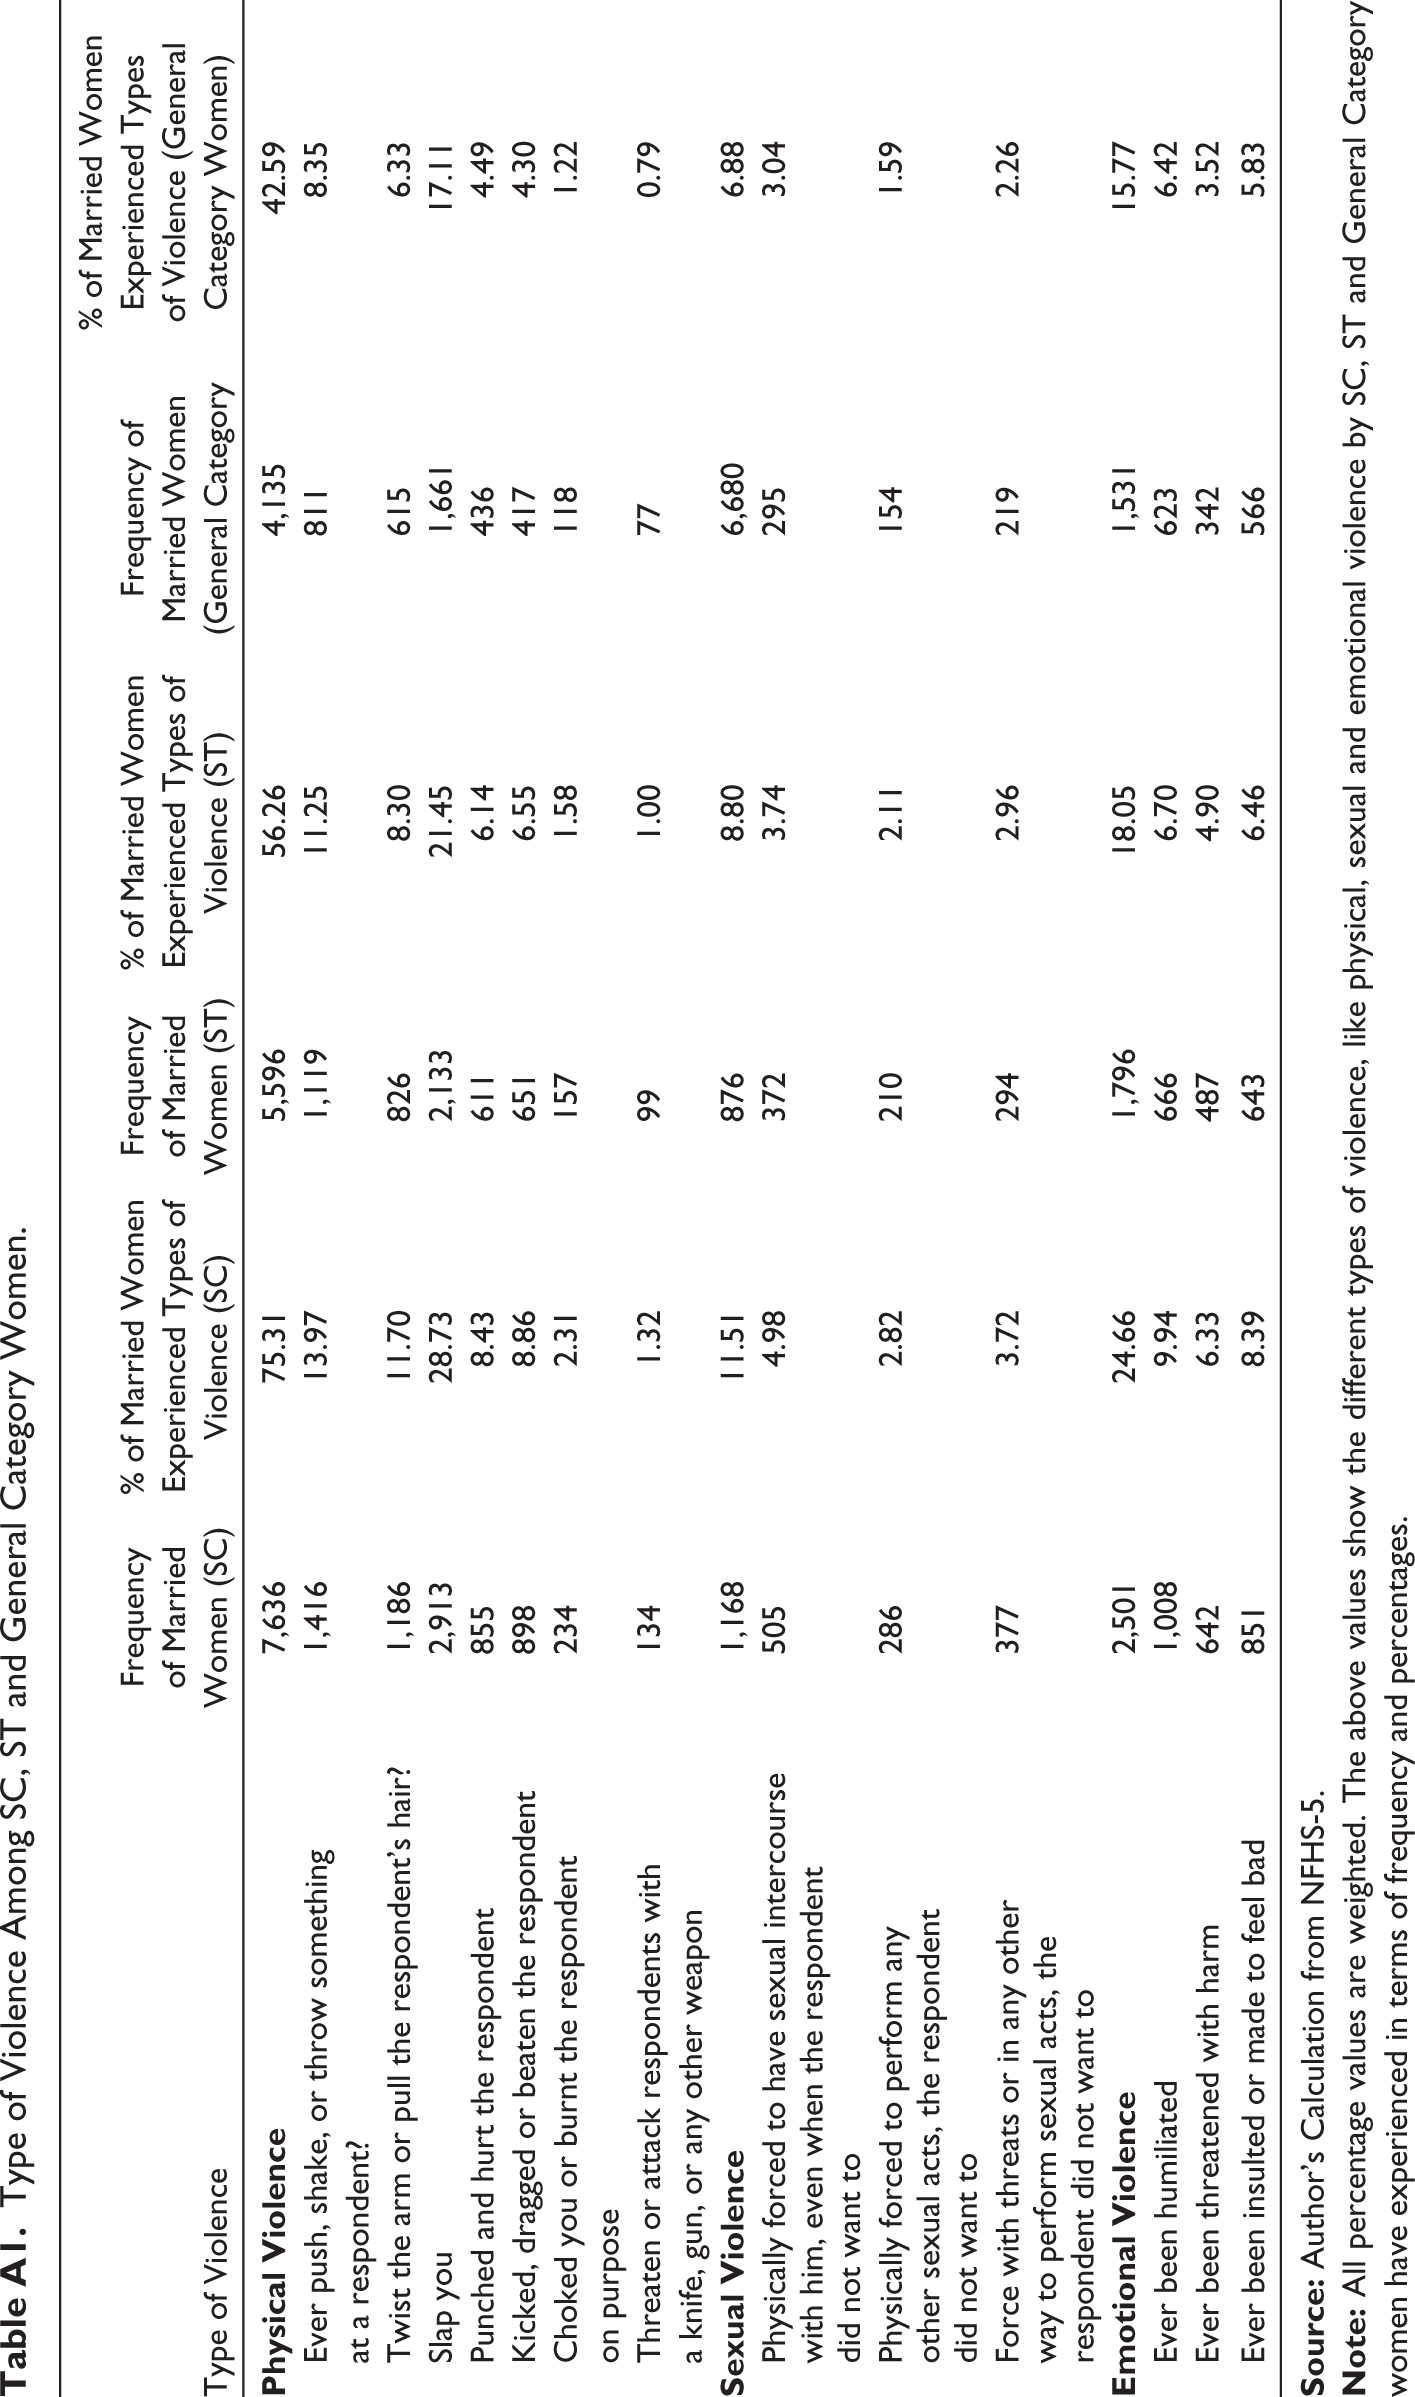
| Type of Violence | Frequency of Married Women (SC) | % of Married Women Experienced Types of Violence (SC) | Frequency of Married Women (ST) | % of Married Women Experienced Types of Violence (ST) | Frequency of Married Women (General Category | % of Married Women Experienced Types of Violence (General Category Women) |
|
|
7,636 | 75.31 | 5,596 | 56.26 | 4,135 | 42.59 |
| Ever push, shake, or throw something at a respondent? | 1,416 | 13.97 | 1,119 | 11.25 | 811 | 8.35 |
| Twist the arm or pull the respondent’s hair? | 1,186 | 11.70 | 826 | 8.30 | 615 | 6.33 |
| Slap you | 2,913 | 28.73 | 2,133 | 21.45 | 1,661 | 17.11 |
| Punched and hurt the respondent | 855 | 8.43 | 611 | 6.14 | 436 | 4.49 |
| Kicked, dragged or beaten the respondent | 898 | 8.86 | 651 | 6.55 | 417 | 4.30 |
| Choked you or burnt the respondent on purpose | 234 | 2.31 | 157 | 1.58 | 118 | 1.22 |
| Threaten or attack respondents with a knife, gun, or any other weapon | 134 | 1.32 | 99 | 1.00 | 77 | 0.79 |
|
|
1,168 | 11.51 | 876 | 8.80 | 6,680 | 6.88 |
| Physically forced to have sexual intercourse with him, even when the respondent did not want to | 505 | 4.98 | 372 | 3.74 | 295 | 3.04 |
| Physically forced to perform any other sexual acts, the respondent did not want to | 286 | 2.82 | 210 | 2.11 | 154 | 1.59 |
| Force with threats or in any other way to perform sexual acts, the respondent did not want to | 377 | 3.72 | 294 | 2.96 | 219 | 2.26 |
|
|
2,501 | 24.66 | 1,796 | 18.05 | 1,531 | 15.77 |
| Ever been humiliated | 1,008 | 9.94 | 666 | 6.70 | 623 | 6.42 |
| Ever been threatened with harm | 642 | 6.33 | 487 | 4.90 | 342 | 3.52 |
| Ever been insulted or made to feel bad | 851 | 8.39 | 643 | 6.46 | 566 | 5.83 |
Appendix B
Description of Independent Variables.
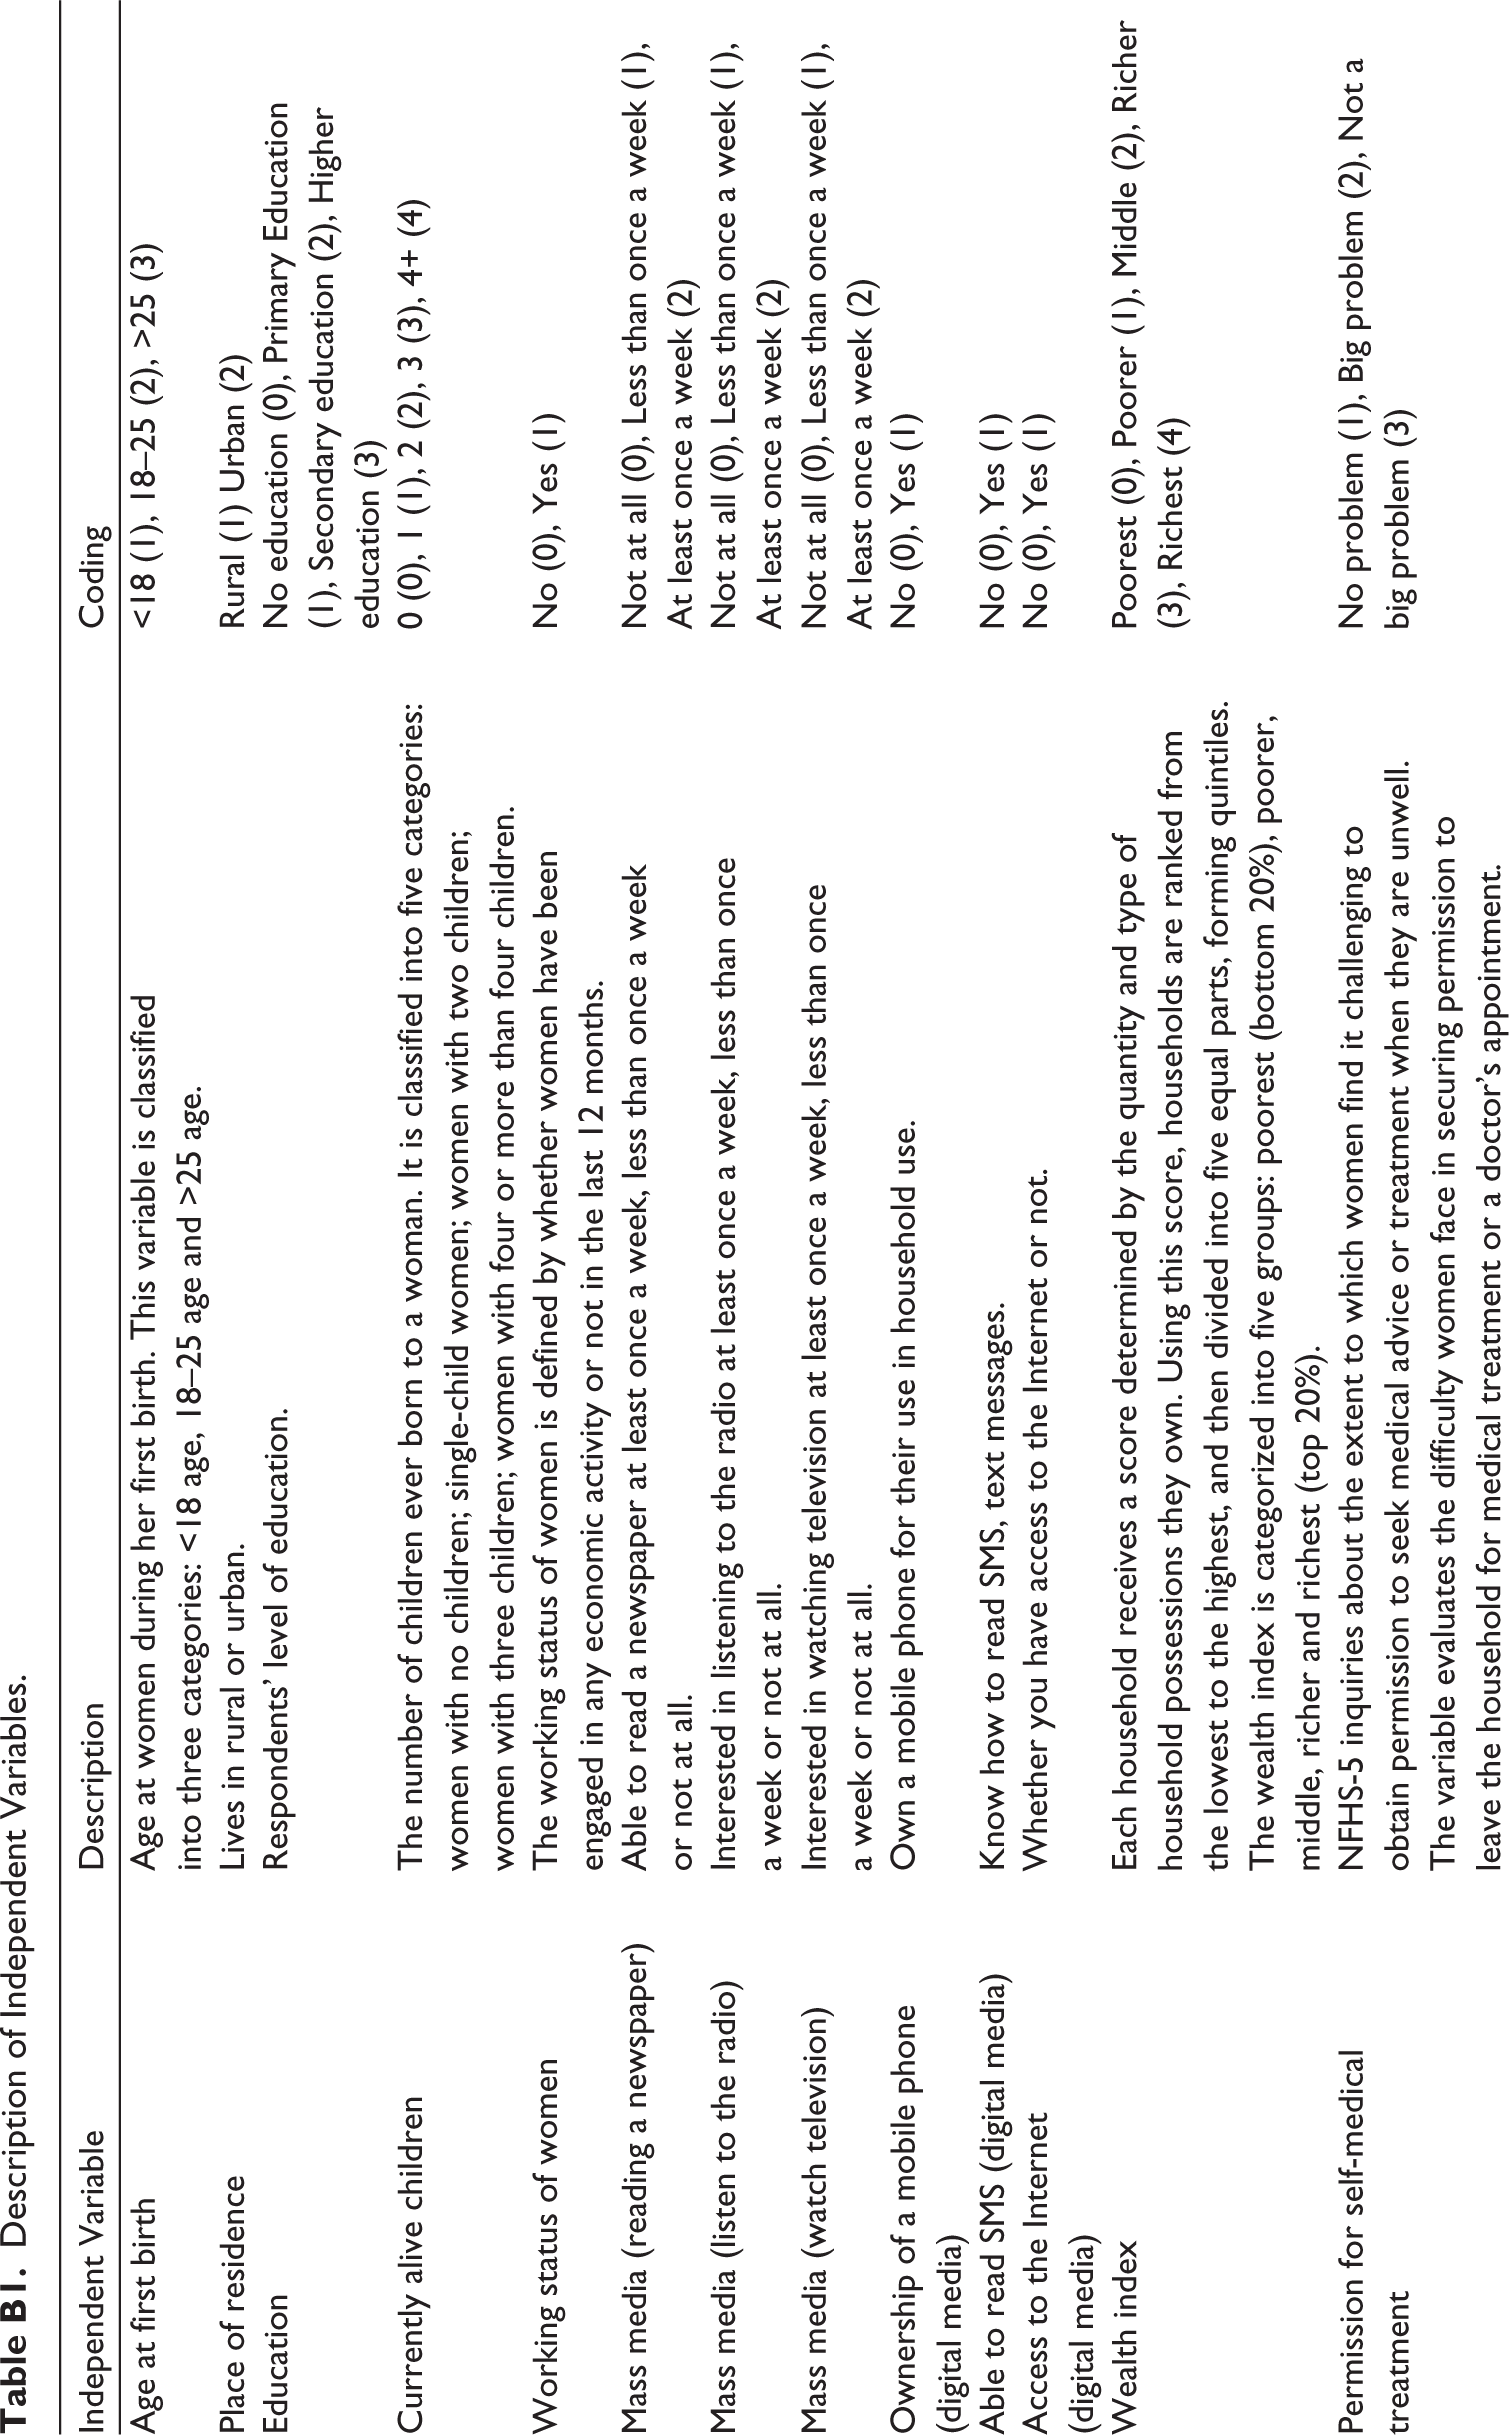
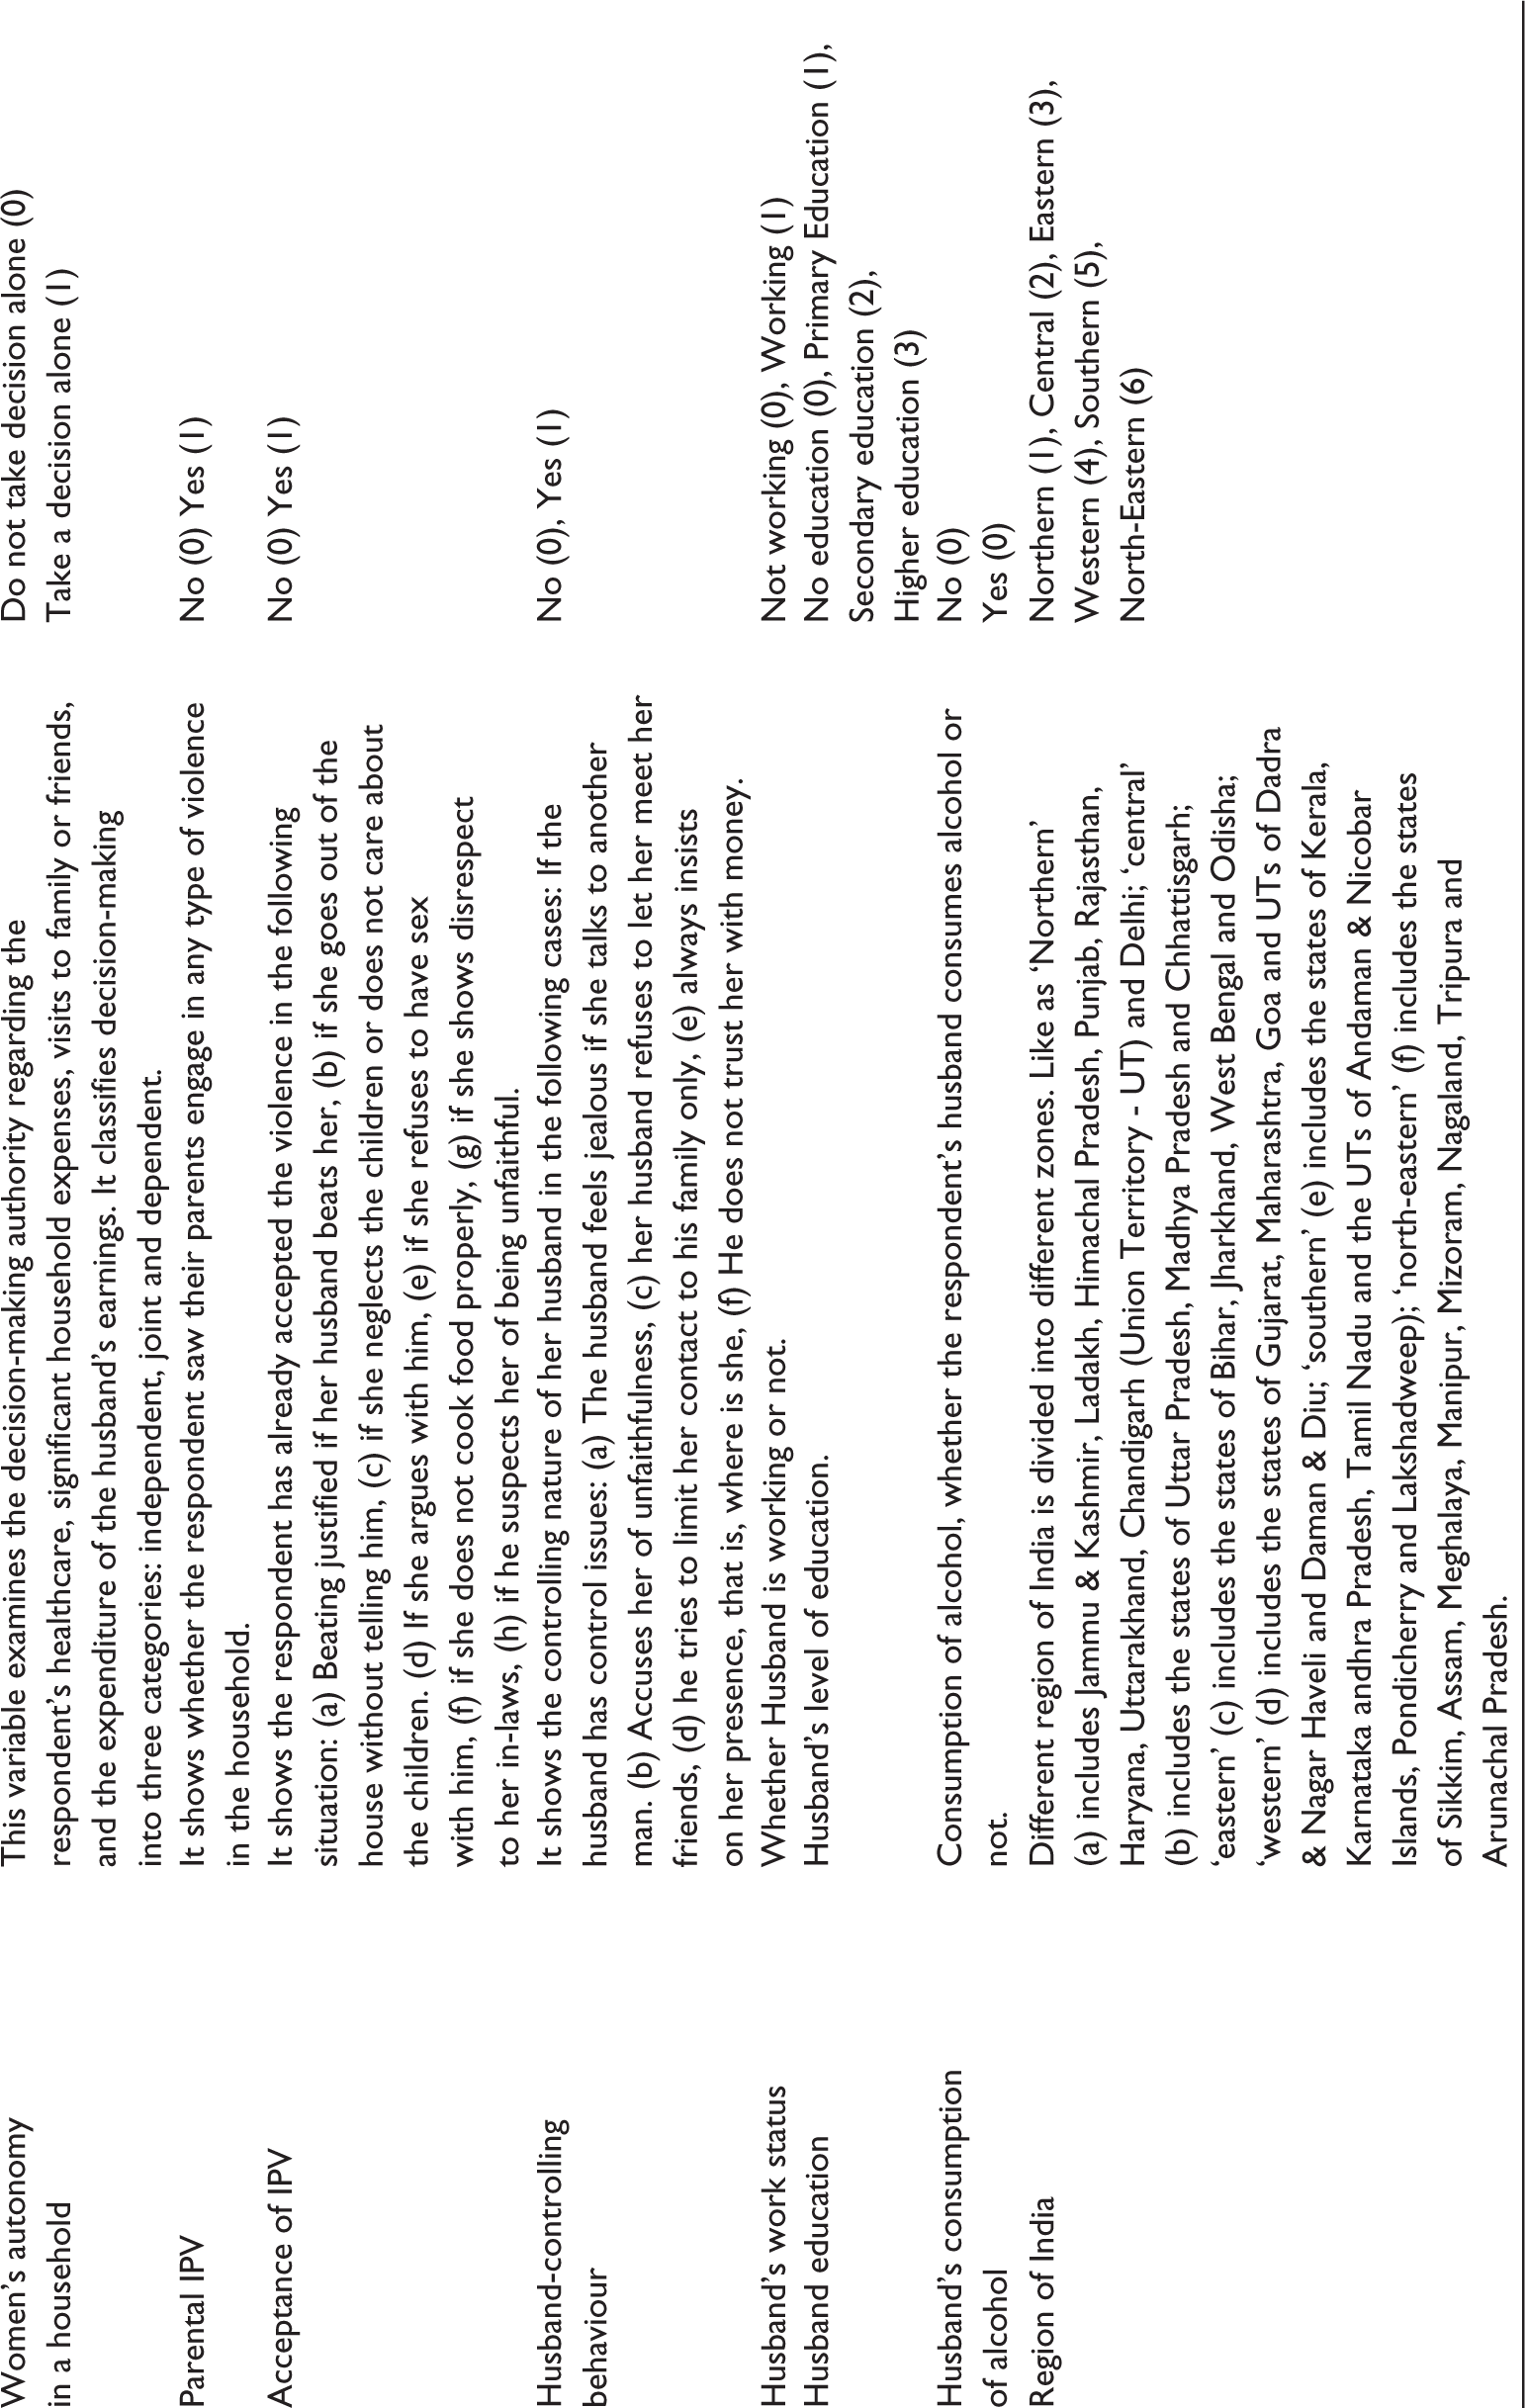
| Independent Variable | Description | Coding |
| Age at first birth | Age at women during her first birth. This variable is classified into three categories: <18 age, 18–25 age and >25 age. | <18 (1), 18–25 (2), >25 (3) |
| Place of residence | Lives in rural or urban. | Rural (1) Urban (2) |
| Education | Respondents’ level of education. | No education (0), Primary Education (1), Secondary education (2), Higher education (3) |
| Currently alive children | The number of children ever born to a woman. It is classified into five categories: women with no children; single-child women; women with two children; women with three children; women with four or more than four children. | 0 (0), 1 (1), 2 (2), 3 (3), 4+ (4) |
| Working status of women |
The working status of women is defined by whether women have been engaged in any economic activity or not in the last 12 months. | No (0), Yes (1) |
| Mass media (reading a newspaper) | Able to read a newspaper at least once a week, less than once a week or not at all. | Not at all (0), Less than once a week (1), At least once a week (2) |
| Mass media (listen to the radio) | Interested in listening to the radio at least once a week, less than once a week or not at all. | Not at all (0), Less than once a week (1), At least once a week (2) |
| Mass media (watch television) | Interested in watching television at least once a week, less than once a week or not at all. | Not at all (0), Less than once a week (1), At least once a week (2) |
| Ownership of a mobile phone (digital media) | Own a mobile phone for their use in household use. | No (0), Yes (1) |
| Able to read SMS (digital media) | Know how to read SMS, text messages. | No (0), Yes (1) |
| Access to the Internet (digital media) | Whether you have access to the Internet or not. | No (0), Yes (1) |
| Wealth index | Each household receives a score determined by the quantity and type of household possessions they own. Using this score, households are ranked from the lowest to the highest, and then divided into five equal parts, forming quintiles. The wealth index is categorized into five groups: poorest (bottom 20%), poorer, middle, richer and richest (top 20%). | Poorest (0), Poorer (1), Middle (2), Richer (3), Richest (4) |
| Permission for self-medical treatment | NFHS-5 inquiries about the extent to which women find it challenging to obtain permission to seek medical advice or treatment when they are unwell. The variable evaluates the difficulty women face in securing permission to leave the household for medical treatment or a doctor’s appointment. | No problem (1), Big problem (2), Not a big problem (3) |
| Women’s autonomy in a household | This variable examines the decision-making authority regarding the respondent’s healthcare, significant household expenses, visits to family or friends, and the expenditure of the husband’s earnings. It classifies decision-making into three categories: independent, joint and dependent. | Do not take decision alone (0) Take a decision alone (1) |
| Parental IPV | It shows whether the respondent saw their parents engage in any type of violence in the household. | No (0) Yes (1) |
| Acceptance of IPV | It shows the respondent has already accepted the violence in the following situation: (a) Beating justified if her husband beats her, (b) if she goes out of the house without telling him, (c) if she neglects the children or does not care about the children. (d) If she argues with him, (e) if she refuses to have sex with him, (f) if she does not cook food properly, (g) if she shows disrespect to her in-laws, (h) if he suspects her of being unfaithful. | No (0) Yes (1) |
| Husband-controlling behaviour | It shows the controlling nature of her husband in the following cases: If the husband has control issues: (a) The husband feels jealous if she talks to another man. (b) Accuses her of unfaithfulness, (c) her husband refuses to let her meet her friends, (d) he tries to limit her contact to his family only, (e) always insists on her presence, that is, where is she, (f) He does not trust her with money. | No (0), Yes (1) |
| Husband’s work status | Whether Husband is working or not. | Not working (0), Working (1) |
| Husband education | Husband’s level of education. | No education (0), Primary Education (1), Secondary education (2), Higher education (3) |
| Husband’s consumption of alcohol | Consumption of alcohol, whether the respondent’s husband consumes alcohol or not. | No (0) Yes (0) |
| Region of India | Different region of India is divided into different zones. Like as ‘Northern’ (a) includes Jammu & Kashmir, Ladakh, Himachal Pradesh, Punjab, Rajasthan, Haryana, Uttarakhand, Chandigarh (Union Territory - UT) and Delhi; ‘central’ (b) includes the states of Uttar Pradesh, Madhya Pradesh and Chhattisgarh; ‘eastern’ (c) includes the states of Bihar, Jharkhand, West Bengal and Odisha; ‘western’ (d) includes the states of Gujarat, Maharashtra, Goa and UTs of Dadra & Nagar Haveli and Daman & Diu; ‘southern’ (e) includes the states of Kerala, Karnataka andhra Pradesh, Tamil Nadu and the UTs of Andaman & Nicobar Islands, Pondicherry and Lakshadweep); ‘north-eastern’ (f) includes the states of Sikkim, Assam, Meghalaya, Manipur, Mizoram, Nagaland, Tripura and Arunachal Pradesh. | Northern (1), Central (2), Eastern (3), Western (4), Southern (5), North-Eastern (6) |