






Abstract
Keywords
Introduction
Geographic atrophy (GA) secondary to dry age-related macular degeneration (AMD) is a leading cause of irreversible vision impairment worldwide, with limited therapeutic interventions available. 1 Overactivation of the innate immune system plays a central role in the development and progression of GA. 2 A focus on the complement or humoral component has led to the development and US Food and Drug Administration approval of complement factor depletion therapeutics to prevent visual loss and reduce the rate of lesion growth in eyes with GA. Pegcetacoplan (Apellis), a complement C3 depleter, and avacincaptad (IvericBio), a complement C5 depleter, decrease GA progression rates by significantly disabling the alternative complement pathway. 3 Two phase 3 clinical trials of pegcetacoplan, OAKS and DERBY, demonstrated a modest reduction in the GA lesion growth rate from baseline in both the monthly and every-other-month intravitreal treatment groups, compared with sham treatment. 4 Avacincaptad also demonstrated meaningful reductions in GA lesion growth in the GATHER1 and GATHER2 clinical trials.5,6 While these therapies reduce GA progression as measured with autofluorescence imaging, only minimal prespecified functional improvements have been demonstrated with either. 7
The inability to demonstrate functional benefit through complement pathway inhibition alone suggests a critical role of the cellular arm of the innate immune system in the pathogenesis and progression of GA. Reprogramming the entire innate immune system—including the complement cascade, activated microglia, and macrophages—toward a proresolution, neuroprotective, and anti-inflammatory state may help to reduce inflammation-driven photoreceptor degeneration and retinal pigment epithelium loss, while enhancing photoreceptor survival and minimizing cytokine-induced apoptosis. 8
Polysialic nanoparticles are capable of binding and agonizing Siglec receptors on microglia/macrophages. These activate the immunoreceptor tyrosine-based inhibitory motif that recruits Src homology region 2 domain–containing phosphatase-1/2—a powerful protein phosphatase that dephosphorylates all immune activation pathways, initiating repolarization of microglia and macrophages to a healing, homeostatic, and neuroprotective state. 9 Polysialic nanoparticles also bind and activate complement factor H to deamplify, but not disable, the alternative complement cascade. 10 Intravitreal injections of polysialic nanoparticles in a bright, light-induced retinal degeneration model inhibited retinal degeneration, regained photoreceptor ERG function, and reduced tumor necrosis factor-ɑ levels and macrophage infiltration. 11
AVD-104 (Aviceda Therapeutics Inc) is a clinical-grade, polysialic acid-coated nanoparticle. In vitro and in vivo preclinical ocular and systemic toxicology assays supported the advancement of AVD-104 into human clinical trials. 12 The SIGLEC phase 2 clinical trial evaluated the safety and efficacy of AVD-104. The primary endpoint was safety, while secondary endpoints included change in GA size on fundus autofluorescence (FAF), best-corrected visual acuity (BCVA), and various additional functional and structural efficacy analyses. At 1 of the study sites, a substudy used multifocal electroretinography (mfERG) to evaluate retinal electrical responses at baseline, treatment visit, and at each subsequent monthly visit in the study eye, and at baseline and the final 3-month visit in the fellow eye. While effective in differentiating retinal disorders, mfERG is rarely used as a clinical endpoint, in part due to variability in mfERG responses longitudinally. 13 However, multiple studies have reported its efficacy and accuracy in detecting photoreceptor degeneration and functional disturbances of the macula.14,15 Thus, this substudy also sought to assess the utility of mfERG testing as a potential functional clinical endpoint for investigations evaluating GA treatments.
Methods
Overview
Part 1 of the SIGLEC phase 2/3 trial (ClinicalTrials.gov ID: NCT05839041) evaluated the safety and efficacy of AVD-104 in a multicenter, open-label study with 30 participants. Institutional review board and ethics committee approval, as well as informed consent, were obtained. Participants were divided into 4 cohorts, receiving a single AVD-104 intravitreal injection of either 0.1, 0.5, 1, or 3 mg per eye. In study eyes, mfERG testing was performed during a screening visit, a baseline visit, and then monthly for 3 months. In fellow eyes, mfERG testing was performed at a screening visit, a baseline visit, and at month 3.
Study Population
The study population consisted of individuals aged 55 years or older with evidence of GA, secondary to nonexudative AMD with central involvement and a BCVA in the study eye of 5 to 55 letters. If the GA was multifocal, at least 1 focal lesion had to be at least 1.25 mm2, and foveal center involvement was present in all study eyes. All enrolled patients had bilateral advanced GA.
For the study eye, exclusion criteria included a history or presence of exudative AMD or choroidal neovascularization, any active ocular disease that could confound visual function or assessment of the macula, any intraocular surgery (excluding intraocular lens replacement >3 months prior), history of herpetic infection, or prior corneal transplantation. For the fellow eye, exclusion criteria included the presence of active choroidal neovascularization, history of herpetic infection, or any concurrent disease that might require intervention during the study period.
Outcome Measures
A slitlamp examination, intraocular pressure measurement (applanation), and collection of BCVA were performed as part of a standardized protocol. To maintain consistency, the same type of VA measurement (with correction) was used at each visit. BCVA was measured using the Early Treatment Diabetic Retinopathy Study (ETDRS) eye chart. To provide an objective evaluation of anatomic changes from treatment, optical coherence tomography (OCT) testing was conducted at all visits. FAF, color fundus photography, and fluorescein angiograms also allowed for assessment of changes. For mfERG testing, Diagnosys hardware and related software (Diagnosys LLC) were used for recording, following all International Society for Clinical Electrophysiology of Vision guidelines for mfERG. 16
After obtaining adequate dilation with tropicamide and phenylephrine eye drops and administering topical anesthetic proparacaine drops, we placed a Dawson, Trick, and Litzkow electrode in the cul-de-sac of each eye, confirming contact between the silver filament and the cornea at the inferior limbal margin. The patient was observed and confirmed to maintain fixation through the 4-minute test, broken into 30-second intervals. The Diagnosys ERG system projected onto a liquid crystal display a stimulus matrix consisting of 61 scaled hexagonal elements that switched between black and white according to a prespecified m-sequence during stimulation. mfERG results were interpreted based on waveforms in the trace array and assessed for spatial variations across each visit. Quantitative analyses of overall N1-P1 response density and overall P1 implicit time were performed as primary outcome measures. Trace arrays for each visit of each eye were reviewed by 2 independent analysts, rating noise on a scale of 1 to 3. Any trace array rated a 3 was removed from the study.
Perilesional regions adjacent to the GA border have been shown to have a faster reduction in sensitivity over time compared with areas farther away and are most vulnerable to further progression of GA. To determine the impact of treatment on the perilesional retina, a secondary, post hoc analysis was performed, in which areas of GA were first traced on FAF screening images using a methodology from previous studies. Next, mfERG trace arrays were overlaid onto FAF imaging according to their corresponding retinal regions. We defined the “junctional zone” as the mfERG hexagons directly adjacent to the FAF imaging–defined GA border, which allowed us to assess retinal regions at the highest risk for change. This region surrounding the GA border is also similar to the 250-µm junctional zone described in microperimetry studies of eyes with GA.17,18
Two analysts manually selected hexagons surrounding the GA border for each patient using data from the screening visit; both were masked to the eye’s treatment group (study or fellow eye) as well as follow-up data from the eye. Custom software from Diagnosys averaged the response densities of the selected hexagons for each patient, and the average response density of these preselected hexagons was followed longitudinally in the study (Figure 1). These computed junctional N1-P1 response densities and junctional P1 implicit times were set for each patient at the screening visit, assuring that electrical responses from the same retinal area were measured over time. Presence of hyperautofluorescence was not a determining factor in hexagon selection. As a standard clinical endpoint for AMD, BCVA served as a comparator to the results of mfERG testing.
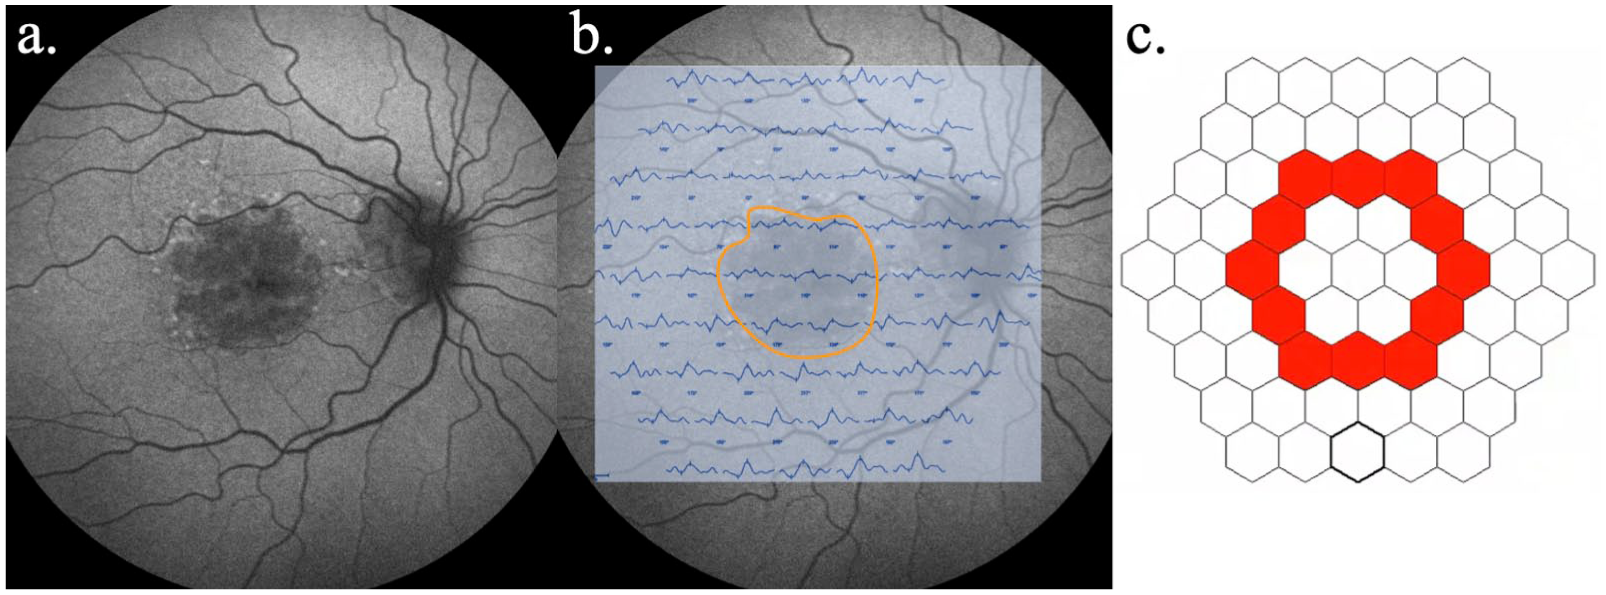
An example of the junctional multifocal electroretinography analysis in a patient, including (A) fundus autofluorescence (FAF), (B) screening trace array overlayed on FAF imaging with the geographic atrophy lesion outlined, and (C) the hexagonal elements selected for this patient within the Diagnosys software (red; Diagnosys LLC).
Statistical Methods
Descriptive statistics were calculated to identify mean changes in ETDRS letters, overall N1-P1 response density, overall P1 implicit time, junctional N1-P1 response density, and junctional P1 implicit time. When assessing change, values at screening and baseline visits were averaged as the reference, excluding any mfERG tests with severe noise.
After performing the Shapiro-Wilk test for normality, the overall N1-P1 response density and junctional N1-P1 response density data were confirmed to be normally distributed at all 4 time points (P > .05). Consequently, to assess the statistical significance of the mean changes in overall N1-P1 response density and junctional N1-P1 response density, the results of paired t tests and pairwise comparisons from repeated-measures analysis of variance were used, though the Wilcoxon signed-rank test produced significance similar to the other 2 statistical tests. All analyses were conducted using Microsoft Excel and SPSS 29 (SPSS Inc), with P < .05 considered statistically significant.
Variability in overall N1-P1 response density was determined based on the change from screening to baseline visits in the study and fellow eyes, in which no treatment was provided. Changes in mfERG responses were assessed based on whether they reached a gain of 20% or more in response density, which was selected based on being beyond other reported coefficients of variability in mfERG. Seiple et al reported a coefficient of variability of 6.2% to 14.5%, while Parks et al reported a value of 10.1% for control patients and 16.9% for patients with retinitis pigmentosa.19,20
Results
A total of 6 patients, including 2 from the 1 mg per eye cohort (patients 1 and 2) and 4 from the 3 mg per eye cohort (patients 3-6), were followed up at 1 site and underwent additional mfERG testing. Figure 2 details the percent change in overall N1-P1 response density across the study duration in all study eyes. Three of 6 eyes treated with AVD-104 achieved a gain of 20% or more in overall N1-P1 response density at month 2, which was considered a meaningful increase in this study. Among all patients, at the months 1 and 2 visits, overall N1-P1 response density decreased beyond 20% in only 1 visit (month 1 for patient 5). Furthermore, overall N1-P1 response density in this patient rebounded to just above baseline at month 2.
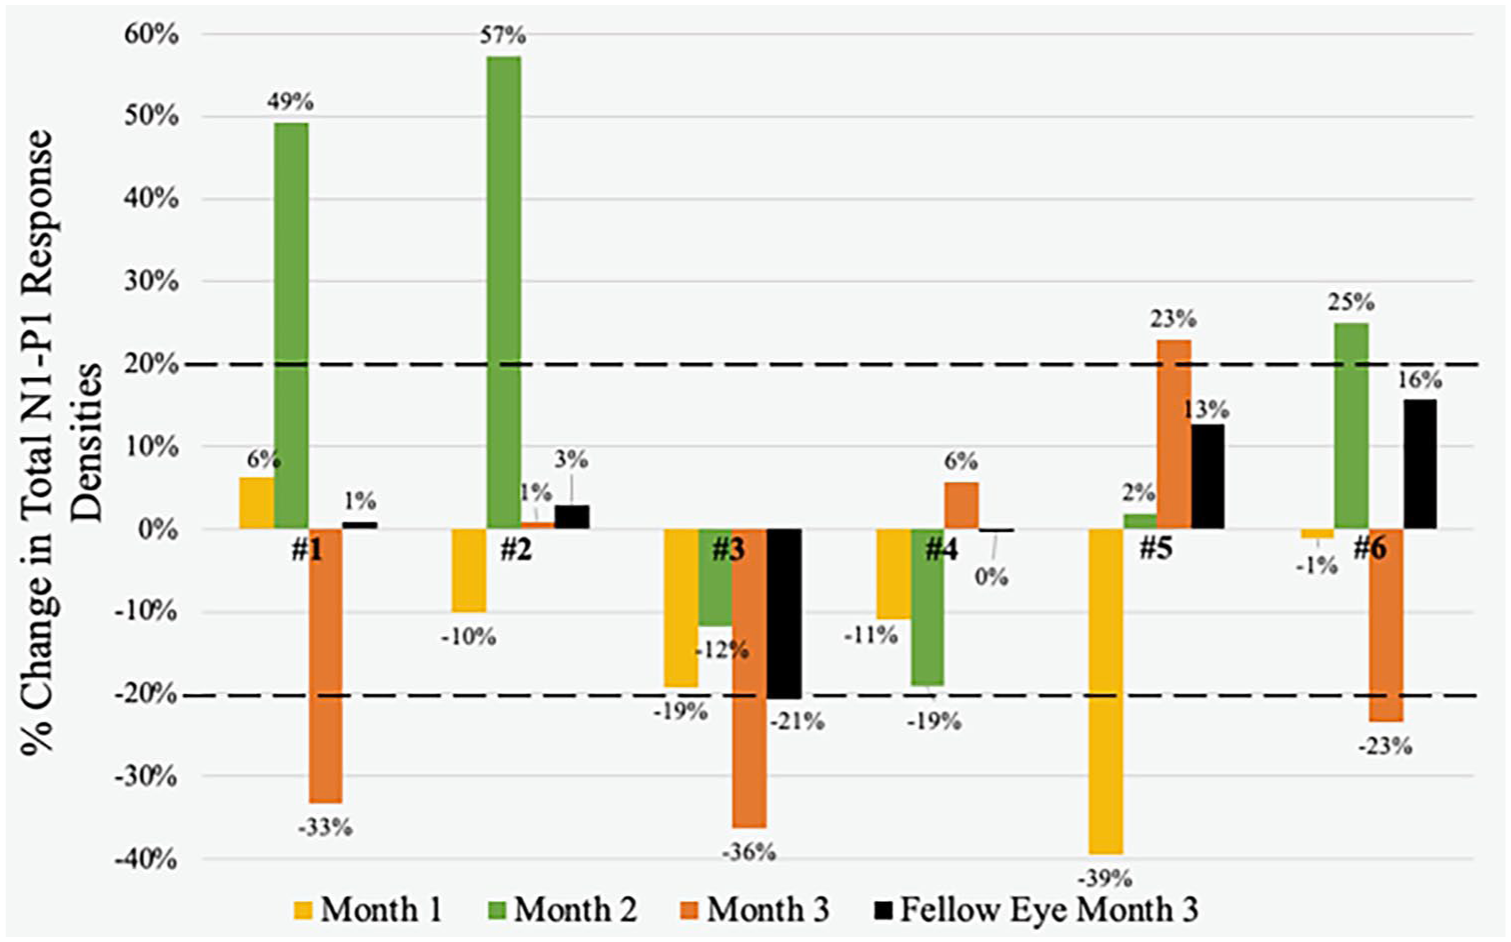
Percent change in overall N1-P1 response density at months 1, 2, and 3 for study eyes and at month 3 for fellow eyes in patients 1 through 6. During the study period, patient 2’s fellow eye received pegcetacoplan treatment, and patient 4’s fellow eye received avacincaptad treatment. Dotted lines represent the normal variability window of +20%.
There were also 4 untreated fellow eyes in the study, of which 3 resulted in a change of 20% or less. As an additional outcome measure for variability, we collected the percent change in overall N1-P1 response density from the screening visit to the baseline visit in study eyes and fellow eyes (Table 1). Of 8 eyes, 7 were within normal variability, and the only eye with a change of 20% or more was a fellow eye.
Variability of Overall Response Density Between Screening and Baseline Visits in Study and Fellow Eyes. a
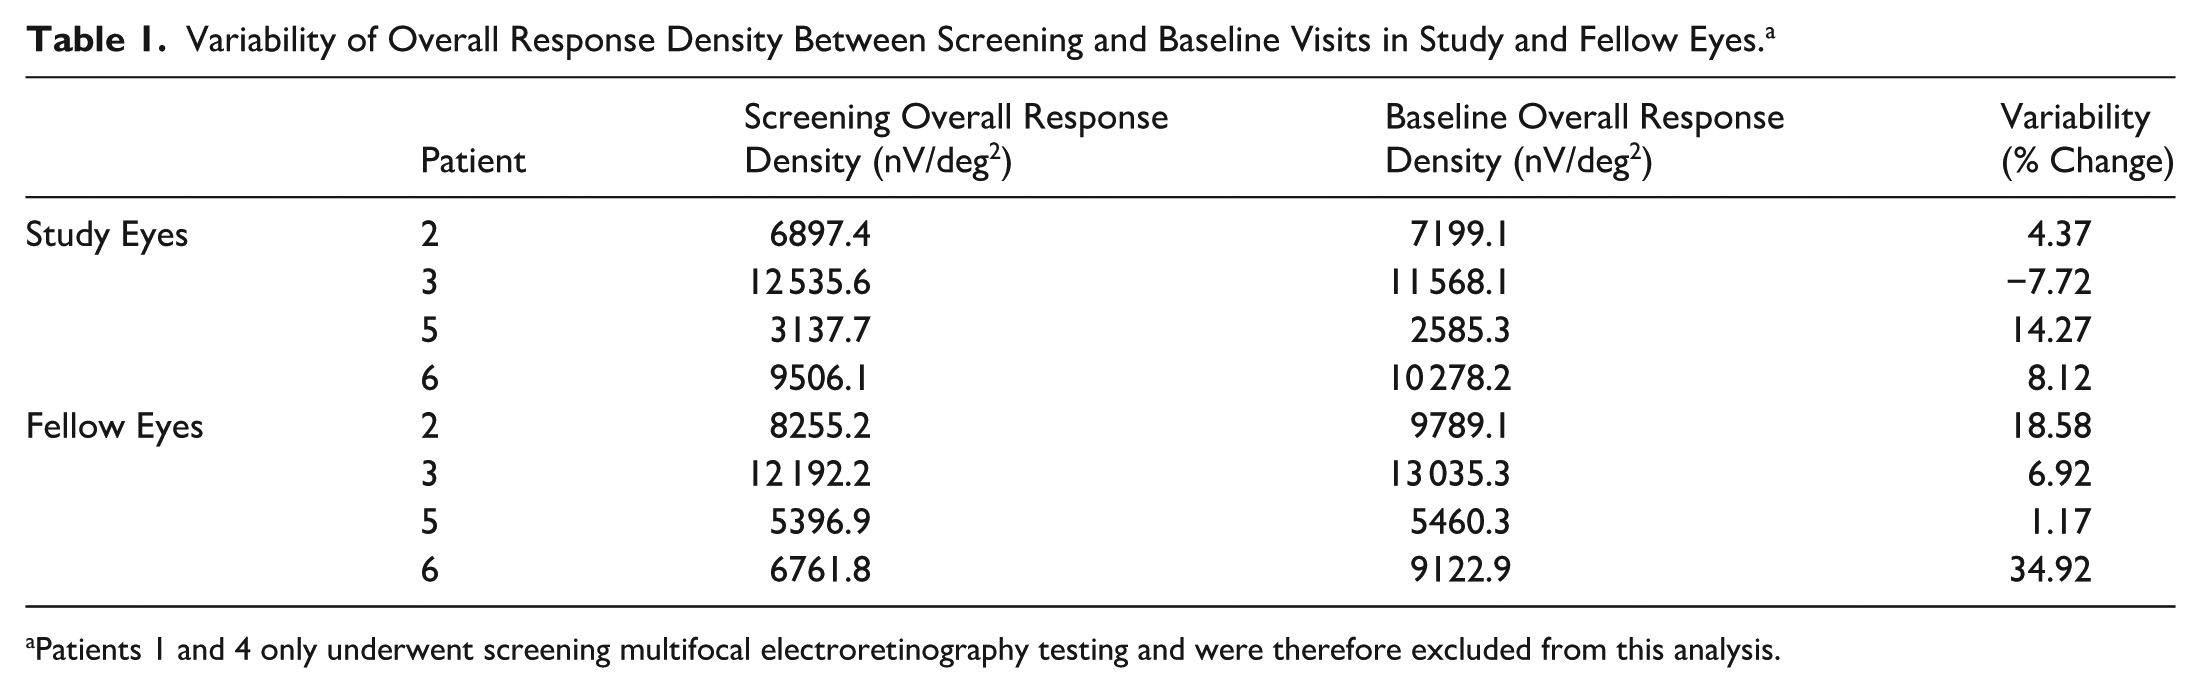
Patients 1 and 4 only underwent screening multifocal electroretinography testing and were therefore excluded from this analysis.
In the post hoc analysis of the junctional zone, 5 of 6 study eyes achieved a gain of 20% or more in mean junctional N1-P1 response density at month 2, and 3 study eyes maintained this gain at month 3 (Figure 3). No study eye had a loss of more than 20% in mean junctional N1-P1 response density at any visit. All fellow eyes not receiving any GA treatment exhibited minimal changes at month 3. Of note, both fellow eyes that were receiving complement inhibitor therapy demonstrated large increases in percent change of mean junctional N1-P1 response density, including patient 2 with 54% (pegcetacoplan treatment) and patient 4 with 32% (avacincaptad treatment).
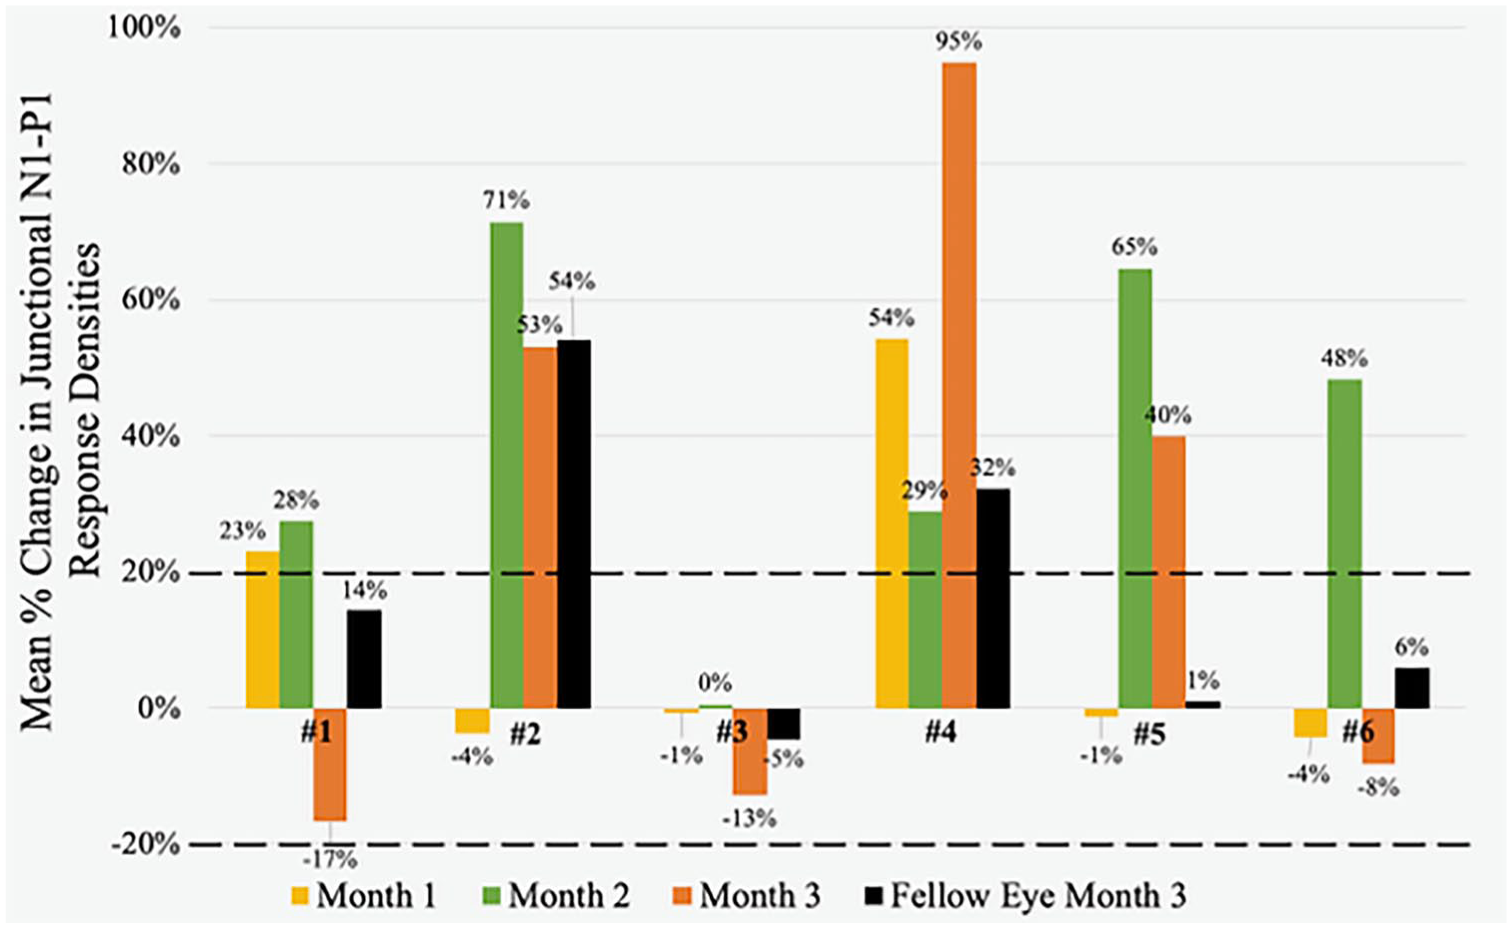
Percent change in mean junctional N1-P1 response densities at months 1, 2, and 3 for all study eyes and at month 3 for fellow eyes in patients 1 through 6. During the study period, patient 2’s fellow eye received monthly pegcetacoplan treatment, and patient 4’s fellow eye received monthly avacincaptad treatment.
In eyes treated with AVD-104, there was a consistent improvement in mean BCVA observed across all visits, reaching statistical significance at month 3 with an increase of 6.0 ETDRS letters over baseline (P = .04) (Table 2). Although the mean percent change in overall N1-P1 response density did not change significantly at any 1 visit, a 17% gain occurred at month 2. Mean percent change in junctional N1-P1 response density reached a statistically significant increase of 40.1% (P = .01) at month 2, before decreasing slightly at month 3 to 25.0% over baseline.
Changes in BCVA, Overall Response Density, Overall Implicit Time, Junctional Response Density, and Junctional Implicit Time From Baseline to Month 3 in Study Eyes and Fellow Eyes That Did Not Undergo Complement Inhibitor Therapy.
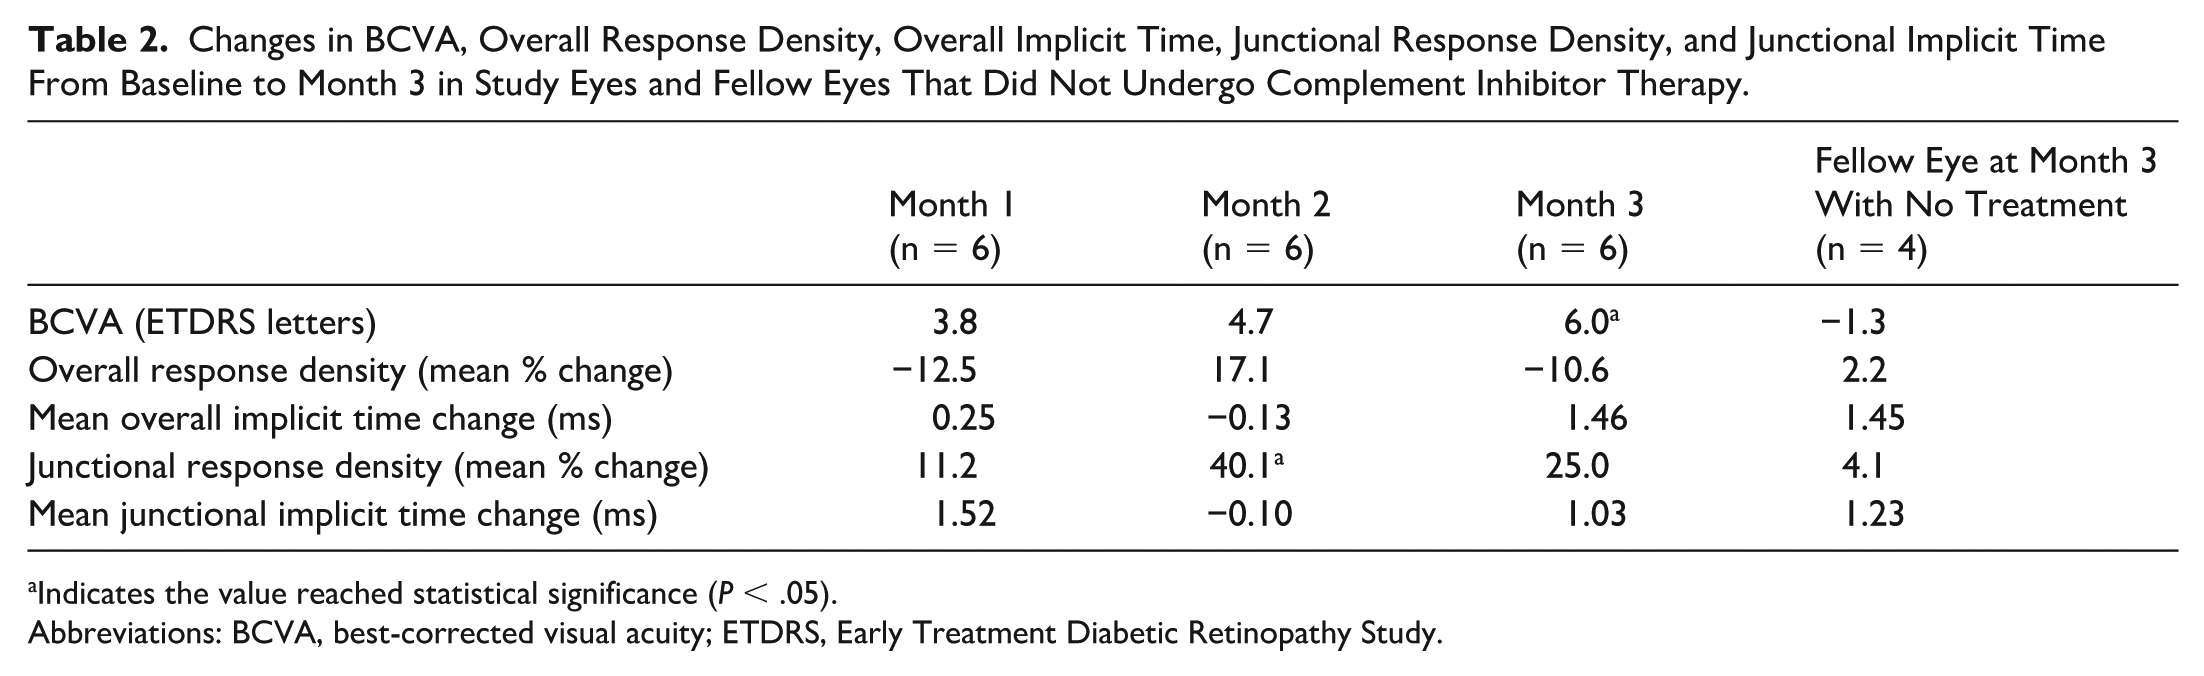
Indicates the value reached statistical significance (P < .05).
Abbreviations: BCVA, best-corrected visual acuity; ETDRS, Early Treatment Diabetic Retinopathy Study.
The mean change in overall P1 implicit time remained stable at months 1 and 2 visits but exhibited an increase of 1.46 ms at month 3, which was not statistically significant. Of the 4 fellow eyes that did not undergo complement inhibitor therapy, BCVA remained relatively stable, with a mean change of −1.3 letters at month 3. Additionally, in these untreated eyes, overall N1-P1 response density and junctional N1-P1 response density also remained unchanged at month 3, with mean percent changes in overall N1-P1 response density and junctional N1-P1 response density of +2.2% and +4.1%, respectively.
mfERG findings for the study eye of patient 1 are summarized in Figure 4. Examination of individual traces of mfERG revealed focal regions of improved responses at month 1, particularly in rings 4 and 5 (Figure 4A). The improvement in mfERG responses persisted at month 2, with sustained enhancements in rings 4 and 5, alongside a mixture of changes noted in the inferonasal region. By month 3, a broad pattern of regressions occurred, notably affecting rings 3 through 5 superiorly and inferiorly. Waveforms within the trace arrays of all visits displayed minimal noise. Figure 4B illustrates individual responses as 3-dimensional topographies. Diffuse hyperautofluorescence surrounded the GA lesion of this patient, and many of the improvements at month 2 were within regions adjacent to the lesion.
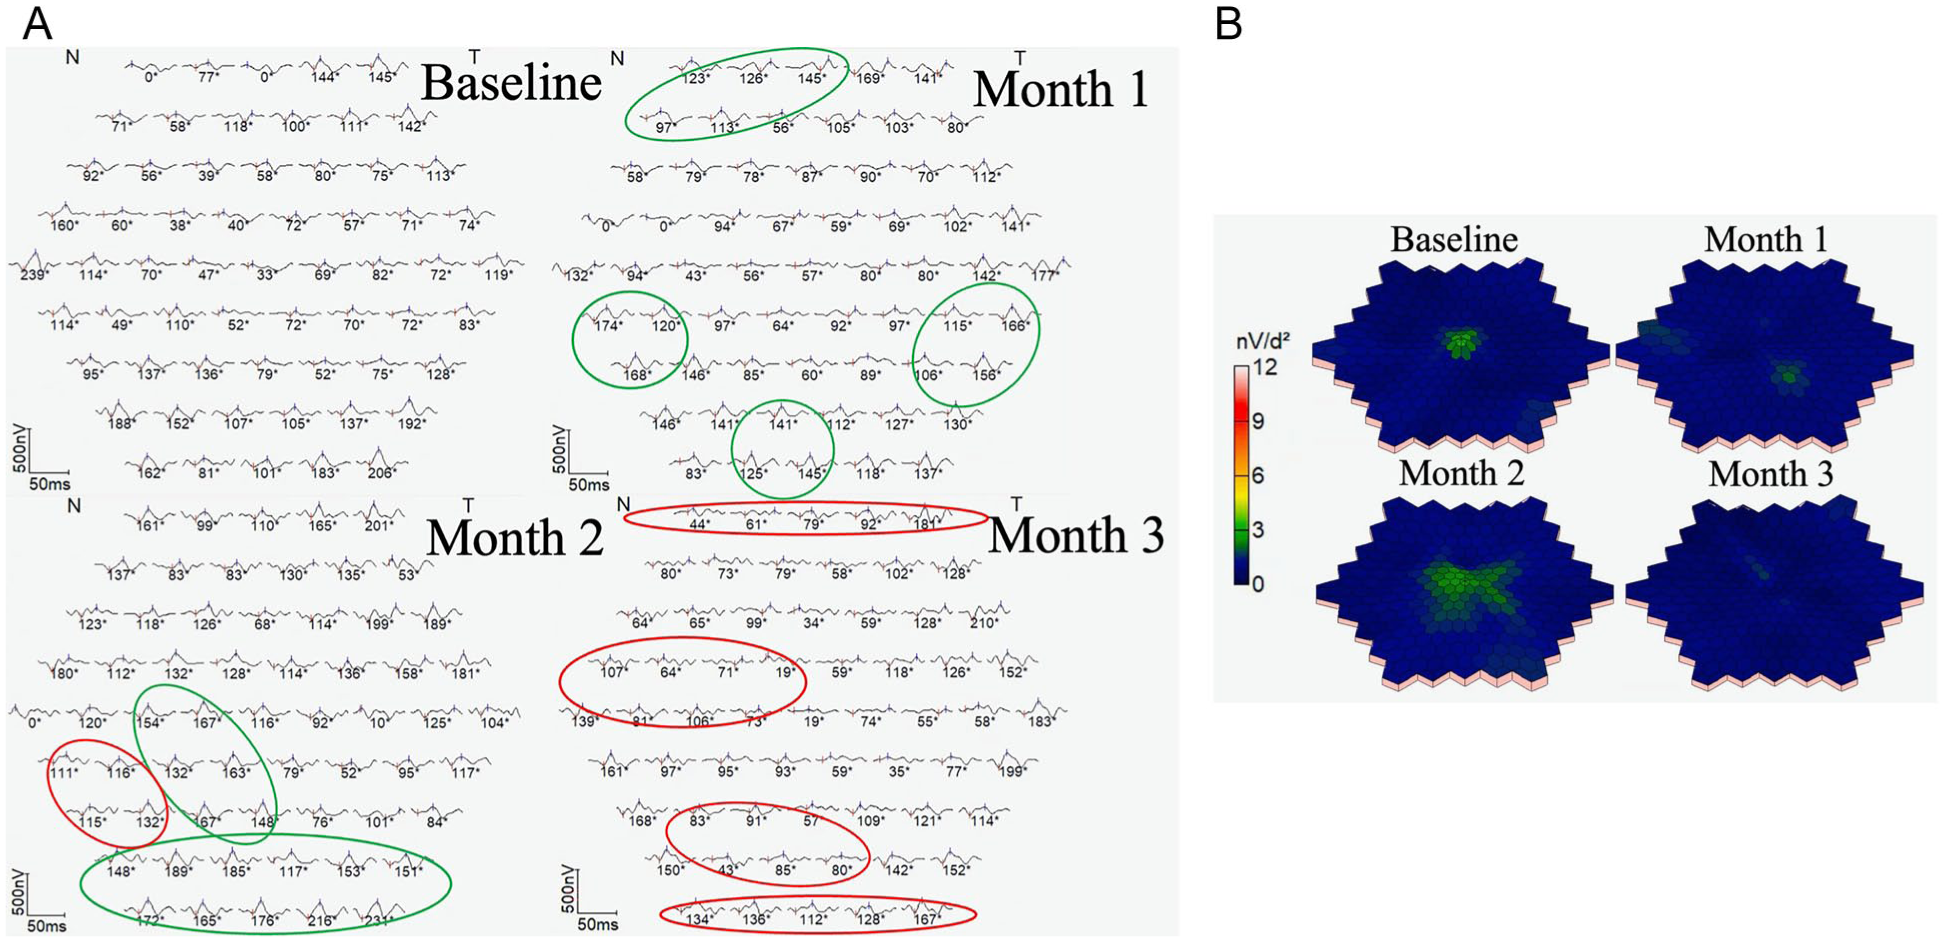
Testing results of patient 1, including (A) multifocal electroretinography (mfERG) trace arrays at each visit and (B) mfERG 3-dimension topographical distributions at each visit. In trace arrays, green circles indicate regions of increased N1-P1 response density, and red circles indicate regions of decreased N1-P1 response density.
The quantitative outcome measures of patient 1 are summarized in Table 3. Month-2 BCVA did not change greatly, but there was a month-3 increase of +4 letters compared with baseline. Both overall N1-P1 response density and junctional N1-P1 response density demonstrated steady increases, peaking at +2186 nV/deg2 and +21.7 nV/deg2, respectively, over baseline at month 2. However, both mfERG measures regressed below baseline 2 at month 3. Overall P1 implicit time and junctional P1 implicit time also displayed consistent improvement with time, decreasing by 1.6 ms and 1.9 ms, respectively, from baseline to month 3.
BCVA, Overall Response Density, Overall Implicit Time, Junctional Response Density, and Junctional Implicit Time From Baseline to Month 3 in the Study Eye of Patient 1.
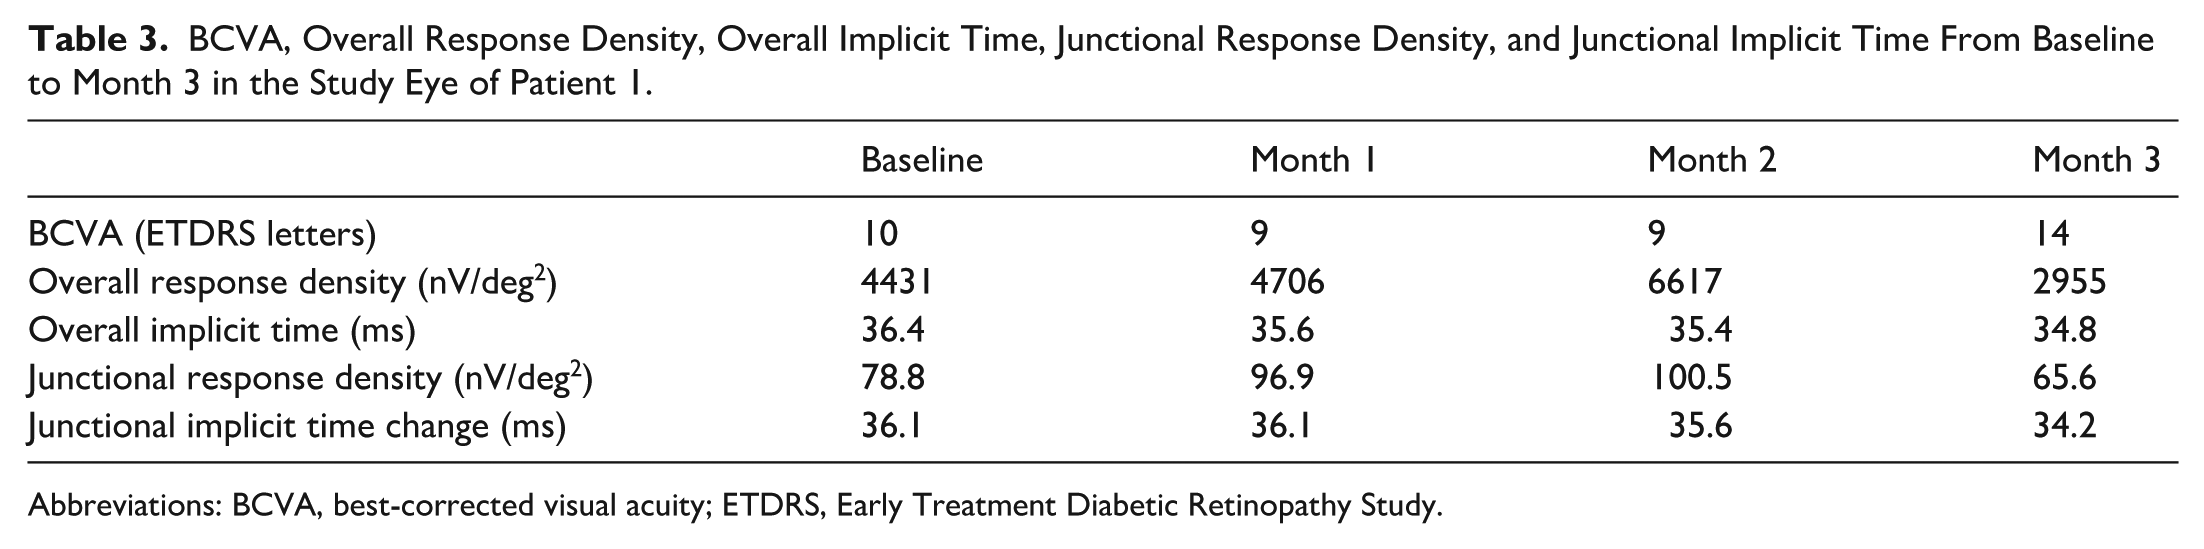
Abbreviations: BCVA, best-corrected visual acuity; ETDRS, Early Treatment Diabetic Retinopathy Study.
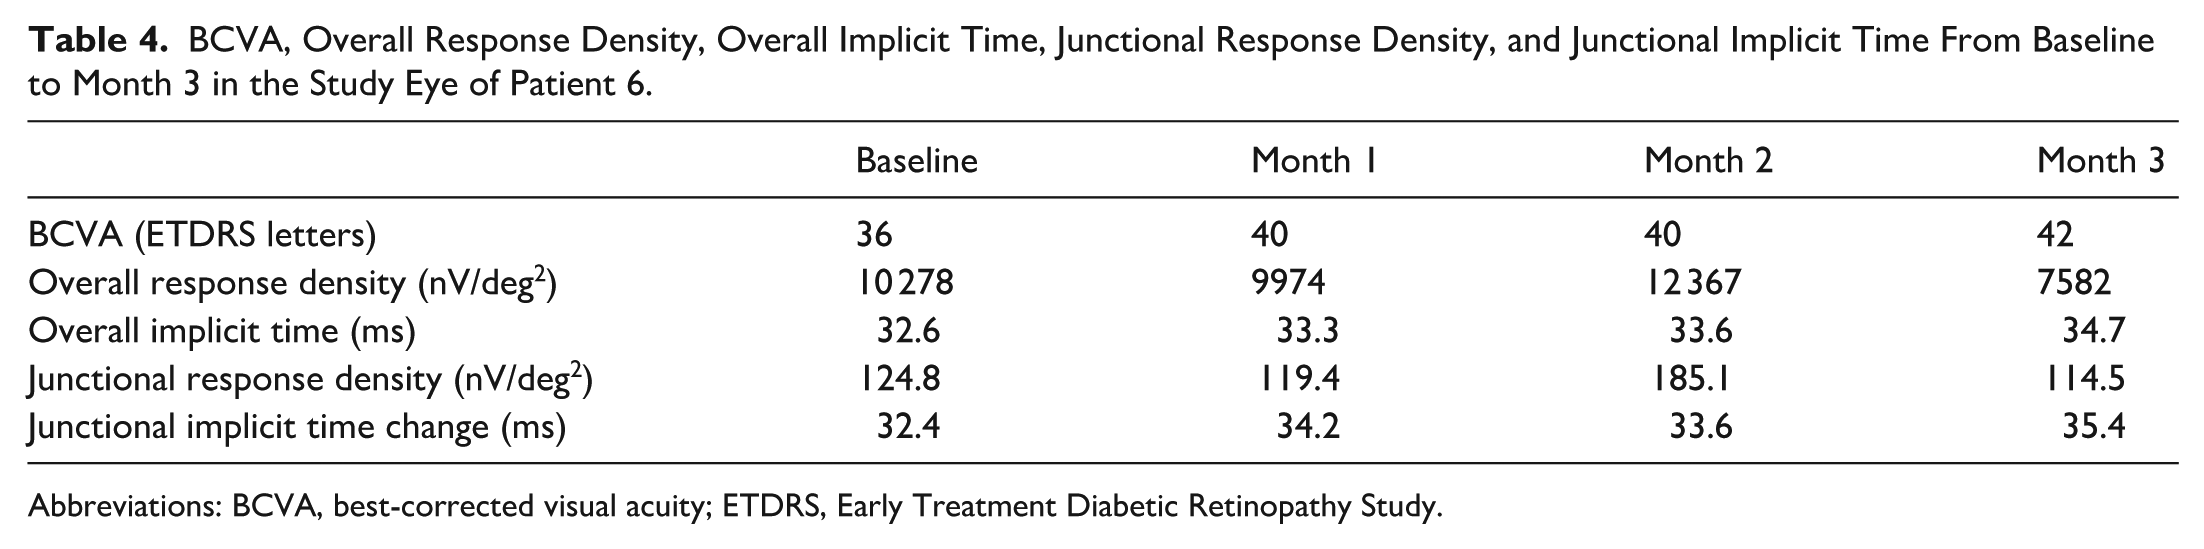
mfERG findings from the study eye in patient 6 are summarized in Figure 5. Month 1 results revealed a mixture of improvements and regressions, predominantly in the periphery, in accordance with rings 4 and 5 of the trace array (Figure 5A). At month 2, improved responses occurred in rings 3 to 5, encompassing the peripheral, perifoveal, and partially parafoveal regions. Similar to data from patient 1, widespread regressions occurred at month 3, with nearly every individual hexagon displaying a response density below baseline. Minimal noise was observed across waveforms of all visits. The 3-dimensional topographic distributions of this patient complemented the trace array findings (Figure 5B). Responses on the topographical map regressed slightly at month 1, before large areas of improvement occurred at month 2, particularly in inferior and temporal regions. The GA lesion observed in this patient was centered partially in the fovea and the parafovea, and improved responses at month 2 were concentrated adjacent to this lesion. This patient did not present with hyperautofluorescence around the GA lesion, and improvements occurred in regions of healthy-appearing retina.
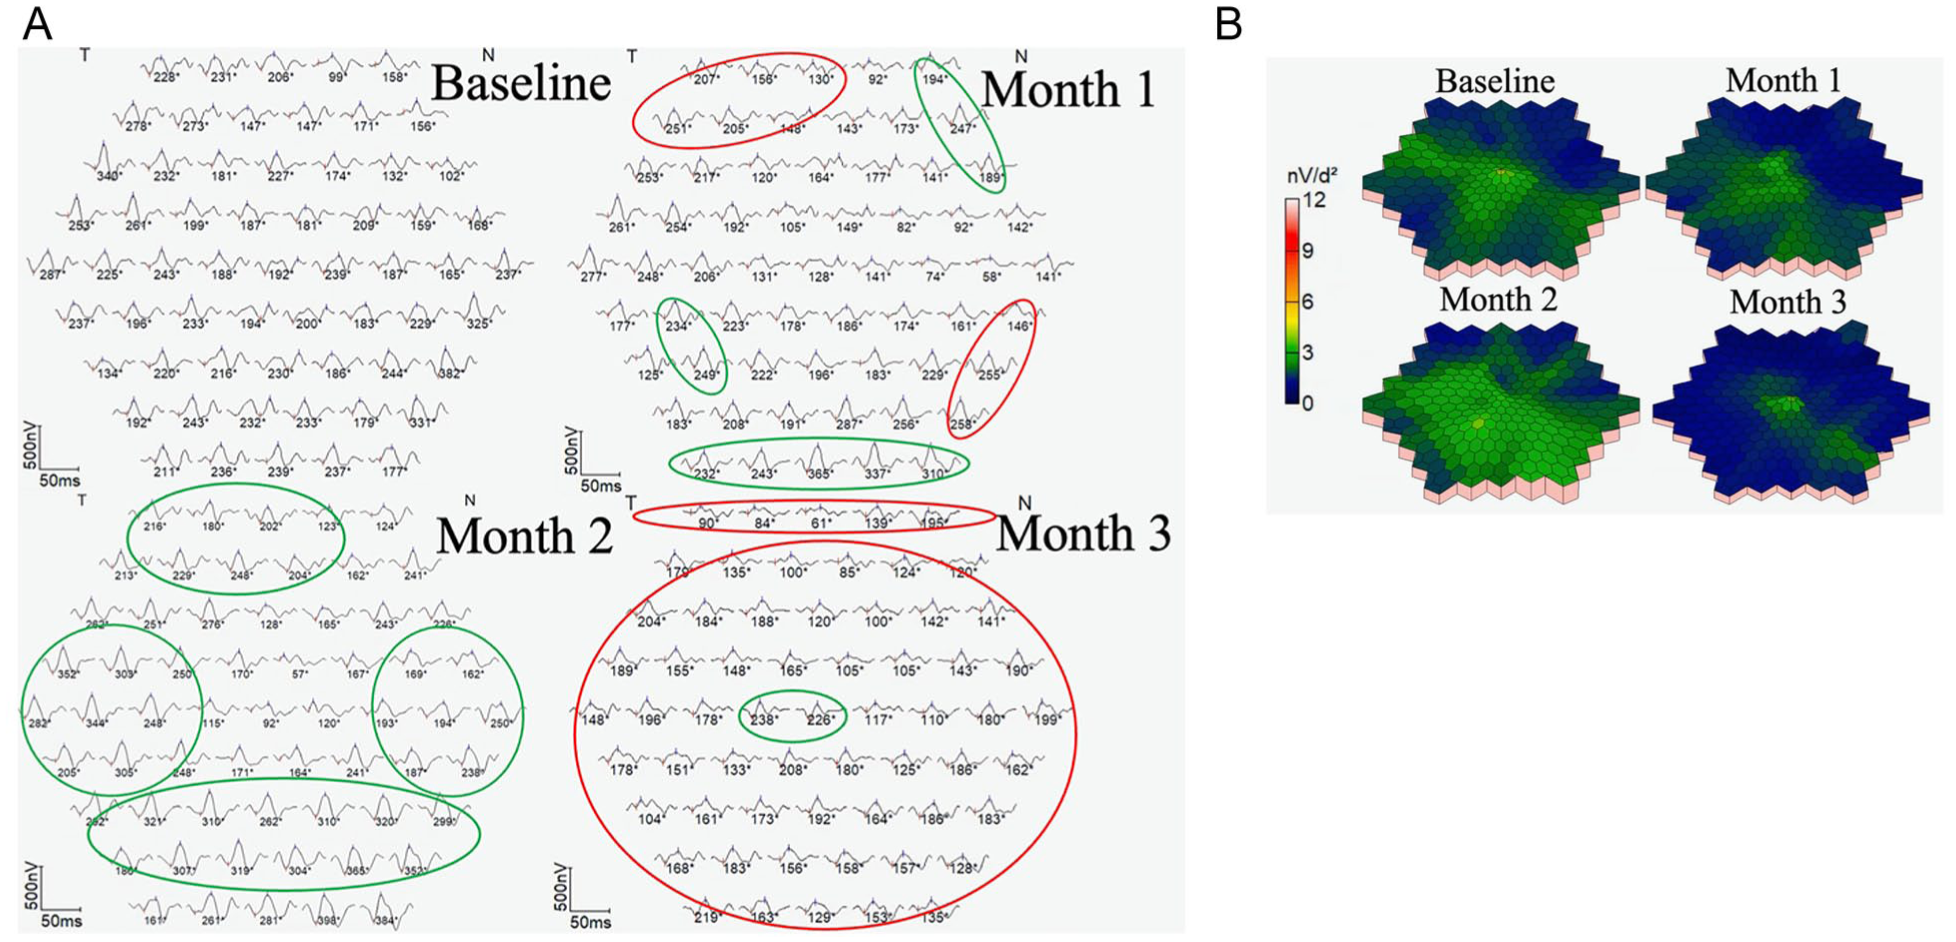
Testing results of patient 6, including (A) multifocal electroretinography (mfERG) trace arrays at each visit and (B) mfERG 3-dimensional topographic distributions at each visit. In trace arrays, green circles indicate regions of increased N1-P1 response density, and red circles indicate regions of decreased N1-P1 response density.
The quantitative outcome measures of patient 6 are summarized in Table 4. BCVA demonstrated progressive improvement, concluding 6 letters above baseline at month 3. Similar to outcomes in patient 1, the most notable increase in overall N1-P1 response density was observed at month 2, surpassing baseline by 2089 nV/deg2 yet declining below baseline at month 3. This was also seen in the change in junctional N1-P1 response density, which increased by 60.3 nV/deg2 from baseline to month 2. Despite improved BCVA, overall N1-P1 response density, and junctional N1-P1 response density over the study duration, overall P1 implicit time was monotonically prolonged at each visit, increasing by 2.1 ms from baseline to month 3.
BCVA, Overall Response Density, Overall Implicit Time, Junctional Response Density, and Junctional Implicit Time From Baseline to Month 3 in the Study Eye of Patient 6.
Abbreviations: BCVA, best-corrected visual acuity; ETDRS, Early Treatment Diabetic Retinopathy Study.
Conclusions
In this case series, the patients were treated with a single dose of AVD-104 for GA. A progressive improvement in mean BCVA change was observed throughout the study period, with a statistically significant increase noted at month 3. While the change in overall N1-P1 response density was not significant at month 2 due to the relatively small percentage of the retinal area with increased mfERG response compared with the other retinal area, the 40.10% increase of the mean mfERG response in junctional zones was statistically significant at month 2, with 5 of 6 study eyes achieving a gain of more than 20% in mean junctional N1-P1 response density.
These promising results in outcome measures stand in contrast to the clinical trial results of pegcetacoplan and avacincaptad, which did not show an improvement in functional tests. Many of the standard measures of visual function used in these clinical trials, including BCVA and patient-reported outcomes, are insensitive to GA growth beyond the foveal center. Additionally, 1 post hoc study of the OAKS clinical trial of pegcetacoplan argued that the standard aggregate endpoints of microperimetry, another function test, may not have been sensitive enough to demonstrate a treatment effect, since the junctional zone with the highest risk for change is much smaller. 18 Therefore, custom software was developed to only analyze microperimetry points within a 250-µm junctional zone beyond the GA border and found that pegcetacoplan-treated eyes experienced a decreased loss of mean retinal sensitivity compared with sham in the junctional zone.
These results, combined with this study, support the effect of treatment on decreasing the loss of photoreceptors and potentially restoring them, specifically in the junctional zone in GA. Pharmacologically, this difference could also be attributed to AVD-104’s dual mechanism addressing both cellular inflammation via macrophage repolarization and the humoral component through complement factor H modulation, as opposed to solely targeting the complement pathway. However, more long-term data with larger samples are needed to validate this effect.
While the functional improvement in junctional zones may help overall retinal function, it may not necessarily result in improved VA in the fovea. The function of a small group of cone cells at the fovea is associated with ETDRS VA, which only reflects the function of a small retinal zone.21,22 The improved mfERG responses in junctional zones suggest a broader improvement of photoreceptor and bipolar cells in this area. The apparent discordance between the timing of VA gains and mfERG responses is likely due to the different anatomic locations of the response. A significant portion of the improved mfERG responses occurred in the junctional zone, most prominently at 2 months after treatment. The improvement in VA is dependent on a much smaller number of photoreceptors in the fovea or preferred retinal locus.
It should be noted that both mean overall N1-P1 response density and junctional N1-P1 response density regressed from month 2 to month 3. This potentially indicates that the biological effect decreased beyond the 2 months due to the drug’s half-life and that patients may require additional treatments in real-world clinical settings to sustain the therapeutic benefits observed in the first 2 months of this study. Additionally, all patients in the trial, including those who underwent mfERG testing, tolerated the single intravitreal injection, with no serious drug-related adverse events, demonstrating a clean safety profile of AVD-104 treatment in this group. mfERG testing provided an objective evaluation of retinal physiologic function in cases of dry AMD with GA.
As described in the methodology, 2 independent analysts reviewed the mfERG trace arrays for each visit for each eye and rated noise on a scale of “1-3,” and any trace array rated as a “3” was removed from the study. However, across all patients and visits, the mfERG waveforms demonstrated low noise overall, and no trace array for any eye was deemed necessary to remove due to noise by either analyst. Additionally, variability was assessed by percent change in overall N1-P1 response density from screening to baseline visits, and only 1 fellow eye had a change of >20% in 8 total study and fellow eyes. While not traditionally used as a clinical endpoint, these results support mfERG as an independent clinical measurement to supplement BCVA, as shown by other studies. 23
The regions with hyperautofluorescence on the FAF, a hallmark of GA signifying pathologic accumulation of lipofuscin and other damage-associated molecular pattern fluorophores, are a biomarker for retinal pigment epithelium autophagic dysfunction, proinflammatory signaling, and microglial dysfunction or dysregulation.24,25 This proinflammatory, microglial/macrophage-activated, and cytokine-producing environment is proapoptotic and stressful to photoreceptors, 8 explaining why previous studies have shown that hyper autofluorescence, and specific patterns of hyperautofluorescence, are prognostic of rapid GA lesion growth and that a contributing factor to GA pathogenesis is accumulation of damage-associated molecular pattern fluorophores.26–28
Our study demonstrates notable improvements in retinal physiologic function in the regions surrounding the GA lesion, which were measured as the mean junctional N1-P1 response density. This clinically validates the ability of AVD-104 to reprogram hyperactivated microglia/macrophages to restore homeostatic, anti-inflammatory, neuroprotective microglial function, which corrects the autophagic dysfunction that prevented clearance of these damage-associated molecular pattern fluorophores. A future study comparing the treatment effect of AVD-104 by mfERG on the eyes, with or without hyperautofluorescence, should be considered in future trials with larger cohorts to further validate mfERG as a functional biomarker of AVD-104 therapeutic activity.
Although this study provides novel data on mfERG results of eyes with GA following treatment, it has limitations. Because only 1 injection of AVD-104 was administered to patients, the findings reflect short-term effects on BCVA and N1-P1 response densities.
Generalizability and statistical power are also limited by having a single-site cohort of 6 eyes. Nevertheless, this study was intended as a preliminary evaluation of mfERG as a functional endpoint, and a larger, phase III trial is ongoing to validate these findings. Additionally, the secondary analysis of junctional hexagons in trace arrays was performed post hoc, despite analysts being masked, and needs further evaluation. This limitation will be addressed in the larger clinical trial, where junctional hexagons in the custom Diagnosys software will be predetermined at the baseline visit to minimize bias and maximize the statistical evaluations of the results. Finally, patients with poor ability to fix at the center of the stimulating pattern (eg, patients with low vision in both eyes) may increase the variation of mfERG results.
While there are many limitations of this current study, the use of mfERG in early-phase studies of potentially neuroprotective therapeutics such as AVD-104 will prove invaluable as a functional, objective biomarker of photoreceptor status, and if validated, can potentially serve as a surrogate for VA in diseases such as dry AMD GA, where localization of GA and functional photoreceptors are often not correlated.
Footnotes
Ethical Approval
Institutional review board and ethics committee approval were obtained for this study.
Statement of Informed Consent
Informed consent was obtained. A Multiple Dose Study of AVD-104 for Geographic Atrophy (GA) Secondary to Age-Related Macular Degeneration (AMD) (SIGLEC) is registered on ClinicalTrials.gov (NCT05839041).
Declaration of Conflicting Interests
The authors declared the following potential conflicts of interest with respect to the research, authorship, and/or publication of this article: Dr. Callanan and Dr. Tolentino are employees of Aviceda Therapeutics. Dr. Maturi was an investigator of part 1 of the SIGLEC phase 2/3 clinical trial. Dr. Maturi has also served as a consultant to Allergan, Allgenesis, Aviceda, Dutch Ophthalmic, Eli Lilly, Jaeb Center for Health Research, Neurotech, Novartis, Regenxbio, and Unity; he has also received research support from 4DMT, Allegra, Allergan, Aviceda, Boehringer Ingelheim, Clearside, Dougenix, Gemini, Genentech, Graybug, Gyroscope, NGM biopharmaceuticals, Ocular Therapeutix, Ocugen, Ocugenix, Opthea, RegenXbio, Ribomic, Samsung Bioepis, Santen, Senju, Thrombogenics, and Unity. None of the other authors declared potential conflicts of interest with respect to the research, authorship, and/or publication of the article.
Funding
The authors disclosed receipt of the following financial support for the research, authorship, and/or publication of this article: Aviceda Therapeutics provided financial support for the clinical trial at Retina Partners Midwest.
